Embed Size (px)
Citation preview
Ec
Aa
b
s
a
ARRAA
KFFVMCN
1
adtaa
Mpm
cv
P
h0
Toxicology 318 (2014) 40–50
Contents lists available at ScienceDirect
Toxicology
j ourna l ho me pa ge: www.elsev ier .com/ locate / tox ico l
ffect of water fluoridation on the development of medial vascularalcification in uremic rats
na Martín-Pardillosa,1, Cecilia Sosaa, Ángel Millánb, Víctor Sorribasa,∗
Department of Toxicology, University of Zaragoza, Veterinary Faculty, Calle Miguel Servet 177, E50013 Zaragoza, SpainInstituto de Ciencia de Materiales de Aragón, Consejo Superior de Investigaciones Científicas-University of Zaragoza, Calle Pedro Cerbuna,/n. E50009 Zaragoza, Spain
r t i c l e i n f o
rticle history:eceived 28 October 2013eceived in revised form 8 January 2014ccepted 26 January 2014vailable online 18 February 2014
eywords:luorideluoridationascular calcificationönckeberg’s sclerosis
hronic kidney diseaseephrotoxicity
a b s t r a c t
Public water fluoridation is a common policy for improving dental health. Fluoride replaces the hydroxylsof hydroxyapatite, thereby improving the strength of tooth enamel, but this process can also occur in otheractive calcifications. This paper studies the effects of water fluoridation during the course of vascularcalcification in renal disease.
The effect of fluoride was studied in vitro and in vivo. Rat aortic smooth muscle cells were calcifiedwith 2 mM Pi for 5 days. Fluoride concentrations of 5–10 �M – similar to those found in people whodrink fluoridated water – partially prevented calcification, death, and osteogene expression in vitro. Theanticalcifying mechanism was independent of cell activity, matrix Gla protein, and fetuin A expressions,and it exhibited an IC50 of 8.7 �M fluoride. In vivo, however, fluoridation of drinking water at 1.5 mg/L(concentration recommended by the WHO) and 15 mg/L dramatically increased the incipient aortic calci-fication observed in rats with experimental chronic kidney disease (CKD, 5/6-nephrectomy), fed a Pi-richfodder (1.2% Pi). Fluoride further declined the remaining renal function of the CKD animals, an effect thatmost likely overwhelmed the positive effect of fluoride on calcification in vitro. Ultrastructural analysis
revealed that fluoride did not modify the Ca/P atomic ratio, but it was incorporated into the lattice of invivo deposits. Fluoride also converted the crystallization pattern from plate to rode-like structures.In conclusion, while fluoride prevents calcification in vitro, the WHO’s recommended concentrationsin drinking water become nephrotoxic to CKD rats, thereby aggravating renal disease and making mediavascular calcification significant.
. Introduction
Fluoride is a common component of bone and teeth, and whendministered properly it increases tooth mineralization, promotesental enamel remineralization, effectively prevents dental cavi-
ies, and reduces experimental osteoporosis by incorporating intopatite crystals, which become more resistant to osteoclast attack,mong other effects (Palmer and Gilbert, 2012).Abbreviations: CKD, chronic kidney disease; CPD, calcium phosphate deposition;VC, medial vascular calcification; VSMC, vascular smooth muscle cells; PFA, phos-
honoformic acid; SEM, scanning electron microscopy; TEM, transmission electronicroscopy; EDS, energy dispersive spectroscopy.∗ Corresponding author. Tel.: +34 976761631.
E-mail addresses: anamp [email protected] (A. Martín-Pardillos),[email protected] (C. Sosa), [email protected] (Á. Millán), [email protected],[email protected] (V. Sorribas).1 Present address: Leiden University Medical Center, Building 2, Room T-03-011,
ostzone S-3, P.O. Box 9600, 2300 RC Leiden, The Netherlands.
ttp://dx.doi.org/10.1016/j.tox.2014.01.012300-483X/© 2014 Elsevier Ireland Ltd. All rights reserved.
© 2014 Elsevier Ireland Ltd. All rights reserved.
In order to improve dental health in the population, fluoride isincluded in tooth pastes and mouthwash solutions or is added topublic water supplies at 0.5–1.5 mg/L (WHO, 2008), which has beena common practice in some countries since 1945.
More than 90% of ingested fluoride is absorbed through theintestine and quickly distributed between plasma/soft tissues andcalcified structures, where it can be sequestered for years (Buzalafand Whitford, 2011). When water is fluoridated at the WHO-recommended levels, the range of plasma fluoride concentrationis usually 1–6 �M (Husdan et al., 1976; Singer and Ophaug, 1979).Fluoride is not under homeostatic control, and it is cleared fromthe plasma within few hours by the complementary action of cal-cified tissues and the kidneys. In adults, half of ingested fluoride istaken up in mineralized tissues, where about 10% of it can be remo-bilized rapidly because it is bound to the surface (Chachra et al.,
2008). Besides the enamel, fluoride is mainly incorporated intobone that is formed or remodeled during the period of exposure,and therefore incorporation is higher in young people, or whenexposure increases, for example when renal excretion is impaired
/ Toxic
ac
ctec(daWfl
estrvwfirtvs2cis(bn2rwtttcoa
trtodMcctsmecPcpatm
2
2
m
A. Martín-Pardillos et al.
s in chronic kidney disease (CKD), which increases the plasmaoncentration and time of exposure.
In healthy people, with few exceptions, there are similar con-entrations of fluoride in the plasma and soft tissues, such as inhe aorta, where fluoride is also accumulated with age and canxceed 100 �g/g tissue (Waldbott, 1966). Most parts of the worldontain local areas with high concentrations of fluoride in the water>1.5 mg/L), which can contribute to excessive exposure to fluoride,epending on water intake and exposure from other sources, suchs a range of foods and tea (Meenakshi and Maheshwari, 2006).hen total fluoride is above or approximately 6 mg/day, signs of
uorosis can appear.Despite the accumulation of fluoride in the main arteries, the
ffects on the vascular wall are not clear. A classical epidemiologicaltudy revealed that people living in areas with a water supply con-aining a low concentration of fluoride (0.15–0.3 ppm) exhibitededuced bone density and higher rates of osteoporosis, collapsedertebrae, and aortic calcification than people who consumedater containing 4–5.8 ppm fluoride (Bernstein et al., 1966). Thesendings were experimentally corroborated in vitro and in vivo inats drinking water at 50 ppm fluoride, that is, fluoride neither ini-iated aortic calcification nor increased calcification induced withitamin D3 (Zipkin et al., 1970). Nevertheless, other studies havehown contradictory results. For example, one study revealed that6.4% of adult patients with fluorosis caused by drinking waterontaining 3.5–12.5 ppm fluoride had Mönckeberg’s calcificationn the iliac and femoral arteries (Tuncel, 1984). Mönckeberg’sclerosis is a complex process of calcium phosphate depositionCPD) in the elastic media of large arteries, and it progresses toone-like mineralization during CKD (especially when accompa-ied by hyperphosphatemia), diabetes, and aging (Shanahan et al.,011; Shroff et al., 2013). A more detailed study revealed thatabbits chronically poisoned with fluoride at 10 mg/kg of bodyeight exhibited degeneration of the smooth muscle fibers of the
unica media of the aorta and had an active process of calcifica-ion (Susheela and Kharb, 1990). More recently, it has been shownhat rabbits with chronic fluorosis due to receiving drinking waterontaining 50 mg/L NaF for six months had increased expressionf genes related to inflammation and leukocyte adhesion in theirrteries (Ma et al., 2012).
The aforementioned divergent findings can be explained byhe use of different procedures, including very high doses of fluo-ide, the duration of treatment, and the animal species, in additiono either an experimental or epidemiological setup. In this work,ur objective was to clarify the effect of fluoride, if any, on theevelopment and course of medial vascular calcification (MVC,önckeberg’s sclerosis) in uremic rats, using low, recommended
oncentrations in drinking water. Our rationale was that de novoalcified tissue in aorta should incorporate fluoride when exposureo this halogen is concomitant with the course of calcification, andubsequently the rate of calcium phosphate crystallization and/orineralization should be altered, similar to the effects in tooth
namel or bone. We used two established experimental models ofalcification, rat aortic smooth muscle cells incubated with 2 mMi, and rats with 5/6-nephrectomy and fed a Pi-enriched diet, inombination with low concentrations of fluoride (similar to that ofublic water fluoridation). Our findings have shown that the resultsre inverse depending on the experimental model, which highlightshe need to carry out in vivo approaches when studying complex
ultifactorial processes, such as Mönckeberg’s sclerosis.
. Materials and methods
.1. Cell culture
Vascular smooth muscle cells were obtained from the thoracic aortas of 2-onth-old male Wistar rats by mechanical and collagenase digestion, as previously
ology 318 (2014) 40–50 41
described (Wang et al., 2007). The cells were maintained in a Minimal EssentialMedium (MEM; Life Technologies, Paisley, UK). Confluent cells were trypsinized,counted, and passaged up to 30 divisions, and the cells used were from the 20th tothe 30th divisions. For all treatments, the cells were made quiescent by reducingthe concentration of fetal calf serum to 0.2% overnight.
2.2. Cytotoxicity
Cell death was evaluated by colorimetric quantitation of the activity of thecytosolic lactate dehydrogenase (LDH) released into the cell culture using a Cytotox-icity Detection kit (Roche, Mannheim, Germany). Experimental enzymatic activitieswere normalized to the maximal activity of the cells (100% cell death), which wasobtained after lysing the cells with 0.5% Triton-X100 in MEM.
2.3. Calcification in vitro
VSMC were grown in 24-well plates, and after they were confluent, they weremade quiescent as explained above and calcified by incubating them in MEM using0.2% FCS with a final concentration of 2 mM Pi from a stock of KH2PO4 and K2HPO4,pH 7.4. For the quantitative determination of calcium content, VSMC cultures orrat aortas were incubated overnight in 0.6N HCl, and the dissolved calcium wasquantified using a colorimetric QuantiChrom Calcium Assay Kit (BioAssay Systems,Hayward, CA, USA). Parallel samples were diluted six times for protein determina-tion using a BCA Protein Assay Reagent (bicinchoninic acid; Pierce-Thermo Scientific,Rockford, IL, USA). For the calcification of dead VSMC, cells were previously dead-fixed with 100% methanol for 5 min.
2.4. Dose–response of F, PPi and PFA
To determine the mean inhibitory concentrations (IC50) of F, PPi ± F, and PFA ± F,calcification was performed as explained above, in the presence of different concen-trations of the inhibitors, as shown in the text and figures. After transformation ofthe inhibitor concentrations into logarithms, the Y values were fitted to an inhibitorydose–response equation by non-linear regression using GraphPad Prism 5.0 for Mac(GraphPad Software Inc., La Jolla, CA).
2.5. Calcification in vivo
For the studies of calcification in vivo, we used 5/6-nephrectomy and sham-operations. Animal care was given according to European legislation, and theprocedures were approved by the Ethical Committee of the University of Zaragoza(code PI07/09). In short, two-month-old male Wistar rats (Janvier SAS, Berthevin,France) were either 5/6-nephrectomized in two steps or twice sham-operated usingthe standard procedure. In the first step, the left kidney was exposed, and the twopoles corresponding to 2/3 of the kidneys were excised with suture thread. Oneweek later, the right kidney was completely excised, and after one week of recovery,the animals were divided into the experimental groups and treated for 4.5 monthsas indicated in the Results. Both the sham-operated and 5/6-nephrectomized ani-mals were fed a control diet (0.6% Pi content) or a Pi enriched fodder (1.2% Pi).Food was purchased from Provimi Kliba SA (Penthalaz, Switzerland). Some of the5/6-nephrectomized animals eating 1.2% Pi fodder were further divided into threegroups of rats treated with drinking water at 0, 1.5, or 15 mg fluoride (as sodium flu-oride) per liter. This experimental setup was maintained for 4.5 months, and thenthe animals were anesthetized by an intraperitoneal administration of pentobarbitaland processed for blood sample collection and extraction of the heart and completeaorta.
For microscopic visualization of the calcium and phosphate deposits in theaortas, we used both Alizarin red and von Kossa staining of the tissue slides, asreported (Verberckmoes et al., 2007). For quantitative determination of the calciumcontent, the rat aortas were incubated overnight in 0.6N HCl, and the dissolvedcalcium was colorimetrically quantified as in the in vitro assays.
2.6. Gene expression
Changes in RNA expression were evaluated using real-time PCR as described(Martın-Pardillos et al., 2013). Total RNA was purified from cultured VSMC using aGenElute Mammalian Total RNA Miniprep Kit (Sigma-Aldrich), and it was DNase Itreated, retrotranscribed with a Transcriptor First Strand cDNA Synthesis Kit, andamplified in a LightCycler 1.5 using a LightCycler FastStart Master SYBR Green I kit(all from Roche). Gene expression data were normalized to an endogenous refer-ence (acidic ribosomal phosphoprotein RNA) and to a calibrator, according to themanufacturer’s instructions. Some primers used in this study have been previouslyreported (Villa-Bellosta et al., 2009), and additional primers are listed in Table 1.
To determine the changes in protein abundance, Western-blots were performedas described, including the use of a Trans-Blot Turbo Transfer System for PVDF
membranes and detection using a Molecular Imager VersaDoc MP 4000 System(both from Bio-Rad, Hercules, CA). In brief, VSMC were lyzed after treatment ina radioimmunoprecipitation assay (RIPA) buffer (50 mM Tris pH 7.5, 150 mM NaCl,0.1% SDS, 0.5% deoxycholate, 1% Triton X-100, and protease inhibitor cocktail, Sigma-Aldrich), and the total protein concentration was determined using a BCA Protein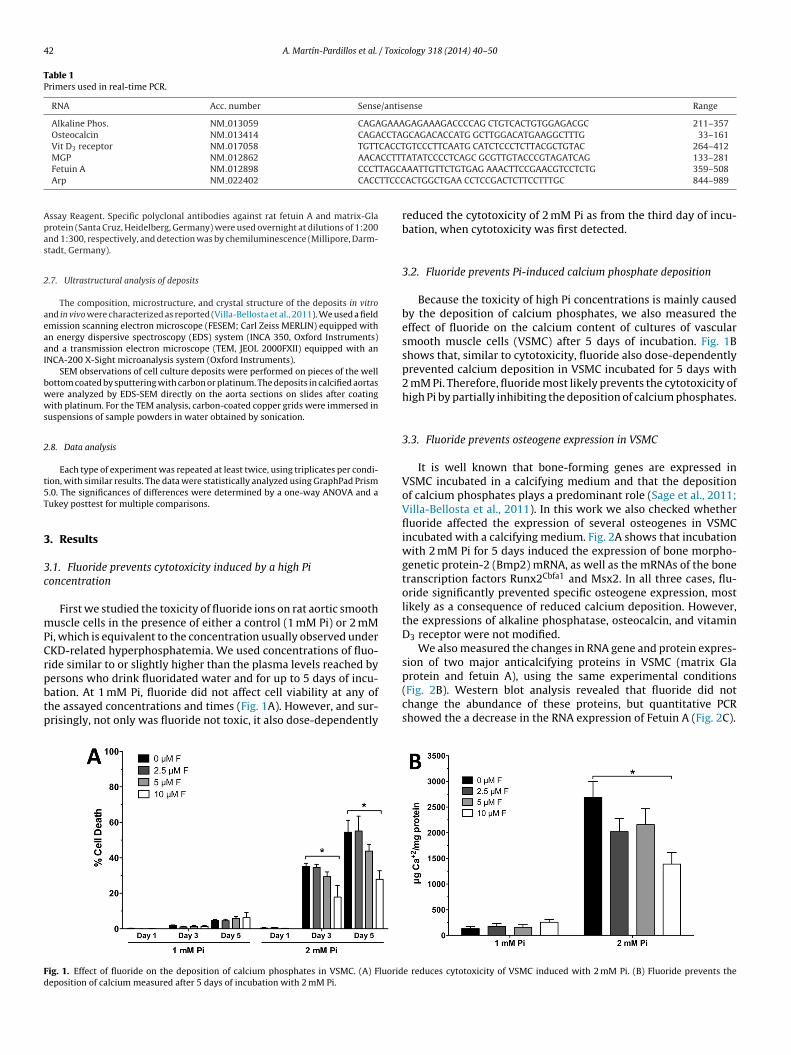
42 A. Martín-Pardillos et al. / Toxicology 318 (2014) 40–50
Table 1Primers used in real-time PCR.
RNA Acc. number Sense/antisense Range
Alkaline Phos. NM 013059 CAGAGAAAGAGAAAGACCCCAG CTGTCACTGTGGAGACGC 211–357Osteocalcin NM 013414 CAGACCTAGCAGACACCATG GCTTGGACATGAAGGCTTTG 33–161Vit D3 receptor NM 017058 TGTTCACCTGTCCCTTCAATG CATCTCCCTCTTACGCTGTAC 264–412
CCTTTTAGCATTCCC
Apas
2
aeaaI
bwws
2
t5T
3
3c
mPCrpbtp
Fd
MGP NM 012862 AACAFetuin A NM 012898 CCCTArp NM 022402 CACC
ssay Reagent. Specific polyclonal antibodies against rat fetuin A and matrix-Glarotein (Santa Cruz, Heidelberg, Germany) were used overnight at dilutions of 1:200nd 1:300, respectively, and detection was by chemiluminescence (Millipore, Darm-tadt, Germany).
.7. Ultrastructural analysis of deposits
The composition, microstructure, and crystal structure of the deposits in vitrond in vivo were characterized as reported (Villa-Bellosta et al., 2011). We used a fieldmission scanning electron microscope (FESEM; Carl Zeiss MERLIN) equipped withn energy dispersive spectroscopy (EDS) system (INCA 350, Oxford Instruments)nd a transmission electron microscope (TEM, JEOL 2000FXII) equipped with anNCA-200 X-Sight microanalysis system (Oxford Instruments).
SEM observations of cell culture deposits were performed on pieces of the wellottom coated by sputtering with carbon or platinum. The deposits in calcified aortasere analyzed by EDS-SEM directly on the aorta sections on slides after coatingith platinum. For the TEM analysis, carbon-coated copper grids were immersed in
uspensions of sample powders in water obtained by sonication.
.8. Data analysis
Each type of experiment was repeated at least twice, using triplicates per condi-ion, with similar results. The data were statistically analyzed using GraphPad Prism.0. The significances of differences were determined by a one-way ANOVA and aukey posttest for multiple comparisons.
. Results
.1. Fluoride prevents cytotoxicity induced by a high Pioncentration
First we studied the toxicity of fluoride ions on rat aortic smoothuscle cells in the presence of either a control (1 mM Pi) or 2 mM
i, which is equivalent to the concentration usually observed underKD-related hyperphosphatemia. We used concentrations of fluo-ide similar to or slightly higher than the plasma levels reached by
ersons who drink fluoridated water and for up to 5 days of incu-ation. At 1 mM Pi, fluoride did not affect cell viability at any ofhe assayed concentrations and times (Fig. 1A). However, and sur-risingly, not only was fluoride not toxic, it also dose-dependentlyig. 1. Effect of fluoride on the deposition of calcium phosphates in VSMC. (A) Fluorideposition of calcium measured after 5 days of incubation with 2 mM Pi.
ATATCCCCTCAGC GCGTTGTACCCGTAGATCAG 133–281AATTGTTCTGTGAG AAACTTCCGAACGTCCTCTG 359–508ACTGGCTGAA CCTCCGACTCTTCCTTTGC 844–989
reduced the cytotoxicity of 2 mM Pi as from the third day of incu-bation, when cytotoxicity was first detected.
3.2. Fluoride prevents Pi-induced calcium phosphate deposition
Because the toxicity of high Pi concentrations is mainly causedby the deposition of calcium phosphates, we also measured theeffect of fluoride on the calcium content of cultures of vascularsmooth muscle cells (VSMC) after 5 days of incubation. Fig. 1Bshows that, similar to cytotoxicity, fluoride also dose-dependentlyprevented calcium deposition in VSMC incubated for 5 days with2 mM Pi. Therefore, fluoride most likely prevents the cytotoxicity ofhigh Pi by partially inhibiting the deposition of calcium phosphates.
3.3. Fluoride prevents osteogene expression in VSMC
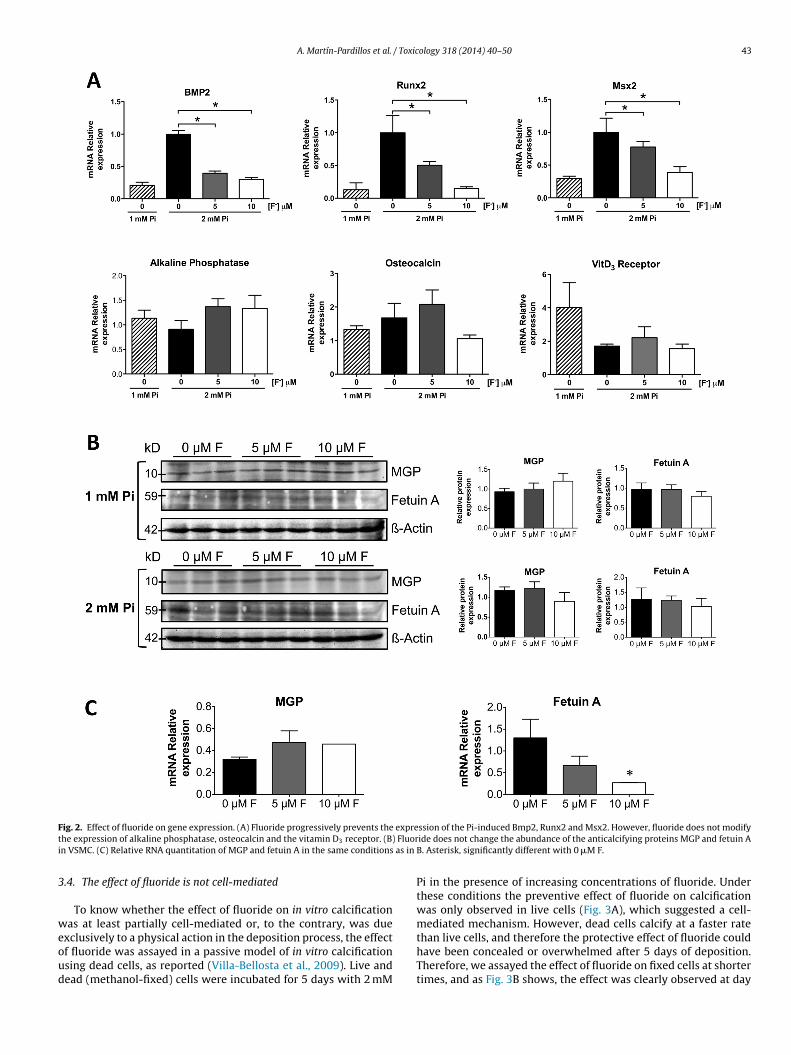
It is well known that bone-forming genes are expressed inVSMC incubated in a calcifying medium and that the depositionof calcium phosphates plays a predominant role (Sage et al., 2011;Villa-Bellosta et al., 2011). In this work we also checked whetherfluoride affected the expression of several osteogenes in VSMCincubated with a calcifying medium. Fig. 2A shows that incubationwith 2 mM Pi for 5 days induced the expression of bone morpho-genetic protein-2 (Bmp2) mRNA, as well as the mRNAs of the bonetranscription factors Runx2Cbfa1 and Msx2. In all three cases, flu-oride significantly prevented specific osteogene expression, mostlikely as a consequence of reduced calcium deposition. However,the expressions of alkaline phosphatase, osteocalcin, and vitaminD3 receptor were not modified.
We also measured the changes in RNA gene and protein expres-sion of two major anticalcifying proteins in VSMC (matrix Gla
protein and fetuin A), using the same experimental conditions(Fig. 2B). Western blot analysis revealed that fluoride did notchange the abundance of these proteins, but quantitative PCRshowed the a decrease in the RNA expression of Fetuin A (Fig. 2C).e reduces cytotoxicity of VSMC induced with 2 mM Pi. (B) Fluoride prevents the
A. Martín-Pardillos et al. / Toxicology 318 (2014) 40–50 43
F expret Fluori as in
3
weoud
ig. 2. Effect of fluoride on gene expression. (A) Fluoride progressively prevents thehe expression of alkaline phosphatase, osteocalcin and the vitamin D3 receptor. (B)n VSMC. (C) Relative RNA quantitation of MGP and fetuin A in the same conditions
.4. The effect of fluoride is not cell-mediated
To know whether the effect of fluoride on in vitro calcificationas at least partially cell-mediated or, to the contrary, was due
xclusively to a physical action in the deposition process, the effectf fluoride was assayed in a passive model of in vitro calcificationsing dead cells, as reported (Villa-Bellosta et al., 2009). Live andead (methanol-fixed) cells were incubated for 5 days with 2 mM
ssion of the Pi-induced Bmp2, Runx2 and Msx2. However, fluoride does not modifyide does not change the abundance of the anticalcifying proteins MGP and fetuin AB. Asterisk, significantly different with 0 �M F.
Pi in the presence of increasing concentrations of fluoride. Underthese conditions the preventive effect of fluoride on calcificationwas only observed in live cells (Fig. 3A), which suggested a cell-mediated mechanism. However, dead cells calcify at a faster rate
than live cells, and therefore the protective effect of fluoride couldhave been concealed or overwhelmed after 5 days of deposition.Therefore, we assayed the effect of fluoride on fixed cells at shortertimes, and as Fig. 3B shows, the effect was clearly observed at day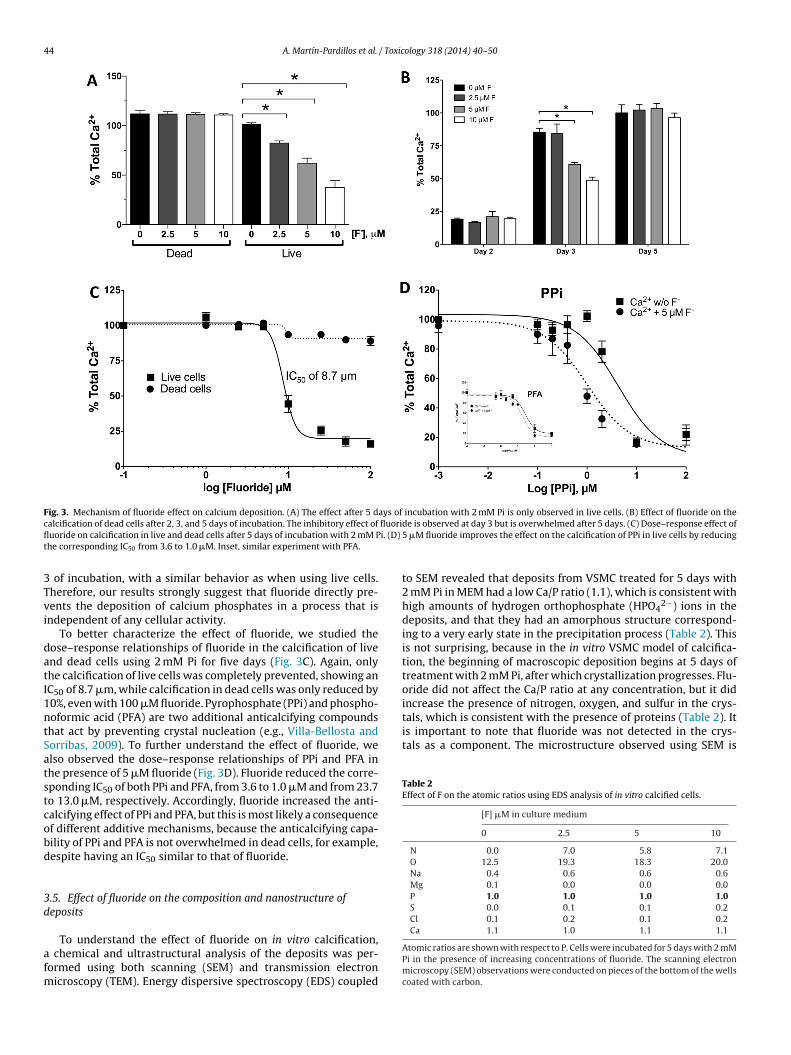
44 A. Martín-Pardillos et al. / Toxicology 318 (2014) 40–50
Fig. 3. Mechanism of fluoride effect on calcium deposition. (A) The effect after 5 days of incubation with 2 mM Pi is only observed in live cells. (B) Effect of fluoride on thec fluorifl i. (D)
t
3Tvi
datI1ntSatstcobd
3d
afm
tals, which is consistent with the presence of proteins (Table 2). Itis important to note that fluoride was not detected in the crys-tals as a component. The microstructure observed using SEM is
Table 2Effect of F on the atomic ratios using EDS analysis of in vitro calcified cells.
[F] �M in culture medium
0 2.5 5 10
N 0.0 7.0 5.8 7.1O 12.5 19.3 18.3 20.0Na 0.4 0.6 0.6 0.6Mg 0.1 0.0 0.0 0.0P 1.0 1.0 1.0 1.0S 0.0 0.1 0.1 0.2Cl 0.1 0.2 0.1 0.2Ca 1.1 1.0 1.1 1.1
alcification of dead cells after 2, 3, and 5 days of incubation. The inhibitory effect ofuoride on calcification in live and dead cells after 5 days of incubation with 2 mM Phe corresponding IC50 from 3.6 to 1.0 �M. Inset, similar experiment with PFA.
of incubation, with a similar behavior as when using live cells.herefore, our results strongly suggest that fluoride directly pre-ents the deposition of calcium phosphates in a process that isndependent of any cellular activity.
To better characterize the effect of fluoride, we studied theose–response relationships of fluoride in the calcification of livend dead cells using 2 mM Pi for five days (Fig. 3C). Again, onlyhe calcification of live cells was completely prevented, showing anC50 of 8.7 �m, while calcification in dead cells was only reduced by0%, even with 100 �M fluoride. Pyrophosphate (PPi) and phospho-oformic acid (PFA) are two additional anticalcifying compoundshat act by preventing crystal nucleation (e.g., Villa-Bellosta andorribas, 2009). To further understand the effect of fluoride, welso observed the dose–response relationships of PPi and PFA inhe presence of 5 �M fluoride (Fig. 3D). Fluoride reduced the corre-ponding IC50 of both PPi and PFA, from 3.6 to 1.0 �M and from 23.7o 13.0 �M, respectively. Accordingly, fluoride increased the anti-alcifying effect of PPi and PFA, but this is most likely a consequencef different additive mechanisms, because the anticalcifying capa-ility of PPi and PFA is not overwhelmed in dead cells, for example,espite having an IC50 similar to that of fluoride.
.5. Effect of fluoride on the composition and nanostructure ofeposits
To understand the effect of fluoride on in vitro calcification, chemical and ultrastructural analysis of the deposits was per-ormed using both scanning (SEM) and transmission electron
icroscopy (TEM). Energy dispersive spectroscopy (EDS) coupled
de is observed at day 3 but is overwhelmed after 5 days. (C) Dose–response effect of5 �M fluoride improves the effect on the calcification of PPi in live cells by reducing
to SEM revealed that deposits from VSMC treated for 5 days with2 mM Pi in MEM had a low Ca/P ratio (1.1), which is consistent withhigh amounts of hydrogen orthophosphate (HPO4
2−) ions in thedeposits, and that they had an amorphous structure correspond-ing to a very early state in the precipitation process (Table 2). Thisis not surprising, because in the in vitro VSMC model of calcifica-tion, the beginning of macroscopic deposition begins at 5 days oftreatment with 2 mM Pi, after which crystallization progresses. Flu-oride did not affect the Ca/P ratio at any concentration, but it didincrease the presence of nitrogen, oxygen, and sulfur in the crys-
Atomic ratios are shown with respect to P. Cells were incubated for 5 days with 2 mMPi in the presence of increasing concentrations of fluoride. The scanning electronmicroscopy (SEM) observations were conducted on pieces of the bottom of the wellscoated with carbon.
A. Martín-Pardillos et al. / Toxicology 318 (2014) 40–50 45
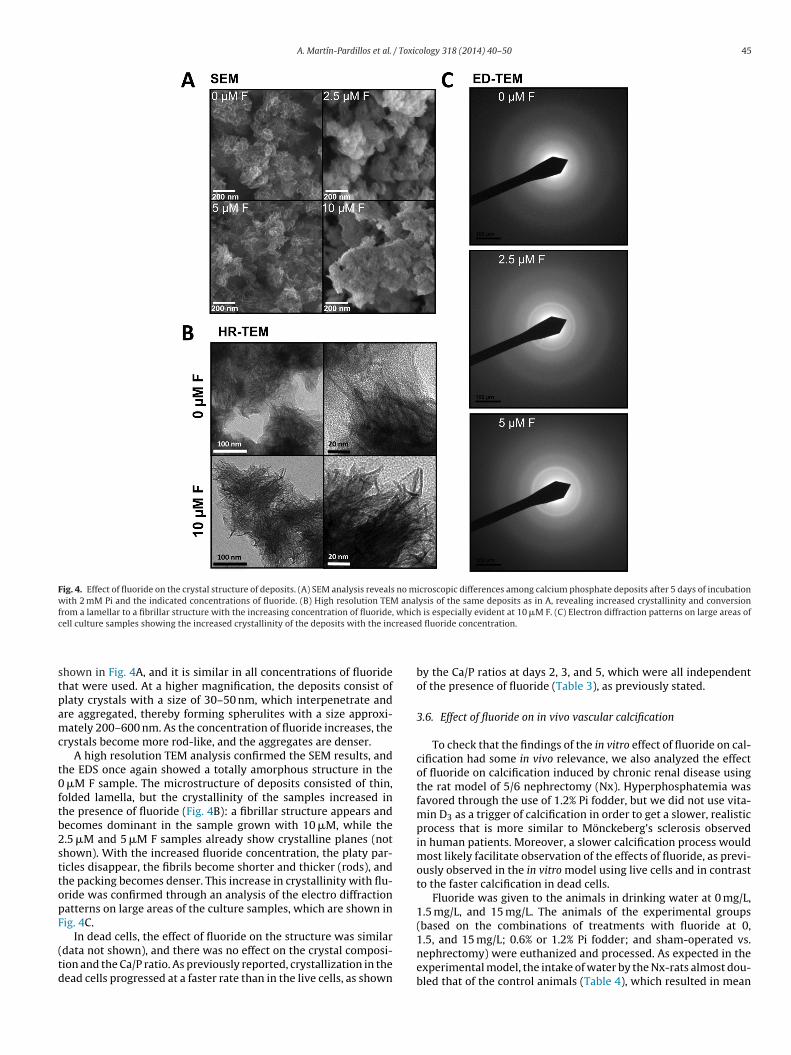
Fig. 4. Effect of fluoride on the crystal structure of deposits. (A) SEM analysis reveals no microscopic differences among calcium phosphate deposits after 5 days of incubationwith 2 mM Pi and the indicated concentrations of fluoride. (B) High resolution TEM analysis of the same deposits as in A, revealing increased crystallinity and conversionfrom a lamellar to a fibrillar structure with the increasing concentration of fluoride, which is especially evident at 10 �M F. (C) Electron diffraction patterns on large areas ofc rease
stpamc
t0ftb2sttopF
(td
ell culture samples showing the increased crystallinity of the deposits with the inc
hown in Fig. 4A, and it is similar in all concentrations of fluoridehat were used. At a higher magnification, the deposits consist oflaty crystals with a size of 30–50 nm, which interpenetrate andre aggregated, thereby forming spherulites with a size approxi-ately 200–600 nm. As the concentration of fluoride increases, the
rystals become more rod-like, and the aggregates are denser.A high resolution TEM analysis confirmed the SEM results, and
he EDS once again showed a totally amorphous structure in the �M F sample. The microstructure of deposits consisted of thin,olded lamella, but the crystallinity of the samples increased inhe presence of fluoride (Fig. 4B): a fibrillar structure appears andecomes dominant in the sample grown with 10 �M, while the.5 �M and 5 �M F samples already show crystalline planes (nothown). With the increased fluoride concentration, the platy par-icles disappear, the fibrils become shorter and thicker (rods), andhe packing becomes denser. This increase in crystallinity with flu-ride was confirmed through an analysis of the electro diffractionatterns on large areas of the culture samples, which are shown inig. 4C.
In dead cells, the effect of fluoride on the structure was similardata not shown), and there was no effect on the crystal composi-ion and the Ca/P ratio. As previously reported, crystallization in theead cells progressed at a faster rate than in the live cells, as shown
d fluoride concentration.
by the Ca/P ratios at days 2, 3, and 5, which were all independentof the presence of fluoride (Table 3), as previously stated.
3.6. Effect of fluoride on in vivo vascular calcification
To check that the findings of the in vitro effect of fluoride on cal-cification had some in vivo relevance, we also analyzed the effectof fluoride on calcification induced by chronic renal disease usingthe rat model of 5/6 nephrectomy (Nx). Hyperphosphatemia wasfavored through the use of 1.2% Pi fodder, but we did not use vita-min D3 as a trigger of calcification in order to get a slower, realisticprocess that is more similar to Mönckeberg’s sclerosis observedin human patients. Moreover, a slower calcification process wouldmost likely facilitate observation of the effects of fluoride, as previ-ously observed in the in vitro model using live cells and in contrastto the faster calcification in dead cells.
Fluoride was given to the animals in drinking water at 0 mg/L,1.5 mg/L, and 15 mg/L. The animals of the experimental groups(based on the combinations of treatments with fluoride at 0,
1.5, and 15 mg/L; 0.6% or 1.2% Pi fodder; and sham-operated vs.nephrectomy) were euthanized and processed. As expected in theexperimental model, the intake of water by the Nx-rats almost dou-bled that of the control animals (Table 4), which resulted in mean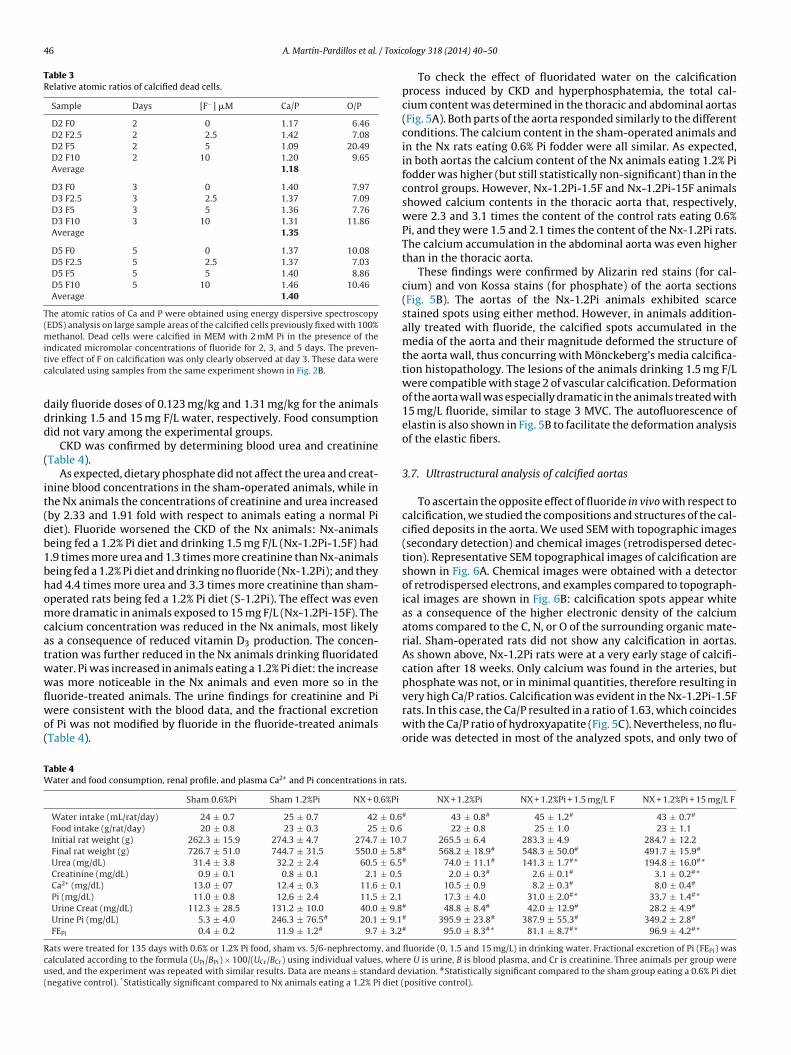
46 A. Martín-Pardillos et al. / Toxic
Table 3Relative atomic ratios of calcified dead cells.
Sample Days [F−] �M Ca/P O/P
D2 F0 2 0 1.17 6.46D2 F2.5 2 2.5 1.42 7.08D2 F5 2 5 1.09 20.49D2 F10 2 10 1.20 9.65Average 1.18
D3 F0 3 0 1.40 7.97D3 F2.5 3 2.5 1.37 7.09D3 F5 3 5 1.36 7.76D3 F10 3 10 1.31 11.86Average 1.35
D5 F0 5 0 1.37 10.08D5 F2.5 5 2.5 1.37 7.03D5 F5 5 5 1.40 8.86D5 F10 5 10 1.46 10.46Average 1.40
The atomic ratios of Ca and P were obtained using energy dispersive spectroscopy(EDS) analysis on large sample areas of the calcified cells previously fixed with 100%methanol. Dead cells were calcified in MEM with 2 mM Pi in the presence of theitc
ddd
(
it(db1bhomcatwwflwo(
TW
Rcu(
ndicated micromolar concentrations of fluoride for 2, 3, and 5 days. The preven-ive effect of F on calcification was only clearly observed at day 3. These data werealculated using samples from the same experiment shown in Fig. 2B.
aily fluoride doses of 0.123 mg/kg and 1.31 mg/kg for the animalsrinking 1.5 and 15 mg F/L water, respectively. Food consumptionid not vary among the experimental groups.
CKD was confirmed by determining blood urea and creatinineTable 4).
As expected, dietary phosphate did not affect the urea and creat-nine blood concentrations in the sham-operated animals, while inhe Nx animals the concentrations of creatinine and urea increasedby 2.33 and 1.91 fold with respect to animals eating a normal Piiet). Fluoride worsened the CKD of the Nx animals: Nx-animalseing fed a 1.2% Pi diet and drinking 1.5 mg F/L (Nx-1.2Pi-1.5F) had.9 times more urea and 1.3 times more creatinine than Nx-animalseing fed a 1.2% Pi diet and drinking no fluoride (Nx-1.2Pi); and theyad 4.4 times more urea and 3.3 times more creatinine than sham-perated rats being fed a 1.2% Pi diet (S-1.2Pi). The effect was evenore dramatic in animals exposed to 15 mg F/L (Nx-1.2Pi-15F). The
alcium concentration was reduced in the Nx animals, most likelys a consequence of reduced vitamin D3 production. The concen-ration was further reduced in the Nx animals drinking fluoridatedater. Pi was increased in animals eating a 1.2% Pi diet: the increaseas more noticeable in the Nx animals and even more so in the
uoride-treated animals. The urine findings for creatinine and Piere consistent with the blood data, and the fractional excretionf Pi was not modified by fluoride in the fluoride-treated animalsTable 4).
able 4ater and food consumption, renal profile, and plasma Ca2+ and Pi concentrations in rats
Sham 0.6%Pi Sham 1.2%Pi NX + 0.6%Pi
Water intake (mL/rat/day) 24 ± 0.7 25 ± 0.7 42 ± 0.6Food intake (g/rat/day) 20 ± 0.8 23 ± 0.3 25 ± 0.6Initial rat weight (g) 262.3 ± 15.9 274.3 ± 4.7 274.7 ± 10.Final rat weight (g) 726.7 ± 51.0 744.7 ± 31.5 550.0 ± 5.8Urea (mg/dL) 31.4 ± 3.8 32.2 ± 2.4 60.5 ± 6.5Creatinine (mg/dL) 0.9 ± 0.1 0.8 ± 0.1 2.1 ± 0.5Ca2+ (mg/dL) 13.0 ± 07 12.4 ± 0.3 11.6 ± 0.1Pi (mg/dL) 11.0 ± 0.8 12.6 ± 2.4 11.5 ± 2.1Urine Creat (mg/dL) 112.3 ± 28.5 131.2 ± 10.0 40.0 ± 9.8Urine Pi (mg/dL) 5.3 ± 4.0 246.3 ± 76.5# 20.1 ± 9.1FEPi 0.4 ± 0.2 11.9 ± 1.2# 9.7 ± 3.2
ats were treated for 135 days with 0.6% or 1.2% Pi food, sham vs. 5/6-nephrectomy, and
alculated according to the formula (UPi/BPi) × 100/(UCr/BCr) using individual values, whesed, and the experiment was repeated with similar results. Data are means ± standard dnegative control). *Statistically significant compared to Nx animals eating a 1.2% Pi diet (
ology 318 (2014) 40–50
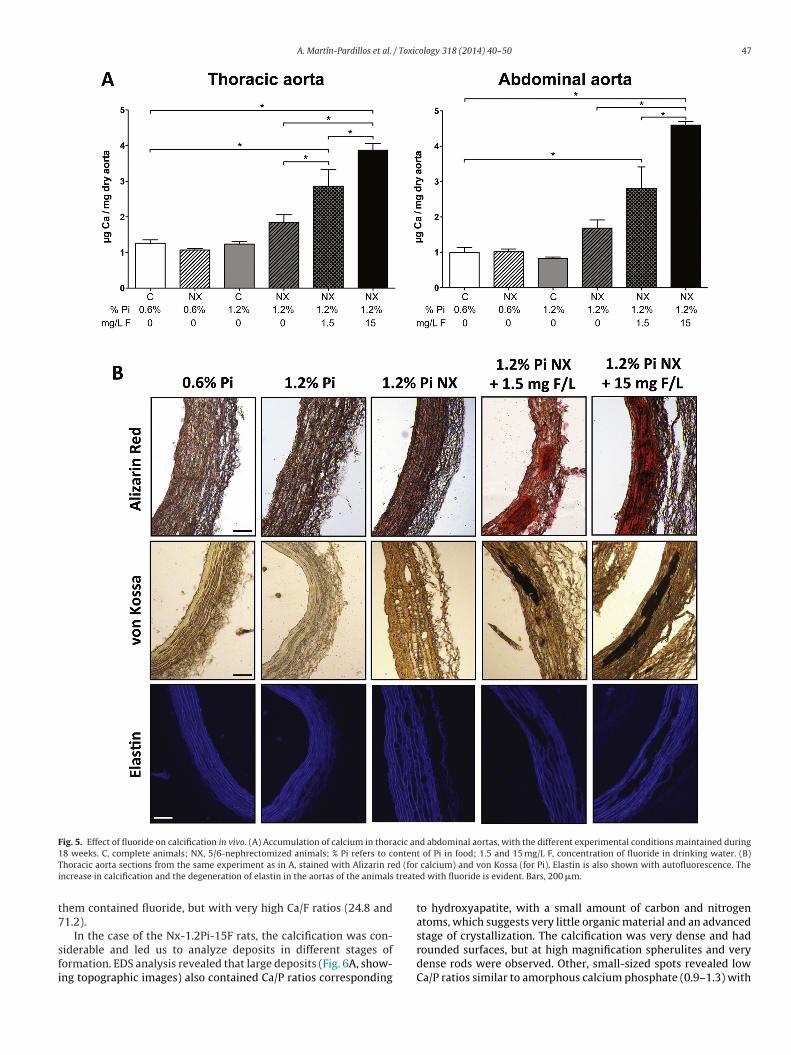
To check the effect of fluoridated water on the calcificationprocess induced by CKD and hyperphosphatemia, the total cal-cium content was determined in the thoracic and abdominal aortas(Fig. 5A). Both parts of the aorta responded similarly to the differentconditions. The calcium content in the sham-operated animals andin the Nx rats eating 0.6% Pi fodder were all similar. As expected,in both aortas the calcium content of the Nx animals eating 1.2% Pifodder was higher (but still statistically non-significant) than in thecontrol groups. However, Nx-1.2Pi-1.5F and Nx-1.2Pi-15F animalsshowed calcium contents in the thoracic aorta that, respectively,were 2.3 and 3.1 times the content of the control rats eating 0.6%Pi, and they were 1.5 and 2.1 times the content of the Nx-1.2Pi rats.The calcium accumulation in the abdominal aorta was even higherthan in the thoracic aorta.
These findings were confirmed by Alizarin red stains (for cal-cium) and von Kossa stains (for phosphate) of the aorta sections(Fig. 5B). The aortas of the Nx-1.2Pi animals exhibited scarcestained spots using either method. However, in animals addition-ally treated with fluoride, the calcified spots accumulated in themedia of the aorta and their magnitude deformed the structure ofthe aorta wall, thus concurring with Mönckeberg’s media calcifica-tion histopathology. The lesions of the animals drinking 1.5 mg F/Lwere compatible with stage 2 of vascular calcification. Deformationof the aorta wall was especially dramatic in the animals treated with15 mg/L fluoride, similar to stage 3 MVC. The autofluorescence ofelastin is also shown in Fig. 5B to facilitate the deformation analysisof the elastic fibers.
3.7. Ultrastructural analysis of calcified aortas
To ascertain the opposite effect of fluoride in vivo with respect tocalcification, we studied the compositions and structures of the cal-cified deposits in the aorta. We used SEM with topographic images(secondary detection) and chemical images (retrodispersed detec-tion). Representative SEM topographical images of calcification areshown in Fig. 6A. Chemical images were obtained with a detectorof retrodispersed electrons, and examples compared to topograph-ical images are shown in Fig. 6B: calcification spots appear whiteas a consequence of the higher electronic density of the calciumatoms compared to the C, N, or O of the surrounding organic mate-rial. Sham-operated rats did not show any calcification in aortas.As shown above, Nx-1.2Pi rats were at a very early stage of calcifi-cation after 18 weeks. Only calcium was found in the arteries, butphosphate was not, or in minimal quantities, therefore resulting in
very high Ca/P ratios. Calcification was evident in the Nx-1.2Pi-1.5Frats. In this case, the Ca/P resulted in a ratio of 1.63, which coincideswith the Ca/P ratio of hydroxyapatite (Fig. 5C). Nevertheless, no flu-oride was detected in most of the analyzed spots, and only two of.
NX + 1.2%Pi NX + 1.2%Pi + 1.5 mg/L F NX + 1.2%Pi + 15 mg/L F
# 43 ± 0.8# 45 ± 1.2# 43 ± 0.7#
22 ± 0.8 25 ± 1.0 23 ± 1.17 265.5 ± 6.4 283.3 ± 4.9 284.7 ± 12.2# 568.2 ± 18.9# 548.3 ± 50.0# 491.7 ± 15.9#
# 74.0 ± 11.1# 141.3 ± 1.7#* 194.8 ± 16.0#* 2.0 ± 0.3# 2.6 ± 0.1# 3.1 ± 0.2#* 10.5 ± 0.9 8.2 ± 0.3# 8.0 ± 0.4#
17.3 ± 4.0 31.0 ± 2.0#* 33.7 ± 1.4#*# 48.8 ± 8.4# 42.0 ± 12.9# 28.2 ± 4.9#
# 395.9 ± 23.8# 387.9 ± 55.3# 349.2 ± 2.8#
# 95.0 ± 8.3#* 81.1 ± 8.7#* 96.9 ± 4.2#*
fluoride (0, 1.5 and 15 mg/L) in drinking water. Fractional excretion of Pi (FEPi) wasre U is urine, B is blood plasma, and Cr is creatinine. Three animals per group wereeviation. #Statistically significant compared to the sham group eating a 0.6% Pi dietpositive control).
A. Martín-Pardillos et al. / Toxicology 318 (2014) 40–50 47
Fig. 5. Effect of fluoride on calcification in vivo. (A) Accumulation of calcium in thoracic and abdominal aortas, with the different experimental conditions maintained during1 ontenT d (fori treate
t7
sfi
8 weeks. C, complete animals; NX, 5/6-nephrectomized animals; % Pi refers to choracic aorta sections from the same experiment as in A, stained with Alizarin rencrease in calcification and the degeneration of elastin in the aortas of the animals
hem contained fluoride, but with very high Ca/F ratios (24.8 and1.2).
In the case of the Nx-1.2Pi-15F rats, the calcification was con-iderable and led us to analyze deposits in different stages oformation. EDS analysis revealed that large deposits (Fig. 6A, show-ng topographic images) also contained Ca/P ratios corresponding
t of Pi in food; 1.5 and 15 mg/L F, concentration of fluoride in drinking water. (B) calcium) and von Kossa (for Pi). Elastin is also shown with autofluorescence. Thed with fluoride is evident. Bars, 200 �m.
to hydroxyapatite, with a small amount of carbon and nitrogenatoms, which suggests very little organic material and an advanced
stage of crystallization. The calcification was very dense and hadrounded surfaces, but at high magnification spherulites and verydense rods were observed. Other, small-sized spots revealed lowCa/P ratios similar to amorphous calcium phosphate (0.9–1.3) with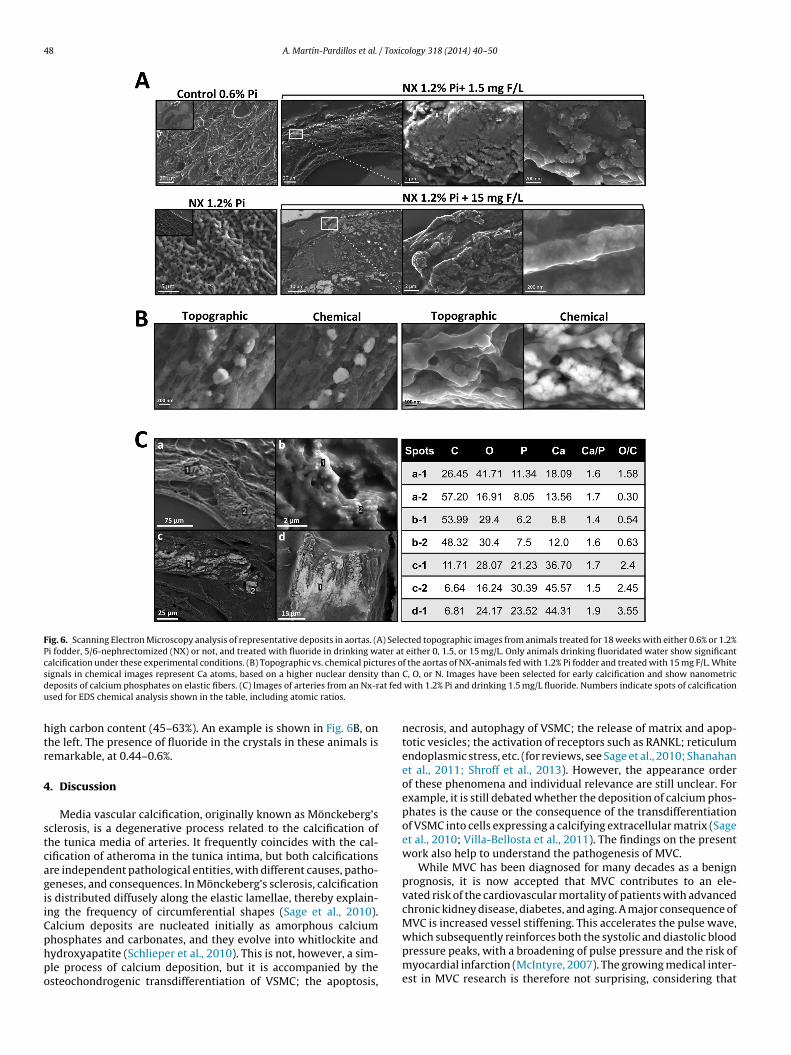
48 A. Martín-Pardillos et al. / Toxicology 318 (2014) 40–50
Fig. 6. Scanning Electron Microscopy analysis of representative deposits in aortas. (A) Selected topographic images from animals treated for 18 weeks with either 0.6% or 1.2%Pi fodder, 5/6-nephrectomized (NX) or not, and treated with fluoride in drinking water at either 0, 1.5, or 15 mg/L. Only animals drinking fluoridated water show significantcalcification under these experimental conditions. (B) Topographic vs. chemical pictures of the aortas of NX-animals fed with 1.2% Pi fodder and treated with 15 mg F/L. Whites than
d at fedu
htr
4
stcagiiCphpo
ignals in chemical images represent Ca atoms, based on a higher nuclear densityeposits of calcium phosphates on elastic fibers. (C) Images of arteries from an Nx-rsed for EDS chemical analysis shown in the table, including atomic ratios.
igh carbon content (45–63%). An example is shown in Fig. 6B, onhe left. The presence of fluoride in the crystals in these animals isemarkable, at 0.44–0.6%.
. Discussion
Media vascular calcification, originally known as Mönckeberg’sclerosis, is a degenerative process related to the calcification ofhe tunica media of arteries. It frequently coincides with the cal-ification of atheroma in the tunica intima, but both calcificationsre independent pathological entities, with different causes, patho-eneses, and consequences. In Mönckeberg’s sclerosis, calcifications distributed diffusely along the elastic lamellae, thereby explain-ng the frequency of circumferential shapes (Sage et al., 2010).alcium deposits are nucleated initially as amorphous calcium
hosphates and carbonates, and they evolve into whitlockite andydroxyapatite (Schlieper et al., 2010). This is not, however, a sim-le process of calcium deposition, but it is accompanied by thesteochondrogenic transdifferentiation of VSMC; the apoptosis,C, O, or N. Images have been selected for early calcification and show nanometric with 1.2% Pi and drinking 1.5 mg/L fluoride. Numbers indicate spots of calcification
necrosis, and autophagy of VSMC; the release of matrix and apop-totic vesicles; the activation of receptors such as RANKL; reticulumendoplasmic stress, etc. (for reviews, see Sage et al., 2010; Shanahanet al., 2011; Shroff et al., 2013). However, the appearance orderof these phenomena and individual relevance are still unclear. Forexample, it is still debated whether the deposition of calcium phos-phates is the cause or the consequence of the transdifferentiationof VSMC into cells expressing a calcifying extracellular matrix (Sageet al., 2010; Villa-Bellosta et al., 2011). The findings on the presentwork also help to understand the pathogenesis of MVC.
While MVC has been diagnosed for many decades as a benignprognosis, it is now accepted that MVC contributes to an ele-vated risk of the cardiovascular mortality of patients with advancedchronic kidney disease, diabetes, and aging. A major consequence ofMVC is increased vessel stiffening. This accelerates the pulse wave,
which subsequently reinforces both the systolic and diastolic bloodpressure peaks, with a broadening of pulse pressure and the risk ofmyocardial infarction (McIntyre, 2007). The growing medical inter-est in MVC research is therefore not surprising, considering that
/ Toxic
tmoc
tirpwOrraebNifice
pdVabwbaiseI(ove(anicamtemdpS
wmattreom
rttT
A. Martín-Pardillos et al.
he prevalence of CKD in the total global population is approxi-ately 13% (Obrador et al., 2011) and considering that the epidemic
f diabetes mellitus also ends in diabetic nephropathy, CKD, andardiovascular death (Edmonds, 2000).
Preventive measures to minimize the incidence of MVC areherefore critical, but special attention should also be devoted tondiscriminate practices that could alter, either directly or indi-ectly, the rates of ectopic calcification in prone patients. One suchractice seems to be the policy of fluoridating municipal drinkingater, whose positive dental effects have been well documented.ur hypothesis in this work was that the incorporation of fluo-
ide into the crystal lattice of calcium phosphates is not merelyestricted to growing bone and enamel, but rather, fluoride couldlso be incorporated into any active (ectopic) calcification and min-ralization, such as MVC. In fact, this incorporation has recentlyeen shown in active arterial calcification sites: the use of 18F-aF with positron emission tomography takes advantage of 18F
ncorporation for the identification of atheroma under active calci-cation (Dweck et al., 2012). To prove our hypothesis and check theonsequences on vascular physiology, we set up in vitro and in vivoxperiments.
The in vitro findings using VSMC under calcification were unex-ected, because fluoride, at regular blood concentrations whenrinking fluoridated water, prevented CPD and the accompanyingSMC death (Fig. 1A/B). The effect on CPD was non-cell medi-ted and most likely consisted in a physicochemical mechanism,ecause the effect was still present when the calcification assayas performed using dead cells (Fig. 3B). The lack of an effect
y fluoride in the expression of the anticalcifying proteins MGPnd fetuin A (Fig. 2B) also supports the exclusive physicochem-cal mechanism of fluoride. However, this effect was not verytrong and was time-dependent, given that it was overcome whenxperimental calcification persisted. This was despite the lowC50 of fluoride (8.7 �M), similar to that of PPi (3.6 �M) and PFA23.7 �M; Fig. 3C), whose anticalcifying effect, however, persistsver time. As expected, the inhibition of CPD by fluoride pre-ented the osteogenic response (Bmp2, Runx2, Msx2) of VSMC,videncing the osteochondrogenic transdifferentiation of the cellsFig. 2A). The expression of other genes related to calcification, suchs alkaline phosphatase, osteocalcin, and vitamin D3 receptor, wasot altered by fluoride, but the expressions thereof also were not
nduced by 2 mM Pi, most likely a consequence of the short calcifi-ation time (5 days). The fact that fluoride prevents the depositionnd crystal growth of calcium phosphates by a cell-independentechanism, which consequently prevents the osteochondrogenic
ransdifferentiation of VSMC, underpins the idea that the osteogenexpression response of VSMC to calcifying media is not directlyediated by incubation with a high Pi concentration but by the
eposition of calcium phosphates (this idea has been outlined inrevious studies on PPi and PFA: Villa-Bellosta and Sorribas, 2009;age et al., 2011; Villa-Bellosta et al., 2011).
The in vivo findings were most striking, because they contrastedith the in vitro results. Fluoride dramatically increased MVC in ani-als subject to active calcification of the arteries induced by CKD
nd hyperphosphatemia (Fig. 5). The remarkable findings were (1)hat calcification occurred at a faster rate than in the positive con-rols (Nx-1.2Pi) and (2) that the effect was induced using the WHO’secommended concentration of fluoride. How fluoride causes thisffect seems to be clear upon an analysis of the renal function: flu-ride exacerbates renal damage, as shown in Table 4, which is aajor cause of MVC.The nephrotoxicity of fluoride is well known, but to assess the
elevance of our findings in MVC compared to previous studies,wo parameters have to be considered: dose (WHO recommenda-ion vs. toxic studies) and renal function (CKD vs. healthy kidney).here is no epidemiological evidence of significant renal disease
ology 318 (2014) 40–50 49
in healthy people exposed to different doses of fluoride, even at8 mg/L in drinking water (Palmer and Gilbert, 2012). In experi-mental animal studies, the findings are not entirely consistent,but in general, structural damage is only observed at very highdoses (50 ppm or more in water), while some functional damageand proteomic changes are already observed at 5–8 ppm (Tayloret al., 1961; Kobayashi et al., 2009; Cárdenas-González et al., 2013).In CKD, however, the renal excretion of fluoride is impaired, andtherefore the plasma concentration of fluoride is increased (Buzalafand Whitford, 2011), thereby further damaging the kidneys, aggra-vating chronic kidney disease, and generating an increase of uremictoxins in parallel to MVC.
With respect to the effects of fluoride on the calcification pro-cess, we have to distinguish between the action on calcium andphosphates in a solution (e.g., our in vitro findings) and the actionon hydroxyapatite. Most of the literature is devoted to studies onfluoride absorption from a solution into hydroxyapatite crystals.These studies show that F− substitutes OH− within a surface layerthat is a few nanometers thick, consequently inhibiting hydroxyap-atite dissolution, especially at an acid pH (Nicholson and Czarnecka,2008). This partially coincides with our findings, because we onlydetected F− in deposits that contain hydroxyapatite in massive cal-cifications of the arteries (Fig. 6C). However, the incorporation of F−
at a ratio that was compatible with fluoroapatite after 4.5 monthsof the experiment was only observed in Nx-1.2Pi-15F animals.From a therapeutic point of view, this incorporation may involvean additional problem, because these calcifications will be moredifficult to eliminate, if at all possible. In our cell culture experi-ments, fluoride clearly inhibits calcium phosphate crystallizationin a concentration-dependent manner. To our knowledge, this isthe first report to show such inhibition in vitro, although it has alsobeen found in in vivo systems. Moreover, both in vitro (Table 2,Fig. 4) and in the small marginal artery calcifications (Fig. 6B), theinitial deposits consist of amorphous calcium phosphate. This isevident from the absence of crystal reflections in EDS, which showsplaty-shaped particles, low electron density, and Ca/P ratios closeto 1, which indicates that the phosphorus is mostly as HPO4
2− in theprecipitates. Obviously, fluoride’s inhibiting action is not exerted onthe crystallization process itself, because in pure calcium phosphatesolutions the effect is the opposite: fluoride promotes both nuclea-tion and growth (Tung et al., 1992). The cell culture calcificationmodel, again similar to in vivo systems, shows another differencewith respect to pure solution precipitation: the precursor phaseis amorphous (instead of crystalline octacalcium phosphate anddicalciumphosphate dihydrate). In fact, it is commonly assumedthat in vivo crystallization is mediated by the action of certain pro-teins that act as nucleators, which adsorb on the crystal surface andfavor amorphous precursor phases. It has also been reported thatfluoride interacts with this protein matrix and thus retards calciumphosphate precipitation (Aoba, 1997). It is therefore likely that pre-cipitation in a cell culture system, similarly to in vivo, occurs due toa protein-mediated process and that fluoride is able to restrain thisprocess through interactions with proteins. Fluoride also affectsthe morphology of the crystals by modulating the cross-sectionalappearance of the apatite crystals (Aoba, 1997). This modulationdepends on the fluoride concentration, but in general it turns thecrystal structure of calcium phosphates from planes composed ofshort plates into denser crystals with a needle-like shape (Eanesand Meyer, 1978; Fan et al., 2009). We found the same effect in ourin vitro calcification assays after analysis by TEM (Fig. 4B), whichconfirms the appropriateness of our experimental setup.
4.1. Conclusions
• The main conclusion of our study is that CKD is aggravated evenby low concentrations of fluoride, which in turn accelerates MVC,
5 / Toxic
•
•
lhhass
C
a
A
oCa
R
A
B
B
C
C
D
E
0 A. Martín-Pardillos et al.
thereby confirming and extending previous reports on fluorosisin CKD patients exposed to WHO-recommended fluoride concen-trations in drinking water (Greenberg et al., 1974; Lyaruu et al.,2008).However, we have found the opposite finding under in vitro con-ditions: Using primary cultures of aortic vascular smooth musclecells, fluoride prevents calcification and cell death when used atthe usual blood concentrations found in people who drink fluori-dated water. The prevention of calcification is a non-cell mediatedprocess, but fluoride seems to act directly on cellular proteins,therefore preventing nucleation, with a very low IC50 (8.7 �M),similar to that of PPi but through a different mechanism. Con-sequently, fluoride also prevents the transdifferentiation of cellsinto osteoblastic-like cells. The direct inhibition of ectopic calcifi-cation could still occur in vivo when the renal function is correct,such as during aging or even the initial stages of diabetes, andthis possibility deserves further research.To understand opposite effects of fluoride in vivo and in vitro,we have performed a deep ultrastructural and crystallographicstudy of the calcification deposits in both calcified cultures andthe aorta of the animals, showing changes in the crystal shapesdue to fluoride, the incorporation of fluoride into the crystal lat-tices (replacing the hydroxyl ions), and the effects of fluoride onthe evolution of the crystals and the formation of hydroxyapatitefrom amorphous calcium phosphates.
In summary, the effects of fluoride on renal function and vascu-ar health are more complicated than expected. Our findings couldelp to decide whether the use of fluoride to improve the dentalealth of the population through indiscriminate practices, such asdding it to municipal drinking water, should be reconsidered andhould be replaced by a fluoridation policy based on the healthtatus of individuals.
onflict of interest - Full Disclosure
The authors declare that they do not have conflict of interestsnd, therefore, they have nothing to disclose.
cknowledgments
AMP received a predoctoral fellowship from the Governmentf Aragon (Spain), B008/09. Two Spanish Ministry of Economy andompetitiveness grants were given, to VS (code SAF2012-33898),nd to Ángel Millán (code MAT2011-25991).
eferences
oba, T., 1997. The effect of fluoride on apatite structure and growth. Crit. Rev. Oral.Biol. Med. 8, 136–153.
ernstein, D.S., Sadowsky, N., Hegsted, D.M., Guri, C.D., Stare, F.J., 1966. Prevalenceof osteoporosis in high- and low-fluoride areas in North Dakota. JAMA 198,499–504.
uzalaf, M.A., Whitford, G.M., 2011. Fluoride metabolism. Monogr. Oral Sci. 22,20–36.
árdenas-González, M.C., Del Razo, L.M., Barrera-Chimal, J., Estrada, T.J., Bayghen,E.L., Bobadilla, N.A., Barbier, O., 2013. Proximal renal tubular injury in rats sub-chronically exposed to low fluoride concentrations. Toxicol. Appl. Pharmacol.272, 888–894.
hachra, D., Vieira, A.P., Grynpas, M.D., 2008. Fluoride and mineralized tissues. Crit.Rev. Biomed. Eng. 36, 183–223.
weck, M.R., Chow, M.W., Joshi, N.V., Williams, M.C., Jones, C., Fletcher, A.M.,
Richardson, H., White, A., McKillop, G., van Beek, E.J., Boon, N.A., Rudd, J.H.,Newby, D.E., 2012. Coronary arterial 18F-sodium fluoride uptake: a novel markerof plaque biology. J. Am. Coll. Cardiol. 59, 1539–1548.anes, E.D., Meyer, J.L., 1978. The influence of fluoride on apatite formation fromunstable supersaturated solutions at pH 7.4. J. Dent. Res. 57, 617–624.
ology 318 (2014) 40–50
Edmonds, M.E., 2000. Medial arterial calcification and diabetes mellitus. Zeitsch.Kardiol. 89, 101–104.
Fan, Y., Sun, Z., Moradian-Oldak, J., 2009. Effect of fluoride on the morphology ofcalcium phosphate crystals grown on acid-etched human enamel. Caries Res.43, 132–136.
Greenberg, L.W., Nelsen, C.E., Kremer, N., 1974. Nephrogenic diabetes insipidus withfluorosis. Pediatrics 54, 320–322.
Husdan, H., Vogl, R., Oreopoulos, D., Gryfe, C., Rapoport, A., 1976. Serum ionic fluo-ride: normal range and relationship to age and sex. Clin. Chem. 22, 1884–1888.
Kobayashi, C.A., Leite, A.L., Silva, T.L., Santos, L.D., Nogueira, F.C., Oliveira, R.C., Palma,M.S., Domont, G.B., Buzalaf, M.A., 2009. Proteomic analysis of kidney in ratschronically exposed to fluoride. Chem. Biol. Interact. 180, 305–311.
Lyaruu, D.M., Bronckers, A.L., Santos, F., Mathias, R., DenBesten, P., 2008. The effectof fluoride on enamel and dentin formation in the uremic rat incisor. Pediatr.Nephrol. 23, 1973–1979.
Ma, Y., Niu, R., Sun, Z., Wang, J., Luo, G., Zhang, J., Wang, J., 2012. Inflammatoryresponses induced by fluoride and arsenic at toxic concentration in rabbit aorta.Arch. Toxicol. 86, 849–856.
Martín-Pardillos, A., Sosa, C., Sorribas, V., 2013. Arsenic increases Pi-mediated vascu-lar calcification and induces premature senescence in vascular smooth musclecells. Toxicol. Sci. 131, 641–653.
McIntyre, C.W., 2007. The functional cardiovascular consequences of vascular calci-fication. Semin. Dial. 20, 122–128.
Meenakshi, R.C., Maheshwari, S.K., 2006. Fluoride in drinking water and its removal.J. Hazard. Mater. 137, 456–463.
Nicholson, J.W., Czarnecka, B., 2008. Fluoride in dentistry and dental retoratives. In:Tressaud, A., Haufe, G. (Eds.), Fluorine and Health: Molecular Imaging, Biomed-ical Materials and Pharmaceuticals. Elsevier, Amsterdam, p. 340.
Obrador, G.T., Mahdavi-Mazdeh, M., Collins, A.J., 2011. Establishing the global kidneydisease prevention network (KDPN): a position statement from the NationalKidney Foundation. Am. J. Kidney Dis. 57, 361–370.
Palmer, C.A., Gilbert, J.A., 2012. Academy of Nutrition and Dietetics. Position of theAcademy of Nutrition and Dietetics: the impact of fluoride on health. J. Acad.Nutr. Diet. 112, 1443–1453.
Sage, A.P., Tintut, Y., Demer, L.L., 2010. Regulatory mechanisms in vascular calcifica-tion. Nat. Rev. Cardiol. 7, 528–536.
Sage, A.P., Lu, J., Tintut, Y., Demer, L.L., 2011. Hyperphosphatemia-inducednanocrystals upregulate the expression of bone morphogenetic protein-2 andosteopontin genes in mouse smooth muscle cells in vitro. Kidney Int. 79,414–422.
Schlieper, G., Aretz, A., Verberckmoes, S.C., Krüger, T., Behets, G.J., Ghadimi, R.,Weirich, T.E., Rohrmann, D., Langer, S., Tordoir, J.H., Amann, K., Westenfeld, R.,Brandenburg, V.M., D’Haese, P.C., Mayer, J., Ketteler, M., McKee, M.D., Floege,J., 2010. Ultrastructural analysis of vascular calcifications in uremia. J. Am. Soc.Nephrol. 21, 689–696.
Shanahan, C.M., Crouthamel, M.H., Kapustin, A., Giachelli, C.M., 2011. Arterial cal-cification in chronic kidney disease: key roles for calcium and phosphate. Circ.Res. 109, 697–711.
Shroff, R., Long, D.A., Shanahan, C., 2013. Mechanistic insights into vascular calcifi-cation in CKD. J. Am. Soc. Nephrol. 24, 179–189.
Singer, L., Ophaug, R.H., 1979. Concentrations of ionic, total, and bound fluoride inplasma. Clin. Chem. 25, 523–525.
Susheela, A.K., Kharb, P., 1990. Aortic calcification in chronic fluoride poisoning:biochemical and electronmicroscopic evidence. Exp. Mol. Pathol. 53, 72–80.
Taylor, J.M., Scott, J.K., Maynard, E.A., Smith, F.A., Hodge, H.C., 1961. Toxic effects offluoride on the rat kidney. Toxicol. Appl. Pharmacol. 3, 278–289.
Tuncel, E., 1984. The incidence of moenckeberg calcification in patients withendemic fluorosis. Fluoride 17, 4–8.
Tung, M.S., Tomazic, B., Brown, W.E., 1992. The effects of magnesium and fluorideon the hydrolysis of octacalcium phosphate. Arch. Oral Biol. 37, 585–591.
Verberckmoes, S.C., Persy, V., Behets, G.J., Neven, E., Hufkens, A., Zebger-Gong, H.,Muller, D., Haffner, D., Querfeld, U., Bohic, S., De Broe, M.E., D’Haese, P.C., 2007.Uremia-related vascular calcification: more than apatite deposition. Kidney Int.71, 298–303.
Villa-Bellosta, R., Sorribas, V., 2009. Phosphonoformic acid prevents vascular smoothmuscle cell calcification by inhibiting calcium-phosphate deposition. Arte-rioscler. Thromb. Vasc. Biol. 29, 761–766.
Villa-Bellosta, R., Levi, M., Sorribas, V., 2009. Vascular smooth muscle cell calcifica-tion and SLC20 inorganic phosphate transporters: Effects of PDGF, TNF-alpha,and Pi. Pflugers Arch. 458, 1151–1161.
Villa-Bellosta, R., Millan, A., Sorribas, V., 2011. Role of calcium-phosphate depositionin vascular smooth muscle cell calcification. Am. J. Physiol. Cell Physiol. 300,C210–C220.
Waldbott, G.L., 1966. Fluoride and calcium levels in the aorta. Experientia 22,835–837.
Wang, C.C., Sorribas, V., Sharma, G., Levi, M., Draznin, B., 2007. Insulin attenuatesvascular smooth muscle calcification but increases vascular smooth muscle cell
phosphate transport. Atherosclerosis 195, e65–e75.World Health Organization Guidelines for Drinking-water Quality, 2008. Vol. 1, Rec-ommendations. 3rd ed. Geneva, Switzerland.
Zipkin, I., Zucas, S.M., Lavender, D.R., Fullmer, H.M., Schiffmann, E., Corcoran, B.A.,1970. Fluoride and calcification of rat aorta. Calcif. Tissue. Res. 6, 173–182.