Embed Size (px)
Citation preview
EFFECT OF WASTE COMPOSITION AND CHARGING CYCLE ON COMBUSTION EFFICIENCY OF MEDICAL
AND OTHER SOLID WASTE COMBUSTORS
FLOYD HASSELRIIS Consulting Engineer
Forest Hills, New York
ABSTRACT
The waste composition and the charging rate of solid waste combustors affect the efficiency of the combustion process. An understanding of the combustion process can help designers and regulators, as well as the operator, so that the system can be made to function at its optimum burning capacity without exceeding its combustion capacity. Data from operation of medical waste (MW) and municipal solid waste (MSW) combustion systems (incinerators) is presented and analyzed. These data show that good combustion, indicated by carbon monoxide emissions, takes place over a wide range of temperature and excess oxygen concentrations, and that oxygen deficiencies caused by rapid and excessively high heat release rates result in sharp increases in emissions of carbon monoxide and trace organics, including dioxins and furans. Temperature control alone is not sufficient to assure high combustion efficiency, since sufficient oxygen must also be assured.
INTRODUCTION
Combustion is generally recognized as an effective method of processing medical, municipal, commercial and many industrial solid wastes into inert ash residues, since essentially all organic matter can be destroyed and converted to simple gaseous products consisting
453
mainly of nitrogen, oxygen, water, and carbon dioxide (C02),
The gaseous products also carry contaminants such as particulate matter, sulfur dioxide (S02)' and hydrogen chloride (HCI), which can be removed by emission control devices. However, organic pollutants, such as carbon monoxide and hydrocarbons which were not destroyed by the combustion process, are an environmental and health concern.
The most obvious indication of poor combustion is smoke. The gases discharged by poorly operated combustors may be visible to the eye, especially if they contain soot. The word "incinerator" is associated in the mind of many people in connection with visible emissions. State regulations generally require that incinerators be tested periodically for particulate emissions. In the interim, opacity measurements are used as surrogates for particulate. Opacity is the result of both organic and inorganic particulate, hence combustion can be a major factor in the production of these emissions. Many states require that an opacity (such as 10%) not be exceeded for a period longer than 6 min in any hour. These regulations, in effect, condone the puffs of smoke which frequently accompany the loading of a new charge into the combustion device.
Solid waste combustors which are charged periodically are subject to upsets in the combustion process during each charging (feeding) cycle. Each new charge absorbs heat upon entry, dries, and produces pyrolysis
gases which ignite and burn as they are driven off, releasing heat. The rate of heat release depends upon the composition, density, and moisture content of the waste. Combustion of these gases tends to consume all available oxygen, producing partially oxidized products which are burned in the secondary chamber of a twochamber incinerator, or a downstream location in a single combustion chamber. When each charge represents too large a fraction of the combustion capacity, sufficient oxygen cannot be supplied in time and carbon monoxide is emitted.
Starved-air control of combustion in two-chamber incinerators provides an effective means for limiting the heat release in the primary chamber so that the amount of air (oxygen) which can be supplied to the secondary chamber will be sufficient to complete combustion and achieve high combustion efficiency. Control of twostage combustion requires modulated control of combustion air supply, as well as a means of limiting the charging rate in accordance with the actual rate of heat release. Temperature control alone may not be sufficient to assure high combustion efficiency, if oxygen depletion can take place even when temperatures are maintained.
Incinerators which are intermittently charged are prone to issue some smoke each time that they are charged, and risk smoke production many times in a single day. The causes of these visible emissions may be improper combustion, related to the composition of the waste and the charging cycle employed. Smoke may sometimes be observed for a few seconds or even minutes directly after the charging door has been opened and feed waste has been pushed into the incinerator, and also when the combustion is disturbed by stoking the burning mass. It is these emissions which attract attention to the incinerator.
Failure to maintain a "clear stack" is an indication to the public that good combustion is not taking place. Although an incinerator may pass particulate emissions tests which are performed periodically, the public is rightfully concerned that the incinerator be operated properly at all times. Opacity monitoring has been used for continuous supervision in the past. However, opacity monitors are not capable of detecting the low levels of emissions which are now required. A more sensitive means of monitoring combustion efficiency must be provided.
It is generally accepted that carbon monoxide (CO) emissions are an effective surrogate for emissions of other products of incomplete combustion. Tests of combustors burning gases or atomized liquids show that when CO emissions are low, the emissions of other
454
unburned or partially oxidized hydrocarbons are usually even lower [1].
The objective of this paper is to provide additional data, obtained from tests of medical waste (MW) and municipal solid waste (MSW) combustors, to shed additional light on the causes of incomplete combustion and to indicate how they can be avoided by proper control and operation of the combustion process.
COMBUSTION EFFICIENCY
Combustion efficiency may be defined as the ratio of the organic material destroyed, divided by the organic material entering the process. The organic material in the feed cannot easily be directly measured: however, the carbon emitted to the stack in the form of carbon dioxide (C02) represents the carbonaceous portion of the organic material which was destroyed, and the carbon monoxide (CO) emitted as the organic fraction which was not destroyed. It is convenient to use the CO as the indicator of good combustion. For this reason CO measurement is usually required during compliance testing, and continuous monitoring of CO can be used to assure good combustion at all times.
Combustion efficiency is usually calculated from measurements of the carbon which is completely oxidized, (C02), divided by the carbon input (C02 plus CO), both measured in the same location.
Thus:
Combustion Efficiency = (C02) / (C02 + CO)
The use of this measure of combustion efficiency is convenient because both the CO2 and the CO can be measured by continuous monitoring instruments. Alternately, since the sum of the CO2 plus O2 in the products of combustion (assuming no leakage of air) totals about 20% by dry volume, O2 measurements may also be used as a substitute in the equation:
Combustion Efficiency (20 - O2 + CO)
GOOD COMBUSTION PRACTICE
To assure that the organic materials are actually destroyed efficiently by waste combustors, the USEP A has developed "good combustion practice" (GCP) guidelines [2]. These say that the secondary chamber must have sufficient volume to provide a retention time of one second at a design temperature of 1800°F, and
that the gaseous reactants be effectively mixed. State requirements vary from those which require actual operation to be maintained within a range from 1800°F ± 200°F (that is, 1600-2000°F) to those which say "at least" 1800°F, or an average of 1800°F, but never less than 1600°F. The technical support for these requirements needs additional confirmation.
In addition to the design temperature requirements, the USEP A guidelines have established CO as the surrogate for good combustion, with limits ranging from 50 ppmv to 150 ppmv on long-term running averages, depending upon the technology employed. Some states require a combustion efficiency of 99.8% for large municipal waste combustors, the equivalent of 240 parts per million by volume (ppmv).
PRINCIPLES OF WASTE COMBUSTION
Solid waste combustion systems consist essentially of a waste charging means, a primary chamber in which the solid components burn out to ash, a secondary chamber or region where the volatile combustibles are burned out, and primary and secondary chamber air supply fans, air control dampers, and control devices which modulate the air supply to the various zones of admission. The gases are usually cooled by heat recovery boilers before the gases are discharged. The products of combustion may or may not then be cleaned by emission control devices before being exhausted to the stack.
Combustion occurs when oxygen is supplied to combustible materials at temperatures high enough to ignite the waste and sustain the combustion reactions. Since air is used to provide the oxygen, nitrogen is a necessary component of the gas streams supplied and exhausted from the incinerator. Heat released by the combustion process serves to heat up the incoming waste as well as the combustion air to the combustion temperatures. The temperatures which can be produced in this process can be calculated by performing a heat balance relating the heat released to the rise in temperature of the gases provided for combustion, plus the gases released by the waste.
Temperature Rise = (Net Heat Released)/(Mass
X Specific Heat)
The Heat Released depends upon the Net Heating Value (NHV) of the waste, which is roughly the Higher Heating Value (HHV) minus the heat required to evaporate the moisture in the waste. The mass of gases to be heated includes the total combustion air and the
455
u.. g 3500 o uj3000 a: � 2500 III 2000 0.. :;; 1500 I!! o 1000 � 500 ::::l
� a
I 1850< Btu! bl -r- - ---z � p 1650 Btu bl - +- -- �/ � ..... �t--* lsooc Btu/ bl .£ · s 1--.. •. � � I ). r;--/ [4< ioo B u/lb I-"" --r:::: '-
it'. V % pxyg n 5 8 1p 12 a 25 50 75 100 125 150 175 200 225 250 275 300
PERCENT OF THEORETICAL AIR
- Type a-Trash - #1-Rubbish ..... ----- Municipal - #2-Refuse
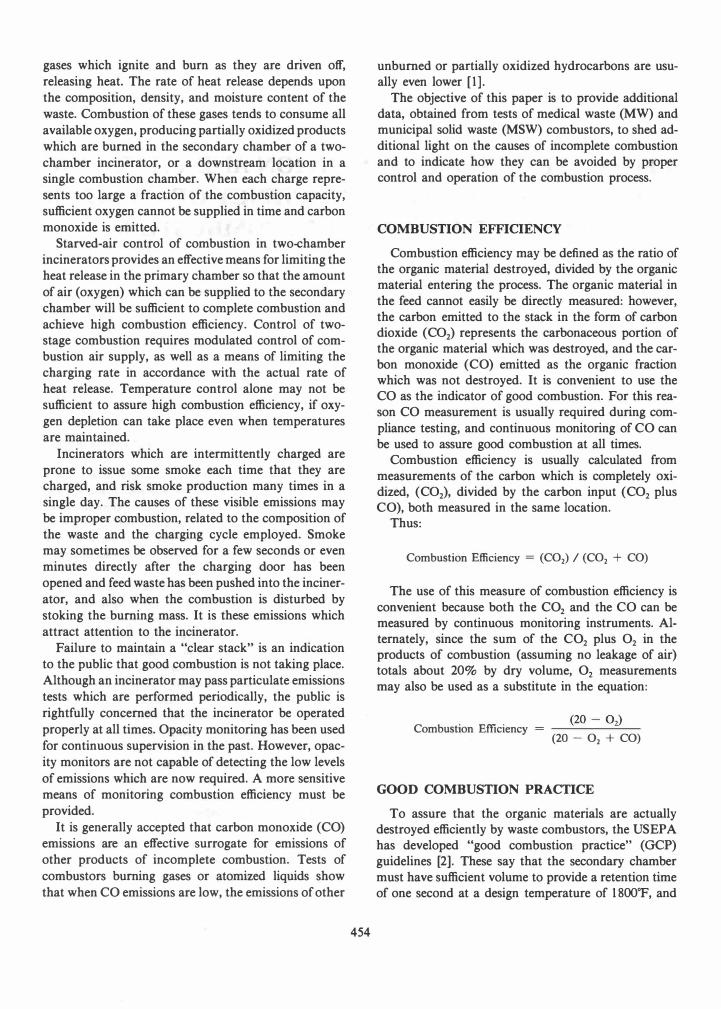
FIG. 1 CALCULATED TEMPERATURES VERSUS
THEORETICAL AIR AND WASTE TYPES AND HEATING VALUES
mass of fuel which is burned (including the moisture). The total combustion air includes the air needed to complete combustion plus any additional or excess air. The Temperature Rise is thus dependent on the composition of the waste, hence its heating value, and the amount of excess air supplied.
Figure 1 shows the temperatures calculated by performing a heat balance of the combustion of solid wastes having various heating values in Btu per pound, when supplied with different amounts of combustion air. A 10% reduction is assumed to allow for the heat loss through the furnace walls, and for unburned carbon remaining in the ash residues. If only exactly the theoretical (ideal) or stoichiometric air needed to oxidize (bum) all of the waste has been supplied, the highest (peak) temperature would occur. If less than sufficient air (starved air) is supplied, the resulting temperature is reduced, and the gases leaving the process contain combustible gases which may be burned in the next stage when additional air is supplied. If more than the ideal air (excess air) is supplied, all of the heat may be released, but since excess air is present, the resulting temperature will be reduced. The amount of excess air supplied determines the amount of excess oxygen which would remain after combustion.
The Higher Heating Value (HHV) of the waste greatly influences the amount of excess air and the excess oxygen remaining at different temperatures. Table 1 shows the composition of trash, and rubbish, refuse and garbage, according to the idealized standards of the Incineration Institute of America (IIA), and typical composition of MSW for comparison. The IIA standards assume that the moisture- and ash-free higher heating value (MAFHHV) is 10,000 Btu/lb. The municipal waste, containing today's levels of plas-
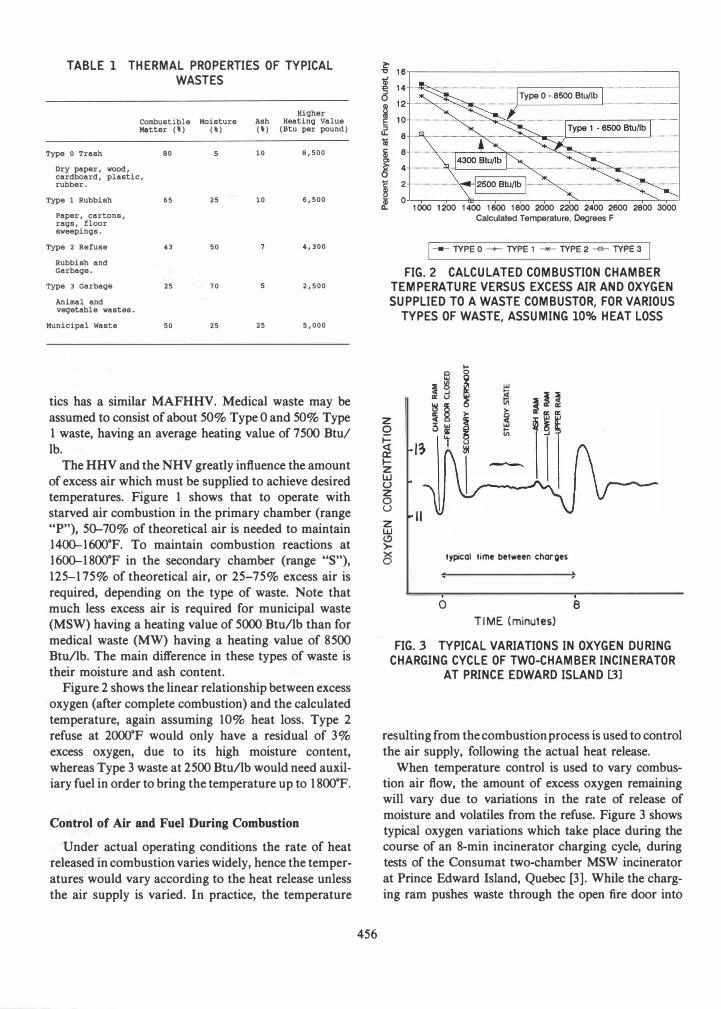
TABLE 1 THERMAL PROPERTIES OF TYPICAL
WASTES
Hiqher combustible Moisture Ash Heating Value MIltter (%) ( ') (%) (Btu per pound)
Type 0 Trash 80 10 a,500
Dry paper, wood I
cardboard, plastic, rubber.
Type 1 Rubbish 65 25 10 6,500
Paper, cartons I
rags, floor sweepings.
Type 2 Refuse 43 50 4,300
Rubbish and Garbage.
Type 3 Garbage 25 70 2,500
Animal and veqetable wastes.
Municipal waste 50 25 25 5,000
tics has a similar MAFHHV. Medical waste may be assumed to consist of about 50% Type 0 and 50% Type 1 waste, having an average heating value of 7500 Btu/ lb.
The HHV and the NHV greatly influence the amount of excess air which must be supplied to achieve desired temperatures. Figure 1 shows that to operate with starved air combustion in the primary chamber (range "P"), 50-70% of theoretical air is needed to maintain 1400-16oo°F. To maintain combustion reactions at 1600-18oo°F in the secondary chamber (range "S"), 125-175% of theoretical air, or 25-75% excess air is required, depending on the type of waste. Note that much less excess air is required for municipal waste (MSW) having a heating value of 5000 Btullb than for medical waste (MW) having a heating value of 8500 Btullb. The main difference in these types of waste is their moisture and ash content.
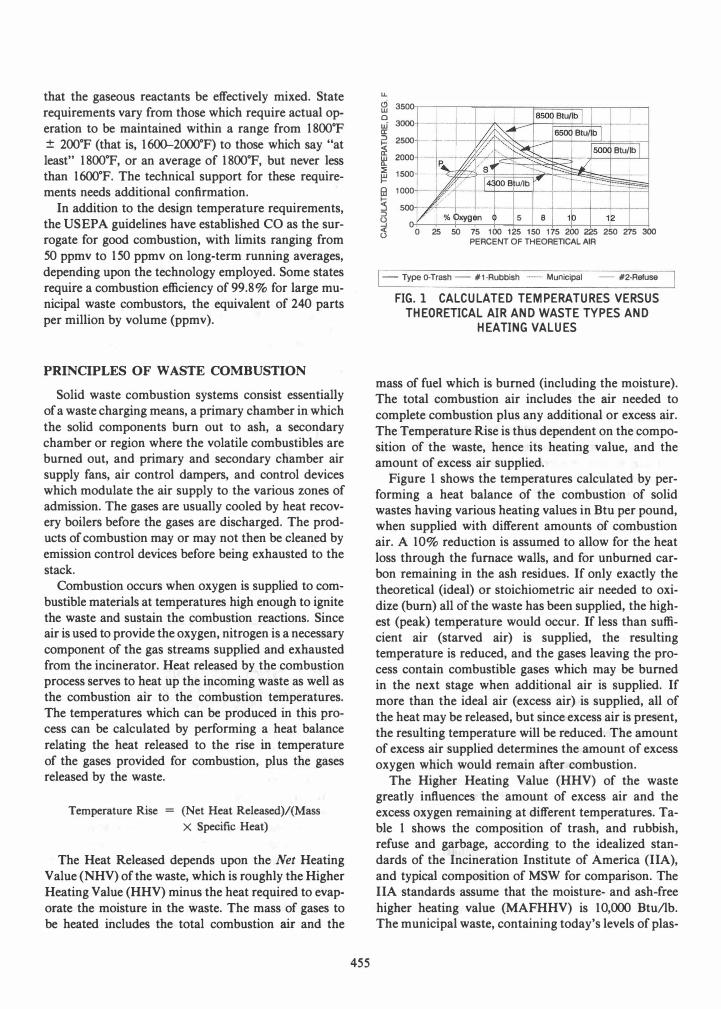
Figure 2 shows the linear relationship between excess oxygen (after complete combustion) and the calculated temperature, again assuming 10% heat loss. Type 2 refuse at 2ooo°F would only have a residual of 3% excess oxygen, due to its high moisture content, whereas Type 3 waste at 2500 Btullb would need auxiliary fuel in order to bring the temperature up to 18oo°F.
Control of Air and Fuel During Combustion
Under actual operating conditions the rate of heat released in combustion varies widely, hence the temperatures would vary according to the heat release unless the air supply is varied. In practice, the temperature
456
1!' " 16
4 14 --.-.. -.. ----0 Type 0 - 8500 Btu/lb
i 10
-.. �-----
:J u- 8 'iii � 8 .. -�-.--.-
'" g 1: 2 ---@ ., 0 ll- 1000 1200 1400 1800 1800 2000 2200 2400 2800 2800 3000
Calculated Temperature. Degrees F
1---- TYPE 0 -+-- TYPE 1 -->IE-- TYPE 2 -e- TYf:'E 3
FIG. 2 CALCULATED COMBUSTION CHAMBER TEMPERATURE VERSUS EXCESS AIR AND OXYGEN
SUPPLIED TO A WASTE COMBUSTOR, FOR VARIOUS
z o � a:: Iz W u z 8 z w (,!) > �
TYPES OF WASTE, ASSUMING 10% HEAT LOSS
... fa 0
� � � ... !<i �j! '" u t7) �� � i�� is � ...
� CI)
/; --...
II
typical time between charges
o 8 TIME (minutes)
FIG.3 TYPICAL VARIATIONS IN OXYGEN DURING
CHARGING CYCLE OF TWO-CHAMBER INCINERATOR AT PRINCE EDWARD ISLAND [3]
resulting from the combustion process is used to control the air supply, following the actual heat release.
When temperature control is used to vary combustion air flow, the amount of excess oxygen remaining will vary due to variations in the rate of release of moisture and volatiles from the refuse. Figure 3 shows typical oxygen variations which take place during the course of an 8-min incinerator charging cycle, during tests of the Consumat two-chamber MSW incinerator at Prince Edward Island, Quebec [3]. While the charging ram pushes waste through the open fire door into
,,;-1: o "
o
900 1000 1100 1200 1300 1400 1500 1600 1700 1800
Exposure temperature ( " F)
0.01 500 600 700 800 900
Exposure temperature (Oe) FIG.4 EFFECT OF OXYGEN CONCENT'RATION ON
DESTRUCTION OF PCB [4]
1000
the furnace, the oxygen excess rises to 13.5% due to air entering with the waste. After the fire door closes, a flash of combustion occurred, reducing the oxygen to about 11%. Later in the cycle, stoking action takes place as the lower, upper and ash rams are cycled, again causing consumption of oxygen.
The amount of oxygen available for combustion affects the rate at which most of the combustion reaction takes place. At lower oxygen levels, more time is required to complete the reactions. Since the residence time is built into the combustion chamber volume, lack of sufficient excess oxygen can result in producing organic emissions. In addition, low excess oxygen makes it more likely that pockets of fuel will not be mixed with the needed oxygen resulting in incomplete oxidation of combustibles.
Figure 4 shows how the amount of oxygen in the air (nitrogen) affects the destruction of pentachlorobiphenyl (PCB) at various temperatures. In pure nitrogen the quantity of PCB remaining was reduced to I % at about l8oo°F, whereas with 2.5% oxygen about l530°F achieved this reduction, and in air only l400°F was needed [4]. These data typically illustrate the effects of oxygen depletion. Other data produced at the University of Dayton shows that dioxins and furans are destroyed at temperatures as low as 13oo°F, whereas hexachlorobenzene requires l7oo°F to achieve 99.9 % destruction efficiency in a nonftame environment with adequate oxygen.
The combustion variations which occur during each charging cycle present a challenge to designers and
457
0: ::> 0 I 0: w "-w l-f/) � f/) 0 z ::> 0 "-
2500 ,----,----,---,----,----,----.2500
2000
1500
1000
a 0
0: " -..
... ,...
. ""-.. ... . . . 2000 �
0: W ... 1500 �
................... ... ..... ........................ 1000 � f/) o .f<:.�=r:::+:��'=--"""'r�:::t::::············ 500 §
60 120 180 240 TIME, MINUTES
300
o "-
�EAM FLOW, LBtH - LOADING RATE - CUMULATIVE RATE
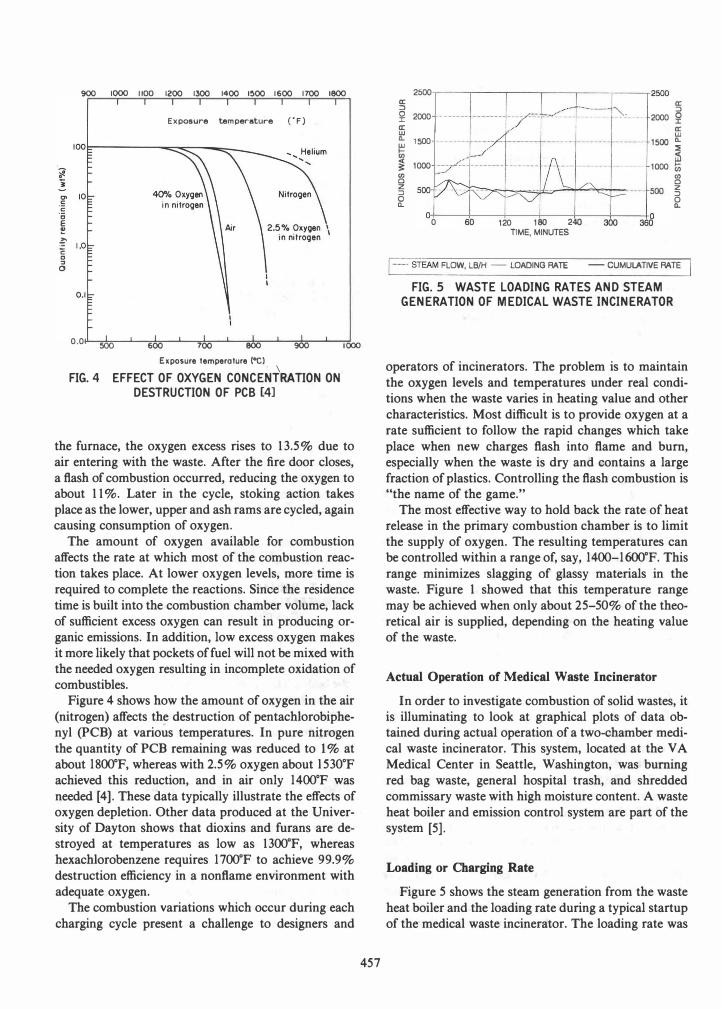
FIG.5 WASTE LOADING RATES AND STEAM GENERATION OF MEDICAL WASTE INCINERATOR
operators of incinerators. The problem is to maintain the oxygen levels and temperatures under real conditions when the waste varies in heating value and other characteristics. Most difficult is to provide oxygen at a rate sufficient to follow the rapid changes which take place when new charges flash into flame and burn, especially when the waste is dry and contains a large fraction of plastics. Controlling the flash combustion is "the name of the game."
The most effective way to hold back the rate of heat release in the primary combustion chamber is to limit the supply of oxygen. The resulting temperatures can be controlled within a range of, say, l400- l600°F. This range minimizes slagging of glassy materials in the waste. Figure 1 showed that this temperature range may be achieved when only about 25-50% of the theoretical air is supplied, depending on the heating value of the waste.
Actual Operation of Medical Waste Incinerator
In order to investigate combustion of solid wastes, it is illuminating to look at graphical plots of data obtained during actual operation of a two-chamber medical waste incinerator. This system, located at the V A Medical Center in Seattle, Washington, was burning red bag waste, general hospital trash, and shredded commissary waste with high moisture content. A waste heat boiler and emission control system are part of the system [5].
Loading or Charging Rate
Figure 5 shows the steam generation from the waste heat boiler and the loading rate during a typical startup of the medical waste incinerator. The loading rate was
about 700 lblhr during the first load, falling to as low as 300 lblhr during the first three hours. A severe overload of 1200 lblhr was fed, tapering down to 400 lblhr. The cumulative rate, or rolling average, shows a fairly consistent 500 lblhr loading rate. At one charge per 20 min, each charge weighed an average of 150 lb. This represents the average contents of each of the two-yard carts which were used at this hospital.
The frequency of charging should ideally be as short as practical, but in any case each charge should not be more than 25-35% of the hourly charging capacity. The volume and weight of waste per charge is built into the size of the feed hopper and/or the carts which may be used by a cart dumper. Peed cycles which are one-third of the hourly capacity are difficult to control due to the surge in combustion which results when each charge starts to burn. To avoid excessive peaks, it is preferable to limit each charge to 10% of hourly capacity which corresponds to a 6-min charging cycle.
Steam Generation
When a waste heat boiler is part of the system, the steam flow can be used as an indication of the heat released by burning the waste. The steam output increased gradually during the first three hours, then stabilized, although the waste was being fed steadily. The discrepancy between heat release and steam generated reflects the heat which is absorbed by the refractory walls, and the gradual increase in secondary chamber exit gas temperature from about 14000P to over 2000oP. After conditions were steady, the 2200 lblhr of steam at 500 lblhr of feed indicates that 4.4 lb of steam were generated per pound of waste. Assuming a boiler/incinerator efficiency of 50% , the heating value was about 8800 Btu per pound of waste.
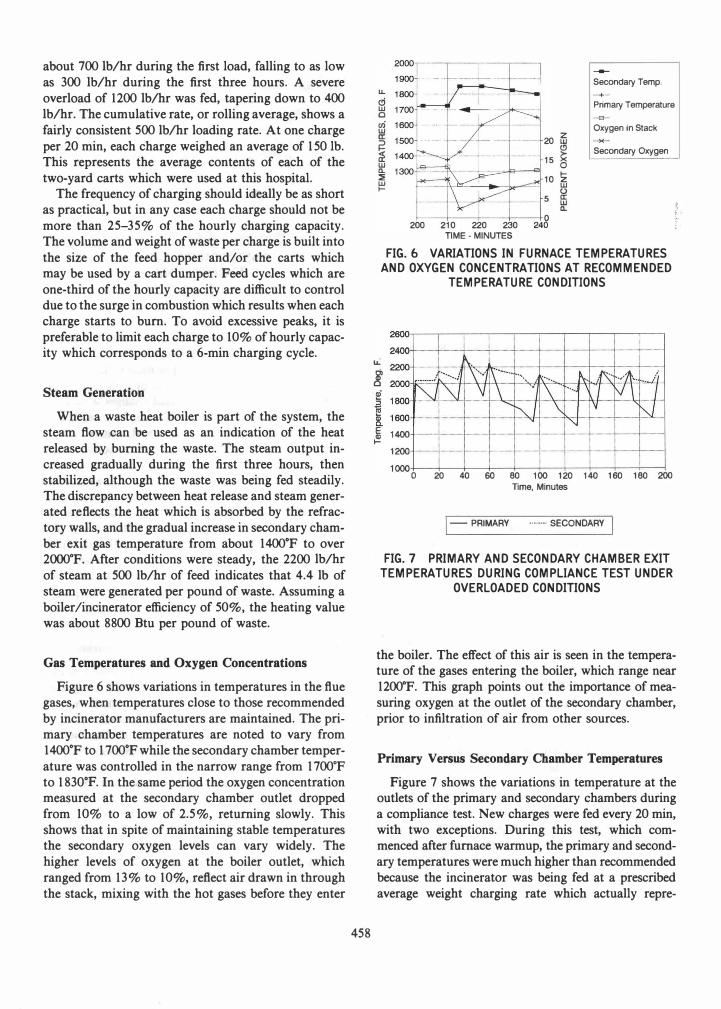
Gas Temperatures and Oxygen Concentrations
Pigure 6 shows variations in temperatures in the flue gases, when temperatures close to those recommended by incinerator manufacturers are maintained. The primary chamber temperatures are noted to vary from 14000P to 17000P while the secondary chamber temperature was controlled in the narrow range from 17000P to 1830"F. In the same period the oxygen concentration measured at the secondary chamber outlet dropped from 10% to a low of 2.5% , returning slowly. This shows that in spite of maintaining stable temperatures the secondary oxygen levels can vary widely. The higher levels of oxygen at the boiler outlet, which ranged from 13% to 10%, reflect air drawn in through the stack, mixing with the hot gases before they enter
458
c; w o <Ii w a:
� w c.. ::< �
20 15 C!l
15 g --+-=0--13-""1
1 0 �
200 210 220 230 TIME - MINUTES
w () 5 ffi c..
---
Secondary Temp.
Primary Temperature
Oxygen in Stack
Secondary Oxygen
FIG. 6 VARIATIONS IN FURNACE TEMPERATURES AND OXYGEN CONCENTRATIONS AT RECOMMENDED
TEMPERATURE CONDITIONS
2600,--,---,--,--,--,---,--,--,--,--,
2400+--f---+---+--�
g 22001�·�h_���-f+�_.4
i :: _.- .. ��� _��1 __ . - - - -
� :: -- w-· + -t---+---+-t-=:�: 1000+--f---+--- +--f---+---+--+--4--- �� o 20 40 60 80 100 120 140 160 180 200
Time, Minutes
1- PRIMARY -....... SECONDARY
FIG. 7 PRIMARY AND SECONDARY CHAMBER EXIT
TEMPERATURES DURING COMPLIANCE TEST UNDER
OVERLOADED CONDITIONS
the boiler. The effect of this air is seen in the temperature of the gases entering the boiler, which range near 12oooP. This graph points out the importance of measuring oxygen at the outlet of the secondary chamber, prior to infiltration of air from other sources.
Primary Versus Secondary Chamber Temperatures
Pigure 7 shows the variations in temperature at the outlets of the primary and secondary chambers during a compliance test. New charges were fed every 20 min, with two exceptions. During this test, which commenced after furnace warmup, the primary and secondary temperatures were much higher than recommended because the incinerator was being fed at a prescribed average weight charging rate which actually repre-
14.------------------.120 > z w
:::E -- 100 �
� � w () ffi 4 Cl.
2
20 40 60 80 100 120 TIME, MINUTES
140 160 180
1--- Carbon Monoxide --+-- Secondary Oxygen
80
60
40
20
0 200
FIG.8 OXYGEN AND CO MEASURED DURING TEST
SHOWING CO SPIKE AND LOW OXYGEN DURING
OVERLOAD
ui 0 X 0 Z 0 :::E Z 0 III II: « ()
sented overloading. The heat content of the waste was probably higher than anticipated.
After each charge the primary chamber exit temperature rises rapidly, peaking and usually driving the secondary temperature to the same peak. The primary temperature then drops rapidly, as the fixed carbon generates less heat, while the secondary temperature remains more stable as volatile gases continue to be burned there. When feed cycles were omitted the primary temperature was able to fall back toward the preferred upper limit of 2()()()OF. The temperature control system was unable to maintain the limit of 2()()()OF because the combustion air fans had no more capacity.
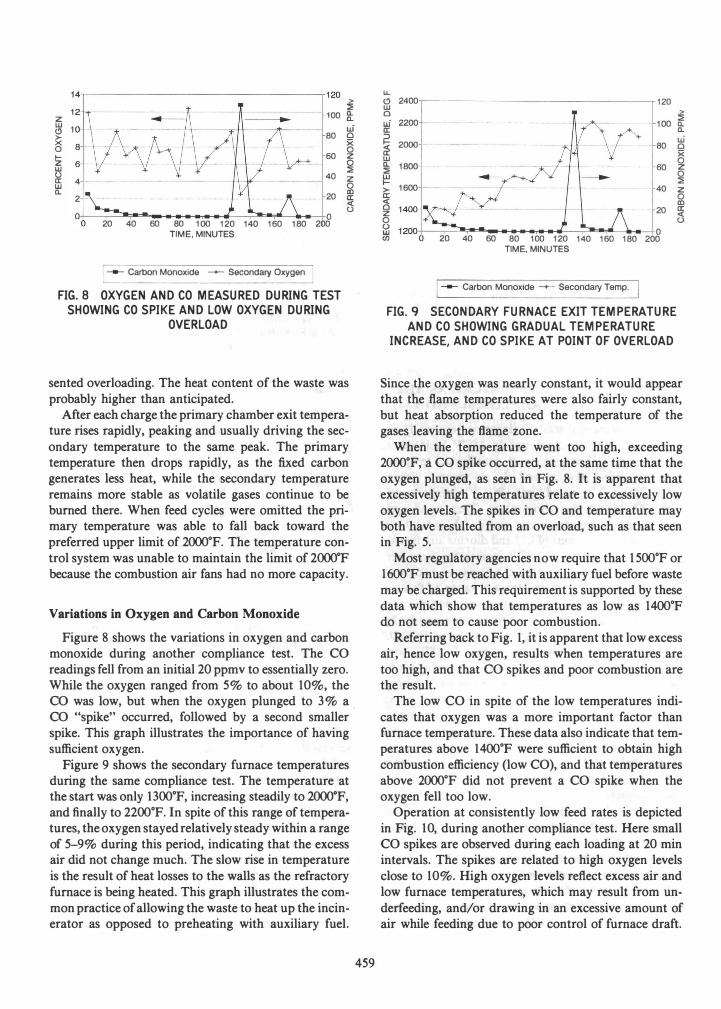
Variations in Oxygen and Carbon Monoxide
Figure 8 shows the variations in oxygen and carbon monoxide during another compliance test. The CO readings fell from an initial 20 ppmv to essentially zero. While the oxygen ranged from 5% to about 10% , the CO was low, but when the oxygen plunged to 3% a , CO "spike" occurred, followed by a second smaller spike. This graph illustrates the importance of having sufficient oxygen.
Figure 9 shows the secondary furnace temperatures during the same compliance test. The temperature at the start was only 1300°F, increasing steadily to 2()()()OF, and finally to 2200°F. In spite of this range of temperatures, the oxygen stayed relatively steady within a range of 5-9% during this period, indicating that the excess air did not change much. The slow rise in temperature is the result of heat losses to the walls as the refractory furnace is being heated. This graph illustrates the common practice of allowing the waste to heat up the incinerator as opposed to preheating with auxiliary fuel.
459
u. CJ 2400 120 w > 0 ui 2200 100 � II:
� 2000 80 w Cl. 1800 60 :::E w � >- 1600 40 II: « 0 20 Z 0 () 0 w CIl 20 40 60 80 100 120 140 160 180 200
TIME, MINUTES
1--- Carbon Monoxide --+-- Secondary Temp,
FIG.9 SECONDARY FURNACE EXIT TEMPERATURE
AND CO SHOWING GRADUAL TEMPERATURE INCREASE, AND CO SPIKE AT POINT OF OVERLOAD
Cl. ui 0 X 0 Z 0 :::E z 0 III II: « ()
Since the oxygen was nearly constant, it would appear that the flame temperatures were also fairly constant, but heat absorption reduced the temperature of the gases leaving the flame zone.
When the temperature went too high, exceeding 2()()()OF, a CO spike occurred, at the same time that the oxygen plunged, as seen in Fig. 8. It is apparent that excessively high temperatures relate to excessively low oxygen levels. The spikes in CO and temperature may both have resulted from an overload, such as that seen in Fig. 5.
Most regulatory agencies now require that 1500°F or 1600°F must be reached with auxiliary fuel before waste may be charged. This requirement is supported by these data which show that temperatures as low as 1400°F do not seem to cause poor combustion.
Referring back to Fig. 1, it is apparent that low excess air, hence low oxygen, results when temperatures are too high, and that CO spikes and poor combustion are the result.
The low CO in spite of the low temperatures indicates that oxygen was a more important factor than furnace temperature. These data also indicate that temperatures above 1400°F were sufficient to obtain high combustion efficiency (low CO), and that temperatures above 2()()()OF did not prevent a CO spike when the oxygen fell too low.
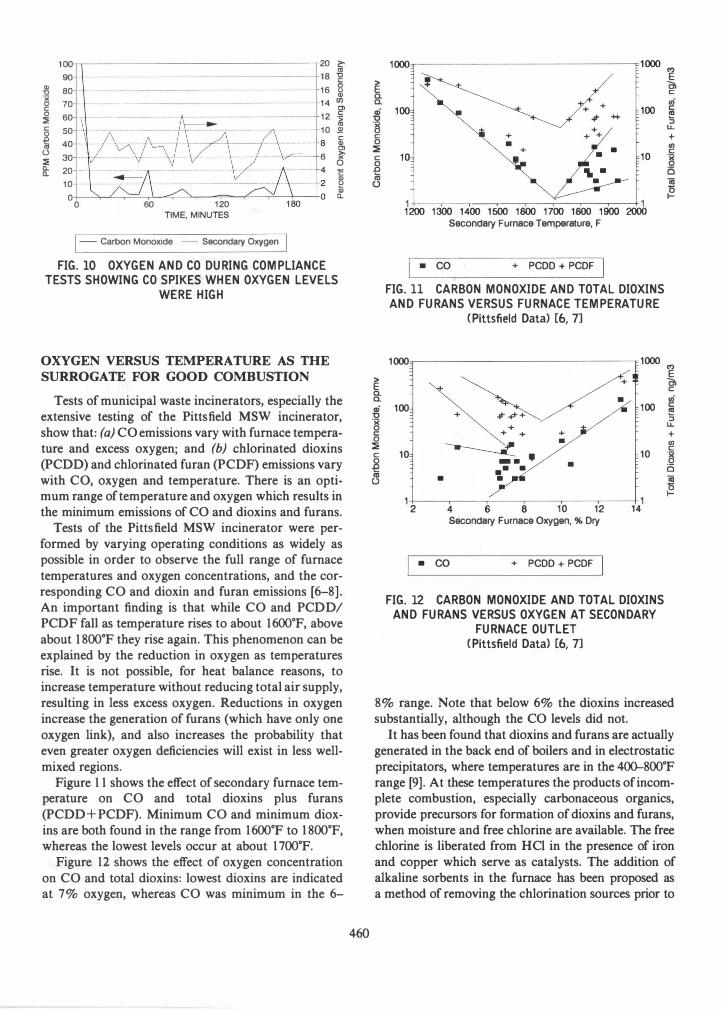
Operation at consistently low feed rates is depicted in Fig. 10, during another compliance test. Here small CO spikes are observed during each loading at 20 min intervals. The spikes are related to high oxygen levels close to 10%. High oxygen levels reflect excess air and low furnace temperatures, which may result from underfeeding, and/or drawing in an excessive amount of air while feeding due to poor control of furnace draft.
100 20 � '" 90 --- 18 -g
'" - 16 0 80 " "0 '" ·x 14 rg, 0 70 c 0 60 12 .� ::;
c 50 10 El � --8 c 40 '" Ol (.) 30 6 S<' ::; 0 0- 20 4 C 0- 0> 10 f:! 0>
0 0-0 60 120
TIME, MINUTES
1- Carbon Monoxide - Secondary Oxygen
FIG.10 OXYGEN AND CO DURING COMPLIANCE TESTS SHOWING CO SPIKES WHEN OXYGEN LEVELS
WERE HIGH
OXYGEN VERSUS TEMPERATURE AS mE
SURROGATE FOR GOOD COMBUSTION
Tests of municipal waste incinerators, especially the extensive testing of the Pittsfield MSW incinerator, show that: (a) CO emissions vary with furnace temperature and excess oxygen; and (b) chlorinated dioxins (PCDD) and chlorinated furan (PCDF) emissions vary with CO, oxygen and temperature. There is an optimum range of temperature and oxygen which results in the minimum emissions of CO and dioxins and furans.
Tests of the Pittsfield MSW incinerator were performed by varying operating conditions as widely as possible in order to observe the full range of furnace temperatures and oxygen concentrations, and the corresponding CO and dioxin and furan emissions [6-8]. An important finding is that while CO and PCDD/ PCDF fall as temperature rises to about 1600°F, above about 1800°F they rise again. This phenomenon can be explained by the reduction in oxygen as temperatures rise. It is not possible, for heat balance reasons, to increase temperature without reducing total air supply, resulting in less excess oxygen. Reductions in oxygen increase the generation of furans (which have only one oxygen link), and also increases the probability that even greater oxygen deficiencies will exist in less wellmixed regions.
Figure 11 shows the effect of secondary furnace temperature on CO and total dioxins plus furans (PCDD+ PCDF). Minimum CO and minimum dioxins are both found in the range from 1600°F to 1800°F, whereas the lowest levels occur at about 1700°F.
Figure 12 shows the effect of oxygen concentration on CO and total dioxins: lowest dioxins are indicated at 7% oxygen, whereas CO was minimum in the 6-
460
> E a. a. <Ii u ·x 0 c 0 � c 0 .0 iii
()
> E a. a. <Ii u "§ C 0 � c � <IS ()
1000 1000 !t!
+ + 100 # ++-+ + +
+ • 10
1 ----r 1 1�1�1�1�1�1�1�1��
Secondary Furnace Temperature, F
[". CO + PCDD + PCDF I FIG.11 CARBON MONOXIDE AND TOTAL DIOXINS
AND FURANS VERSUS FURNACE TEMPERATURE
(Pittsfield Data) [6, 7]
1000
100
10
1 2
I •
FIG. 12
�� � . _. '
• •• •
• •
4 6 8 10 12 Secondary Furnace Oxygen, % Dry
CO + PCDD + PCDF
1000
100
10
1 14
CARBON MONOXIDE AND TOTAL DIOXINS
AND FURANS VERSUS OXYGEN AT SECONDARY FURNACE OUTLET
(Pittsfield Data) [6, 7]
.., E "0 c ui c � :J u. + U'J c .§ is OJ 0 I-
.., E "0 c ui c � :J U. + U'J c x 0 is OJ 0 I-
8% range. Note that below 6% the dioxins increased substantially, although the CO levels did not.
It has been found that dioxins and furans are actually generated in the back end of boilers and in electrostatic precipitators, where temperatures are in the 400-800°F range [9]. At these temperatures the products of inc omplete combustion, especially carbonaceous organics, provide precursors for formation of dioxins and furans, when moisture and free chlorine are available. The free chlorine is liberated from HCI in the presence of iron and copper which serve as catalysts. The addition of alkaline sorbents in the furnace has been proposed as a method of removing the chlorination sources prior to
> � a.. a.. ui 0 X 0 z 0 � z 0 ID ex: C3
25
20
15
10
5
\ ,.
/ ,.
,.,,
� •
/ •
,. • ,. • ,. ,. �
�3OO 1400 1500 1600 1700 1800 1900 2000 2100 2200 23 00 SECONDARY CHAMBER TEMPERATURE, ?F
FIG.13 SECONDARY CHAMBER OUTLET TEMPERATURE VERSUS CO DURING TESTS OF
MEDICAL WASTE INCINERATOR SHOWING LOW CO WHEN TEMPERATURES RANGE FROM 1600"F TO
1850"F [5]
> E a. a. .; u -g c: 0 � c:
� ()
120
100
80
60
40
�-----------------------------.2500' �
--- 2000 i + + e
--���L-___ -+�+�+��_-_-�+ :�:======:J1
5OO t E
1000 � - - - -- ------1 i 20- � _
__ ____ .,........L-_-{ 500 � ,. ,. ��.� � 0 2 3 4 5 6 7 8 9 10 11 12 130
% Oxygen leaving Secondal)' Chamber
[,. CO + Temperature I FIG.14 CARBON MONOXIDE AND SECONDARY
CHAMBER OUTLET TEMPERATURE VERSUS OXYGEN CONCENTRATION [5]
the temperature regions favorable to chlorinated organic formation [10]. Good combustion reduces the carbonaceous materials, thus limiting the production of PCDD/PCDF [7, 9].
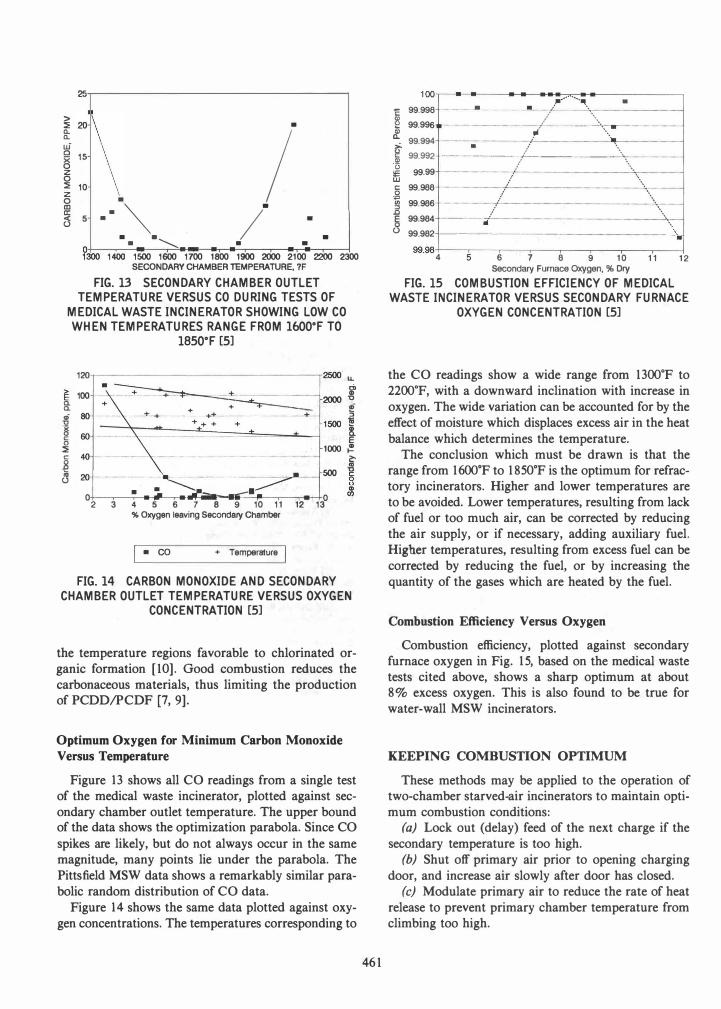
Optimum Oxygen for Minimum Carbon Monoxide
Versus Temperature
Figure 13 shows all CO readings from a single test of the medical waste incinerator, plotted against secondary chamber outlet temperature. The upper bound of the data shows the optimization parabola. Since CO spikes are likely, but do not always occur in the same magnitude, many points lie under the parabola. The Pittsfield MSW data shows a remarkably similar parabolic random distribution of CO data.
Figure 14 shows the same data plotted against oxygen concentrations. The temperatures corresponding to
461
100,-�� ----����� .. -----------, 99.996 ,. ------ j" ........ "'
..
,.
� 99.996 -.----. ---.. -----1.---- ..... -.-._.-----� " .... . 99.994
. ------�---------I � ,. .' .. . � 99.992-----------
/--------
... . \ .--
ii: 99.99 r----·--;-- . UJ : § 99.966 ----/!.....-----------.-....:\� .. . ., . .o� 99.966 c--------.:/'-------.---------
'\\ E 99.964 ------.. :I-:------------------------"c--.. -I 8 99.962 - --.. ---________ . _____ _______ -'\ ...
99.96+--�
--.-----r----,--_,_-____.-___r-__/ 4 5 6 7 6 9 10 11 12
Secondal)' Furnace Oxygen, % Dry FIG. 15 COM BUSTION EFFICIENCY OF MEDICAL
WASTE INCINERATOR VERSUS SECONDARY FURNACE
OXYGEN CONCENTRATION [5]
the CO readings show a wide range from 1300"F to 2200"F, with a downward inclination with increase in oxygen. The wide variation can be accounted for by the effect of moisture which displaces excess air in the heat balance which determines the temperature.
The conclusion which must be drawn is that the range from 1600"F to 1850°F is the optimum for refractory incinerators. Higher and lower temperatures are to be avoided. Lower temperatures, resulting from lack of fuel or too much air, can be corrected by reducing the air supply, or if necessary, adding auxiliary fuel. Higher temperatures, resulting from excess fuel can be corrected by reducing the fuel, or by increasing the quantity of the gases which are heated by the fuel.
Combustion Efficiency Versus Oxygen
Combustion efficiency, plotted against secondary furnace oxygen in Fig. 15, based on the medical waste tests cited above, shows a sharp optimum at about 8% excess oxygen. This is also found to be true for water-wall MSW incinerators.
KEEPING COMBUSTION OPTIMUM
These methods may be applied to the operation of two-chamber starved-air incinerators to maintain optimum combustion conditions:
(a) Lock out (delay) feed of the next charge if the secondary temperature is too high.
(b) Shut off primary air prior to opening charging door, and increase air slowly after door has closed.
(c) Modulate primary air to reduce the rate of heat release to prevent primary chamber temperature from climbing too high.
(d) Maintain minimum draft in furnace to reduce air leakage.
(e) Add water or steam to primary chamber to reduce oxygen supply if primary temperature cannot be limited otherwise.
(j) Increase secondary air flow to reduce secondary temperature.
The above actions may take place under the direction and control of the primary chamber temperature control, the secondary chamber temperature control, and (if provided) an oxygen measuring control at the exit of the secondary chamber.
It is also possible to use the opacity meter as a control, to lock out feed, reduce primary air supply, or inject water or steam into the primary chamber, if an increase in opacity is indicated.
The operator can still defeat the controls by overloading the incinerator so that even with the air control dampers wide open the temperatures still rise and oxygen falls, resulting in CO spikes. The operator must observe the operation, note the conditions which indicate excessive feeding, and take action to avoid repeating overloads. Alarms, which are recorded automatically, are probably the best means for disciplining operators to avoid overloads. Under-loading is costly in auxiliary fuel used to maintain chamber temperatures when waste feeding is inadequate, and also results in failure to use incinerator capacity.
CONCLUSIONS
The data obtained from the extensive testing of a medical waste incinerator has been useful in illustrating the principles of two-stage starved-air combustion. Similar findings are noted in tests of a MSW combustion system. It appears that insufficient oxygen in the secondary chamber is the main cause of poor combustion, and that a wide range of operating temperatures
462
from 1600°F to 1850°F is optimum. Higher temperatures were found to be associated with CO spikes, and lower temperatures associated with excess air also produced spikes.
Automatic methods for maintaining these optimum conditions are readily available, but operator attention is still needed to avoid excessive feeding.
REFERENCES
[1] Kramlich, J. V., et al. "Laboratory Scale Flame-mode Hazardous Waste Thermal Destruction Research," EPA Contract No. 68-03-3113, Cincinnati, Ohio: EPA Industrial Environmental Research Laboratory. 1982.
[2] United States EPA. "Municipal Waste Combustion Study," USEPA, RTP, North Carolina, 1987.
[3] NITEP. "Two-stage Combustion, Prince Edward Island," EPS 3/uP /1, 1985, Ottawa, Ontario, Canada: Environment Canada.
[4] Dellinger, B., et al. "Laboratory determinations of high temperature decomposition behavior of industrial organic materials," 75th Annual Meeting of APCA, New Orleans, 1982.
[5] Tests of medical waste incinerator at Veterans Memorial Hospital, Seattle, Washington. Data analysis by F. Hasselriis.
[6] Hasselriis, F. "Optimization of Combustion Conditions to Minimize Dioxin Emissions," Waste Management and Research 5, 3, 1987,311-326.
[7] Hasselriis, F. "How Control of Combustion, Emissions and Ash Residues from Municipal Solid Waste can Minimize Environmental Risk," presented at the AIChE Spring National Meeting in New Orleans, March 1988; published in AIChE Symposium Series, 84,265, 1988.
[8] Visalli, J. "Results of the Combustion and Emissions Research Project at the Vicon Incinerator Facility in Pittsfield, Massachusetts," New York State Energy Research and Development Authority Report 87-16, Kansas City, Missouri: Midwest Research Institute, June 1987.
[9] Vogg, H., Metzger, M. and Steiglitz, L. "Recent Findings on the Formation and Decomposition of PCDD/PCDF in Solid Waste Incineration," Waste Management and Research 5, 3, 1987.
[10] Gullett, Brian K., Bruce, K. R., and Beach, L. O. "Formation Mechanisms of Chlorinated Organics and Impacts of Sorbent Injection," International Conf. on Municipal Waste Combustion, Hollywood, Florida, April 1989.
Key Words: Combustion; Incineration; Emissions; Carbon Monoxide, Combustion Efficiency; Oxygen Deficiency; Trace Organics; Dioxins