Embed Size (px)
Citation preview
RESEARCH ARTICLE Open Access
Effect of vitamin K2 on the anticoagulantactivity of warfarin during the perioperativeperiod of catheter ablation: Populationanalysis of retrospective clinical dataZhi Zhou1,2, Ikuko Yano1,3* , Sumiko Odaka1, Yosuke Morita1, Satoshi Shizuta4, Mamoru Hayano4, Takeshi Kimura4,Akinori Akaike2, Ken-ichi Inui1 and Kazuo Matsubara1
Abstract
Background: Catheter ablation is a non-medication therapy for atrial fibrillation, and during the procedure, warfarinis withdrawn in the preoperative period to prevent the risk of bleeding. In case of emergency, vitamin K2 can beintravenously administered to antagonize the anticoagulant activity of warfarin. The aims of this study were toconduct population pharmacokinetic/pharmacodynamic modeling for retrospective clinical data and to investigatethe effect of vitamin K2 on the anticoagulant activity of warfarin in the perioperative period of catheter ablation.
Methods: A total of 579 international normalized ratio (INR) values of prothrombin time from 100 patients wereanalyzed using the nonlinear mixed-effects modeling program NONMEM. A 1-compartment model was adaptedto the pharmacokinetics of warfarin and vitamin K2, and the indirect response model was used to investigate therelationship between plasma concentration and the pharmacodynamic response of warfarin and vitamin K2.Since no plasma concentration data for warfarin and vitamin K2 were available, 3 literally available pharmacokineticparameters were used to simultaneously estimate 1 pharmacokinetic parameter and 5 pharmacodynamicparameters.
Results: The population parameters obtained not only successfully explained the observed INR values, but alsoindicated an increase in sensitivity to warfarin in patients with reduced renal function. Simulations using theseparameters indicated that vitamin K2 administration of more than 20 mg caused a slight dose-dependent decreasein INR on the day of catheter ablation and a delayed INR elevation after warfarin re-initiation.
Conclusions: A pharmacokinetic/pharmacodynamic model was successfully built to explain the retrospective INRdata during catheter ablation. Simulation studies suggest that vitamin K2 should be administered with care and thatmore than 20 mg is unnecessary in the preoperative period of catheter ablation.
Keywords: Warfarin, Vitamin K2, Pharmacodynamics, INR, NONMEM, Catheter ablation
* Correspondence: [email protected] of Clinical Pharmacology and Therapeutics, Kyoto UniversityHospital, Sakyo-ku, Japan3Department of Clinical Pharmacy and Education, Graduate School ofPharmaceutical Sciences, Kyoto University, Sakyo-ku, Kyoto, JapanFull list of author information is available at the end of the article
© 2016 The Author(s). Open Access This article is distributed under the terms of the Creative Commons Attribution 4.0International License (http://creativecommons.org/licenses/by/4.0/), which permits unrestricted use, distribution, andreproduction in any medium, provided you give appropriate credit to the original author(s) and the source, provide a link tothe Creative Commons license, and indicate if changes were made. The Creative Commons Public Domain Dedication waiver(http://creativecommons.org/publicdomain/zero/1.0/) applies to the data made available in this article, unless otherwise stated.
Zhou et al. Journal of Pharmaceutical Health Care and Sciences (2016) 2:17 DOI 10.1186/s40780-016-0053-8
BackgroundAtrial fibrillation is the most common sustained cardiacarrhythmia and a major cause of stroke [1, 2]. In orderto prevent stroke, an anticoagulant drug, warfarin, isusually used since aspirin was proven ineffective inretrospective analyses [3]. The anticoagulant effect ofwarfarin does not always correlate with its dose, andpolymorphisms in cytochrome P450 (CYP) 2C9 andvitamin K epoxide reductase complex subunit 1(VKORC1) genes have been proven to influence interin-dividual variability in the optimal doses, in addition topatients’ primary diseases and characteristics such asage or ethnicity [4, 5]. In Japanese patients, warfarin doseadjustments based on their prothrombin time, an inter-national normalized ratio (INR) of 1.6–2.6 (age ≥ 70 years)or 2.0-3.0 (age < 70 years), are recommended for effectivetherapy to avoid life-threatening bleeding [6, 7]. Whenhemorrhagic complications occur, warfarin withdrawal isrequired and vitamin K2 or fresh frozen plasma adminis-tration is recommended [8–10].In atrial fibrillation treatment, antiarrythmic agents are
often used, while catheter ablation is also an availableoption as a non-medication therapy [2]. When catheterablation, an invasive procedure for complete cure ofatrial fibrillation, is selected, anticoagulant therapy withwarfarin is withdrawn in the preoperative period to pre-vent the risk of bleeding, although catheter ablation issometimes performed in periprocedural therapeuticanticoagulation with warfarin if possible. In some pa-tients, discontinuation of warfarin is not sufficient tolower the INR to the required level before catheter abla-tion. In such cases, vitamin K2 is intravenously adminis-tered to antagonize the anticoagulant activity of warfarinresulting in prompt recovery of INR to a safe level. Somereports have mentioned the use of pharmacokinetic/pharmacodynamic models for an anticoagulant drug andhave conducted population analyses; however, only war-farin was investigated using these models [11, 12]. Theeffect of vitamin K2 dose on controlling the anticoagu-lant activity of warfarin during the perioperative periodof catheter ablation has not yet been reported. The aimsof this study are to build a population pharmacokinetic/pharmacodynamic model not only for warfarin, but alsofor vitamin K2, by using routine clinical data of patientswho had been diagnosed with atrial fibrillation and re-ceived a catheter ablation, and to obtain information onthe optimal vitamin K2 dose in the preoperative periodbefore catheter ablation.
MethodsPatients and data studiedWe retrospectively collected data from patients who havehad a catheter ablation for atrial fibrillation at the De-partment of Cardiovascular Medicine, Kyoto University
Hospital from January to December in 2008. During thisperiod, 126 Japanese patients underwent catheter ablation,and 111 of these patients were treated with warfarin on theday of admission. A total of 100 patients whose INR valueswere between 1.0 and 3.0 in the hospitalization period wereincluded in this study. We used 579 INR values obtainedfrom 100 patients during the perioperative period. Clinicallaboratory data and medication history for the patientsstudied were collected from electrical medical records. Nopatients were taking any medications that may have clinic-ally significantly altered the pharmacokinetics of warfarin,except 4 patients with amiodaron and 1 patient with buco-lome [13, 14].
Pharmacokinetic/pharmacodynamic model buildingA 1-compartment model was adopted to the pharmaco-kinetics of warfarin and vitamin K2 as follows (Fig. 1):
d Cp1 � Vd1ð Þ=dt ¼ −k10 � Cp1 � Vd1ð Þ ð1Þ
d Cp3 � Vd3ð Þ=dt ¼ −k30 � Cp3 � Vd3ð Þ ð2Þ
where Cp1 and Cp3 represent the plasma concentra-tion of warfarin and vitamin K2, respectively; and Vd1and Vd3 represent the distribution volume; and k10 andk30 represent the elimination rate constant for eachdrug, respectively. Since no plasma concentration datawere available for warfarin and vitamin K2, and INRvalues were the available data for this study, reportedpharmacokinetic parameters for warfarin in Japanese pa-tients [11] and the distribution volume for vitamin K2 inthe product information (Eisai Co., Ltd., Tokyo, Japan)were used in the analysis: k10 = 0.0129 (1/h), Vd1 = 0.183(L/kg) and Vd3 = 0.051 (L/kg). Therefore, k30 was theonly pharmacokinetic parameter to be estimated in thisanalysis.The indirect response model was used to explain the re-
lationship between plasma concentration and pharmaco-dynamic response of warfarin and vitamin K2 [11, 14–16].In this model, the amount of clotting factors was de-scribed using a zero-order synthesis rate constant (ks) anda first-order degradation rate constant (kd) under the hy-pothesis that coagulant activity was proportional to theamount of clotting factors (Fig. 1). Since both warfarinand vitamin K2 target the same enzyme that is responsiblefor clotting factor synthesis [17], the maximum effectmodels were adopted to describe stimulatory and inhibi-tory activities of these drugs, respectively, as follows:
dðTTÞ=dt ¼ ks � ð1�Cp1=ðCp1 þ IC50Þþ Emax � Cp3=ðCp3 þ EC50ÞÞ−kd � TT
ð3Þ
where ks, kd, IC50, Emax, and EC50 represent synthesisrate constant (%/h), degradation rate constant (1/h),50 % inhibitory concentration of warfarin (μg/mL),
Zhou et al. Journal of Pharmaceutical Health Care and Sciences (2016) 2:17 Page 2 of 10
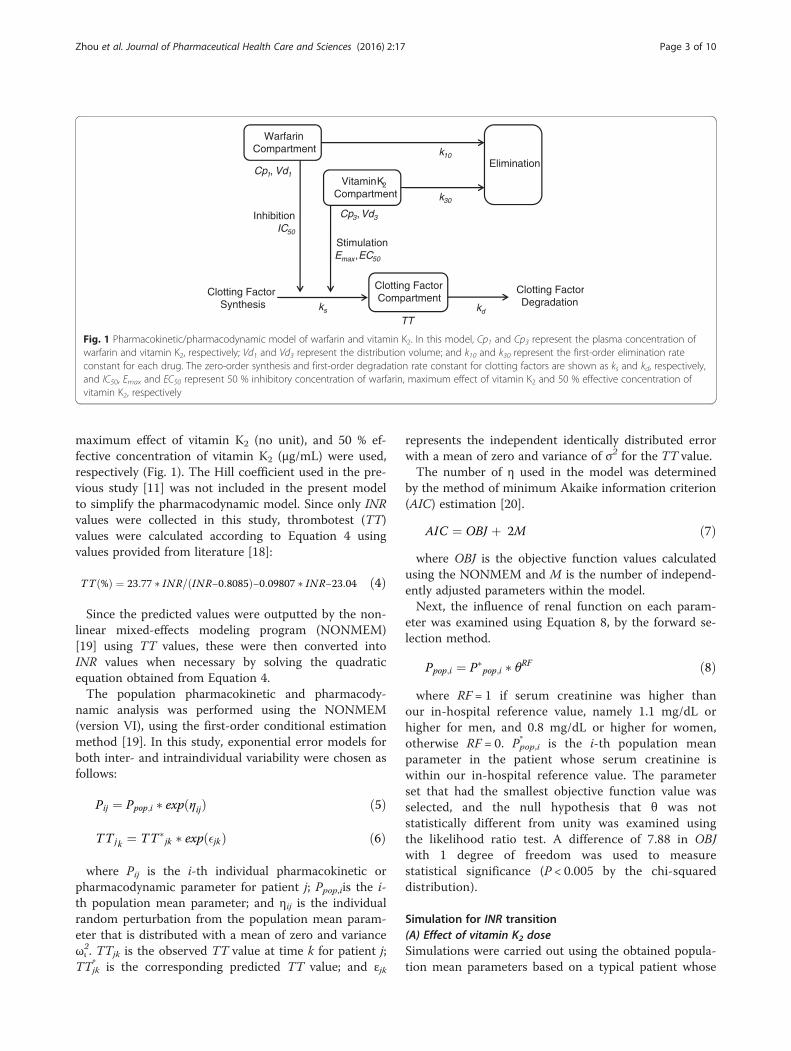
maximum effect of vitamin K2 (no unit), and 50 % ef-fective concentration of vitamin K2 (μg/mL) were used,respectively (Fig. 1). The Hill coefficient used in the pre-vious study [11] was not included in the present modelto simplify the pharmacodynamic model. Since only INRvalues were collected in this study, thrombotest (TT)values were calculated according to Equation 4 usingvalues provided from literature [18]:
TTð%Þ ¼ 23:77 � INR=ðINR−0:8085Þ−0:09807 � INR−23:04 ð4Þ
Since the predicted values were outputted by the non-linear mixed-effects modeling program (NONMEM)[19] using TT values, these were then converted intoINR values when necessary by solving the quadraticequation obtained from Equation 4.The population pharmacokinetic and pharmacody-
namic analysis was performed using the NONMEM(version VI), using the first-order conditional estimationmethod [19]. In this study, exponential error models forboth inter- and intraindividual variability were chosen asfollows:
Pij ¼ Ppop;i � expðηijÞ ð5Þ
TTjk ¼ TT�jk � expð�jkÞ ð6Þ
where Pij is the i-th individual pharmacokinetic orpharmacodynamic parameter for patient j; Ppop,iis the i-th population mean parameter; and ηij is the individualrandom perturbation from the population mean param-eter that is distributed with a mean of zero and varianceωι2. TTjk is the observed TT value at time k for patient j;
TT*jk is the corresponding predicted TT value; and εjk
represents the independent identically distributed errorwith a mean of zero and variance of σ2 for the TT value.The number of η used in the model was determined
by the method of minimum Akaike information criterion(AIC) estimation [20].
AIC ¼ OBJ þ 2M ð7Þwhere OBJ is the objective function values calculated
using the NONMEM and M is the number of independ-ently adjusted parameters within the model.Next, the influence of renal function on each param-
eter was examined using Equation 8, by the forward se-lection method.
Ppop;i ¼ P�pop;i � θRF ð8Þ
where RF = 1 if serum creatinine was higher thanour in-hospital reference value, namely 1.1 mg/dL orhigher for men, and 0.8 mg/dL or higher for women,otherwise RF = 0. P*pop,i is the i-th population meanparameter in the patient whose serum creatinine iswithin our in-hospital reference value. The parameterset that had the smallest objective function value wasselected, and the null hypothesis that θ was notstatistically different from unity was examined usingthe likelihood ratio test. A difference of 7.88 in OBJwith 1 degree of freedom was used to measurestatistical significance (P < 0.005 by the chi-squareddistribution).
Simulation for INR transition(A) Effect of vitamin K2 doseSimulations were carried out using the obtained popula-tion mean parameters based on a typical patient whose
Clotting FactorCompartment
WarfarinCompartment
Elimination
StimulationE ,EC
Clotting FactorSynthesis
Clotting FactorDegradationk
VitaminK2Compartment
k
Cp ,Vd
Cp , Vd
k
k
TT
InhibitionIC
Fig. 1 Pharmacokinetic/pharmacodynamic model of warfarin and vitamin K2. In this model, Cp1 and Cp3 represent the plasma concentration ofwarfarin and vitamin K2, respectively; Vd1 and Vd3 represent the distribution volume; and k10 and k30 represent the first-order elimination rateconstant for each drug. The zero-order synthesis and first-order degradation rate constant for clotting factors are shown as ks and kd, respectively,and IC50, Emax and EC50 represent 50 % inhibitory concentration of warfarin, maximum effect of vitamin K2 and 50 % effective concentration ofvitamin K2, respectively
Zhou et al. Journal of Pharmaceutical Health Care and Sciences (2016) 2:17 Page 3 of 10
body weight was 50 kg with/without renal failure. Themaintenance dose of warfarin was set to 3 mg/day(7 PM) and was stopped on day −1 (the day prior to theoperation), and 5 mg/day was administered for 2 daysafter the operation as a loading dose, followed by amaintenance dose of 3 mg/day. Vitamin K2 was adminis-tered at 20 mg 0, 1, 2, or 3-times every 4 hours after4 PM on day −1 with the total dose administered ran-ging from 0 mg to 60 mg.For quantitative evaluation, we obtained 4 parameters,
namely ΔINR, 1st loading, 95% recovery, and INR/day.The ΔINR represents the difference in INR values be-tween before warfarin withdrawal and before the loadingdose; the 1st loading represents an INR increase afterthe first warfarin loading dose; and the 95% recoveryrepresents the time needed for INR elevation in the post-operative period up to 95 % of the preoperative steadystate INR value. In addition, INR/day was calculated bydividing ΔINR by 95% recovery (day).
(B) Effect of warfarin doseSimulations with various warfarin maintenance doseswere conducted. As a maintenance dose, 3 to 6 mg ofwarfarin was administered and it was stopped on day −1without vitamin K2 administration. Warfarin (2 mg) wasadded to each maintenance dose as a loading dose, andit was administered for 2 days after the operation,followed by each maintenance dose. Cases where 20 to60 mg of vitamin K2 was administered were alsosimulated.
(C) Effect of interindividual variabilitySimulations were also conducted using several parametersets in which 1 of the mean parameters was altered usingthe interindividual variability (+ or – ω) from the popula-tion mean value. Warfarin and vitamin K2 doses were setto 3 and 20 mg, respectively, in each simulation.
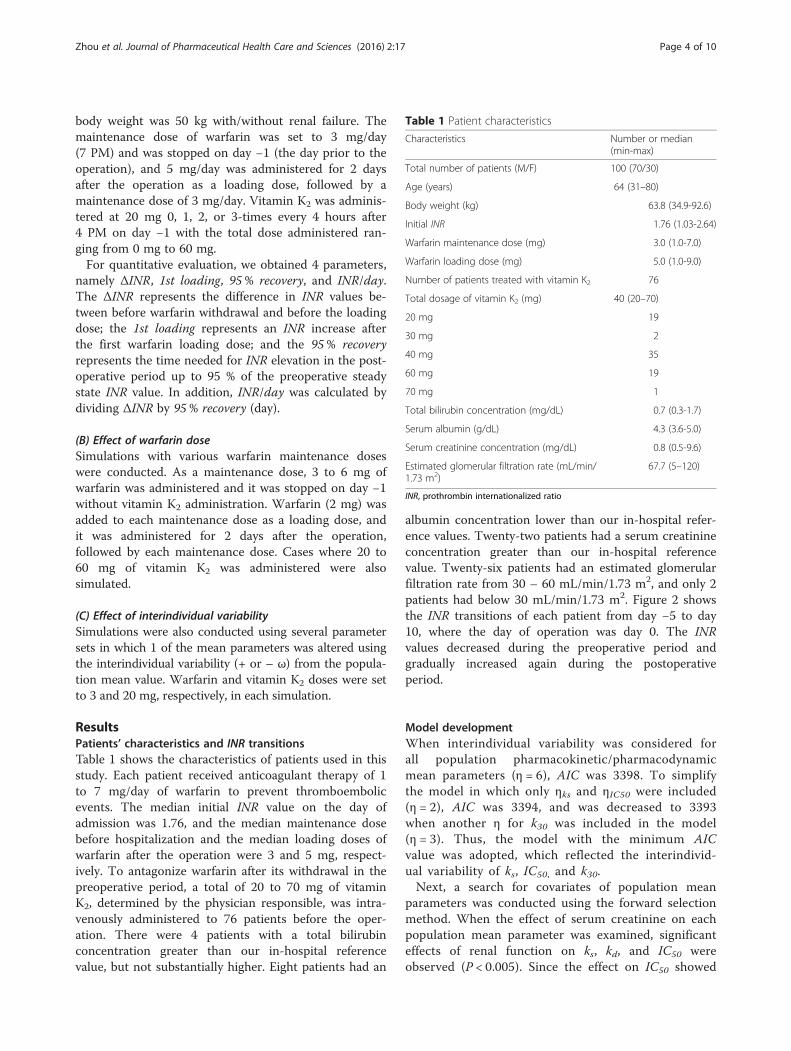
ResultsPatients’ characteristics and INR transitionsTable 1 shows the characteristics of patients used in thisstudy. Each patient received anticoagulant therapy of 1to 7 mg/day of warfarin to prevent thromboembolicevents. The median initial INR value on the day ofadmission was 1.76, and the median maintenance dosebefore hospitalization and the median loading doses ofwarfarin after the operation were 3 and 5 mg, respect-ively. To antagonize warfarin after its withdrawal in thepreoperative period, a total of 20 to 70 mg of vitaminK2, determined by the physician responsible, was intra-venously administered to 76 patients before the oper-ation. There were 4 patients with a total bilirubinconcentration greater than our in-hospital referencevalue, but not substantially higher. Eight patients had an
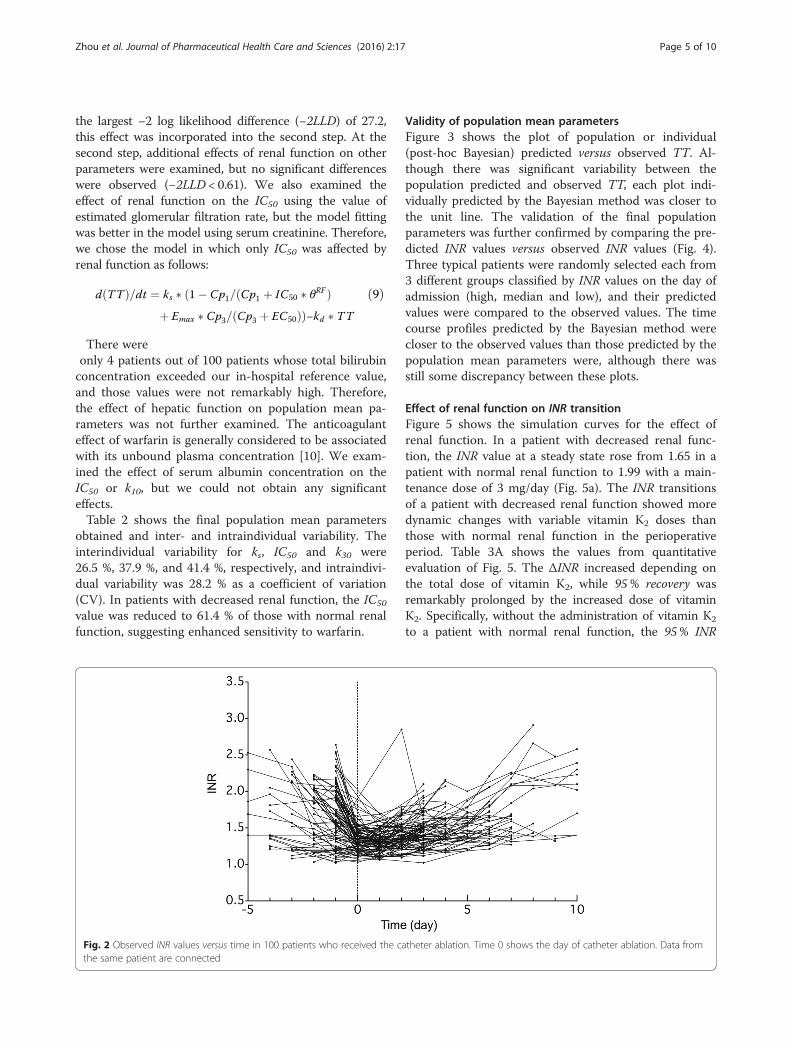
albumin concentration lower than our in-hospital refer-ence values. Twenty-two patients had a serum creatinineconcentration greater than our in-hospital referencevalue. Twenty-six patients had an estimated glomerularfiltration rate from 30 – 60 mL/min/1.73 m2, and only 2patients had below 30 mL/min/1.73 m2. Figure 2 showsthe INR transitions of each patient from day −5 to day10, where the day of operation was day 0. The INRvalues decreased during the preoperative period andgradually increased again during the postoperativeperiod.
Model developmentWhen interindividual variability was considered forall population pharmacokinetic/pharmacodynamicmean parameters (η = 6), AIC was 3398. To simplifythe model in which only ηks and ηIC50 were included(η = 2), AIC was 3394, and was decreased to 3393when another η for k30 was included in the model(η = 3). Thus, the model with the minimum AICvalue was adopted, which reflected the interindivid-ual variability of ks, IC50, and k30.Next, a search for covariates of population mean
parameters was conducted using the forward selectionmethod. When the effect of serum creatinine on eachpopulation mean parameter was examined, significanteffects of renal function on ks, kd, and IC50 wereobserved (P < 0.005). Since the effect on IC50 showed
Table 1 Patient characteristics
Characteristics Number or median(min-max)
Total number of patients (M/F) 100 (70/30)
Age (years) 64 (31–80)
Body weight (kg) 63.8 (34.9-92.6)
Initial INR 1.76 (1.03-2.64)
Warfarin maintenance dose (mg) 3.0 (1.0-7.0)
Warfarin loading dose (mg) 5.0 (1.0-9.0)
Number of patients treated with vitamin K2 76
Total dosage of vitamin K2 (mg) 40 (20–70)
20 mg 19
30 mg 2
40 mg 35
60 mg 19
70 mg 1
Total bilirubin concentration (mg/dL) 0.7 (0.3-1.7)
Serum albumin (g/dL) 4.3 (3.6-5.0)
Serum creatinine concentration (mg/dL) 0.8 (0.5-9.6)
Estimated glomerular filtration rate (mL/min/1.73 m2)
67.7 (5–120)
INR, prothrombin internationalized ratio
Zhou et al. Journal of Pharmaceutical Health Care and Sciences (2016) 2:17 Page 4 of 10
the largest −2 log likelihood difference (−2LLD) of 27.2,this effect was incorporated into the second step. At thesecond step, additional effects of renal function on otherparameters were examined, but no significant differenceswere observed (−2LLD < 0.61). We also examined theeffect of renal function on the IC50 using the value ofestimated glomerular filtration rate, but the model fittingwas better in the model using serum creatinine. Therefore,we chose the model in which only IC50 was affected byrenal function as follows:
dðTTÞ=dt ¼ ks � ð1� Cp1=ðCp1 þ IC50 � θRFÞþ Emax � Cp3=ðCp3 þ EC50ÞÞ−kd � TT
ð9Þ
There wereonly 4 patients out of 100 patients whose total bilirubinconcentration exceeded our in-hospital reference value,and those values were not remarkably high. Therefore,the effect of hepatic function on population mean pa-rameters was not further examined. The anticoagulanteffect of warfarin is generally considered to be associatedwith its unbound plasma concentration [10]. We exam-ined the effect of serum albumin concentration on theIC50 or k10, but we could not obtain any significanteffects.Table 2 shows the final population mean parameters
obtained and inter- and intraindividual variability. Theinterindividual variability for ks, IC50 and k30 were26.5 %, 37.9 %, and 41.4 %, respectively, and intraindivi-dual variability was 28.2 % as a coefficient of variation(CV). In patients with decreased renal function, the IC50
value was reduced to 61.4 % of those with normal renalfunction, suggesting enhanced sensitivity to warfarin.
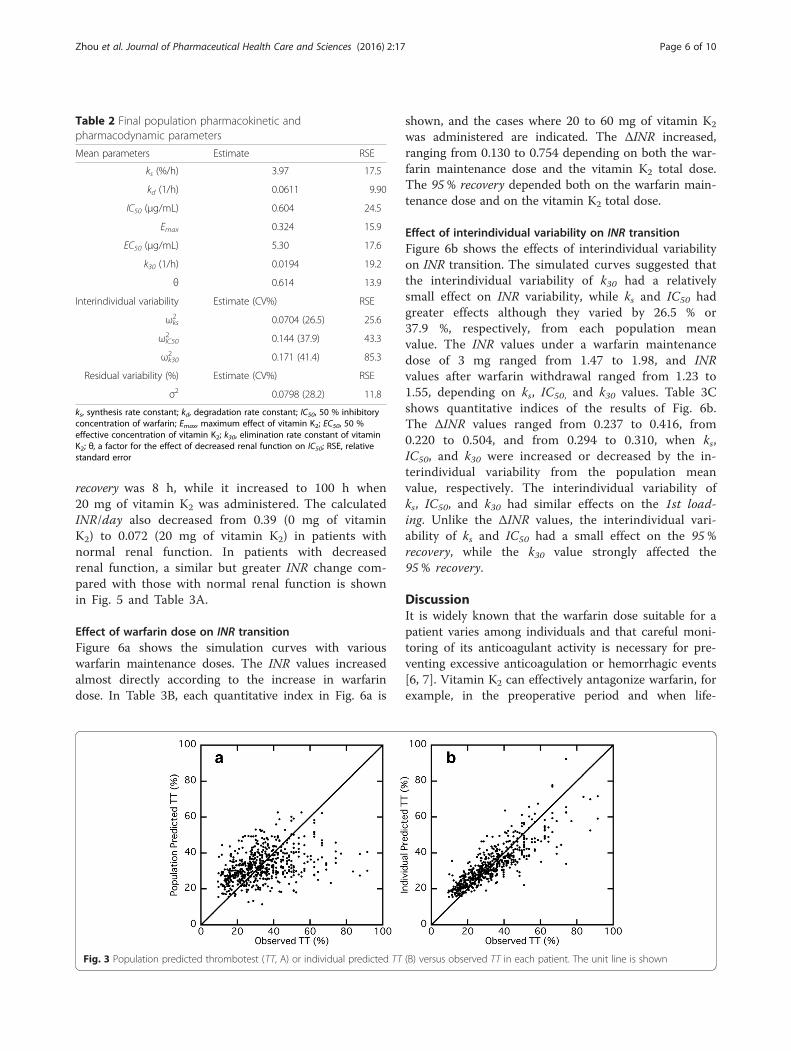
Validity of population mean parametersFigure 3 shows the plot of population or individual(post-hoc Bayesian) predicted versus observed TT. Al-though there was significant variability between thepopulation predicted and observed TT, each plot indi-vidually predicted by the Bayesian method was closer tothe unit line. The validation of the final populationparameters was further confirmed by comparing the pre-dicted INR values versus observed INR values (Fig. 4).Three typical patients were randomly selected each from3 different groups classified by INR values on the day ofadmission (high, median and low), and their predictedvalues were compared to the observed values. The timecourse profiles predicted by the Bayesian method werecloser to the observed values than those predicted by thepopulation mean parameters were, although there wasstill some discrepancy between these plots.
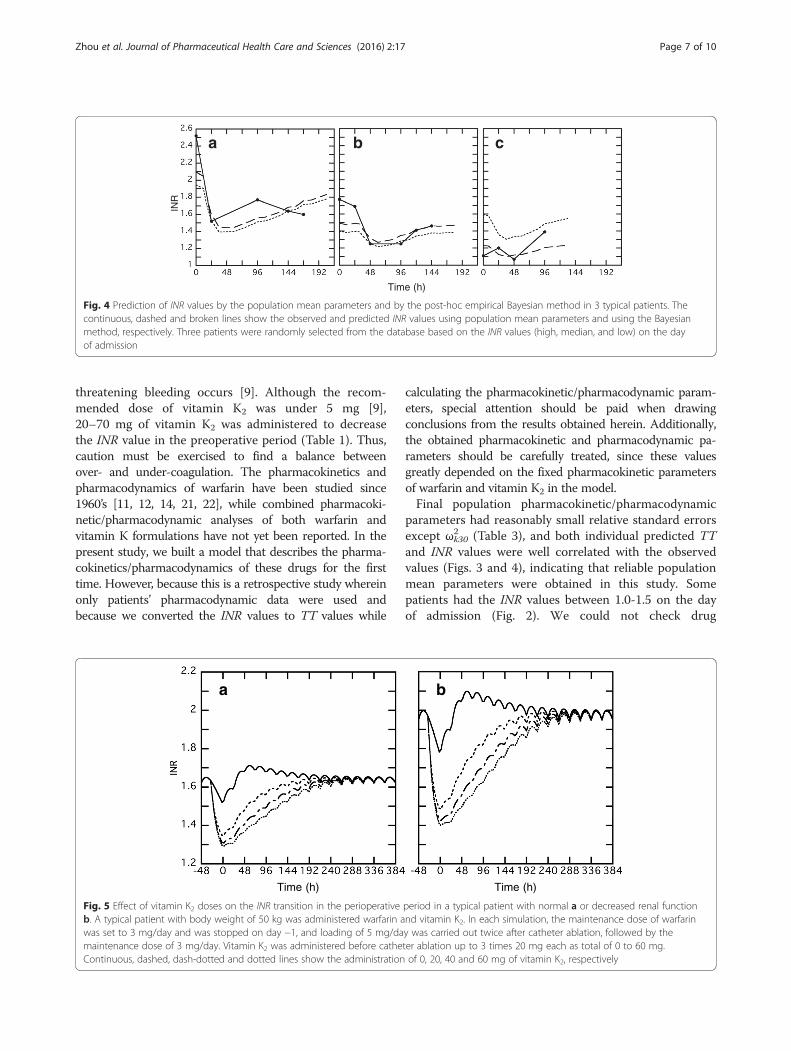
Effect of renal function on INR transitionFigure 5 shows the simulation curves for the effect ofrenal function. In a patient with decreased renal func-tion, the INR value at a steady state rose from 1.65 in apatient with normal renal function to 1.99 with a main-tenance dose of 3 mg/day (Fig. 5a). The INR transitionsof a patient with decreased renal function showed moredynamic changes with variable vitamin K2 doses thanthose with normal renal function in the perioperativeperiod. Table 3A shows the values from quantitativeevaluation of Fig. 5. The ΔINR increased depending onthe total dose of vitamin K2, while 95% recovery wasremarkably prolonged by the increased dose of vitaminK2. Specifically, without the administration of vitamin K2
to a patient with normal renal function, the 95% INR
Fig. 2 Observed INR values versus time in 100 patients who received the catheter ablation. Time 0 shows the day of catheter ablation. Data fromthe same patient are connected
Zhou et al. Journal of Pharmaceutical Health Care and Sciences (2016) 2:17 Page 5 of 10
recovery was 8 h, while it increased to 100 h when20 mg of vitamin K2 was administered. The calculatedINR/day also decreased from 0.39 (0 mg of vitaminK2) to 0.072 (20 mg of vitamin K2) in patients withnormal renal function. In patients with decreasedrenal function, a similar but greater INR change com-pared with those with normal renal function is shownin Fig. 5 and Table 3A.
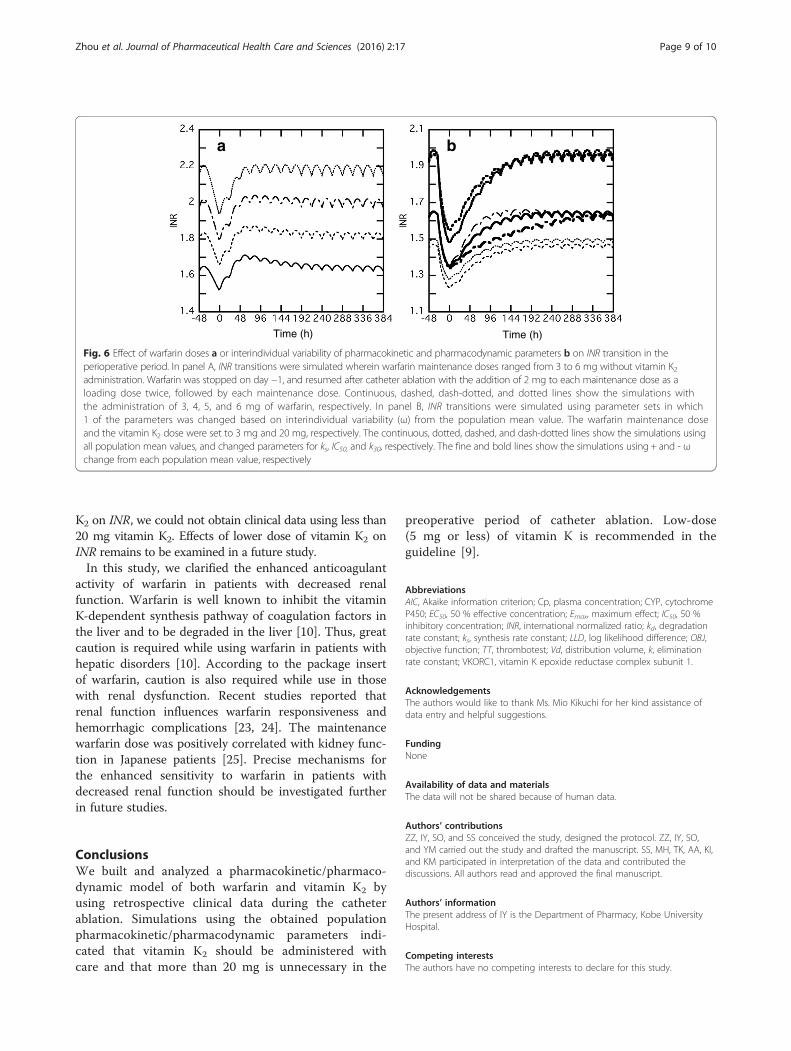
Effect of warfarin dose on INR transitionFigure 6a shows the simulation curves with variouswarfarin maintenance doses. The INR values increasedalmost directly according to the increase in warfarindose. In Table 3B, each quantitative index in Fig. 6a is
shown, and the cases where 20 to 60 mg of vitamin K2
was administered are indicated. The ΔINR increased,ranging from 0.130 to 0.754 depending on both the war-farin maintenance dose and the vitamin K2 total dose.The 95% recovery depended both on the warfarin main-tenance dose and on the vitamin K2 total dose.
Effect of interindividual variability on INR transitionFigure 6b shows the effects of interindividual variabilityon INR transition. The simulated curves suggested thatthe interindividual variability of k30 had a relativelysmall effect on INR variability, while ks and IC50 hadgreater effects although they varied by 26.5 % or37.9 %, respectively, from each population meanvalue. The INR values under a warfarin maintenancedose of 3 mg ranged from 1.47 to 1.98, and INRvalues after warfarin withdrawal ranged from 1.23 to1.55, depending on ks, IC50, and k30 values. Table 3Cshows quantitative indices of the results of Fig. 6b.The ΔINR values ranged from 0.237 to 0.416, from0.220 to 0.504, and from 0.294 to 0.310, when ks,IC50, and k30 were increased or decreased by the in-terindividual variability from the population meanvalue, respectively. The interindividual variability ofks, IC50, and k30 had similar effects on the 1st load-ing. Unlike the ΔINR values, the interindividual vari-ability of ks and IC50 had a small effect on the 95%recovery, while the k30 value strongly affected the95 % recovery.
DiscussionIt is widely known that the warfarin dose suitable for apatient varies among individuals and that careful moni-toring of its anticoagulant activity is necessary for pre-venting excessive anticoagulation or hemorrhagic events[6, 7]. Vitamin K2 can effectively antagonize warfarin, forexample, in the preoperative period and when life-
Table 2 Final population pharmacokinetic andpharmacodynamic parameters
Mean parameters Estimate RSE
ks (%/h) 3.97 17.5
kd (1/h) 0.0611 9.90
IC50 (μg/mL) 0.604 24.5
Emax 0.324 15.9
EC50 (μg/mL) 5.30 17.6
k30 (1/h) 0.0194 19.2
θ 0.614 13.9
Interindividual variability Estimate (CV%) RSE
ωks2 0.0704 (26.5) 25.6
ωIC502 0.144 (37.9) 43.3
ωk302 0.171 (41.4) 85.3
Residual variability (%) Estimate (CV%) RSE
σ2 0.0798 (28.2) 11.8
ks, synthesis rate constant; kd, degradation rate constant; IC50, 50 % inhibitoryconcentration of warfarin; Emax, maximum effect of vitamin K2; EC50, 50 %effective concentration of vitamin K2; k30, elimination rate constant of vitaminK2; θ, a factor for the effect of decreased renal function on IC50; RSE, relativestandard error
Fig. 3 Population predicted thrombotest (TT, A) or individual predicted TT (B) versus observed TT in each patient. The unit line is shown
Zhou et al. Journal of Pharmaceutical Health Care and Sciences (2016) 2:17 Page 6 of 10
threatening bleeding occurs [9]. Although the recom-mended dose of vitamin K2 was under 5 mg [9],20–70 mg of vitamin K2 was administered to decreasethe INR value in the preoperative period (Table 1). Thus,caution must be exercised to find a balance betweenover- and under-coagulation. The pharmacokinetics andpharmacodynamics of warfarin have been studied since1960’s [11, 12, 14, 21, 22], while combined pharmacoki-netic/pharmacodynamic analyses of both warfarin andvitamin K formulations have not yet been reported. In thepresent study, we built a model that describes the pharma-cokinetics/pharmacodynamics of these drugs for the firsttime. However, because this is a retrospective study whereinonly patients’ pharmacodynamic data were used andbecause we converted the INR values to TT values while
calculating the pharmacokinetic/pharmacodynamic param-eters, special attention should be paid when drawingconclusions from the results obtained herein. Additionally,the obtained pharmacokinetic and pharmacodynamic pa-rameters should be carefully treated, since these valuesgreatly depended on the fixed pharmacokinetic parametersof warfarin and vitamin K2 in the model.Final population pharmacokinetic/pharmacodynamic
parameters had reasonably small relative standard errorsexcept ωk30
2 (Table 3), and both individual predicted TTand INR values were well correlated with the observedvalues (Figs. 3 and 4), indicating that reliable populationmean parameters were obtained in this study. Somepatients had the INR values between 1.0-1.5 on the dayof admission (Fig. 2). We could not check drug
Time (h)
b c
INR
a
Fig. 4 Prediction of INR values by the population mean parameters and by the post-hoc empirical Bayesian method in 3 typical patients. Thecontinuous, dashed and broken lines show the observed and predicted INR values using population mean parameters and using the Bayesianmethod, respectively. Three patients were randomly selected from the database based on the INR values (high, median, and low) on the dayof admission
ba
Time (h) Time (h)
Fig. 5 Effect of vitamin K2 doses on the INR transition in the perioperative period in a typical patient with normal a or decreased renal functionb. A typical patient with body weight of 50 kg was administered warfarin and vitamin K2. In each simulation, the maintenance dose of warfarinwas set to 3 mg/day and was stopped on day −1, and loading of 5 mg/day was carried out twice after catheter ablation, followed by themaintenance dose of 3 mg/day. Vitamin K2 was administered before catheter ablation up to 3 times 20 mg each as total of 0 to 60 mg.Continuous, dashed, dash-dotted and dotted lines show the administration of 0, 20, 40 and 60 mg of vitamin K2, respectively
Zhou et al. Journal of Pharmaceutical Health Care and Sciences (2016) 2:17 Page 7 of 10
compliance in the patients before the hospitalization,but good compliance was expected in the hospital. Sincethe prediction bias of the TT was not observed againstthe time (data not shown), effects of non-compliance onthe present results were considered to be small. Sincecoadministration of amiodarone or bucolome was re-ported to inhibit the warfarin metabolism mediated byCYP2C9 [13, 14], we examined the effect of these drugson the k10. Although the coadministration of thesedrugs decreased k10, this effect did not reach a statisticalsignificance level (−2LLD = 7.61 < 7.88). Therefore, wedid not include the effect of amiodarone and bucolomein the final model. The estimated population mean pa-rameters for ks, kd, and IC50 were similar to those in aprevious report [11], and interindividual variability for
ks, IC50, and k30 was minimal, although the intraindivi-dual variability was quite significant.The several simulations of INR transition by the obtained
population pharmacokinetic/pharmacodynamic parametersshowed that vitamin K2 could antagonize the anticoagulantactivity of warfarin in a dose-dependent manner. Whilemore than 20 mg of vitamin K2 showed only a small effecton the extent of INR decreases in the preoperative period,the time required for warfarin to exert its anticoagulationactivity again in the postoperative period depended on thetotal dose of vitamin K2. An inability to anticoagulatepromptly after the operation may lead to prolongedhospitalization and consequently decrease patients’ qualityof life, as well as increase medical costs. Although it isimportant to examine the effect of less than 20 mg vitamin
Table 3 Quantitative evaluation of the simulated INR transitions corresponding to Figs. 5 and 6
(A) Effect of renal function on INR transitions.
Renal Function Normal Decreased renal function
Vitamin K2 (mg) 0 20 40 60 0 20 40 60
ΔINR (×10−1) 1.30 3.02 3.41 3.58 2.15 5.11 5.73 5.98
1st Loading (×10−1) 0.72 0.40 0.23 0.15 1.12 0.55 0.30 0.17
95% Recovery (h) 8 100 148 172 16 126 174 200
INR/day (×10−1) 3.90 0.72 0.55 0.50 3.23 0.97 0.79 0.72
(B) Effects of combinations ofvarious warfarin maintenancedoses and vitamin K2 doseson INR transitions.
Warfarin (mg) 3 4
Vitamin K2 (mg) 0 20 40 60 0 20 40 60
ΔINR (×10−1) 1.30 3.02 3.41 3.58 1.75 4.10 4.62 4.83
1st Loading (×10−1) 0.72 0.40 0.23 0.15 0.77 0.38 0.20 0.11
95% Recovery (h) 8 100 148 172 26 126 172 196
INR/day (×10−1) 3.90 0.72 0.55 0.50 1.62 0.78 0.64 0.59
Warfarin (mg) 5 6
Vitamin K2 (mg) 0 20 40 60 0 20 40 60
ΔINR (×10−1) 2.21 5.26 5.90 6.16 2.66 6.49 7.24 7.54
1st Loading (×10−1) 0.83 0.38 0.17 0.08 0.89 0.38 0.15 0.05
95% Recovery (h) 28 150 196 206 32 158 200 224
INR/day (×10−1) 1.89 0.84 0.72 0.72 2.00 0.99 0.87 0.81
(C) Effect of interindividualvariability on INR transitions.
ks IC50 k30
+ω 0 -ω +ω 0 -ω +ω 0 -ω
ΔINR (×10−1) 2.37 3.02 4.16 2.20 3.02 5.04 2.94 3.02 3.10
1st Loading (×10−1) 0.31 0.40 0.55 0.31 0.40 0.54 0.55 0.40 0.26
95% Recovery (h) 82 100 102 76 100 126 58 100 198
INR/day (×10−1) 0.69 0.72 0.98 0.69 0.72 0.96 1.22 0.72 0.38
ΔINR, a decrease before and after warfarin withdrawal; 1st Loading, an INR increase by the first warfarin loading; 95 % Recovery, a time to elevate to the 95 % ofthe INR value before warfarin withdrawal; INR/day, ΔINR divided by 95 % Recovery
Zhou et al. Journal of Pharmaceutical Health Care and Sciences (2016) 2:17 Page 8 of 10
K2 on INR, we could not obtain clinical data using less than20 mg vitamin K2. Effects of lower dose of vitamin K2 onINR remains to be examined in a future study.In this study, we clarified the enhanced anticoagulant
activity of warfarin in patients with decreased renalfunction. Warfarin is well known to inhibit the vitaminK-dependent synthesis pathway of coagulation factors inthe liver and to be degraded in the liver [10]. Thus, greatcaution is required while using warfarin in patients withhepatic disorders [10]. According to the package insertof warfarin, caution is also required while use in thosewith renal dysfunction. Recent studies reported thatrenal function influences warfarin responsiveness andhemorrhagic complications [23, 24]. The maintenancewarfarin dose was positively correlated with kidney func-tion in Japanese patients [25]. Precise mechanisms forthe enhanced sensitivity to warfarin in patients withdecreased renal function should be investigated furtherin future studies.
ConclusionsWe built and analyzed a pharmacokinetic/pharmaco-dynamic model of both warfarin and vitamin K2 byusing retrospective clinical data during the catheterablation. Simulations using the obtained populationpharmacokinetic/pharmacodynamic parameters indi-cated that vitamin K2 should be administered withcare and that more than 20 mg is unnecessary in the
preoperative period of catheter ablation. Low-dose(5 mg or less) of vitamin K is recommended in theguideline [9].
AbbreviationsAIC, Akaike information criterion; Cp, plasma concentration; CYP, cytochromeP450; EC50, 50 % effective concentration; Emax, maximum effect; IC50, 50 %inhibitory concentration; INR, international normalized ratio; kd, degradationrate constant; ks, synthesis rate constant; LLD, log likelihood difference; OBJ,objective function; TT, thrombotest; Vd, distribution volume, k, eliminationrate constant; VKORC1, vitamin K epoxide reductase complex subunit 1.
AcknowledgementsThe authors would like to thank Ms. Mio Kikuchi for her kind assistance ofdata entry and helpful suggestions.
FundingNone
Availability of data and materialsThe data will not be shared because of human data.
Authors’ contributionsZZ, IY, SO, and SS conceived the study, designed the protocol. ZZ, IY, SO,and YM carried out the study and drafted the manuscript. SS, MH, TK, AA, KI,and KM participated in interpretation of the data and contributed thediscussions. All authors read and approved the final manuscript.
Authors’ informationThe present address of IY is the Department of Pharmacy, Kobe UniversityHospital.
Competing interestsThe authors have no competing interests to declare for this study.
ba
Time (h) Time (h)
Fig. 6 Effect of warfarin doses a or interindividual variability of pharmacokinetic and pharmacodynamic parameters b on INR transition in theperioperative period. In panel A, INR transitions were simulated wherein warfarin maintenance doses ranged from 3 to 6 mg without vitamin K2administration. Warfarin was stopped on day −1, and resumed after catheter ablation with the addition of 2 mg to each maintenance dose as aloading dose twice, followed by each maintenance dose. Continuous, dashed, dash-dotted, and dotted lines show the simulations withthe administration of 3, 4, 5, and 6 mg of warfarin, respectively. In panel B, INR transitions were simulated using parameter sets in which1 of the parameters was changed based on interindividual variability (ω) from the population mean value. The warfarin maintenance doseand the vitamin K2 dose were set to 3 mg and 20 mg, respectively. The continuous, dotted, dashed, and dash-dotted lines show the simulations usingall population mean values, and changed parameters for ks, IC50, and k30, respectively. The fine and bold lines show the simulations using + and - ωchange from each population mean value, respectively
Zhou et al. Journal of Pharmaceutical Health Care and Sciences (2016) 2:17 Page 9 of 10
Consent for publicationNot applicable.
Ethics approval and consent to participateThis study was conducted in accordance with the Declaration of Helsinkiand its amendments. The study protocol was approved by the EthicsCommittee of the Kyoto University Graduate School of Medicine and KyotoUniversity Hospital (R0264).
Author details1Department of Clinical Pharmacology and Therapeutics, Kyoto UniversityHospital, Sakyo-ku, Japan. 2Department of Pharmacology, Graduate School ofPharmaceutical Sciences, Kyoto University, Sakyo-ku, Japan. 3Department ofClinical Pharmacy and Education, Graduate School of PharmaceuticalSciences, Kyoto University, Sakyo-ku, Kyoto, Japan. 4Department ofCardiovascular Medicine, Graduate School of Medicine, Kyoto University,Sakyo-ku, Japan.
Received: 31 March 2016 Accepted: 5 July 2016
References1. Haïssaguerre M, Jaïs P, Shah D, Takahashi A, Hocini M, Quiniou G, Garrigue
S, Le Mouroux A, Le Métayer P, Clémenty J. Spontaneous initiation of atrialfibrillation by ectopic beats originating in the pulmonary veins. N Engl JMed. 1998;339:659–66.
2. Wellens H. Atrial fibrillation–the last big hurdle in treating supraventriculartachycardia. N Engl J Med. 1994;331:944–5.
3. trial Fibrillation Investigators: Atrial Fibrillation, Aspirin, AnticoagulationStudy; Boston Area Anticoagulation Trial for Atrial Fibrillation Study;Canadian Atrial Fibrillation Anticoagulation Study; Stroke Prevention in AtrialFibrillation Study; Veterans Affairs Stroke Prevention in Nonrheumatic AtrialFibrillation Study. Risk factors for stroke and efficacy of antithrombotictherapy in atrial fibrillation: Analysis of pooled data from five randomizedcontrolled trials. Arch Intern Med. 1994;154:1449–57.
4. Higashi M, Veenstra D, Kondo L, Wittkowsky A, Srinouanprachanh S, Farin F,Rettie A. Association between CYP2C9 genetic variants and anticoagulation-related outcomes during warfarin therapy. J Am Med Assoc. 2002;287:1690–8.
5. Obayashi K, Nakamura K, Kawana J, Ogata H, Hanada K, Kurabayashi M,Hasegawa A, Yamamoto K, Horiuchi R. VKORC1 gene variations are themajor contributors of variation in warfarin dose in Japanese patients. ClinPharmacol Ther. 2006;80:169–78.
6. Yasaka M, Minematsu K, Yamaguchi T. Optimal intensity of internationalnormalized ratio in warfarin therapy for secondary prevention of stroke inpatients with non-valvular atrial fibrillation. Intern Med. 2001;40:1183–8.
7. Joint Working Groups. The Japanese Circulation Society, The JapaneseCollege of Cardiology, The Japanese Society of Electrocardiology, and TheJapanese Heart Rhythm Society. Guidelines for pharmacotherapy of atrialfibrillation (JCS2013). 2013. http://www.j-circ.or.jp/guideline/pdf/JCS2013_inoue_h.pdf. Accessed 30 March 2016.
8. Joint working Groups. Guidelines for management of anticoagulant andantiplatelet therapy in cardiovascular disease (JCS2004). Circ J. 2004;68Suppl 4:1153–219.
9. The Haemostasis and Thrombosis Task Force for the British Committee forStandards in Haematology. Guidelines on oral anticoagulation: third edition.Br J Haematol. 1998;101:374–87.
10. Shetty H, Fennerty A, Routledge P. Clinical pharmacokinetic considerations inthe control of oral anticoagulant therapy. Clin Pharmacokinet. 1989;16:238–53.
11. Sato S, Toda T, Yamazaki M, Hongo F, Kurosawa N, Owada E, Hatta E,Nakamura M, Nakanishi K, Okamoto F, Sakai K, Hirokami M, Hanawa N,Tanaka S. Warfarin maintenance dose estimation program “WfTDM” basedon thrombo-test value. Jpn J Ther Drug Monit. 2006;23:10–6.
12. Hamberg AK, Dahl ML, Barban M, Scordo MG, Wadelius M, Pengo V, PadriniR, Jonsson EN. A PK-PD model for predicting the impact of age, CYP2C9,and VKORC1 genotype on individualization of warfarin therapy. ClinPharmacol Ther. 2007;81:529–38.
13. Holbrook AM, Pereira JA, Labiris R, McDonald H, Douketis JD, Crowther M,Wells PS. Systematic overview of warfarin and its drug and foodinteractions. Arch Intern Med. 2005;165:1095–106.
14. Osawa M, Hada N, Matsumoto K, Hasegawa T, Kobayashi D, MorimotoY, Yamaguchi M, Kanamoto I, Nakagawa T, Sugibayashi K. Usefulness of
coadministration of bucolome in warfarin therapy: pharmacokinetic andpharmacodynamic analysis using outpatient prescriptions. Int J Pharm.2005;293:43–9.
15. Jusko WJ, Ko HC. Physiological indirect response models characterizediverse types of pharmacodynamic effects. Clin Pharmacol Ther. 1994;56:406–19.
16. Dayneka NL, Garg V, Jusko WJ. Comparison of 4 basic models of indirectpharmacodynamic responses. J Pharmacokinet Biopharm. 1993;21:457–78.
17. Tie J, Stafford D. Structure and function of vitamin K epoxide reductase.Vitam Horm. 2008;78:103–30.
18. Gogstad G, Wadt J, Smith P, Brynildsrud T. Utility of a modified calibrationmodel for reliable conversion of thromboplastin times to internationalnormalized ratios. Thromb Haemost. 1986;56:178–82.
19. Beal SL, Boeckmann AJ, Sheiner LB. NONMEM Users Guides. NONMEMProject Group. San Francisco: University of California; 1992.
20. Akaike H. A new look at the statistical model identification. IEEE TransAutom Control. 1974;19:716–23.
21. Sheiner LB. Computer-aided long-term anticoagulation therapy. ComputBiomed Res. 1969;2:507–18.
22. Nagashima RA, O’reilly RA, Levy G. Kinetics of pharmacologic effects in man:the anticoagulant action of warfarin. Clin Pharmacol Ther. 1969;10:22–35.
23. Limdi NA, Beasley TM, Baird MF, Goldstein JA, McGwin G, Arnett DK, ActonRT, Allon M. Kidney function influences warfarin responsiveness andhemorrhagic complications. J Am Soc Nephrol. 2009;20:912–21.
24. Limdi NA, Limdi MA, Cavallari L, Anderson AM, Crowley MR, Baird MF, AllonM, Beasley TM. Warfarin dosing in patients with impaired kidney function.Am J Kidney Dis. 2010;56:823–31.
25. Ichihara N, Ishigami T, Umemura S. Effect of impaired renal function on themaintenance dose of warfarin in Japanese patients. J Cardiol. 2015;65:178–84.
• We accept pre-submission inquiries
• Our selector tool helps you to find the most relevant journal
• We provide round the clock customer support
• Convenient online submission
• Thorough peer review
• Inclusion in PubMed and all major indexing services
• Maximum visibility for your research
Submit your manuscript atwww.biomedcentral.com/submit
Submit your next manuscript to BioMed Central and we will help you at every step:
Zhou et al. Journal of Pharmaceutical Health Care and Sciences (2016) 2:17 Page 10 of 10