Embed Size (px)
DESCRIPTION
Effect of Varying Levels of Boll Feeding Bug Damage on Fiber Quality. P. Roberts, A. Knowlton, and J Ruberson (UGA) J. Bacheler, D. Mott, D. Morrison, T. Pegram (NCSU) J. Greene, D. Robinson, T. Walker, S. Turnipseed, M. Sullivan (Clemson) R. Smith (Auburn), C. Bednarz (TTU). - PowerPoint PPT Presentation
Citation preview

Effect of Varying Levels of Boll Feeding Bug Damage on Fiber Quality
P. Roberts, A. Knowlton, and J Ruberson (UGA)J. Bacheler, D. Mott, D. Morrison, T. Pegram (NCSU)
J. Greene, D. Robinson, T. Walker, S. Turnipseed, M. Sullivan (Clemson)
R. Smith (Auburn), C. Bednarz (TTU)

Piercing and sucking mouthpart.
Feeds primarily on fruiting structures and meristematic tissues (seed and surrounding tissues in cotton bolls).
Injects digestive enzymes.
Extracts dissolved plant tissue and sap.
Physical destruction of seed (lint production reduced).
Introduces or allows entry (wounds) of pathogens and decay organisms.
Stink Bug Feeding

Prefer medium sized bollsSmall bolls shedLarge bolls remain on the plantSusceptible <25 days of age (yield)

Stink BugSusceptible
0
0.5
1
1.5
2
2.5
3
5 10 15 20 25 30 35 40 45Boll age, days
Len
gth
.cm
0102030405060708090
bol
l wei
ght,
mg
Elongation Deposition
Fiber Development StagesElongation / Secondary Wall Deposition

-0.05
0
0.05
0.1
0.15
5 6 7 8 9 10 11 12 13 14 15 16 17 18 19 20 21
Node
2% 7% 16% 33%
L(w) [in] (Treated – Untreated) All Locations, hand-picked by position
AFIS – Cotton Incorporated
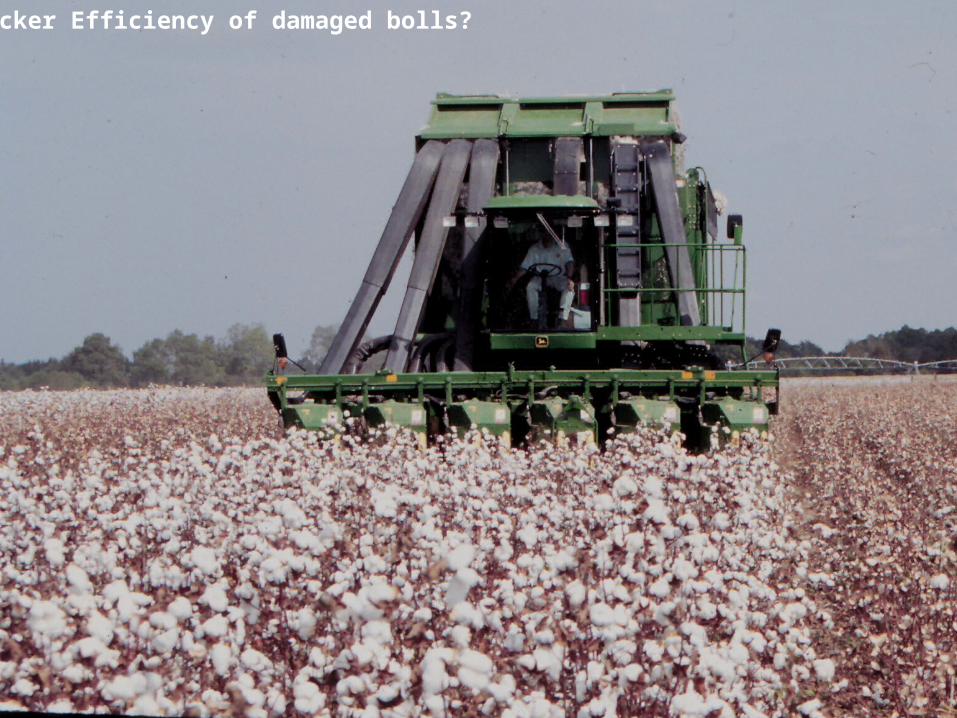
Picker Efficiency of damaged bolls?

Lint cleaners, other ginning processes?

Objective and Methods Quantify the impact of bug damage on fiber quality. 24 field trials established in GA, NC, SC, & AL (2005)
Untreated vs. Bug Treated Intermediate Treatments
Threshold Progressive Protection
Machine-Picked Cotton Simulate Commercial Ginning (UGA MicroGin) HVI, AFIS (Cotton Incorporated) Large data set with a range of bug damage.
Compared differences in quality values with most aggressive treatment in a given trial.
Grouped differences of treatment means from individual trials by yield loss (assumed yield loss due to bug damage).

-0.2
0
0.2
0.4
0.6
0.8
1
1.2
<0 0-99 100-199 200-299 300-499 500+
Yield Loss (lbs lint/acre) vs Aggressively Sprayed
Dif
fere
nce
fro
m A
gg
ress
ive
+b (yellowness)
n=23 n=6n=14n=22 n=7
HVI and AFIS – Cotton IncorporatedN=24 locations, 103 treatments (79 comparisons)
mean=8.308
2005 SE Regional Stink Bug ProjectUGA MicroGin
n=7

-0.6
-0.5
-0.4
-0.3
-0.2
-0.1
0
<0 0-99 100-199 200-299 300-499 500+
Yield Loss (lbs lint/acre) vs Aggressively Sprayed
Dif
fere
nce
fro
m A
gg
ress
ive
Staple Length (32nds)
n=23 n=6n=14n=22 n=7
HVI and AFIS – Cotton IncorporatedN=24 locations, 103 treatments (79 comparisons)
mean=35.93
2005 SE Regional Stink Bug ProjectUGA MicroGin
n=7

-0.6
-0.5
-0.4
-0.3
-0.2
-0.1
0
<0 0-99 100-199 200-299 300-499 500+
Yield Loss (lbs lint/acre) vs Aggressively Sprayed
Dif
fere
nce
fro
m A
gg
ress
ive
Length Uniformity Index
n=23 n=6n=14n=22 n=7
HVI and AFIS – Cotton IncorporatedN=24 locations, 103 treatments (79 comparisons)
mean=81.95
2005 SE Regional Stink Bug ProjectUGA MicroGin
n=7

-0.035
-0.03
-0.025
-0.02
-0.015
-0.01
-0.005
0
0.005
<0 0-99 100-199 200-299 300-499 500+
Yield Loss (lbs lint/acre) vs Aggressively Sprayed
Dif
fere
nce
fro
m A
gg
ress
ive
L(w) [in]
n=23 n=6n=14n=22 n=7
HVI and AFIS – Cotton IncorporatedN=24 locations, 103 treatments (79 comparisons)
mean=0.985
2005 SE Regional Stink Bug ProjectUGA MicroGin
n=7

-0.5
0
0.5
1
1.5
2
2.5
<0 0-99 100-199 200-299 300-499 500+
Yield Loss (lbs lint/acre) vs Aggressively Sprayed
Dif
fere
nce
fro
m A
gg
ress
ive
L(w) CV [%]
n=23 n=6n=14n=22 n=7
HVI and AFIS – Cotton IncorporatedN=24 locations, 103 treatments (79 comparisons)
mean=34.42
2005 SE Regional Stink Bug ProjectUGA MicroGin
n=7

-0.5
0
0.5
1
1.5
2
2.5
<0 0-99 100-199 200-299 300-499 500+
Yield Loss (lbs lint/acre) vs Aggressively Sprayed
Dif
fere
nce
fro
m A
gg
ress
ive
SFC (w) [%]
n=23 n=6n=14n=22 n=7
HVI and AFIS – Cotton IncorporatedN=24 locations, 103 treatments (79 comparisons)
mean=9.030
2005 SE Regional Stink Bug ProjectUGA MicroGin
n=7

UGA Micro-Gin (HVI) 2005Stink Bug Trials, GA, SC, and AL
2005 Untreated
20 Percent
ThresholdAggressively Sprayed
Lint/acre 760 a 1125 b 1232 b
Lint % 34.93 a 36.21 b 36.25 b
MIC 4.27 a 4.37 b 4.43 b
UHM (32nds) 35.62 a 36.01 b 36.03 b
UI 81.18 a 81.63 b 81.60 b
STR 30.08 a 29.97 a 30.06 a
Rd 75.37 a 76.81 b 77.23 b
+b 9.04 a 8.46 b 8.25 bHVI – Cotton IncorporatedN=11 locations (trial means analyzed as reps)

UGA Micro-Gin (AFIS) 2005Stink Bug Trials, GA, SC, and AL
2005 Untreated20 Percent Threshold
Aggressively Sprayed
Nep size (um) 703.4 a 692.6 b 691.5 b
Neps per Gm 308.9 a 255.2 b 244.0 b
L(w) [in] 0.9542 a 0.9734 b 0.9806 b
L(w) CV [%] 36.65 a 35.51 b 35.11 b
UQL (w) [in] 1.180 a 1.192 b 1.199 b
SFC (w) [%] 11.21 a 10.02 b 9.61 b
L (n) [in] 0.6894 a 0.7204 b 0.7304 b
L (n) CV [%] 62.09 a 59.40 b 58.57 b
SFC (n) [%] 36.41 a 33.53 b 32.57 b
L5% (n) [in] 1.321 a 1.337 b 1.343 b
AFIS – Cotton IncorporatedN=11 locations (trial means analyzed as reps)

UGA Micro-Gin (AFIS) 2005Stink Bug Trials, GA, SC, and AL
2005 Untreated20 Percent Threshold
Aggressively Sprayed
Total Cnt/g 413.0 a 322.2 b 293.7 b
Trash Size [um] 360.7 a 364.2 a 366.8 a
Dust Cnt/g 332.1 a 257.8 b 233.9 b
Trash Cnt/g 80.55 a 64.07 b 59.45 b
VFM [%] 1.702 a 1.325 b 1.212 b
SCN Size (um) 1065 a 1073 a 1084 a
SCN (Cnt/g) 23.86 a 17.50 b 16.79 b
Fine [mTex] 172.9 a 173.8 ab 175.6 b
IFC [%] 5.359 a 5.016 b 4.820 b
Mat Ratio 0.9148 a 0.9214 ab 0.9274 b
AFIS – Cotton IncorporatedN=11 locations (trial means analyzed as reps)

“Identifying Practical Knowledge and Solutions
for Managing The Sucking-Bug Complex In Cotton:
Research In The Southeast Region”
Southeast State Support Committees