Embed Size (px)
Citation preview
Int.J.Curr.Microbiol.App.Sci (2018) 7(1): 845-858
845
Original Research Article https://doi.org/10.20546/ijcmas.2018.701.103
Effect of Tillage, Crop Residues and Nitrogen Management Practices on
Growth Performance and Soil Microbial Parameters in Wheat
Swarna Ronanki1* and U.K. Behera
2
1ICAR – India Institute of Millets Research, Rajendranagar, Hyderabad, Telangana, India
2ICAR- Indian Agricultural Research Institute, New Delhi, India
*Corresponding author
A B S T R A C T
Introduction
Conservation agricultural practices has
received wide acceptance among the farmers
in Indo Gangetic Plains (IGPs) of India as it
ensures efficient land utilization, improves soil
fertility and provide additional income
(Sharma and Sharma, 2004; Meena et al.,
2015). According to FAO (2008),
conservation agriculture (CA) is “a concept
for resource-saving agricultural crop
production that strives to achieve acceptable
profits together with high and sustained
production levels while concurrently
International Journal of Current Microbiology and Applied Sciences ISSN: 2319-7706 Volume 7 Number 01 (2018) Journal homepage: http://www.ijcmas.com
A field experiment was conducted at Indian Agricultural Research Institute, New Delhi
during rabi seasons of 2014-15 and 2015-16 to assess the effect of tillage, crop residues
and nitrogen management on growth performance and soil microbial parameters in wheat
under soybean-wheat cropping system. The experiment was laid out in split plot design
with 4 tillage and residue management practices viz., Zero tillage without residue (ZT- R),
zero tillage with soybean residue (ZT+SR), zero tillage with soybean residue and residual
effect of preceding wheat residue (ZT+SWR) and conventional tillage without residue
(CT- R) in main plots and 4 nitrogen management practices viz., 100% recommended dose
of nitrogen (RDN) as basal (N1), 125% RDN as basal (N2), 100% basal + 25% top dressing
(N3) and 75 % basal + 25% top dressing (N4) in sub plots. The results revealed that the
growth parameters of wheat and soil microbial activity were significantly improved with
zero tillage & residue retention. Maximum plant height, LAI and dry matter accumulation
(DMA) were observed with ZT+SWR and it was on par with ZT+SR and significantly
superior to other treatments. Among the no residue treatments, CT - R gave maximum
values of growth attributes but was statistically at par with ZT−R. ZT+SWR recorded 16.5
% and 25.9 % higher microbial biomass carbon than ZT-R and CT-R respectively. Among
the nitrogen management practices, the maximum plant height, LAI, DMA, physiological
indices and improved soil microbial parameters were reported with N2 which was found
statistically at par with N1 and significantly superior to rest of the treatments. It is
concluded that application of 25% higher N over the recommended dose either as basal or
as top dressing along with zero tillage plus crop residue could give better growth
performance and improved soil microbial properties in wheat.
K e y w o r d s
Conservation
agriculture, Growth,
Nitrogen, Soybean,
Wheat, Zero tillage
Accepted:
10 December 2017
Available Online: 10 January 2018
Article Info
Int.J.Curr.Microbiol.App.Sci (2018) 7(1): 845-858
846
conserving the environment. CA consists of
different crop cultivation practices such as
zero tillage, sowing of crops on permanent
beds, strip tillage, plant residue management
and adequate crop rotation management.
Generally, no till or zero tillage is considered
as cornerstone for CA. Compared with con-
ventional practices, zero tillage and residue
retention can lead to the improvement of soil
physical, chemical, and biological properties
and play important roles in maintaining and
improving soil quality. Tillage and residue
management affect not only soil properties but
also soil microbial community. Soil
microorganisms play essential roles in agro-
ecosystem, and their changes will influence
soil nutrient cycling (He et al., 2007). No-
tillage with residue application was proved to
increase the soil microbial community
(Gouaerts et al., 2007).
Research on different aspects of conservation
agriculture is being conducted by many
scientists in different parts of the world. The
area of crops under zero tillage systems has
increased significantly in recent years.
According to Derpsch and Moriya (1999), the
area under zero tillage in 1999 was about 45.5
million hectares. But recent studies on
conservation tillage systems show rapid
spreading of these systems. At present, CA
occupies around 125 million ha in the world,
increasing with the rate of 7 million ha
annually (FAO, 2011; Friedrich et al., 2012).
Today, in the country, the area under
conservation tillage has increased to more than
2 million ha. However, there has been little
corresponding change in the application rates
and management of nutrients especially
nitrogen.
In conservation agriculture, application of
fertilizer has emerged as an issue due to the
fact that under CA, the residue application
may hinder the utilization of applied fertilizer.
These practices influence the fate of plant
nutrients in cropping systems. Both surface
residue retention and ZT potentially induce
major changes in N dynamics and thus N
management in comparison with conventional
practice of straw removal and tillage
(McConkey et al., 2002; Arora et al., 2010).
While ZT may reduce N mineralization by
decreasing decomposition of soil organic
matter, particularly in the initial 3–4 years of
its adoption, crop residues can influence N
dynamics from immobilization and
volatilization (Drinkwater et al., 2000; Singh
et al., 2005). Thus proper nitrogen
management in conservation agriculture is
needed to ensure proper crop growth and
development. The present study was therefore
designed to determine the effect of different
conservation agriculture and nitrogen
management practices on growth performance
of wheat and soil microbial parameters under
soybean-wheat cropping system.
Materials and Methods
A field experiment was conducted during rabi
seasons of 2014-15 and 2015-16 at the
research farm of Division of Agronomy,
Indian Agricultural Research Institute, New
Delhi, situated at 28.4°N latitude and 77.1°E
longitude and at an altitude of 228.6 meters
above mean sea level. The climate is semi-arid
and temperature is usually warm in most of
the period in a year; summer is hot and long
and winter is severe and short with average
temperatures of 42°C and 15°C, respectively.
The soil of the experimental field was a sandy
clay loam in texture, neutral in reaction (pH
7.6), low in organic carbon (0.38 %), low in
available N (150 kg/ha), medium in available
P (11.2 kg/ha) and available K (245 kg/ha).
The total rainfall during the study period was
177.5 and 22 mm during 2014 and 2015
respectively.
The experiment was laid out in split plot
design with three replications in a fixed lay
Int.J.Curr.Microbiol.App.Sci (2018) 7(1): 845-858
847
out. The main plot treatments consisted of four
conservation agricultural practices, viz., Zero
Tillage+ No Residue (ZT−R), Zero Tillage
+Soybean Residue (ZT+SR), Zero Tillage +
Soybean and Wheat Residue (ZT+SWR)
(soybean residue is applied to the wheat crop
and wheat residue to the preceding soybean
crop) and Conventional Tillage without
Residue (CT−R), while the subplot treatments
were four nitrogen management practices, viz.
100% recommended dose of nitrogen (RDN)
as basal (N1), 125% RDN as basal (N2),
100% basal + 25% top dressing at crown root
initiation (CRI) stage (N3) and 75 % basal +
25% top dressing at CRI stage (N4).
Under conventional tillage, the plots were
ploughed 4–5 times (2 disc harrowing + 2
cultivators + 1 planking), while in zero-tillage
the crop was sown without any tillage
operations. Soybean residues @ 3 tonnes/ha
were applied to the wheat crop. Wheat (HD
2967) was sown in rows at 20 cm apart. The
N, P and K were given in the form of urea,
single super phosphate and muriate of potash,
respectively @ 120:60:40 N, P2O5. In wheat
one blanket spray of glyphosate was made
before sowing of the crop only in zero tillage
plots followed by application of isoproturon at
30-35 DAS to the whole plots to control the
weeds.
The crop growth rate (CGR), relative growth
rate (RGR), Net assimilation rate (NAR) and
Leaf area duration were calculated using
standard formula (Radford, 1967). Soil
microbial parameters were recorded at end of
the research experiment. Microbial activity in
terms of fluorescein diacetate (FDA)
hydrolysis in soil was measured by procedure
described by Green et al., (2006). The
procedure given by Casida et al., (1964) was
used for estimation of dehydrogenase activity.
Microbial biomass carbon in soil samples was
estimated by the method described by Nunan
et al., (1998).
Results and Discussion
Growth attributes
Plant height
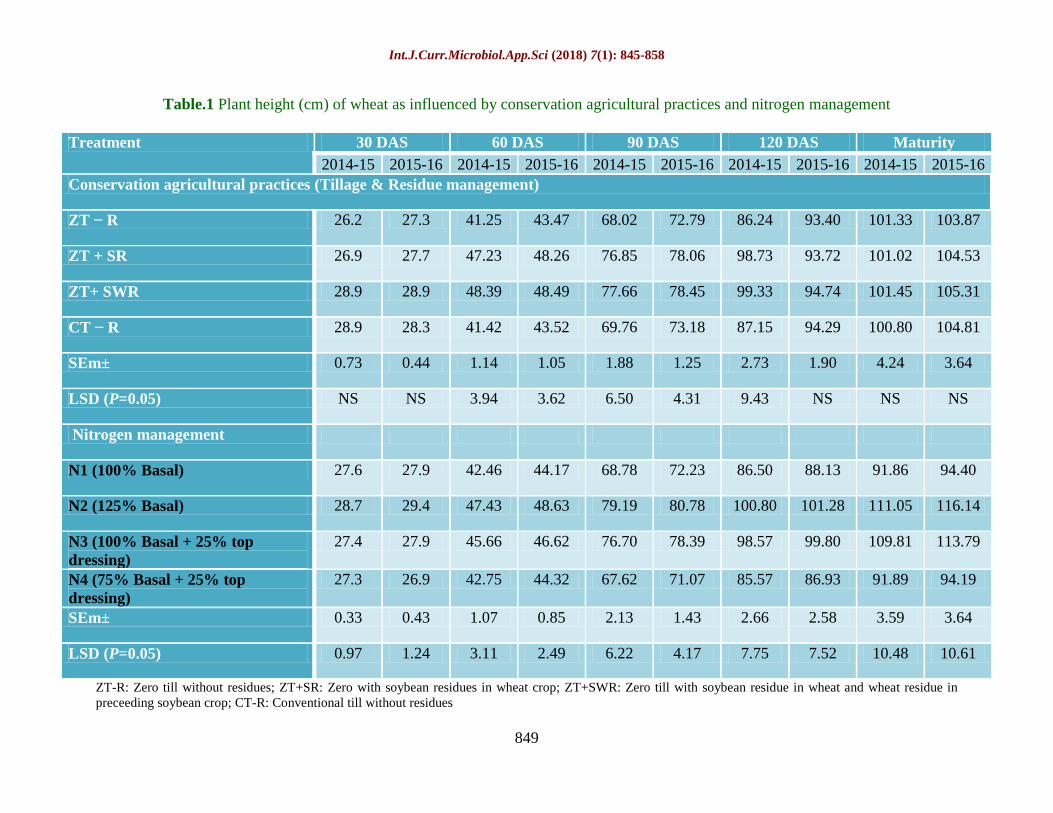
The plant height of wheat at all stages was
markedly influenced due to the conservation
agricultural practices and nitrogen
management during both the years of
experimentation (Table 1). Plant height
increased progressively with advancement of
crop growth stages. Early phase of growth
showed non-significant difference due to
conservation agricultural practices during both
the year of study. However, in later crop
growth stages significantly maximum plant
height was observed with the ZT+SWR at par
with ZT+SR and significantly superior to
CT−R and ZT−R. during both the years. The
higher growth attributes in zero tilled residue
applied plots was due to the improved soil
conditions and increased availability of
nutrients resulted from the adjustment of
abundant microorganisms after straw residue
returning to the field (Xu et al., 2010).
Among the various nitrogen management
practices, maximum plant height was observed
with basal application of 125% RDN at all
crop growth stages of wheat, which were at
par with 100% basal + 25% top dressing and
significantly superior to other two treatments.
The shortest plant height was observed with
75% basal + 25% top dressing and it was at
par with basal application of 100% RDN
during both the years of study.
The increase in plant height with increased
nitrogen application might be due to enhanced
vegetative growth with more N supply to plant
(Olsen et al., 2002). There was no-significant
interactive effect of conservation agricultural
practices and nitrogen management on plant
height during both the years of
experimentation.

Int.J.Curr.Microbiol.App.Sci (2018) 7(1): 845-858
848
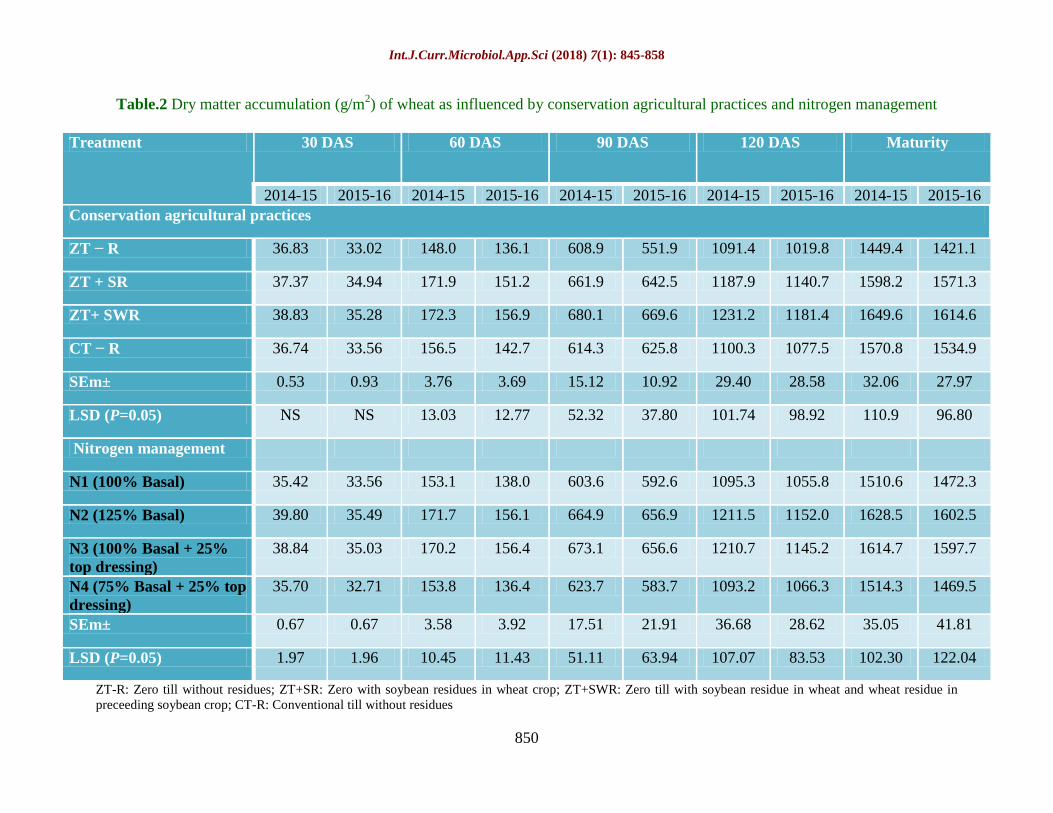
Dry matter accumulation
The dry matter accumulation was significantly
affected by the conservation agricultural
practices and nitrogen management (Table 2).
As is evident from the data, the dry matter
accumulation was slow during initial stages,
then increased steadily with the advancement
of age of crop and attained maximum value at
maturity. The highest dry matter was
accumulated with ZT+SWR and it was at par
with ZT+SR and significantly superior to rest
of the treatments during both the years of
study. In ZT+SWR the DMA was improved
by 14.1, 10.5, 11.4 and 12.1% at 60, 90, 120
DAS and at maturity compared to ZT−R
during 2014-15 and 13.3, 17.6, 13.7 and 12%
during 2015-16. The highest dry matter
accumulation in zero tillage with residue
retention might be due to moderated soil
temperature, favorable soil moisture and
improved soil biota by constant supply of
nutrients through mineralization of residues
(Kumar et al., 2017).
Among the nitrogen management practices
basal application of 125% RDN recorded
highest dry matter accumulation which were at
par with 100% basal + 25% top dressing and
was significantly superior over basal
application of 100% RDN and 75% basal +
25% top dressing. Nitrogen is considered to be
vitally important plant nutrient. It is necessary
for chlorophyll synthesis and as a part of the
chlorophyll molecule, which is the primary
absorber of light energy needed for
photosynthesis. Thus increasing the amount of
N increased the chlorophyll content to the
maximum and the dry matter accumulation
(Rahman et al., 2014).
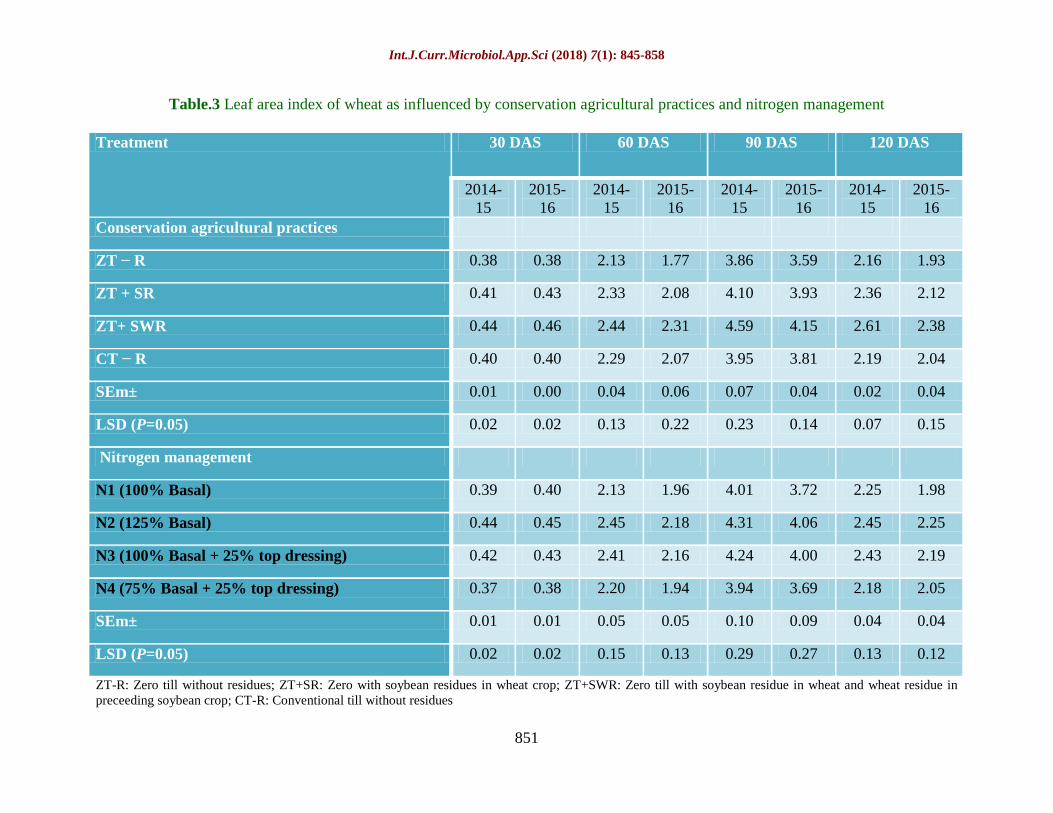
Leaf area index
The data pertaining to LAI was influenced
significantly under various conservation
agricultural practices and nitrogen
management treatments at 30, 60, 90 and 120
DAS (Table 3). Initially at 30 days crop, the
LAI was the lowest, increased with advancing
age of plant and highest values were obtained
at later stage of crop during both the years.
The highest LAI values at different growth
stages were obtained under ZT+SWR and it
was on par with ZT+SR and the lowest were
under ZT− R which in turn on par with CT− R
during 2014-15 and 2015-16. This was
possibly due to enhanced soil health and
micro-environment by implementation of zero
tillage and residue retention practices (Kumar
et al., 2017).
Among the nitrogen management treatments,
basal application of 125% RDN recorded
highest LAI which were onpar with 100%
basal + 25% top dressing and was
significantly superior over basal application of
100% RDN and 75% basal + 25% top
dressing. This might be due to favorable
synthesis of growth favouring constituents in
plant system due to better supply of nitrogen,
which led to the increased number of leaves
per unit area resulting in enlargement in leaf
area (Alam, 2013).
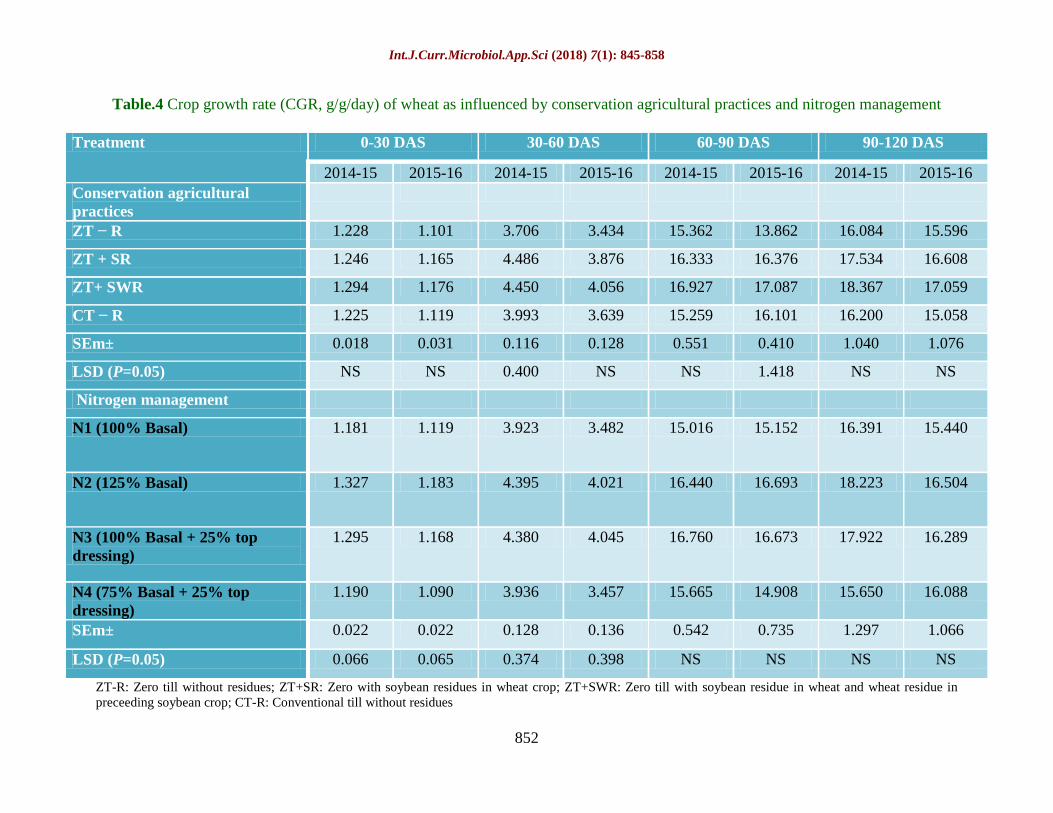
Physiological indices
Mean crop growth rate (CGR)
The mean crop growth rate of wheat was
markedly influenced by conservation
agricultural practices and nitrogen
management (Table 4). In general, the CGR
values were lowest between 0 to 30 days,
increased gradually and attained highest
values between 60 to 90 days and further
decreased near maturity. Mean CGR was
highest under ZT+SWR but at later stages it
was found to be non-significant during both
the year of study except at 60-90 DAS during
second year in which mean CGR with
ZT+SWR and ZT+SR were found at par.
Int.J.Curr.Microbiol.App.Sci (2018) 7(1): 845-858
849
Table.1 Plant height (cm) of wheat as influenced by conservation agricultural practices and nitrogen management
Treatment 30 DAS 60 DAS 90 DAS 120 DAS Maturity
2014-15 2015-16 2014-15 2015-16 2014-15 2015-16 2014-15 2015-16 2014-15 2015-16
Conservation agricultural practices (Tillage & Residue management)
ZT − R 26.2 27.3 41.25 43.47 68.02 72.79 86.24 93.40 101.33 103.87
ZT + SR 26.9 27.7 47.23 48.26 76.85 78.06 98.73 93.72 101.02 104.53
ZT+ SWR 28.9 28.9 48.39 48.49 77.66 78.45 99.33 94.74 101.45 105.31
CT − R 28.9 28.3 41.42 43.52 69.76 73.18 87.15 94.29 100.80 104.81
SEm± 0.73 0.44 1.14 1.05 1.88 1.25 2.73 1.90 4.24 3.64
LSD (P=0.05) NS NS 3.94 3.62 6.50 4.31 9.43 NS NS NS
Nitrogen management
N1 (100% Basal) 27.6 27.9 42.46 44.17 68.78 72.23 86.50 88.13 91.86 94.40
N2 (125% Basal) 28.7 29.4 47.43 48.63 79.19 80.78 100.80 101.28 111.05 116.14
N3 (100% Basal + 25% top
dressing)
27.4 27.9 45.66 46.62 76.70 78.39 98.57 99.80 109.81 113.79
N4 (75% Basal + 25% top
dressing)
27.3 26.9 42.75 44.32 67.62 71.07 85.57 86.93 91.89 94.19
SEm± 0.33 0.43 1.07 0.85 2.13 1.43 2.66 2.58 3.59 3.64
LSD (P=0.05) 0.97 1.24 3.11 2.49 6.22 4.17 7.75 7.52 10.48 10.61
ZT-R: Zero till without residues; ZT+SR: Zero with soybean residues in wheat crop; ZT+SWR: Zero till with soybean residue in wheat and wheat residue in
preceeding soybean crop; CT-R: Conventional till without residues
Int.J.Curr.Microbiol.App.Sci (2018) 7(1): 845-858
850
Table.2 Dry matter accumulation (g/m2) of wheat as influenced by conservation agricultural practices and nitrogen management
Treatment 30 DAS 60 DAS 90 DAS 120 DAS Maturity
2014-15 2015-16 2014-15 2015-16 2014-15 2015-16 2014-15 2015-16 2014-15 2015-16
Conservation agricultural practices
ZT − R 36.83 33.02 148.0 136.1 608.9 551.9 1091.4 1019.8 1449.4 1421.1
ZT + SR 37.37 34.94 171.9 151.2 661.9 642.5 1187.9 1140.7 1598.2 1571.3
ZT+ SWR 38.83 35.28 172.3 156.9 680.1 669.6 1231.2 1181.4 1649.6 1614.6
CT − R 36.74 33.56 156.5 142.7 614.3 625.8 1100.3 1077.5 1570.8 1534.9
SEm± 0.53 0.93 3.76 3.69 15.12 10.92 29.40 28.58 32.06 27.97
LSD (P=0.05) NS NS 13.03 12.77 52.32 37.80 101.74 98.92 110.9 96.80
Nitrogen management
N1 (100% Basal) 35.42 33.56 153.1 138.0 603.6 592.6 1095.3 1055.8 1510.6 1472.3
N2 (125% Basal) 39.80 35.49 171.7 156.1 664.9 656.9 1211.5 1152.0 1628.5 1602.5
N3 (100% Basal + 25%
top dressing)
38.84 35.03 170.2 156.4 673.1 656.6 1210.7 1145.2 1614.7 1597.7
N4 (75% Basal + 25% top
dressing)
35.70 32.71 153.8 136.4 623.7 583.7 1093.2 1066.3 1514.3 1469.5
SEm± 0.67 0.67 3.58 3.92 17.51 21.91 36.68 28.62 35.05 41.81
LSD (P=0.05) 1.97 1.96 10.45 11.43 51.11 63.94 107.07 83.53 102.30 122.04
ZT-R: Zero till without residues; ZT+SR: Zero with soybean residues in wheat crop; ZT+SWR: Zero till with soybean residue in wheat and wheat residue in
preceeding soybean crop; CT-R: Conventional till without residues
Int.J.Curr.Microbiol.App.Sci (2018) 7(1): 845-858
851
Table.3 Leaf area index of wheat as influenced by conservation agricultural practices and nitrogen management
Treatment 30 DAS 60 DAS 90 DAS 120 DAS
2014-
15
2015-
16
2014-
15
2015-
16
2014-
15
2015-
16
2014-
15
2015-
16
Conservation agricultural practices
ZT − R 0.38 0.38 2.13 1.77 3.86 3.59 2.16 1.93
ZT + SR 0.41 0.43 2.33 2.08 4.10 3.93 2.36 2.12
ZT+ SWR 0.44 0.46 2.44 2.31 4.59 4.15 2.61 2.38
CT − R 0.40 0.40 2.29 2.07 3.95 3.81 2.19 2.04
SEm± 0.01 0.00 0.04 0.06 0.07 0.04 0.02 0.04
LSD (P=0.05) 0.02 0.02 0.13 0.22 0.23 0.14 0.07 0.15
Nitrogen management
N1 (100% Basal) 0.39 0.40 2.13 1.96 4.01 3.72 2.25 1.98
N2 (125% Basal) 0.44 0.45 2.45 2.18 4.31 4.06 2.45 2.25
N3 (100% Basal + 25% top dressing) 0.42 0.43 2.41 2.16 4.24 4.00 2.43 2.19
N4 (75% Basal + 25% top dressing) 0.37 0.38 2.20 1.94 3.94 3.69 2.18 2.05
SEm± 0.01 0.01 0.05 0.05 0.10 0.09 0.04 0.04
LSD (P=0.05) 0.02 0.02 0.15 0.13 0.29 0.27 0.13 0.12
ZT-R: Zero till without residues; ZT+SR: Zero with soybean residues in wheat crop; ZT+SWR: Zero till with soybean residue in wheat and wheat residue in
preceeding soybean crop; CT-R: Conventional till without residues
Int.J.Curr.Microbiol.App.Sci (2018) 7(1): 845-858
852
Table.4 Crop growth rate (CGR, g/g/day) of wheat as influenced by conservation agricultural practices and nitrogen management
Treatment 0-30 DAS 30-60 DAS 60-90 DAS 90-120 DAS
2014-15 2015-16 2014-15 2015-16 2014-15 2015-16 2014-15 2015-16
Conservation agricultural
practices
ZT − R 1.228 1.101 3.706 3.434 15.362 13.862 16.084 15.596
ZT + SR 1.246 1.165 4.486 3.876 16.333 16.376 17.534 16.608
ZT+ SWR 1.294 1.176 4.450 4.056 16.927 17.087 18.367 17.059
CT − R 1.225 1.119 3.993 3.639 15.259 16.101 16.200 15.058
SEm± 0.018 0.031 0.116 0.128 0.551 0.410 1.040 1.076
LSD (P=0.05) NS NS 0.400 NS NS 1.418 NS NS
Nitrogen management
N1 (100% Basal) 1.181 1.119 3.923 3.482 15.016 15.152 16.391 15.440
N2 (125% Basal) 1.327 1.183 4.395 4.021 16.440 16.693 18.223 16.504
N3 (100% Basal + 25% top
dressing)
1.295 1.168 4.380 4.045 16.760 16.673 17.922 16.289
N4 (75% Basal + 25% top
dressing)
1.190 1.090 3.936 3.457 15.665 14.908 15.650 16.088
SEm± 0.022 0.022 0.128 0.136 0.542 0.735 1.297 1.066
LSD (P=0.05) 0.066 0.065 0.374 0.398 NS NS NS NS
ZT-R: Zero till without residues; ZT+SR: Zero with soybean residues in wheat crop; ZT+SWR: Zero till with soybean residue in wheat and wheat residue in
preceeding soybean crop; CT-R: Conventional till without residues
Int.J.Curr.Microbiol.App.Sci (2018) 7(1): 845-858
853
Table.5 Relative growth rate (RGR, mg/g/day) of wheat as influenced by conservation agricultural practices and nitrogen
management
Treatment RGR
30-60 DAS 60-90 DAS 90-120
2014-15 2015-16 2014-15 2015-16 2014-15 2015-16
Conservation agricultural practices
ZT − R 46.26 47.24 47.05 46.74 19.52 20.47
ZT + SR 50.87 48.78 45.01 48.07 19.43 19.35
ZT+ SWR 49.65 49.59 45.81 48.41 19.69 18.88
CT − R 48.34 48.15 45.44 49.26 19.44 18.18
SEm± 0.70 1.23 1.22 1.20 1.10 1.09
LSD (P=0.05) 2.41 NS NS NS NS NS
Nitrogen management
N1 (100% Basal) 48.69 47.19 45.65 48.49 19.92 19.22
N2 (125% Basal) 48.66 49.29 45.10 47.83 20.04 18.76
N3 (100% Basal + 25% top dressing) 49.22 49.67 45.85 47.88 19.46 18.68
N4 (75% Basal + 25% top dressing) 48.55 47.62 46.71 48.29 18.65 20.22
SEm± 1.11 1.21 0.88 1.42 1.38 1.26
LSD (P=0.05) NS NS NS NS NS NS
ZT-R: Zero till without residues; ZT+SR: Zero with soybean residues in wheat crop; ZT+SWR: Zero till with soybean residue in wheat and wheat residue in
preceeding soybean crop; CT-R: Conventional till without residues
Int.J.Curr.Microbiol.App.Sci (2018) 7(1): 845-858
854
Table.6 Net assimilation rate (NAR, mg/m2
leaf area/day) of wheat as influenced by conservation agricultural practices and nitrogen
management
Treatment NAR
30-60 DAS 60-90 DAS 90-120 DAS
2014-15 2015-16 2014-15 2015-16 2014-15 2015-16
Conservation agricultural practices
ZT − R 3.644 3.824 5.270 5.420 5.544 5.864
ZT + SR 4.083 3.707 5.241 5.636 5.587 5.707
ZT+ SWR 3.847 3.537 4.997 5.447 5.248 5.391
CT − R 3.697 3.618 5.025 5.656 5.442 5.318
SEm± 0.089 0.180 0.195 0.157 0.385 0.354
LSD (P=0.05) 0.307 NS NS NS NS NS
Nitrogen management
N1 (100% Basal) 3.813 3.578 5.051 5.521 5.400 5.603
N2 (125% Basal) 3.767 3.686 5.006 5.535 5.555 5.420
N3 (100% Basal + 25% top dressing) 3.864 3.792 5.203 5.599 5.540 5.454
N4 (75% Basal + 25% top dressing) 3.827 3.630 5.273 5.503 5.325 5.803
SEm± 0.139 0.164 0.185 0.261 0.454 0.393
LSD (P=0.05) NS NS NS NS NS NS
ZT-R: Zero till without residues; ZT+SR: Zero with soybean residues in wheat crop; ZT+SWR: Zero till with soybean residue in wheat and wheat residue in
preceeding soybean crop; CT-R: Conventional till without residues
Int.J.Curr.Microbiol.App.Sci (2018) 7(1): 845-858
855
Table.7 Effect of conservation agricultural practices and nitrogen management on biological properties of soil in soybean-wheat
cropping system
Treatment FDA
(ug fluorescein
g-1
soil hr-1
)
Alkaline
phosphatise
(ug hr-1
g-1
soil)
Dehydrogenase
(TPF hr-1
g-1
soil)
Microbial biomass carbon
(ug g-1
soil)
Conservation agricultural practices
ZT − R 3.60 8.83 6.50 131.86
ZT + SR 4.34 10.91 7.21 143.81
ZT+ SWR 4.71 11.96 7.97 153.55
CT − R 3.30 7.99 5.74 121.91
SEm± 0.14 0.39 0.14 5.27
LSD (P=0.05) 0.48 1.36 0.49 18.25
Nitrogen management
N1 (100% Basal) 3.78 9.32 6.76 129.15
N2 (125% Basal) 4.16 10.41 7.27 154.41
N3 (100% Basal + 25% top
dressing)
4.13 10.33 7.05 139.07
N4 (75% Basal + 25% top
dressing)
3.89 9.64 6.34 128.49
SEm± 0.08 0.24 0.16 4.82
LSD (P=0.05) 0.25 0.70 0.48 14.08
ZT-R: Zero till without residues; ZT+SR: Zero with soybean residues in wheat crop; ZT+SWR: Zero till with soybean residue in wheat and wheat residue in
preceeding soybean crop; CT-R: Conventional till without residues
Int.J.Curr.Microbiol.App.Sci (2018) 7(1): 845-858
856
Residue retention in zero tillage plots increase
infiltration rate, soil organic matter which
facilitate easy nutrient availability to the plants,
resulted better plant growth and development
(Jat et al., 2017). Nitrogen management
practices, significantly influenced the mean
CGR only in the initial stages later it was found
non-significant during both the years of study.
Highest mean CGR at 0-30 and 30-60 was
found with basal application of 125% RDN
which were onpar with 100% basal + 25% top
dressing and was significantly superior over
basal application of 100% RDN and 75% basal
+ 25% top dressing. This was due to the role of
nitrogen in production and translocation of
cytokinin from the root to the shoots. Thus
increased levels of nitrogen application
increases cell division rate and crop growth
(Timothy and Joe, 2003).
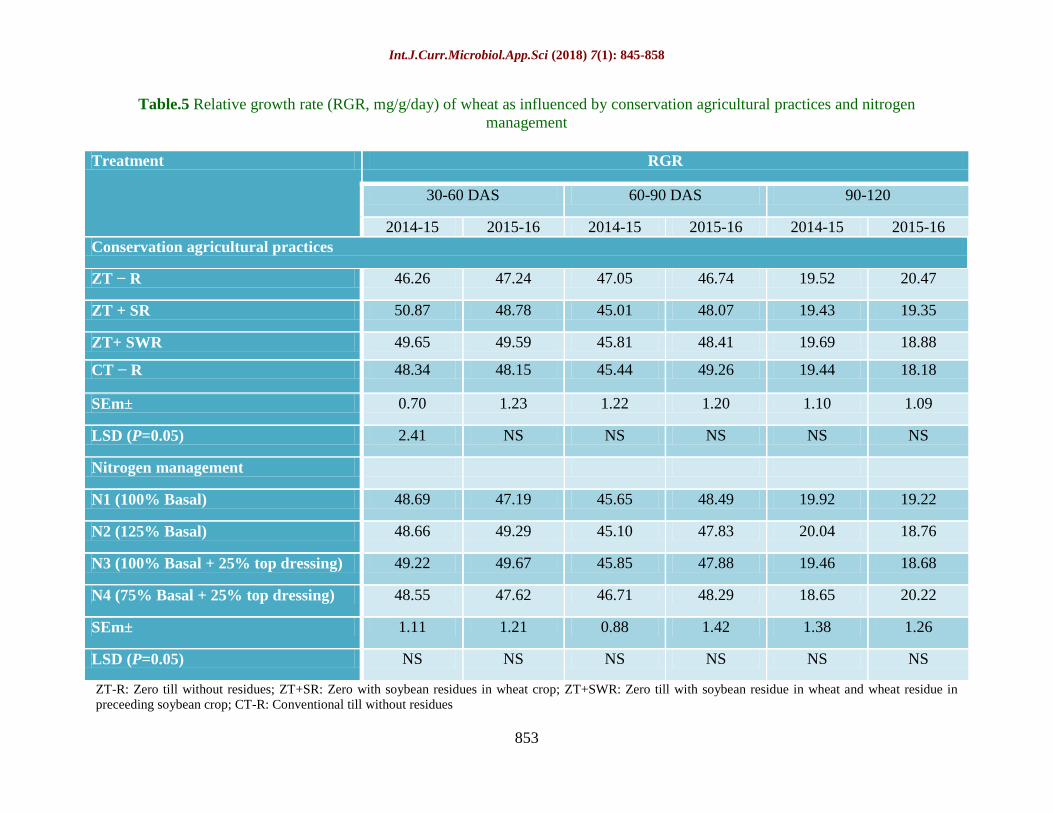
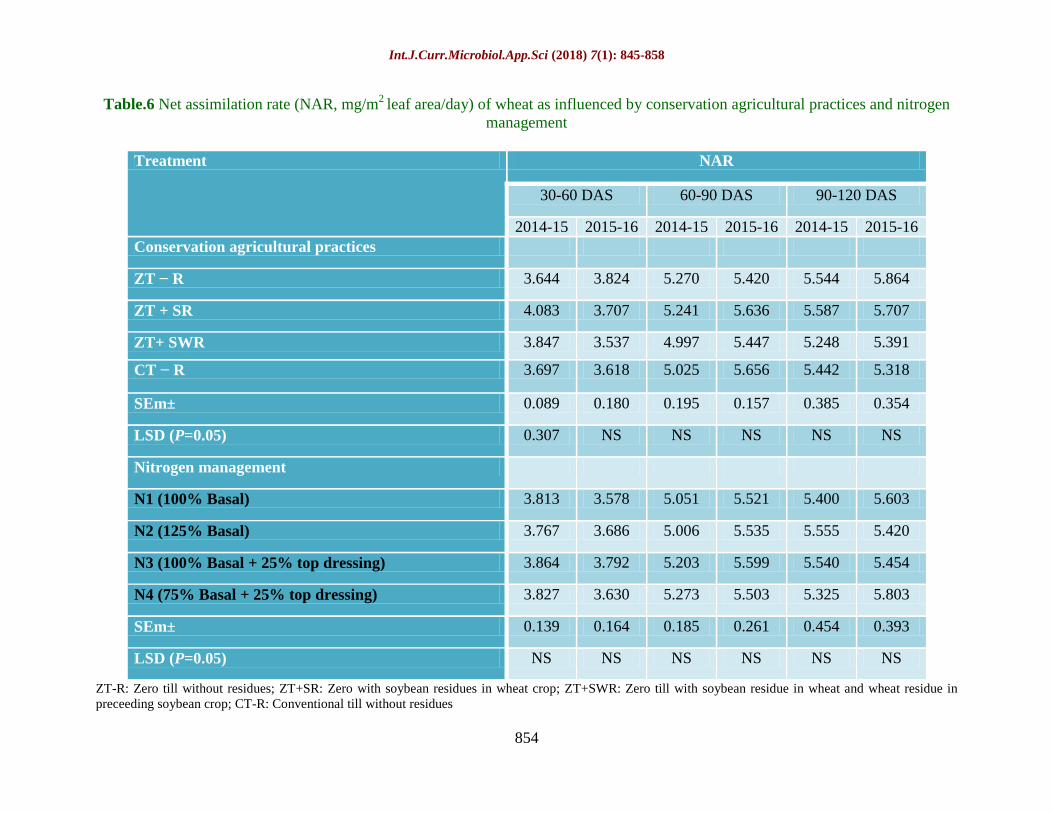
Relative growth rate (RGR) and net
assimilation rate (NAR)
In general, the mean RGR and NAR were
higher during 30 to 60 days crop and later
decreased between 60 to 90 and 90 to 120 days
duration. Data related to RGR and NAR showed
that under different conservation agricultural
practices and nitrogen management it was not
significantly affected (Table 5 and 6). However
numerically higher values of mean RGR and
mean NAR were observed with ZT+SWR
followed by ZT+SR, CT+NR and ZT+NR.
Residue retention in zero tilled plots resulted in
higher organic carbon, improved soil porosity,
enhanced microbial population and infiltration
rate which provided more favourable conditions
for the crop growth and development (Jat et al.,
2014). Among the nitrogen management
practices, basal application of 125% RDN gave
numerically higher values of mean CGR and
mean RGR followed by 100% basal + 25% top
dressing, basal application of 100% RDN and
75% basal + 25% top dressing. Since nitrogen
increases photosynthetic tissues, higher nitrogen
fertilizer has higher RGR (Azarpour et al.,
2014).
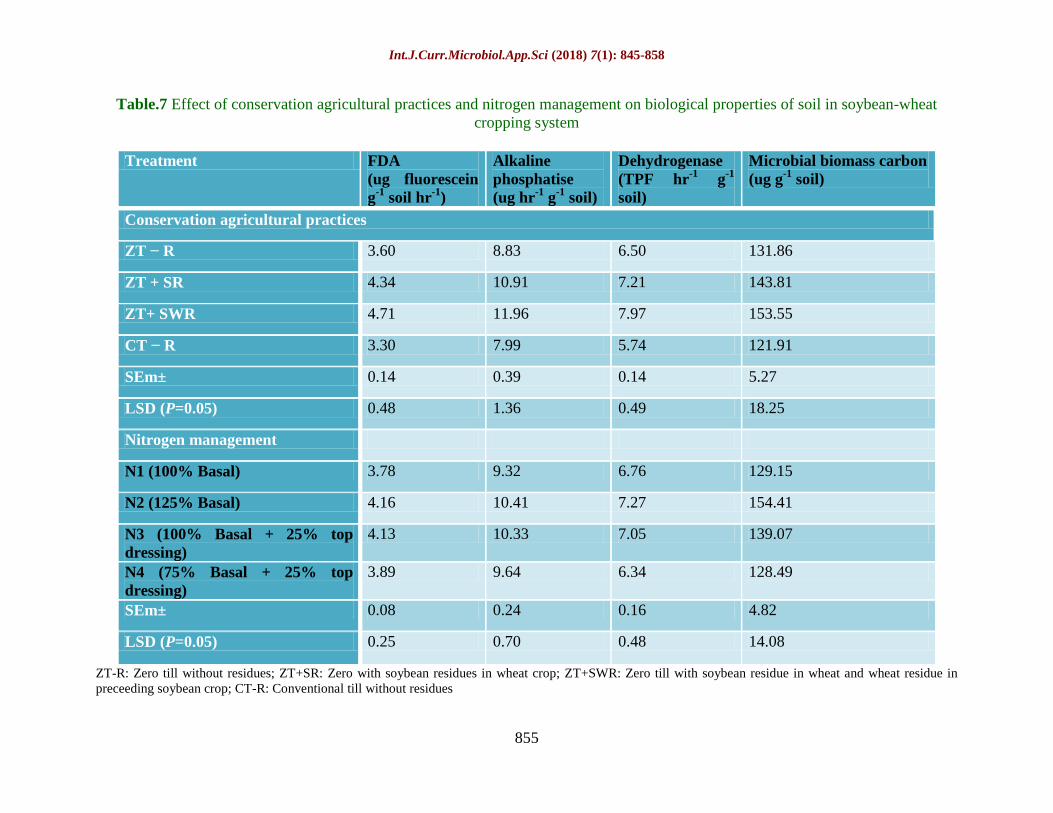
Soil microbial parameters
The different conservation agricultural practices
differed significantly with respect to soil
microbial parameters (dehydrogenase, alkaline
phosphatase, FDA and MBC) estimated after
harvest of second season wheat crop (Table 7).
ZT+SWR resulted in significantly highest
activity of dehydrogenase, alkaline phosphatase,
FDA and MBC in soil after harvest of wheat
crop of the soybean-wheat cropping system.
Critical examination of data further revealed
that application of residues significantly
increased the microbial activities in soil after
harvest of crops as compared to no residue
treatments.
The balanced amount of nutrients supplied,
maintained and slightly increased the nutrients
availability and organic carbon content in soil
after the decomposition of residues served as a
substrate for better activity of microbes that
ultimately reflected in higher enzymatic activity
in soil. The balanced nutrient supply improves
the root biomass and rhizosphere leading to
higher microbial and enzymatic activities in
soil. Dong et al., (2009) reported that the mean
annual MBC was highest under no-tillage with
residue, while lowest in conventional tillage.
The no tillage system having crop residue
showed increase of 103 %, 54 % and 36% for
MBC, N and P, respectively at the 0 to 5 cm
depth than CT (Balato et al., 2003).
And among the nitrogen management practices,
application of 125% RDN treatments either as
basal or top dressing resulted in significantly
higher activity of dehydrogenase, alkaline
phosphatase, FDA and MBC. This shows that
higher rate of N fertilization enhanced the
activities of soil enzymes without any
detrimental effect on the enzyme dynamics of
the soil. This is because nitrogen not only
provide necessary mineral elements for plant
growth, but also act as important indicator for
soil natural fertility as there is a close
relationship between soil nutrients and soil
enzyme activity (Malvi, 2011).
Int.J.Curr.Microbiol.App.Sci (2018) 7(1): 845-858
857
Due to continuous intensive tillage practices in
conventional agriculture system and
indiscriminate and imbalance use of fertilizers,
productivity of wheat has been plateau or
shown a decline trend in IGP which needs to be
sustained or enhanced by using conservation
agricultural practices on long term basis. The
study revealed that significantly higher growth
performance of wheat and increased microbial
activity in soil can be achieved under zero
tillage with residue retention plots as compared
to conventional tillage without residues.
Applications of 25% higher recommended dose
of nitrogen either as basal or top dressing
significantly improved the growth performance
of wheat. Thus zero tillage with soybean and
wheat residues coupled with application of 25%
higher recommended dose of nitrogen would
improve the soil biological health and better
growth performance of wheat in IGP of India.
References
Alam, M.S. 2013. Growth and yield potentials
of wheat as affected by management
practices. African Journal of Agricultural
Research, 8(47): 6068-6072.
Arora, V.K., Sidhu, A.S., Sandhu, K.S., Thind,
S.S. 2010. Effects of tillage intensity,
planting time and nitrogen rate on wheat
yield following rice. Experimental
Agriculture 46: 267–275.
Azarpour, E., Amiri, E., Kashani, A.,
Khodabande, N. and Moradi, M. 2012.
Evaluation of some growth indices on
vegetative and reproductive stage of rice
cultivars under nitrogen fertilizer
management. Journal of Biology Science,
5(4): 1-10
Balato E L, Colozzi-Filho A, Andrade D S and
Dick R P. 2003. Microbial biomass in
soils under different tillage and crop
rotation systems. Biology and Fertility of
Soils 38: 15–20.
Casida L E J, Klein D A and Santaro T. 1964.
Soil dehydrogenase activity. Soil Science
98: 371–376
Derpsch, R. and Moriya, K. 1999. Implications
of soil preparation as compared to no-
tillage on the sustainability of crop
production: experiences from South
America. In Management of tropical
agro-ecosystems and the beneficial soil
biota (ed. M. V. Reddy), pp. 49–65.
Enfield, NH: Science Publishers.
Dong W, Hu C, Chen S and Zhang Y. 2009.
Tillage and residue management effects
on soil carbon and CO2 emission in wheat
– corn double-cropping system. Nutrient
Cycling in Agroecosystems 83: 27 – 37.
Drinkwater, L.E., Janke, R.R. and Rossoni-
Longnecker, L. 2000. Effects of tillage
intensity on nitrogen dynamics and
productivity in legume-based grain
systems. Plant and Soil 227: 99–113.
FAO, 2008. What is Conservation Agriculture.
in: Conservation Agriculture website of
FAO, http://www.fao.org/ag/ca/1a.html
FAO. 2011. CA Adoption Worldwide: FAO-
CA available online http://www.fao.org/
ag/ca/6c.html.
Friedrich, T., Derpsch, R. and Kassam, A. 2012.
Overview of the global spread of
conservation agriculture, Field Actions
Science Reports, Special Issue 6.
Gouaerts, B., Mezzalama, M., Unno, Y., Sayre,
K. D., Luna-Guido, M., Vanherck, K.,
Dendoouen L. and Deckers J. 2007.
Influence of tillage, residue management,
and crop rotation on soil microbial
biomass and catabolic diversity. Applied
Soil Ecology, 37: 18–30.
Green, V. S., Stott, D. E and Diack, M. 2006.
Assay for fluorescein diacetate hydrolytic
activity: optimization for soil samples.
Soil Biology and Biochemistry 38(4):
693-701.
He, J.Z., Shen, J. P., Zhang, L. M., Zhu, Y. G.,
Zheng Y. M., Xu, M.G., Di, H. 2007.
Quantitative analyses of the abundance
and composition of ammonia-oxidizing
bacteria and ammonia-oxidizing archaea
of a Chinese upland red soil under long-
term fertilization practices.
Environmental Microbiology, 9: 2364–
2374.
Jat, H.S., Datta, A., Sharma, P.C., Kumar, V.,
Yadav, A.K., Choudhary, M., Choudhary,
Int.J.Curr.Microbiol.App.Sci (2018) 7(1): 845-858
858
V., Gathala, M.K., Sharma, D.K., Jat,
M.L. and Yaduvanshi, N. P. S. 2017.
Assessing soil properties and nutrient
availability under conservation
agriculture practices in a reclaimed sodic
soil in cereal-based systems of North-
West India. Archives of Agronomy and
Soil Science: 1-15.
Jat, R.K., Sapkota, T.B., Singh, R.G., Jat, M.L.,
Kumar, M. and Gupta, R.K., 2014. Seven
years of conservation agriculture in a
rice–wheat rotation of Eastern Gangetic
Plains of South Asia: yield trends and
economic profitability. Field Crops
Research, 164: 199-210.
Kumar, N., Kamboj, B.R., Thakral, S.K. and
Singh, M., 2017. Growth Parameters and
Productivity of Wheat as Influenced by
Crop Establishment Methods and
Different Seed Rate. International
Journal of Pure and Applied Bioscience,
5(4): 2134-2140.
Malvi, U.R. 2011. Interaction of micronutrients
with major nutrients with special
reference to potassium. Karnataka
Journal of Agricultural Sciences, 24(1):
106-109
McConkey, B.G., Curtin, D., Campbell, C.A.,
Brandt, S.A. and Selles, F. 2002. Crop
and soil nitrogen status of tilled and no-
tillage systems in semiarid regions of
Saskatchewan. Canadian Journal of Soil
Science 82: 489–498.
Meena, J.R., Behera, U.K., Chakraborty, D. and
Sharma, A.R., 2015. Tillage and residue
management effect on soil properties,
crop performance and energy relations in
greengram (Vigna radiata L.) under
maize-based cropping systems.
International Soil and Water
Conservation Research, 3(4): 261-272.
Nunan N, Morgan M A and Herlihy M. 1998.
Ultraviolet absorbance (280 nm) of
compounds released from soil during
chloroform fumigation as an estimate of
the microbial biomass. Soil Biology and
Biochemistry 30(12): 1599–1603.
Olesen, J.E., Berntsen, J., Hansen, E.M.,
Petersen, B.M. and Petersen, J., 2002.
Crop nitrogen demand and canopy area
expansion in winter wheat during
vegetative growth. European Journal of
Agronomy, 16(4): 279-294.
Radford P.J. 1967. Growth analysis formula -
their use and abuse. Crop Science, 7: 171-
175.
Rahman, M.Z., Islam, M.R., Islam, M.T. and
Karim, M.A., 2014. Dry matter
accumulation, leaf area index and yield
responses of wheat under different levels
of nitrogen. Bangladesh Journal of
Agriculturist, 7(1): 27-32.
Sharma, S.K. and Sharma, S.N., 2004. Effect of
cropping and nutrients applied to
preceding crops on yield, nutrient uptake
and economics of mungbean. Indian
Journal of Pulses Research, 17(2): 138-
142.
Singh, Y., Singh, B. and Timsina, J. 2005. Crop
residue management for nutrient cycling
and improving soil productivity in rice-
based cropping systems in the tropics.
Advances in Agronomy 85: 269–407.
Timothy W, Joe E. 2003. Rice fertilization.
Mississippi agricultural and forestry
experiment station 13(48): 1-4.
Xu, Y., Nie, L., Buresh, R.J., Huang, J., Cui, K.,
Xu, B., Gong, W. and Peng, S. 2010.
Agronomic performance of late-season
rice under different tillage, straw and
nitrogen management. Field Crops
Research 115: 79–84.
How to cite this article:
Swarna Ronanki and Behera, U.K. 2018. Effect of Tillage, Crop Residues and Nitrogen
Management Practices on Growth Performance and Soil Microbial Parameters in Wheat.
Int.J.Curr.Microbiol.App.Sci. 7(01): 845-858. doi: https://doi.org/10.20546/ijcmas.2018.701.103