Embed Size (px)
Citation preview
Michigan Technological University Michigan Technological University
Digital Commons @ Michigan Tech Digital Commons @ Michigan Tech
Michigan Tech Publications
9-6-2017
Effect of thermodenuding on the structure of nascent flame soot Effect of thermodenuding on the structure of nascent flame soot
aggregates aggregates
Janarjan Bhandari Michigan Technological University, [email protected]
Swarup China Michigan Technological University
Timothy Onasch Aerodyne Research Inc
Lindsay Wolff Boston College
Andrew Lambe Aerodyne Research Inc
See next page for additional authors
Follow this and additional works at: https://digitalcommons.mtu.edu/michigantech-p
Part of the Physics Commons
Recommended Citation Recommended Citation Bhandari, J., China, S., Onasch, T., Wolff, L., Lambe, A., Davidovits, P., Mazzoleni, C., & et al. (2017). Effect of thermodenuding on the structure of nascent flame soot aggregates. Atmosphere, 8(9), 166. http://doi.org/10.3390/atmos8090166 Retrieved from: https://digitalcommons.mtu.edu/michigantech-p/1871
Follow this and additional works at: https://digitalcommons.mtu.edu/michigantech-p
Part of the Physics Commons

Authors Authors Janarjan Bhandari, Swarup China, Timothy Onasch, Lindsay Wolff, Andrew Lambe, Paul Davidovits, Claudio Mazzoleni, and et al.
This article is available at Digital Commons @ Michigan Tech: https://digitalcommons.mtu.edu/michigantech-p/1871

atmosphere
Article
Effect of Thermodenuding on the Structure ofNascent Flame Soot Aggregates
Janarjan Bhandari 1,*, Swarup China 1,†, Timothy Onasch 2,3, Lindsay Wolff 3, Andrew Lambe 2,3,Paul Davidovits 3, Eben Cross 2, Adam Ahern 4, Jason Olfert 5, Manvendra Dubey 6 andClaudio Mazzoleni 1,*
1 Department of Physics and Atmospheric Sciences Program, Michigan Technological University,Houghton, MI 49931, USA; [email protected]
2 Aerodyne Research Inc., Billerica, MA 01821, USA; [email protected] (T.O.);[email protected] (A.L.); [email protected] (E.C.)
3 Chemistry Department, Boston College, Chestnut Hill, MA 02467, USA; [email protected] (L.W.);[email protected] (P.D.)
4 Centre for Atmospheric Particle Studies, Carnegie Mellon University, Pittsburgh, PA 15232, USA;[email protected]
5 Department of Mechanical Engineering, University of Alberta, Edmonton, AB T6G 2G8, Canada;[email protected]
6 Earth and Environmental Sciences Division, Los Alamos National Laboratory, Los Alamos, NM 87545, USA;[email protected]
* Correspondence: [email protected] (J.B.); [email protected] (C.M.)† Current address: Pacific Northwest National Laboratory, Richland, WA 99354, USA.
Received: 27 July 2017; Accepted: 31 August 2017; Published: 6 September 2017
Abstract: The optical properties (absorption and scattering) of soot particles depend on soot size andindex of refraction, but also on the soot complex morphology and the internal mixing with materialsthat can condense on a freshly emitted (nascent) soot particle and coat it. This coating can affect thesoot optical properties by refracting light, or by changing the soot aggregate structure. A commonapproach to studying the effect of coating on soot optical properties is to measure the absorption andscattering coefficients in ambient air, and then measure them again after removing the coating usinga thermodenuder. In this approach, it is assumed that: (1) most of the coating material is removed;(2) charred organic coating does not add to the refractory carbon; (3) oxidation of soot is negligible;and, (4) the structure of the pre-existing soot core is left unaltered, despite the potential oxidation ofthe core at elevated temperatures. In this study, we investigated the validity of the last assumption, bystudying the effect of thermodenuding on the morphology of nascent soot. To this end, we analyzedthe morphological properties of laboratory generated nascent soot, before and after thermodenuding.Our investigation shows that there is only minor restructuring of nascent soot by thermodenuding.
Keywords: thermodenuding; soot morphology; aggregates; compaction; restructuring
1. Introduction
Soot particles are mostly composed of refractory carbonaceous material that forms fromincomplete combustion during burning activities [1]. A nascent soot particle appears as a fractal-like(sometimes referred to as a lacy) aggregate of small spherules (called nanospheres or monomers) [2]and its structure is scale invariant [3]. Here, the term “nascent” is used to refer to freshly emittedsoot particles that have a negligible coating on the monomers. The diameter of these monomersvaries in a range from 10 nm to more than 50 nm, depending on the fuel source and combustionconditions [4–7]. During the atmospheric processing, soot particles interact with organic and inorganicmaterials (in the form of aerosol or condensable vapors). During these interactions, soot undergoes
Atmosphere 2017, 8, 166; doi:10.3390/atmos8090166 www.mdpi.com/journal/atmosphere

Atmosphere 2017, 8, 166 2 of 16
morphological changes including compaction, coagulation, and coating [8]. Combustion generatednascent soot aggregates often have different kinds of polycyclic aromatic hydrocarbons (PAHs) thatthinly coat the monomers, depending upon the flaming conditions and fuel types, even in verycontrolled combustions [9]. In this case, coating is acquired at the source, and not added later throughatmospheric processing. The degree of coating in atmospheric particles is very variable [6,8,10–14]. Insome studies, thinly coated soot particles have been found in large fractions in the atmosphere. Forexample, in the study by China et al. [6], a large fraction (by number) of freshly emitted soot particlescollected on freeway on ramps were thinly coated (72%). In another field study, carried out at PicoMountain Observatory in the Azores, China et al. [8] found that 37% of the soot particles in one sample,were thinly coated, even after days of atmospheric processing during the long range transport in thefree troposphere from the source. These two studies were carried out at very different locations (verynear the source in the first study, and very far from the source in the second study), showing that thinlycoated soot particles can exist in the atmosphere in different environments and geographic locations.In another study, in two plumes one sampled from Mexico City and one from outside of MexicoCity, Adachi and Buseck [4] found that 7% of particles were soot without coating. Coating or internalmixing in general, changes the optical properties of soot, even when the structure of the refractorycomponents remains the same. These changes consequently affect the radiative forcing of soot [15–22].Several studies have also shown that coating of soot by partially-absorbing or non-absorbing materialsincreases the absorption and scattering cross sections [13,18,23–25]. These increases are termed“absorption and scattering enhancements” (Eabs and Esca). The enhancement is typically calculated asthe ratio of the light absorption or scattering coefficient of the coated soot to the light absorption orscattering coefficient of the soot core, after the coating material has been removed [18].
Thermodenuders (TDs) that remove the coating by evaporation, are often used in the fieldand in the laboratory to study and quantify these optical enhancements [16,26–28]. During thethermodenuding process, coated soot particles are passed through a heated column, typically at~200–300 ◦C to evaporate the volatile coating material while leaving behind the refractory soot [29,30].The temperature gradient within the TD can result in particle losses due to thermophoretic forces,though these losses can be measured and accounted for [29]. To correctly assess the Eabs and Esca
using a TD, one needs to make the following assumptions: (1) most of the coating material is removedfrom the soot by the TD; (2) organic coating material does not transform into refractory carbon due tocharring; (3) refractory carbon is not oxidized to a substantial extent under elevated temperatures; and,(4) the structure of the refractory soot particle is unaffected, meaning that the thermodenuding processalone does not induce restructuring of the core lacy soot aggregates.
Contrary to assumption (1), thermodenuding may not remove refractory particulate material, suchas some inorganic salts, and may not remove all of the non-refractory material from soot particles [23].For example, Liu et al. [13] observed that denuded soot still contained heavily coated soot particles,although, in a smaller fraction with respect to ambient particles, suggesting that the TD may notcompletely remove the coating. Healy et al. [12] found that, on average, only 74% of the mass ofcoating material was removed from soot samples after thermodenuding. The mass removal efficiencyby the TD was even less (approximately 60%) for wildfire emission samples. Swanson and Kittelson [31]have also cautioned about semi-volatile particle artifacts due to incomplete removal of evaporatedcompounds in the TD. Similarly, Knox et al. [32] found that there was no significant difference in themass absorption cross section between themodenuded and non-thermodenuded aged-soot particles ascompared to fresh soot, due to the incomplete removal of coating materials from aged soot particles.On the other hand, Khalizov et al. [33] hypothesized that the thermodenuder may remove all of thecoating material from ambient soot, including the coating acquired during atmospheric processing,as well as the nascent coating present on soot at the source, and therefore, they suggested that thedenuded particles cannot represent the nascent soot morphology.
Next, we briefly review assumptions (2) and (3). The elevated temperatures during thethermodenuding process may cause charring of some organic matter into refractory, elemental

Atmosphere 2017, 8, 166 3 of 16
carbon, and/or some oxidation of the carbonaceous matter. The charring of organic particulatematerial into elemental carbon is a known phenomenon under the elevated temperatures employedin organic carbon and elemental carbon (OCEC) analyses [34,35]. Issues that influence the charringinclude temperatures and residence times, as well as chemical composition. Charring is likely tobe more of an issue for oxidized organics, such as biomass burning or secondary organic aerosol(SOA), than reduced organics, such as efficient combustion products (i.e., diesel and laboratory flamesoot) [36,37]. Two significant differences between OCEC and thermodenuding include: (1) OCECtechniques typically operate at higher temperatures than TDs, and (2) OCEC charring occurs in ahelium atmosphere, whereas thermodenuding occurs in air (i.e., oxidizing environment). Thus, at alow temperature (<300 ◦C), thermodenuding will be less likely to char, and the particles may be moresusceptible to oxidation due to an oxidizing environment. Oxidation of refractory carbon soot typicallyoccurs at significantly elevated temperatures, but can occur at lower temperatures as well, especially ifcatalyzed by impurities in the soot [38]. Soot oxidation is likely limited in thermodenuding due tothe low temperatures and the relatively short residence time, but this issue will require more study inthe future.
We finally discuss the assumption (4), which is the focus of our study. Previous studies haveshown that nascent soot particles can restructure during the condensation or evaporation of the coatingmaterial, depending on their surface tension [39–41]. Xue et al. [28] found significant restructuring ofsoot particles when the particles were first coated with glutaric acid and then denuded. Ghazi andOlfert [16] reported the dependence of soot restructuring on the mass amount of different coatingmaterial types. This restructure alone can affect the optical properties of soot particles. For example, alaboratory study was performed on soot compacted upon humidification; the study measured modestchanges in the absorption cross-section (5% to 14%), but the extinction cross-section was much moresensitive to compaction, with changes of more than 30% [42]. Similarly, China et al. [8,43], usingnumerical simulations, predicted small changes in the absorption cross-section (a few percent), but amuch more substantial change in the total scattering cross section (up to ~300%) upon soot compaction.In addition to affecting the optical properties, changes in the soot structure can also affect the resultsof laser induced incandescence measurements [5]. Finally, the condensation of secondary organicmatter preferentially takes place in empty pores on soot particles, and therefore, it is possible thatcompaction will affect secondary organic condensation on soot [44]. Two potential explanations for thecoated soot restructuring detected during these studies can be: (1) Soot might be compacted duringcondensation of the coating materials due to surface tension effects [14,41,45,46]. (2) The removal ofthe coating material during the subsequent thermodenuding may cause compaction when the coatingevaporates, still due to surface tension effects [39,40]. However, we hypothesize a third potentialpathway, in which soot restructuring might take place solely due to the thermodenuding process,through the added thermal energy. Coating alone might not cause full compaction (i.e., completelycollapsed structure). For example, in an experiment, Leung et al. [47] found that the coating did notrestructure the soot aggregate even when the aggregate was completely covered by the coating material.Some coating material indeed results in substantial or even maximum compaction, but other coatingmaterials actually result in negligible compaction. A clear example is shown in a laboratory studywhere particles coated with sulfuric acid did undergo severe restructuring, while the soot particlescoated by dioctyl sebacate showed only minimal or no compaction [9]. Also, from Mexico City samples,Adachi and Buseck [4] found coated soot but with lacy structure. For the case of coated but yet onlypartially compacted soot, thermodenuding may facilitate further restructuring. The coating materialcan become less viscous at the elevated temperatures during the thermodenuding and restructure thesoot core [47].
Next, we will discuss some lines of evidence that the thermodenuding process alone can insome cases, favor the compaction of lacy aggregates of various materials, even in the absence ofcoating material that condenses onto the primary aggregates. If a similar process happens for ambientsoot, such a process would potentially bias the measured properties (e.g., absorption or scattering

Atmosphere 2017, 8, 166 4 of 16
enhancements) of soot when a thermodenuder is used. The main objective of our study is to test thishypothesis, to assure that the themodenuding process alone does not introduce this bias. A couple ofpotential restructuring processes induced during thermodenuding, are discussed next:
(a) When heated, fractal-like aggregates of metal nanoparticles, such as silver, copper, andmetallic oxides (e.g., titania), have been found to restructure to more compact morphologies attemperatures well below the bulk material melting points. For example, thermal restructuringhas been found in silver aggregates, even at temperatures as low as 100 ◦C, with full compactionat just 350 ◦C (much below the melting temperature of silver), while the primary particle sizeremained unchanged [48,49]. Another study found that aggregates of titania started to collapsewhen temperatures reached 700 ◦C [50]. These authors speculated that the heating causesthe weakest branches in an aggregate to rotate around their contact points, resulting in theaggregate restructuring. Alternatively, Schmidt-Ott [51] hypothesized that the monomers insilver nanoparticles aggregates might slide on each other when heated, also causing compaction.Both processes would restructure the aggregates without a complete breakage of the bondsbetween the monomers due to Van der Waals forces.
(b) As mentioned earlier, nascent soot aggregates typically have polycyclic aromatic hydrocarbonsthinly coating them. This nascent coating could play a role in determining the soot structureif the coating properties (i.e., viscosity and surface tension) change at the higher temperatureof the thermodenuder. Chen et al. [52] found that some polycyclic aromatic hydrocarbons, likephenanthrene and flouranthene, when present as a subnanometer layer on soot, behaved assubcooled liquid that weakened the bonds between the monomers, allowing them to slide and rollover each other and resulting in soot restructuring. Rothenbacher et al. [53] provided evidencethat thermodenuding might make a difference in the strength of the adhesive bonds betweenthe monomers. For aged soot, they found a higher degree of fragmentation for thermodenudedparticles (75% at 280 ◦C) than for untreated (not thermodenuded) particles (60%) when impactedat ~200 m/s. The degree of fragmentation was defined as the fraction of broken bonds in anaggregate. Although the process involved both the effect of coating and impaction, the higherdegree of fragmentation for thermodenuded particles suggests that the thermal energy has a roleon the increased degree of fragmentation.
These lines of evidence motivated us to study the potential effects of thermodenuding on thespecific case of nascent soot. With this goal in mind, we analyzed the structure of laboratory generatednascent soot particles produced from two different fuel sources (ethylene flame and methane flame)and size selected at different mobility diameters before and after thermodenuding. This assessment isimportant for evaluating the potential biases that might be introduced by thermodenuding while, forexample, estimating the absorption or scattering enhancements of laboratory or ambient soot particles.
2. Experiments
2.1. Experimental Setup and Sample Collection
We analyzed five pairs of mobility-selected soot samples collected during two differentexperiments: the Boston College Experiment 2 (BC2) and the Boston College Experiment 4 (BC4).The sampling schematics are shown in the Figure 1a,b. None of the soot particles were coated withadditional external coating material, and the minimal coating present on the nascent soot was solelydue to the fuel residuals accumulated during the combustion and dilution processes.
Three soot sample sets were collected during BC2 from the combustion of ethylene and oxygenusing a premixed flat flame burner [9]. The fuel equivalence ratio (∅) for all the three sample sets was2.1. A TD [29] was used to remove volatile components from the nascent soot particles. The heatingsection of the TD was set at 250 ◦C to vaporize the non-refractory soot components, which wereabsorbed by a charcoal section maintained at room temperature. Particles for a range of mobility

Atmosphere 2017, 8, 166 5 of 16
diameters (dm) were selected to investigate the effect of thermodenuding on particle size. For ourinvestigation, we selected three sets of nascent vs. nascent-denuded soot particles with dm = 153nm, 181 nm and 250 nm for nascent and dm = 151 nm, 175 nm, and 241 nm for the correspondingdenuded soot particles. Soot particles were collected on 13 mm diameter Nuclepore polycarbonatefilters having a pore size of 0.3 µm (Whatman Inc., Chicago, IL, USA). Additional details regarding theBC2 experimental set-up are provided elsewhere [9].
Atmosphere 2017, 8, 166 5 of 16
having a pore size of 0.3 μm (Whatman Inc., Chicago, IL, USA). Additional details regarding the BC2 experimental set-up are provided elsewhere [9].
(a)
(b)
Figure 1. Soot generation and sampling set-ups in (a) Boston College Experiment 2 (BC2) and (b) Boston College Experiment 4 (BC4).
In addition, we selected two sets of soot samples generated during BC4 from the combustion of methane in an inverted diffusion flame burner (methane and O2 mixture) at a dm = 253 nm and 252 nm for nascent and dm = 253 nm, and 251 nm for the corresponding denuded soot particles. The global ∅for both sample sets was about 0.7, but the actual value of ∅ is unknown. In the diffusion flame, the fuel burns in excess of air making the value of ∅ less than 1. Effluent from the flame burner was passed through separate annular denuders loaded with molecular sieves and activated charcoal to remove water vapor and volatile organic compounds from the sample flow. As in BC2, a Huffman TD (heating section set at 270 °C) was used to remove the volatile components. For both experiments, the sample flow rate through the TD was 2 LPM, resulting in a residence time of 5 s in the heating section and 4 s in the denuder section. During BC4, unlike during BC2, particles were first mobility size selected by a Differential Mobility Analyzer (DMA) (TSI Inc., Saint Paul, MN, USA) and the mass was selected by a Centrifugal Particle Mass Analyzer (CPMA) (Cambustion Ltd., Cambridge, UK) before thermodenuding. The first set of samples consisted of nascent and nascent-denuded soot, while the second set consisted of nascent-oxidized and nascent-oxidized-denuded soot. Soot was oxidized by exposure to ozone (O3) and hydroxyl (OH) radicals in a Potential Aerosol Mass (PAM) oxidation flow reactor [54], at input O3 and H2O mixing ratios of ~15 ppm and ~1%, and UV actinic flux ~2 × 10¹² ph cm−2 s−1 (λ = 254 nm). These operating conditions correspond to an integrated OH exposure of approximately 2 × 10¹² molec cm−3 s [55], and likely generate highly oxygenated organic molecules, such as carboxylic acids on the surface of the nascent-oxidized soot particles [56]. The nascent-oxidized soot was thermo-denuded at a temperature of 270 °C. The set of nascent-oxidized soot samples was included here to investigate if the thermodenuding effect is different for nascent versus nascent-oxidized soot. During BC4, soot particles were collected on 13 mm diameter Nuclepore filters having a pore size of 0.1 µm diameter (Whatman Inc., Chicago, IL, USA).
All the filters were coated with 1.8 (±10%) nm thick layer of Pt/Pd alloy in a sputter coater (Hummer® 6.2, Anatech USA, Union city, CA, USA) and imaged with a field emission scanning electron microscope (FE-SEM) (Hitachi S-4700, Tokyo, Japan). From the FE-SEM images, several
Figure 1. Soot generation and sampling set-ups in (a) Boston College Experiment 2 (BC2) and (b) BostonCollege Experiment 4 (BC4).
In addition, we selected two sets of soot samples generated during BC4 from the combustion ofmethane in an inverted diffusion flame burner (methane and O2 mixture) at a dm = 253 nm and 252 nmfor nascent and dm = 253 nm, and 251 nm for the corresponding denuded soot particles. The global∅ for both sample sets was about 0.7, but the actual value of ∅ is unknown. In the diffusion flame,the fuel burns in excess of air making the value of ∅ less than 1. Effluent from the flame burner waspassed through separate annular denuders loaded with molecular sieves and activated charcoal toremove water vapor and volatile organic compounds from the sample flow. As in BC2, a HuffmanTD (heating section set at 270 ◦C) was used to remove the volatile components. For both experiments,the sample flow rate through the TD was 2 LPM, resulting in a residence time of 5 s in the heatingsection and 4 s in the denuder section. During BC4, unlike during BC2, particles were first mobilitysize selected by a Differential Mobility Analyzer (DMA) (TSI Inc., Saint Paul, MN, USA) and themass was selected by a Centrifugal Particle Mass Analyzer (CPMA) (Cambustion Ltd., Cambridge,UK) before thermodenuding. The first set of samples consisted of nascent and nascent-denuded soot,while the second set consisted of nascent-oxidized and nascent-oxidized-denuded soot. Soot wasoxidized by exposure to ozone (O3) and hydroxyl (OH) radicals in a Potential Aerosol Mass (PAM)oxidation flow reactor [54], at input O3 and H2O mixing ratios of ~15 ppm and ~1%, and UV actinicflux ~2 × 10¹² ph cm−2 s−1 (λ = 254 nm). These operating conditions correspond to an integratedOH exposure of approximately 2 × 10¹² molec cm−3 s [55], and likely generate highly oxygenatedorganic molecules, such as carboxylic acids on the surface of the nascent-oxidized soot particles [56].The nascent-oxidized soot was thermo-denuded at a temperature of 270 ◦C. The set of nascent-oxidizedsoot samples was included here to investigate if the thermodenuding effect is different for nascent

Atmosphere 2017, 8, 166 6 of 16
versus nascent-oxidized soot. During BC4, soot particles were collected on 13 mm diameter Nucleporefilters having a pore size of 0.1 µm diameter (Whatman Inc., Chicago, IL, USA).
All the filters were coated with 1.8 (±10%) nm thick layer of Pt/Pd alloy in a sputter coater(Hummer® 6.2, Anatech USA, Union city, CA, USA) and imaged with a field emission scanningelectron microscope (FE-SEM) (Hitachi S-4700, Tokyo, Japan). From the FE-SEM images, severalmorphological parameters were evaluated [6] using the image processing software ImageJ (NationalInstitutes of Health, Bethesda, MD, USA) [57].
2.2. Soot Morphological Parameters
As mentioned in the introduction, soot particles are aggregates of monomers that exhibitscale-invariant fractal structures [58,59]. Soot aggregates can therefore be characterized by a fractaldimension (Df), in which the mass of the aggregate M (proportional to the number of monomers N inthe aggregate) scales with the ratio of the radius of gyration (Rg) to the radius of the monomers (Rp),as in M (or N) ∝ (Rg/Rp)D
f, [60]. Df is a commonly used parameter to quantify the soot morphology.Lacy soot particles have low Df values, while compact soot particles have higher Df values. The Df ofan ensemble of soot particles can be calculated by plotting N vs. Rg (or a surrogate for it). N scaleswith Rg as a power law with exponent Df [61]:
N = kg
(Rg
Rp
)D f
(1)
where kg is a pre-factor whose value depends on the overlap between the monomers in the aggregate.The relation formulated by Köylü et al. [61] was used to estimate Df with the geometric mean diameterof the aggregate,
√LW, as a surrogate for 2Rg:
N = kLW
(√LW
2Rp
)D f
(2)
where L is the maximum length and W is the maximum width (orthogonal to L), KLW is a prefactorand Rp is calculated from the mean of the projected area of the monomer. In general, it is difficult tomeasure N using an SEM image alone, because only two-dimensional (2-D) projections of the sootparticles are typically available. Therefore, N is often estimated from the projected area of the sootaggregate Ap and the mean projected area of the monomers Am using the relation provided by Oh andSorensen [62]:
N = ka
(Ap
Am
)α
(3)
where α and ka are constants that depend on the overlap between monomers in the 2-D projected imageof the particle. In our case, we used Ka = 1.15 and α = 1.09 for all of our nascent and nascent-denudedsoot aggregates [61]. This selection of Ka and α values is reasonable since we only studied nascent sootparticles that are minimally coated.
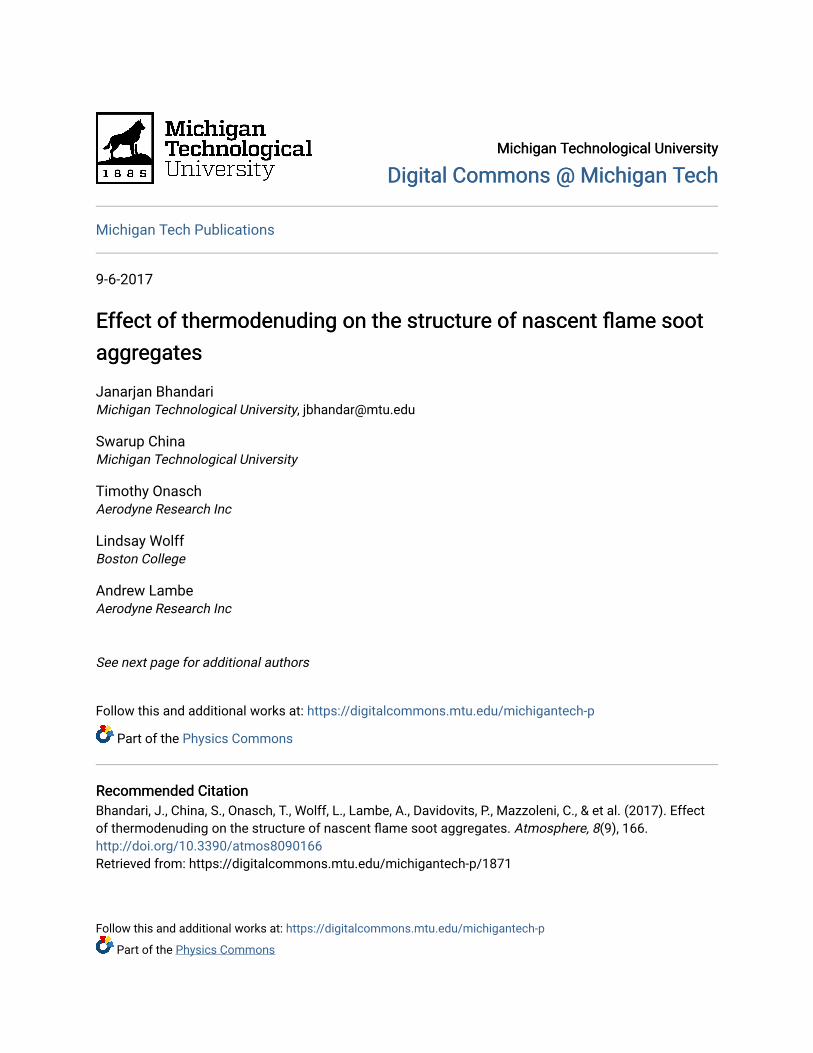
In addition to Df, several other 2-D morphological parameters were calculated from the FE-SEMimages to investigate potential changes due to thermodenuding. The calculated parameters includedroundness, convexity, aspect ratio (AR), and area equivalent diameter (DAeq). Figure 2a shows thedefinition of some of these parameters. DAeq is the diameter of a spherical particle with a projected areaequivalent to the projected area of the aggregate. Roundness is calculated from the ratio of the projectedarea of the aggregate to the area of the circle having a diameter equal to the maximum projected lengthL, and fully inscribing the projected image of the aggregate (Figure 2b). Convexity (sometimes termedsolidity) is the ratio of the projected area of the particle to the area of the smallest convex hull polygon,in which the 2-D projection of the aggregate is inscribed (Figure 2c). AR is calculated as the ratio ofL to W. Higher values of roundness and convexity or lower AR often corresponds to more compact

Atmosphere 2017, 8, 166 7 of 16
soot particles. However, it has to be noted that Df, roundness and convexity are parameters with verydifferent meanings and definitions. The first is a scaling factor, the second is a geometric property,and the third is a measure of the particle topology. That is why we investigated all of these threeparameters to characterize the morphology of soot rather than looking at a single one. We analyzed atotal of 1223 images of individual soot particles.
Atmosphere 2017, 8, 166 7 of 16
(a) (b) (c)
Figure 2. (a) Example of SEM image of a soot particle showing the definition of several parameters measured from the projected image: maximum projected length L, maximum projected width W, projected area of monomer Am and projected area of particle Ap. (b) Schematic representation of the roundness calculation for the same soot particle shown in (a). (c) Schematic representation of the convexity calculation for the same soot particle shown in (a). The pink shades in (b,c) represent the equivalent area for a circle and the convex hull, respectively, for the binary image of the soot particle shown in (a).
3. Results and Discussion
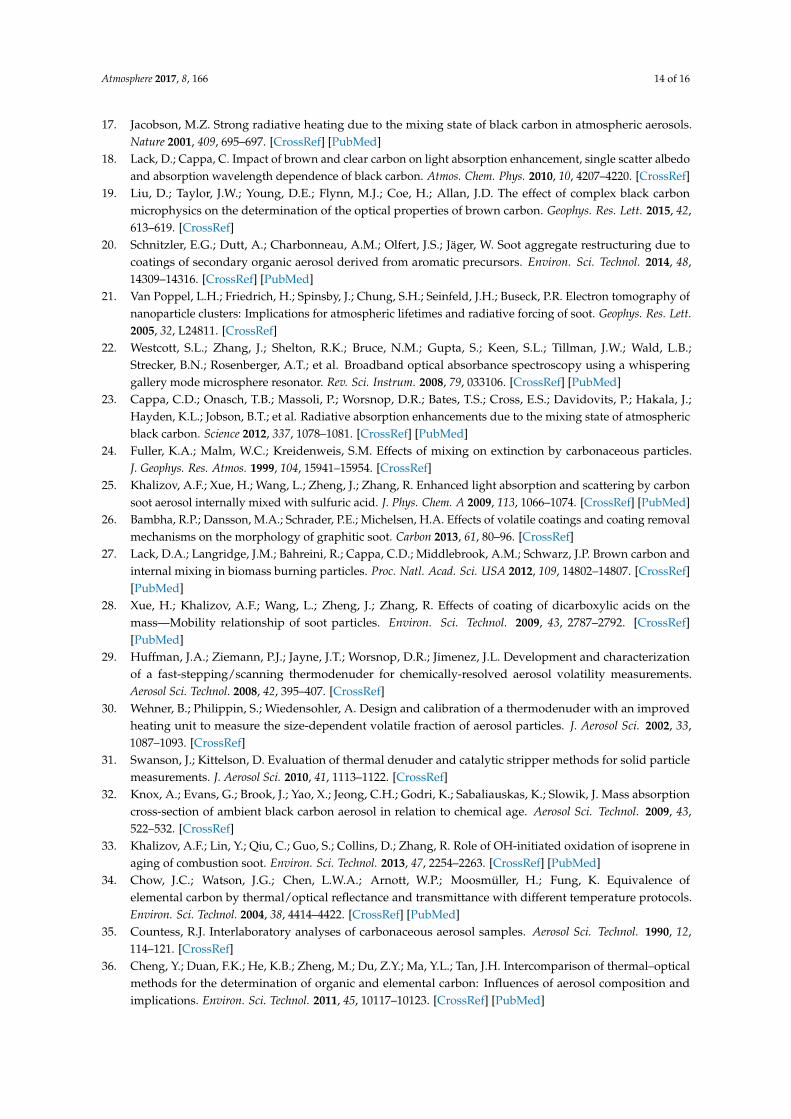
As mentioned earlier, we analyzed images from four sets of nascent and nascent-denuded soot sample pairs of different sizes and a fifth set of nascent-oxidized denuded soot. Examples of images of soot particles before and after thermodenuding are shown in Figure 3.
Figure 3. SEM micrographs of nascent (N) and thermodenuded (D) soot particles. The white horizontal bar in each micrograph represents a length scale of 200 nm. Dark circles are the holes in the filter.
N1, N2, N3, and N4 are four differently sized nascent soot samples and D1, D2, D3, and D4 are the corresponding nascent-denuded sets. N5-D5 is a pair of nascent-oxidized soot before and after thermodenuding. Table 1 summarizes the features of the analyzed soot particles. Sets N1-D1, N2-D2, and N3-D3 are the three sets from BC2, while sets N4-D4, and N5-D5 are from BC4.
Table 1. Summary of physical and morphological parameters for the soot particles analyzed.
Experiment Statistics BC2 BC4 Sample N1 D1 N2 D2 N3 D3 N4 D4 N5 D5
Fuel type E E E E E E M M M M #Particles analyzed 108 151 113 163 114 109 113 105 122 125
N Mean 41 55 121 104 110 153 158 188 155 166 S.D 16 26 65 53 44 90 96 87 75 106 S.E 2 2 6 4 4 9 9 8 7 9
dm (nm) Mean 153 151 181 175 250 241 253 253 252 251
Figure 2. (a) Example of SEM image of a soot particle showing the definition of several parametersmeasured from the projected image: maximum projected length L, maximum projected width W,projected area of monomer Am and projected area of particle Ap. (b) Schematic representation of theroundness calculation for the same soot particle shown in (a). (c) Schematic representation of theconvexity calculation for the same soot particle shown in (a). The pink shades in (b,c) represent theequivalent area for a circle and the convex hull, respectively, for the binary image of the soot particleshown in (a).
3. Results and Discussion
As mentioned earlier, we analyzed images from four sets of nascent and nascent-denuded sootsample pairs of different sizes and a fifth set of nascent-oxidized denuded soot. Examples of images ofsoot particles before and after thermodenuding are shown in Figure 3.
Atmosphere 2017, 8, 166 7 of 16
(a) (b) (c)
Figure 2. (a) Example of SEM image of a soot particle showing the definition of several parameters measured from the projected image: maximum projected length L, maximum projected width W, projected area of monomer Am and projected area of particle Ap. (b) Schematic representation of the roundness calculation for the same soot particle shown in (a). (c) Schematic representation of the convexity calculation for the same soot particle shown in (a). The pink shades in (b,c) represent the equivalent area for a circle and the convex hull, respectively, for the binary image of the soot particle shown in (a).
3. Results and Discussion
As mentioned earlier, we analyzed images from four sets of nascent and nascent-denuded soot sample pairs of different sizes and a fifth set of nascent-oxidized denuded soot. Examples of images of soot particles before and after thermodenuding are shown in Figure 3.
Figure 3. SEM micrographs of nascent (N) and thermodenuded (D) soot particles. The white horizontal bar in each micrograph represents a length scale of 200 nm. Dark circles are the holes in the filter.
N1, N2, N3, and N4 are four differently sized nascent soot samples and D1, D2, D3, and D4 are the corresponding nascent-denuded sets. N5-D5 is a pair of nascent-oxidized soot before and after thermodenuding. Table 1 summarizes the features of the analyzed soot particles. Sets N1-D1, N2-D2, and N3-D3 are the three sets from BC2, while sets N4-D4, and N5-D5 are from BC4.
Table 1. Summary of physical and morphological parameters for the soot particles analyzed.
Experiment Statistics BC2 BC4 Sample N1 D1 N2 D2 N3 D3 N4 D4 N5 D5
Fuel type E E E E E E M M M M #Particles analyzed 108 151 113 163 114 109 113 105 122 125
N Mean 41 55 121 104 110 153 158 188 155 166 S.D 16 26 65 53 44 90 96 87 75 106 S.E 2 2 6 4 4 9 9 8 7 9
dm (nm) Mean 153 151 181 175 250 241 253 253 252 251
Figure 3. SEM micrographs of nascent (N) and thermodenuded (D) soot particles. The white horizontalbar in each micrograph represents a length scale of 200 nm. Dark circles are the holes in the filter.
N1, N2, N3, and N4 are four differently sized nascent soot samples and D1, D2, D3, and D4 arethe corresponding nascent-denuded sets. N5-D5 is a pair of nascent-oxidized soot before and afterthermodenuding. Table 1 summarizes the features of the analyzed soot particles. Sets N1-D1, N2-D2,and N3-D3 are the three sets from BC2, while sets N4-D4, and N5-D5 are from BC4.

Atmosphere 2017, 8, 166 8 of 16
Table 1. Summary of physical and morphological parameters for the soot particles analyzed.
Experiment Statistics BC2 BC4
Sample N1 D1 N2 D2 N3 D3 N4 D4 N5 D5Fuel type E E E E E E M M M M
#Particles analyzed 108 151 113 163 114 109 113 105 122 125
NMean 41 55 121 104 110 153 158 188 155 166S.D 16 26 65 53 44 90 96 87 75 106S.E 2 2 6 4 4 9 9 8 7 9
dm (nm) Mean 153 151 181 175 250 241 253 253 252 251MCPMA (fg) Mean 1.02 0.78 1.52 1.08 2.85 2.20 2.37 2.34 2.41 2.18
S.D. (0.03) (0.03) (0.05) (0.04) (0.14) (0.13) (0.11) (0.13) (0.11) (0.11)
DfFit slope 1.86 1.84 1.73 1.72 1.78 1.79 1.80 1.76 1.65 1.80
S.E. (0.05) (0.04) (0.05) (0.06) (0.08) (0.05) (0.05) (0.06) (0.05) (0.05)
KgFit
intercept 1.78 1.98 2.50 2.50 2.22 2.00 2.10 2.56 2.87 2.16
S.E. (0.04) (0.03) (0.05) (0.05) (0.08) (0.06) (0.06) (0.07) (0.06) (0.06)
dp (nm)
Mean 33.5 31.8 26.8 25.7 32.1 30.3 23.5 22.8 23.9 23.1Median 33.5 32.4 26.5 25.9 32.1 28.9 23.2 22.5 23.7 23.0
S.D. (2.1) (3.3) (2.7) (2.6) (2.1) (6.9) (3.1) (2.2) (2.5) (3.4)S.E. (0.21) (0.27) (0.26) (0.21) (0.20) (0.66) (0.30) (0.22) (0.23) (0.31)
Roundness
Mean 0.41 0.43 0.36 0.34 0.38 0.31 0.31 0.35 0.33 0.33Median 0.42 0.42 0.35 0.35 0.35 0.30 0.30 0.34 0.32 0.31
S.D. (0.12) (0.12) (0.11) (0.10) (0.12) (0.09) (0.11) (0.12) (0.11) (0.11)S.E. (0.01) (0.01) (0.01) (0.01) (0.01) (0.01) (0.01) (0.01) (0.01) (0.01)
Convexity
Mean 0.72 0.75 0.66 0.66 0.62 0.59 0.61 0.66 0.61 0.63Median 0.73 0.74 0.66 0.65 0.62 0.58 0.61 0.66 0.61 0.62
S.D. (0.09) (0.08) (0.09) (0.10) (0.09) (0.10) (0.10) (0.11) (0.12) (0.11)S.E. (0.01) (0.01) (0.01) (0.01) (0.01) (0.01) (0.01) (0.01) (0.01) (0.01)
DAeq (nm)
Mean 169 181 220 196 255 262 215 230 219 214Median 171 175 208 189 262 260 199 220 213 202
S.D. (33) (35) (55) (41) (46) (49) (54) (56) (50) (59)S.E. (3) (3) (5) (3) (4) (5) (5) (5) (5) (5)
AR
Mean 1.79 1.73 1.84 1.92 1.78 1.85 1.99 1.95 1.85 1.88Median 1.66 1.62 1.70 1.78 1.68 1.72 1.85 1.82 1.80 1.83
S.D. (0.51) (0.42) (0.49) (0.51) (0.57) (0.50) (0.60) (0.60) (0.50) (0.50)S.E. (0.05) (0.03) (0.05) (0.04) (0.05) (0.05) (0.06) (0.06) (0.05) (0.04)
In Table 1, E = ethylene and M = methane represent the fuel type. N is the average number of monomersper aggregate, estimated in each sample using Equation (3). Kg values have been estimated using the relationKg = KLW·(1.17)Df where
√LW/2Rg = 1.17 has been taken from Köylü et al. [61] and the values of KLW and Df have
been calculated from a log-log plot using Equation (2). dp is the mean diameter of the monomers in an aggregate, dmis the mean mobility diameter (in nm) and MCPMA represents the mean mass of the particle (in fg) as measured bythe CPMA. For Df the term in parenthesis is the standard error (S.E.) calculated from the power fit using Equation (2),for the other quantities, it is the S.E. (standard deviation of the mean) and the standard deviation (S.D.).
The largest decrease in the mean value of dp (by 5.6%) after thermodenuding is found for theN3-D3 set. The decrease in dp could be due to the partial removal of material volatile at the TDtemperature and present on the nascent soot. A decrease in the monomer size after thermal treatmentwas previously observed when soot samples were heated at higher temperatures (400–900 ◦C) dueto the removal of a part of the nascent PAH layers from the monomers surface [63]. Also, the meandp size, as well as the differences in the mean values of dp after thermodenuding are smaller forthe inverted diffusion flame with respect to those of the McKenna flame. These changes suggestthat there was less volatile material present in the nascent soot generated from the inverted flame.This effect could be due to the different type of fuel, as well as different ∅. In a study of ethylene flamegenerated soot from a McKenna burner, the size of dp in thermodenuded soot particles was foundlarger for higher ∅ [64]. This is consistent with the study by Ghazi and Olfert [16] that generatedsoot by an inverted diffusion flame and found no measurable amount of volatile material when themass was measured after thermodenuding. While, Slowik et al. [64], using a McKenna flame, foundthat thermodenuding removed only about 0.05 mass fraction of volatile material for the nascent sootcontaining 0.1 mass fraction of non-refractory material (at ∅ = 2.1) from an ethylene flat flame.

Atmosphere 2017, 8, 166 9 of 16
To investigate whether the soot aggregates restructured after thermodenuding, we first analyzethe changes in Df as summarized in Figure 4.
Atmosphere 2017, 8, 166 9 of 16
Figure 4. Fractal dimension of nascent (in blue) and nascent-denuded (in orange) soot pairs of different mobility sizes. The error bars represent the standard errors.
For all five sample sets, Df lies between 1.65 and 1.86 (Table 1). The derivation of Df and plots for all of the samples are shown in the supplementary material (Figure S1). These values of Df are in agreement with the observations made in previous studies on nascent soot particles produced from different fuel sources [3,65]. Also for all nascent vs. denuded pairs (except for the nascent-oxidized pair: N5-D5), there is no significant change (within 1 ) in Df after thermodenuding (Figure 4). For the N5-D5 pair, the Df changes by about 9% (from 1.65 to 1.80), whereas for all other cases, the change is less than 2.3%. The CPMA data for the BC4 sample shows that the mass decreased from 2.37 to 2.34 fg for nascent soot, while for the nascent-oxidized soot of the same mobility size, the mass decreased from 2.41 to 2.18 fg after thermodenuding. The larger decrease in mass for the nascent oxidized soot suggests that the coating material on the oxidized soot was removed during thermodenuding. A possible explanation for the increase of Df after thermodenuding the oxidized soot might be that the soot structure was slightly modified during the evaporation of the coating material. Interestingly, for the BC2 soot samples, there is no significant change in Df despite the significant change in mass (up to ~29%) of soot after thermodenuding (see CPMA data in Table 1). This result suggests that for the BC2 sample sets, the removal of the coating present on nascent soot did not affect the structure of soot. This is most probably due to the chemical composition of the organics that were removed by TD. This result is consistent with the thermodenuding experiment of uncoated soot (fractal soot generated at lower ∅ = 2.1) by Slowik et al. [64] that found no change in Df (derived from mass-mobility relation in their case) after denuding. They suggested that the removal of organics from the uncoated soot during denuding cannot change the skeletal framework of soot. Cross et al. [9] observed only minor restructuring of soot when dioctyl sebacate coating was removed by thermodenuding, suggesting that the removal of organic coating may have little impact on the restructuring of soot. For soot from a flat flame burner, Slowik et al. [66] found that the organic carbon (OC) content (mass fraction of 0.1) was composed of a comparable amount of aliphatic and aromatic compounds at a lower ∅ ∅ = 1.85 , but at a higher ∅ ∅ 4 , the OC content (mass fraction of 0.55) had only a minor fraction of aliphatic compounds. We thus hypothesize that the nascent organics on the soot from the BC2 experiments considered here consisted in a large fraction of aliphatic compounds.
To account for the mass change after thermodenuding on the coating of soot particle, we calculated coating thickness (ΔRve) in terms of volume equivalent radius (Rve). The difference between the volume equivalent radius of nascent soot and the thermodenuded soot particle was used to
Figure 4. Fractal dimension of nascent (in blue) and nascent-denuded (in orange) soot pairs of differentmobility sizes. The error bars represent the standard errors.
For all five sample sets, Df lies between 1.65 and 1.86 (Table 1). The derivation of Df and plotsfor all of the samples are shown in the supplementary material (Figure S1). These values of Df are inagreement with the observations made in previous studies on nascent soot particles produced fromdifferent fuel sources [3,65]. Also for all nascent vs. denuded pairs (except for the nascent-oxidizedpair: N5-D5), there is no significant change (within 1σ) in Df after thermodenuding (Figure 4). For theN5-D5 pair, the Df changes by about 9% (from 1.65 to 1.80), whereas for all other cases, the change isless than 2.3%. The CPMA data for the BC4 sample shows that the mass decreased from 2.37 to 2.34 fgfor nascent soot, while for the nascent-oxidized soot of the same mobility size, the mass decreasedfrom 2.41 to 2.18 fg after thermodenuding. The larger decrease in mass for the nascent oxidizedsoot suggests that the coating material on the oxidized soot was removed during thermodenuding.A possible explanation for the increase of Df after thermodenuding the oxidized soot might be thatthe soot structure was slightly modified during the evaporation of the coating material. Interestingly,for the BC2 soot samples, there is no significant change in Df despite the significant change in mass(up to ~29%) of soot after thermodenuding (see CPMA data in Table 1). This result suggests that forthe BC2 sample sets, the removal of the coating present on nascent soot did not affect the structure ofsoot. This is most probably due to the chemical composition of the organics that were removed by TD.This result is consistent with the thermodenuding experiment of uncoated soot (fractal soot generatedat lower ∅ = 2.1) by Slowik et al. [64] that found no change in Df (derived from mass-mobility relationin their case) after denuding. They suggested that the removal of organics from the uncoated sootduring denuding cannot change the skeletal framework of soot. Cross et al. [9] observed only minorrestructuring of soot when dioctyl sebacate coating was removed by thermodenuding, suggesting thatthe removal of organic coating may have little impact on the restructuring of soot. For soot from a flatflame burner, Slowik et al. [66] found that the organic carbon (OC) content (mass fraction of 0.1) wascomposed of a comparable amount of aliphatic and aromatic compounds at a lower ∅ (∅ = 1.85), butat a higher ∅ (∅ > 4), the OC content (mass fraction of 0.55) had only a minor fraction of aliphaticcompounds. We thus hypothesize that the nascent organics on the soot from the BC2 experimentsconsidered here consisted in a large fraction of aliphatic compounds.

Atmosphere 2017, 8, 166 10 of 16
To account for the mass change after thermodenuding on the coating of soot particle, we calculatedcoating thickness (∆Rve) in terms of volume equivalent radius (Rve). The difference between thevolume equivalent radius of nascent soot and the thermodenuded soot particle was used to estimatethe thickness of the coating material. For the case of maximum mass loss (~29%), coating thicknesswas estimated to be 8.4 nm. (See supplementary material for the calculation).
To further investigate possible morphological changes after thermodenuding, we studied theconvexity and roundness of soot particles for all five sample sets. The maximum change in the meanvalue of roundness occurs for set N3-D3 (about 18%), followed by the set N4-D4 (about 13%). For theother sets, the mean value of roundness changes by less than 10%. For the case of convexity, themaximum change in the mean value occurs for set N4-D4 (about 8%). For all other sets, the meanvalue of convexity changes by less than 5%. The larger changes in roundness and convexity for thesesample sets are statistically significant (at 1σ) although still minor.
We should point out, however, that image acquisition conditions (e.g., due to differentmagnifications, scan rates or over/under focusing) and image processing biases (e.g., imagethresholding) can introduce additional errors in roundness, convexity, and Df. In some cases, theseerrors are larger than the statistical errors provided in Table 1. To quantify these uncertainties, weacquired multiple images of six individual particles (from sample N5) and processed them underdifferent conditions, as mentioned above. We estimated the uncertainties due to image acquisitionand image processing biases in roundness and convexity to be 0.01 and 0.02, respectively. Similarly,uncertainties in N and dp were estimated to be 16% and 13% (3.4 nm), respectively, which resulted inan error of 0.08 in Df.
In Figure 5a,b we show box and whisker plots for the convexity and the roundness, respectivelyof the soot particles before and after thermodenuding. The convexity ranges from 0.37 to 0.91, whilethe roundness ranges from 0.09 to 0.75 (see Table 1 for details). No substantial changes in roundness orconvexity are evident after thermodenuding.
Atmosphere 2017, 8, 166 10 of 16
estimate the thickness of the coating material. For the case of maximum mass loss (~29%), coating thickness was estimated to be 8.4 nm. (See supplementary material for the calculation).
To further investigate possible morphological changes after thermodenuding, we studied the convexity and roundness of soot particles for all five sample sets. The maximum change in the mean value of roundness occurs for set N3-D3 (about 18%), followed by the set N4-D4 (about 13%). For the other sets, the mean value of roundness changes by less than 10%. For the case of convexity, the maximum change in the mean value occurs for set N4-D4 (about 8%). For all other sets, the mean value of convexity changes by less than 5%. The larger changes in roundness and convexity for these sample sets are statistically significant (at 1σ) although still minor.
We should point out, however, that image acquisition conditions (e.g., due to different magnifications, scan rates or over/under focusing) and image processing biases (e.g., image thresholding) can introduce additional errors in roundness, convexity, and Df. In some cases, these errors are larger than the statistical errors provided in Table 1. To quantify these uncertainties, we acquired multiple images of six individual particles (from sample N5) and processed them under different conditions, as mentioned above. We estimated the uncertainties due to image acquisition and image processing biases in roundness and convexity to be 0.01 and 0.02, respectively. Similarly, uncertainties in N and dp were estimated to be 16% and 13% (3.4 nm), respectively, which resulted in an error of 0.08 in Df.
In Figure 5a,b we show box and whisker plots for the convexity and the roundness, respectively of the soot particles before and after thermodenuding. The convexity ranges from 0.37 to 0.91, while the roundness ranges from 0.09 to 0.75 (see Table 1 for details). No substantial changes in roundness or convexity are evident after thermodenuding.
(a) (b)
Figure 5. Box and whisker plots of (a) convexity and (b) roundness. Blue boxes represent the nascent soot and orange boxes represent the nascent-denuded soot. The horizontal bar inside the box represents the median value while the lower part and upper part of the box separated by the horizontal bar represent the first and third quartiles, respectively. The lower and upper extremities of the whiskers represent the minimum and maximum values, respectively.
In Figure 6, we show the probability distributions of convexity and roundness for all nascent and denuded soot pairs. The solid and the dashed lines represent the mean values for nascent and denuded soot, respectively, while the shaded color bands in blue and orange represent one standard deviation. These means and uncertainty bands were calculated with a bootstrap approach, resampling with replacement from the raw data and constructing 100,000 frequency distributions [67].
Figure 5. Box and whisker plots of (a) convexity and (b) roundness. Blue boxes represent the nascentsoot and orange boxes represent the nascent-denuded soot. The horizontal bar inside the box representsthe median value while the lower part and upper part of the box separated by the horizontal barrepresent the first and third quartiles, respectively. The lower and upper extremities of the whiskersrepresent the minimum and maximum values, respectively.
In Figure 6, we show the probability distributions of convexity and roundness for all nascentand denuded soot pairs. The solid and the dashed lines represent the mean values for nascent anddenuded soot, respectively, while the shaded color bands in blue and orange represent one standarddeviation. These means and uncertainty bands were calculated with a bootstrap approach, resamplingwith replacement from the raw data and constructing 100,000 frequency distributions [67].

Atmosphere 2017, 8, 166 11 of 16Atmosphere 2017, 8, 166 11 of 16
Figure 6. Distributions of (a) convexity and (b) roundness for nascent and nascent-denuded soot particles of different sizes (the mobility diameter is reported in parenthesis in the legends).
For the N3-D3 pair, the distribution of convexity and roundness peaks at slightly lower values after thermodenuding. The convexity of particles decreases slightly with the increasing value of the mobility diameter for both nascent and denuded particles. This suggests that the smaller soot particles are more compact when compared to larger particles, in agreement with previous studies [68,69]. Figure 6a also suggests that for smaller mobility diameters, the convexity of soot from the ethylene diffusion flame might be less affected by thermodenuding as compared to the larger sized particles. With the methane diffusion flame (N4-D4 and N5-D5 sets) particles showed negligible changes in roundness and convexity after thermodenuding, for both nascent and nascent-oxidized soot (Figure 6a N4-D4 and N5-D5, respectively).
For completeness, we also investigated the changes in AR and DAeq. Both show only small changes after thermodenuding (Table 1). Our observations on the five sets of soot pairs show only minor changes in the morphology of nascent soot after thermodenuding.
To study the potential effect of PAM on nascent soot prior to thermodenuding, we compared the parameters between N4 (nascent soot without oxidation in PAM) and N5 (nascent soot with oxidation in PAM) samples. N4 and N5 have comparable masses of 2.37 fg and 2.41 fg, respectively, and a similar mobility diameter ~250 nm. A total of 113 and 122 individual soot particles were analyzed for N4 and N5, respectively. Both samples show nearly the same number of monomers in the soot particles imaged. N4 has 158 and N5 has 155 monomers on average. Also, the mean diameter of monomers is similar in the two samples, 23.5 nm for N4 and 23.9 nm for N5. The similar key properties of the soot particles in the two experiments suggest that N4 and N5 are suitable samples to make a comparison of nascent soot experiments with and without PAM reactor without thermodenuding.
The roundness for N4 (0.31) and for N5 (0.33) and the convexity (0.61 for both N4 and N5) are within the error bars. However, Df for N5 (1.65) is smaller than for N4 (1.80). The value of Df for N5 is somehow smaller than the values typically found for nascent soot (1.7–1.9), but lie within the limit when the imaging and thresholding uncertainties discussed above are added in quadrature to the statistical errors. However, in the downstream of the thermodenuder, D5 and D4 (samples with and without PAM treatment, respectively) show comparable values of roundness (0.35 for D4 and 0.33 for D5), convexity (0.66 for D4, and 0.63 for D5), and Df (1.76 for D4 and 1.80 for D5). Since we have only one set for the nascent-oxidized soot, we are unable to draw a firm conclusion on the effect of
Figure 6. Distributions of (a) convexity and (b) roundness for nascent and nascent-denuded sootparticles of different sizes (the mobility diameter is reported in parenthesis in the legends).
For the N3-D3 pair, the distribution of convexity and roundness peaks at slightly lower valuesafter thermodenuding. The convexity of particles decreases slightly with the increasing value of themobility diameter for both nascent and denuded particles. This suggests that the smaller soot particlesare more compact when compared to larger particles, in agreement with previous studies [68,69].Figure 6a also suggests that for smaller mobility diameters, the convexity of soot from the ethylenediffusion flame might be less affected by thermodenuding as compared to the larger sized particles.With the methane diffusion flame (N4-D4 and N5-D5 sets) particles showed negligible changes inroundness and convexity after thermodenuding, for both nascent and nascent-oxidized soot (Figure 6aN4-D4 and N5-D5, respectively).
For completeness, we also investigated the changes in AR and DAeq. Both show only smallchanges after thermodenuding (Table 1). Our observations on the five sets of soot pairs show onlyminor changes in the morphology of nascent soot after thermodenuding.
To study the potential effect of PAM on nascent soot prior to thermodenuding, we compared theparameters between N4 (nascent soot without oxidation in PAM) and N5 (nascent soot with oxidationin PAM) samples. N4 and N5 have comparable masses of 2.37 fg and 2.41 fg, respectively, and a similarmobility diameter ~250 nm. A total of 113 and 122 individual soot particles were analyzed for N4and N5, respectively. Both samples show nearly the same number of monomers in the soot particlesimaged. N4 has 158 and N5 has 155 monomers on average. Also, the mean diameter of monomers issimilar in the two samples, 23.5 nm for N4 and 23.9 nm for N5. The similar key properties of the sootparticles in the two experiments suggest that N4 and N5 are suitable samples to make a comparison ofnascent soot experiments with and without PAM reactor without thermodenuding.
The roundness for N4 (0.31) and for N5 (0.33) and the convexity (0.61 for both N4 and N5) arewithin the error bars. However, Df for N5 (1.65) is smaller than for N4 (1.80). The value of Df for N5 issomehow smaller than the values typically found for nascent soot (1.7–1.9), but lie within the limitwhen the imaging and thresholding uncertainties discussed above are added in quadrature to thestatistical errors. However, in the downstream of the thermodenuder, D5 and D4 (samples with andwithout PAM treatment, respectively) show comparable values of roundness (0.35 for D4 and 0.33

Atmosphere 2017, 8, 166 12 of 16
for D5), convexity (0.66 for D4, and 0.63 for D5), and Df (1.76 for D4 and 1.80 for D5). Since we haveonly one set for the nascent-oxidized soot, we are unable to draw a firm conclusion on the effect ofthermodenuding on such particles. Although at the time, we have no clear explanation for the minordifference in Df, it is possible that the different nanophysical properties of the nascent-oxidized sootmight indeed result in a higher sensitivity to thermodenuding.
From a study of young and mature soot particles under high-resolution transmission electronmicroscopy (HRTEM), Alfè et al. [70] found no significant difference in the nanostructure of sootmonomers. In addition, they found that the change in the H/C ratio is smaller for methane soot whencompared to that of other fuels. In another study, Vander Wal and Tomasek [71], also using HRTEM,reported that the oxidation rate of nascent soot depends upon the nanostructure, for example, thelength of graphene segments, curvature, and its orientation. Ishiguro et al. [72], Song et al. [73], Mülleret al. [74], also showed a relation between the monomers nanostructure and the soot oxidation fromdifferent fuel sources. Other studies showed negligible influence of ozone on soot oxidation [75,76],as compared to the OH radical. In another study of soot oxidation [77], both the ozone and OHat atmospherically relevant levels were found to have no effect on the oxidation of the elementalcarbon (EC) fraction in soot. In our case, the CPMA data showed that the main fraction (>90%) ofmethane-generated soot consisted of EC, suggesting that the oxidation in the PAM chamber mighthave a negligible effect on the overall morphology of soot.
In a study on the fragmentation and bond strength of diesel soot, Rothenbacher et al. [53] madea comparison between nascent soot treated with and without a TD as a function of impact velocity,and found no substantial change in the degree of fragmentation of nascent soot aggregates due to thethermodenuding. A low-pressure impactor was used to impart velocities of up to 300 m/s to the sootparticles. The TD used in their study had a residence time of 0.43 s, and the sample was heated to280 ◦C. In another study by Raj et al. [63], soot fragmentation was observed after thermodenudingin the temperature range of 400–900 ◦C on diesel soot and commercial soot (Printex-U). However,in the lower temperature range, below 500 ◦C, they found a minor effect on soot fragmentation.Bambha et al. [26] noticed only a small effect of thermodenuding at 410 ◦C (transit time of ~34 s) onthe morphology of soot during the removal of oleic acid coating. In another study, Slowik et al. [64]did not observe any measurable change in the structure of soot when fresh soot (generated at ∅ =2.1 and 3.5) was thermodenuded at 200 ◦C. Our results of the negligible or minor restructuring ofthermodenuded soot particles are in agreement with these previous studies suggesting that theseresults are robust and reproducible.
4. Conclusions
In this study, we used scanning electron microscopy to investigate the morphology of nascent sootaggregates prior to, and after, thermodenuding in a low-temperature regime (<270 ◦C). Despite masslosses of up to ~29% in the nascent soot (removal of ~8 nm coating layer from the soot surface), wedetected only minor effects on the soot structure after thermodenuding, irrespective of the fuel typeand particle size. We observed no significant change in the fractal dimension, although roundness andconvexity showed some minor changes in our case. Future work should focus on the effect on thestructure of nascent soot of higher thermodenuding temperatures.
Supplementary Materials: The following are available online at www.mdpi.com/2073-4433/8/9/166/s1,Figure S1: Plots of fractal dimension of nascent-denuded soot pairs. The solid line and dashed line in eachplot represent the slope for nascent and denuded soot respectively.
Acknowledgments: This work was supported in part by the Office of Science (BER), Department of Energy(Atmospheric System Research) Grant no. DE-SC0011935 and no. DE-SC0010019, and the Atmospheric Chemistryprogram of the National Science Foundation Grant no. AGS-1536939 to Boston College, 1537446 to AerodyneResearch Inc. S. China was partially supported by a NASA Earth and Space Science Graduate Fellowshipsno. NNX12AN97H.
Author Contributions: This manuscript describes the analysis of soot samples obtained in two experimentalprojects performed in the laboratories of Paul Davidovits at Boston College. Paul Davidovits and Tim Onasch

Atmosphere 2017, 8, 166 13 of 16
participated in the planning, setting up and supervising of BC2 and BC4. Adam Ahern and Jason Olfertassisted in the experimental design and the experiments. Tim Onasch and Eben Cross led the BC2 experimentsincluding operation of all experimental aspects of the project and analysis of the SMPS and CPMA data used here.Tim Onasch, Lindsay Wolff and Andrew Lambe led the BC4 experiment including operation of all experimentalaspects of the project. Swarup China and Claudio Mazzoleni collected the samples during BC4 and BC2,respectively. Manvendra Dubey participated in the experiments and provided the instrumentation used forsampling during BC2. Janarjan Bhandari and Swarup China performed the SEM analysis. Janarjan Bhandari,Claudio Mazzoleni and Swarup China wrote most of the paper with significant contributions and edits from allthe coauthors.
Conflicts of Interest: The authors declare no conflict of interest.
References
1. Haynes, B.S.; Wagner, H.G. Soot formation. Prog. Energy Combust. Sci. 1981, 7, 229–273. [CrossRef]2. Buseck, P.R.; Adachi, K.; Gelencsér, A.; Tompa, É.; Pósfai, M. Ns-soot: A material-based term for strongly
light-absorbing carbonaceous particles. Aerosol Sci. Technol. 2014, 48, 777–788. [CrossRef]3. Sorensen, C. Light scattering by fractal aggregates: A review. Aerosol Sci. Technol. 2001, 35, 648–687.
[CrossRef]4. Adachi, K.; Buseck, P. Internally mixed soot, sulfates, and organic matter in aerosol particles from Mexico
city. Atmos. Chem. Phys. 2008, 8, 6469–6481. [CrossRef]5. Bambha, R.; Dansson, M.A.; Schrader, P.E.; Michelsen, H.A. Effects of Volatile Coatings on the Morphology
and Optical Detection of Combustion-Generated Black Carbon Particles; Sandia National Laboratories (SNL-CA):Livermore, CA, USA, 2013. Available online: http://prod.sandia.gov/techlib/access-control.cgi/2013/137660.pdf (accessed on 27 July 2017).
6. China, S.; Salvadori, N.; Mazzoleni, C. Effect of traffic and driving characteristics on morphology ofatmospheric soot particles at freeway on-ramps. Environ. Sci. Technol. 2014, 48, 3128–3135. [CrossRef][PubMed]
7. Park, K.; Kittelson, D.B.; McMurry, P.H. Structural properties of diesel exhaust particles measured bytransmission electron microscopy (TEM): Relationships to particle mass and mobility. Aerosol Sci. Technol.2004, 38, 881–889. [CrossRef]
8. China, S.; Scarnato, B.; Owen, R.C.; Zhang, B.; Ampadu, M.T.; Kumar, S.; Dzepina, K.; Dziobak, M.P.;Fialho, P.; Perlinger, J.A.; et al. Morphology and mixing state of aged soot particles at a remote marine freetroposphere site: Implications for optical properties. Geophys. Res. Lett. 2015, 42, 1243–1250. [CrossRef]
9. Cross, E.S.; Onasch, T.B.; Ahern, A.; Wrobel, W.; Slowik, J.G.; Olfert, J.; Lack, D.A.; Massoli, P.; Cappa, C.D.;Schwarz, J.P.; et al. Soot particle studies—Instrument inter-comparison—project overview. Aerosol Sci.Technol. 2010, 44, 592–611. [CrossRef]
10. Adachi, K.; Chung, S.H.; Buseck, P.R. Shapes of soot aerosol particles and implications for their effects onclimate. J. Geophys. Res. Atmos. 2010, 115, D15. [CrossRef]
11. China, S.; Mazzoleni, C.; Gorkowski, K.; Aiken, A.C.; Dubey, M.K. Morphology and mixing state of individualfreshly emitted wildfire carbonaceous particles. Nat. Commun. 2013, 4, 2122. [CrossRef] [PubMed]
12. Healy, R.M.; Wang, J.M.; Jeong, C.H.; Lee, A.K.; Willis, M.D.; Jaroudi, E.; Zimmerman, N.; Hilker, N.;Murphy, M.; Eckhardt, S.; et al. Light-absorbing properties of ambient black carbon and brown carbon fromfossil fuel and biomass burning sources. J. Geophys. Res. Atmos. 2015, 120, 6619–6633. [CrossRef]
13. Liu, S.; Aiken, A.C.; Gorkowski, K.; Dubey, M.K.; Cappa, C.D.; Williams, L.R.; Herndon, S.C.; Massoli, P.;Fortner, E.C.; Chhabra, P.S.; et al. Enhanced light absorption by mixed source black and brown carbonparticles in UK winter. Nat. Commun. 2015, 6, 8435. [CrossRef] [PubMed]
14. Zhang, R.; Khalizov, A.F.; Pagels, J.; Zhang, D.; Xue, H.; McMurry, P.H. Variability in morphology,hygroscopicity, and optical properties of soot aerosols during atmospheric processing. Proc. Natl. Acad.Sci. USA 2008, 105, 10291–10296. [CrossRef] [PubMed]
15. Adachi, K.; Buseck, P.R. Changes of ns-soot mixing states and shapes in an urban area during CalNex.J. Geophys. Res. Atmos. 2013, 118, 3723–3730. [CrossRef]
16. Ghazi, R.; Olfert, J. Coating mass dependence of soot aggregate restructuring due to coatings of oleic acidand dioctyl sebacate. Aerosol Sci. Technol. 2013, 47, 192–200. [CrossRef]
Atmosphere 2017, 8, 166 14 of 16
17. Jacobson, M.Z. Strong radiative heating due to the mixing state of black carbon in atmospheric aerosols.Nature 2001, 409, 695–697. [CrossRef] [PubMed]
18. Lack, D.; Cappa, C. Impact of brown and clear carbon on light absorption enhancement, single scatter albedoand absorption wavelength dependence of black carbon. Atmos. Chem. Phys. 2010, 10, 4207–4220. [CrossRef]
19. Liu, D.; Taylor, J.W.; Young, D.E.; Flynn, M.J.; Coe, H.; Allan, J.D. The effect of complex black carbonmicrophysics on the determination of the optical properties of brown carbon. Geophys. Res. Lett. 2015, 42,613–619. [CrossRef]
20. Schnitzler, E.G.; Dutt, A.; Charbonneau, A.M.; Olfert, J.S.; Jäger, W. Soot aggregate restructuring due tocoatings of secondary organic aerosol derived from aromatic precursors. Environ. Sci. Technol. 2014, 48,14309–14316. [CrossRef] [PubMed]
21. Van Poppel, L.H.; Friedrich, H.; Spinsby, J.; Chung, S.H.; Seinfeld, J.H.; Buseck, P.R. Electron tomography ofnanoparticle clusters: Implications for atmospheric lifetimes and radiative forcing of soot. Geophys. Res. Lett.2005, 32, L24811. [CrossRef]
22. Westcott, S.L.; Zhang, J.; Shelton, R.K.; Bruce, N.M.; Gupta, S.; Keen, S.L.; Tillman, J.W.; Wald, L.B.;Strecker, B.N.; Rosenberger, A.T.; et al. Broadband optical absorbance spectroscopy using a whisperinggallery mode microsphere resonator. Rev. Sci. Instrum. 2008, 79, 033106. [CrossRef] [PubMed]
23. Cappa, C.D.; Onasch, T.B.; Massoli, P.; Worsnop, D.R.; Bates, T.S.; Cross, E.S.; Davidovits, P.; Hakala, J.;Hayden, K.L.; Jobson, B.T.; et al. Radiative absorption enhancements due to the mixing state of atmosphericblack carbon. Science 2012, 337, 1078–1081. [CrossRef] [PubMed]
24. Fuller, K.A.; Malm, W.C.; Kreidenweis, S.M. Effects of mixing on extinction by carbonaceous particles.J. Geophys. Res. Atmos. 1999, 104, 15941–15954. [CrossRef]
25. Khalizov, A.F.; Xue, H.; Wang, L.; Zheng, J.; Zhang, R. Enhanced light absorption and scattering by carbonsoot aerosol internally mixed with sulfuric acid. J. Phys. Chem. A 2009, 113, 1066–1074. [CrossRef] [PubMed]
26. Bambha, R.P.; Dansson, M.A.; Schrader, P.E.; Michelsen, H.A. Effects of volatile coatings and coating removalmechanisms on the morphology of graphitic soot. Carbon 2013, 61, 80–96. [CrossRef]
27. Lack, D.A.; Langridge, J.M.; Bahreini, R.; Cappa, C.D.; Middlebrook, A.M.; Schwarz, J.P. Brown carbon andinternal mixing in biomass burning particles. Proc. Natl. Acad. Sci. USA 2012, 109, 14802–14807. [CrossRef][PubMed]
28. Xue, H.; Khalizov, A.F.; Wang, L.; Zheng, J.; Zhang, R. Effects of coating of dicarboxylic acids on themass—Mobility relationship of soot particles. Environ. Sci. Technol. 2009, 43, 2787–2792. [CrossRef][PubMed]
29. Huffman, J.A.; Ziemann, P.J.; Jayne, J.T.; Worsnop, D.R.; Jimenez, J.L. Development and characterizationof a fast-stepping/scanning thermodenuder for chemically-resolved aerosol volatility measurements.Aerosol Sci. Technol. 2008, 42, 395–407. [CrossRef]
30. Wehner, B.; Philippin, S.; Wiedensohler, A. Design and calibration of a thermodenuder with an improvedheating unit to measure the size-dependent volatile fraction of aerosol particles. J. Aerosol Sci. 2002, 33,1087–1093. [CrossRef]
31. Swanson, J.; Kittelson, D. Evaluation of thermal denuder and catalytic stripper methods for solid particlemeasurements. J. Aerosol Sci. 2010, 41, 1113–1122. [CrossRef]
32. Knox, A.; Evans, G.; Brook, J.; Yao, X.; Jeong, C.H.; Godri, K.; Sabaliauskas, K.; Slowik, J. Mass absorptioncross-section of ambient black carbon aerosol in relation to chemical age. Aerosol Sci. Technol. 2009, 43,522–532. [CrossRef]
33. Khalizov, A.F.; Lin, Y.; Qiu, C.; Guo, S.; Collins, D.; Zhang, R. Role of OH-initiated oxidation of isoprene inaging of combustion soot. Environ. Sci. Technol. 2013, 47, 2254–2263. [CrossRef] [PubMed]
34. Chow, J.C.; Watson, J.G.; Chen, L.W.A.; Arnott, W.P.; Moosmüller, H.; Fung, K. Equivalence ofelemental carbon by thermal/optical reflectance and transmittance with different temperature protocols.Environ. Sci. Technol. 2004, 38, 4414–4422. [CrossRef] [PubMed]
35. Countess, R.J. Interlaboratory analyses of carbonaceous aerosol samples. Aerosol Sci. Technol. 1990, 12,114–121. [CrossRef]
36. Cheng, Y.; Duan, F.K.; He, K.B.; Zheng, M.; Du, Z.Y.; Ma, Y.L.; Tan, J.H. Intercomparison of thermal–opticalmethods for the determination of organic and elemental carbon: Influences of aerosol composition andimplications. Environ. Sci. Technol. 2011, 45, 10117–10123. [CrossRef] [PubMed]

Atmosphere 2017, 8, 166 15 of 16
37. Khan, B.; Hays, M.D.; Geron, C.; Jetter, J. Differences in the OC/EC ratios that characterize ambient andsource aerosols due to thermal-optical analysis. Aerosol Sci. Technol. 2012, 46, 127–137. [CrossRef]
38. Stanmore, B.R.; Brilhac, J.F.; Gilot, P. The oxidation of soot: A review of experiments, mechanisms andmodels. Carbon 2001, 39, 2247–2268. [CrossRef]
39. Ebert, M.; Inerle-Hof, M.; Weinbruch, S. Environmental scanning electron microscopy as a new technique todetermine the hygroscopic behaviour of individual aerosol particles. Atmos. Environ. 2002, 36, 5909–5916.[CrossRef]
40. Ma, X.; Zangmeister, C.D.; Gigault, J.; Mulholland, G.W.; Zachariah, M.R. Soot aggregate restructuringduring water processing. J. Aerosol Sci. 2013, 66, 209–219. [CrossRef]
41. Tritscher, T.; Jurányi, Z.; Martin, M.; Chirico, R.; Gysel, M.; Heringa, M.F.; DeCarlo, P.F.; Sierau, B.; Prévôt, A.S.;Weingartner, E.; et al. Changes of hygroscopicity and morphology during ageing of diesel soot. Environ. Res.Lett. 2011, 6, 034026. [CrossRef]
42. Radney, J.G.; You, R.; Ma, X.; Conny, J.M.; Zachariah, M.R.; Hodges, J.T.; Zangmeister, C.D. Dependence ofsoot optical properties on particle morphology: Measurements and model comparisons. Environ. Sci. Technol.2014, 48, 3169–3176. [CrossRef] [PubMed]
43. China, S.; Kulkarni, G.; Scarnato, B.V.; Sharma, N.; Pekour, M.; Shilling, J.E.; Wilson, J.; Zelenyuk, A.;Chand, D.; Liu, S.; et al. Morphology of diesel soot residuals from supercooled water droplets and icecrystals: Implications for optical properties. Environ. Res. Lett. 2015, 10, 114010. [CrossRef]
44. Popovicheva, O.; Persiantseva, N.; Kuznetsov, B.; Rakhmanova, T.; Shonija, N.; Suzanne, J.; Ferry, D.Microstructure and water adsorbability of aircraft combustor soots and kerosene flame soots: Toward anaircraft-generated soot laboratory surrogate. J. Phys. Chem. A 2003, 107, 10046–10054. [CrossRef]
45. Huang, P.F.; Turpin, B.J.; Pipho, M.J.; Kittelson, D.B.; McMurry, P.H. Effects of water condensation andevaporation on diesel chain-agglomerate morphology. J. Aerosol Sci. 1994, 25, 447–459. [CrossRef]
46. Schnitzler, E.G.; Gac, J.M.; Jäger, W. Coating surface tension dependence of soot aggregate restructuring.J. Aerosol Sci. 2017, 106, 43–55. [CrossRef]
47. Leung, K.; Schnitzler, E.G.; Jaeger, W.; Olfert, J.S. Relative humidity dependence of soot aggregaterestructuring induced by secondary organic aerosol: Effects of water on coating viscosity and surfacetension. Environ. Sci. Technol. Lett. 2017, in press. [CrossRef]
48. Weber, A.; Baltensperger, U.; Gäggeler, H.; Schmidt-Ott, A. In situ characterization and structure modificationof agglomerated aerosol particles. J. Aerosol Sci. 1996, 27, 915–929. [CrossRef]
49. Weber, A.P.; Friedlander, S.K. In situ determination of the activation energy for restructuring of nanometeraerosol agglomerates. J. Aerosol Sci. 1997, 28, 179–192. [CrossRef]
50. Jang, H.D.; Friedlander, S.K. Restructuring of chain aggregates of titania nanoparticles in the gas phase.Aerosol Sci. Technol. 1998, 29, 81–91. [CrossRef]
51. Schmidt-Ott, A. New approaches to in situ characterization of ultrafine agglomerates. J. Aerosol Sci. 1988, 19,553–563. [CrossRef]
52. Chen, C.; Fan, X.; Shaltout, T.; Qiu, C.; Ma, Y.; Goldman, A.; Khalizov, A.F. An unexpectedrestructuring of combustion soot aggregates by subnanometer coatings of polycyclic aromatic hydrocarbons.Geophys. Res. Lett. 2016, 43, 11080–11088. [CrossRef]
53. Rothenbacher, S.; Messerer, A.; Kasper, G. Fragmentation and bond strength of airborne diesel sootagglomerates. Part. Fibre Toxicol. 2008, 5, 9. [CrossRef] [PubMed]
54. Lambe, A.; Ahern, A.; Williams, L.; Slowik, J.; Wong, J.; Abbatt, J.; Brune, W.; Ng, N.; Wright, J.;Croasdale, D.; et al. Characterization of aerosol photooxidation flow reactors: Heterogeneous oxidation,secondary organic aerosol formation and cloud condensation nuclei activity measurements. Atmos. Meas.Tech. 2011, 4, 445–461. [CrossRef]
55. Lambe, A.; Chhabra, P.; Onasch, T.; Brune, W.; Hunter, J.; Kroll, J.; Cummings, M.; Brogan, J.; Parmar, Y.;Worsnop, D.; et al. Effect of oxidant concentration, exposure time, and seed particles on secondary organicaerosol chemical composition and yield. Atmos. Chem. Phys. 2015, 15, 3063–3075. [CrossRef]
56. Lambe, A.; Ahern, A.; Wright, J.; Croasdale, D.; Davidovits, P.; Onasch, T. Oxidative aging and cloudcondensation nuclei activation of laboratory combustion soot. J. Aerosol Sci. 2015, 79, 31–39. [CrossRef]
57. Schneider, C.A.; Rasband, W.S.; Eliceiri, K.W. NIH image to ImageJ: 25 years of image analysis. Nat. Methods2012, 9, 671–675. [CrossRef] [PubMed]

Atmosphere 2017, 8, 166 16 of 16
58. Forrest, S.; Witten, T., Jr. Long-range correlations in smoke-particle aggregates. J. Phys. A Math. Gen. 1979,12, L109. [CrossRef]
59. Sorensen, C.; Cai, J.; Lu, N. Light-scattering measurements of monomer size, monomers per aggregate, andfractal dimension for soot aggregates in flames. Appl. Opt. 1992, 31, 6547–6557. [CrossRef] [PubMed]
60. Klein, R.; Meakin, P. Universality in colloid aggregation. Nature 1989, 339, 360–392.61. Köylü, Ü.Ö.; Faeth, G.; Farias, T.L.; Carvalho, M.d.G. Fractal and projected structure properties of soot
aggregates. Combust. Flame 1995, 100, 621–633. [CrossRef]62. Oh, C.; Sorensen, C. The effect of overlap between monomers on the determination of fractal cluster
morphology. J. Colloid Interface Sci. 1997, 193, 17–25. [CrossRef] [PubMed]63. Raj, A.; Tayouo, R.; Cha, D.; Li, L.; Ismail, M.A.; Chung, S.H. Thermal fragmentation and deactivation of
combustion-generated soot particles. Combust. Flame 2014, 161, 2446–2457. [CrossRef]64. Slowik, J.G.; Cross, E.S.; Han, J.-H.; Kolucki, J.; Davidovits, P.; Williams, L.R.; Onasch, T.B.; Jayne, J.T.;
Kolb, C.E.; Worsnop, D.R. Measurements of morphology changes of fractal soot particles using coating anddenuding experiments: Implications for optical absorption and atmospheric lifetime. Aerosol Sci. Technol.2007, 41, 734–750. [CrossRef]
65. Dhaubhadel, R.; Pierce, F.; Chakrabarti, A.; Sorensen, C. Hybrid superaggregate morphology as a result ofaggregation in a cluster-dense aerosol. Phys. Rev. E 2006, 73, 011404. [CrossRef] [PubMed]
66. Slowik, J.G.; Stainken, K.; Davidovits, P.; Williams, L.; Jayne, J.; Kolb, C.; Worsnop, D.R.; Rudich, Y.;DeCarlo, P.F.; Jimenez, J.L. Particle morphology and density characterization by combined mobility andaerodynamic diameter measurements. Part 2: Application to combustion-generated soot aerosols as afunction of fuel equivalence ratio. Aerosol Sci. Technol. 2004, 38, 1206–1222. [CrossRef]
67. Wilks, D.S. Statistical Methods in the Atmospheric Sciences; Academic Press: Cambridge, MA, USA, 2011.68. Chakrabarty, R.K.; Moosmüller, H.; Arnott, W.P.; Garro, M.A.; Walker, J. Structural and fractal properties
of particles emitted from spark ignition engines. Environ. Sci. Technol. 2006, 40, 6647–6654. [CrossRef][PubMed]
69. Virtanen, A.K.; Ristimäki, J.M.; Vaaraslahti, K.M.; Keskinen, J. Effect of engine load on diesel soot particles.Environ. Sci. Technol. 2004, 38, 2551–2556. [CrossRef] [PubMed]
70. Alfè, M.; Apicella, B.; Barbella, R.; Rouzaud, J.N.; Tregrossi, A.; Ciajolo, A. Structure–property relationshipin nanostructures of young and mature soot in premixed flames. Proc. Combust. Inst. 2009, 32, 697–704.[CrossRef]
71. Vander Wal, R.L.; Tomasek, A.J. Soot oxidation: Dependence upon initial nanostructure. Combust. Flame2003, 134, 1–9. [CrossRef]
72. Ishiguro, T.; Suzuki, N.; Fujitani, Y.; Morimoto, H. Microstructural changes of diesel soot during oxidation.Combust. Flame 1991, 85, 1–6. [CrossRef]
73. Song, J.; Alam, M.; Boehman, A.L.; Kim, U. Examination of the oxidation behavior of biodiesel soot.Combust. Flame 2006, 146, 589–604. [CrossRef]
74. Müller, J.-O.; Frank, B.; Jentoft, R.E.; Schlögl, R.; Su, D.S. The oxidation of soot particulate in the presence ofNO2. Catal. Today 2012, 191, 106–111. [CrossRef]
75. Kamm, S.; Möhler, O.; Naumann, K.-H.; Saathoff, H.; Schurath, U. The heterogeneous reaction of ozone withsoot aerosol. Atmos. Environ. 1999, 33, 4651–4661. [CrossRef]
76. Disselkamp, R.; Carpenter, M.; Cowin, J.; Berkowitz, C.; Chapman, E.; Zaveri, R.; Laulainen, N. Ozone lossin soot aerosols. J. Geophys. Res. Atmos. 2000, 105, 9767–9771. [CrossRef]
77. Browne, E.C.; Franklin, J.P.; Canagaratna, M.R.; Massoli, P.; Kirchstetter, T.W.; Worsnop, D.R.; Wilson, K.R.;Kroll, J.H. Changes to the chemical composition of soot from heterogeneous oxidation reactions. J. Phys.Chem. A 2015, 119, 1154–1163. [CrossRef] [PubMed]
© 2017 by the authors. Licensee MDPI, Basel, Switzerland. This article is an open accessarticle distributed under the terms and conditions of the Creative Commons Attribution(CC BY) license (http://creativecommons.org/licenses/by/4.0/).