Embed Size (px)
DESCRIPTION
Effect of the Water Saturation of Aggregates on the Shrinkage Induced
Citation preview

Cement & Concrete Composites 50 (2014) 1–9
Contents lists available at ScienceDirect
Cement & Concrete Composites
journal homepage: www.elsevier .com/locate /cemconcomp
Effect of the water saturation of aggregates on the shrinkage inducedcracking risk of concrete at early age
http://dx.doi.org/10.1016/j.cemconcomp.2014.02.0060958-9465/� 2014 Elsevier Ltd. All rights reserved.
⇑ Corresponding author. Tel.: +33 2 40 37 16 67; fax: +33 2 40 37 25 35.E-mail address: [email protected] (A. Loukili).
R. Cortas a,b, E. Rozière a, S. Staquet b, A. Hamami b, A. Loukili a,⇑, M.-P. Delplancke-Ogletree c
a L’UNAM Université, Institut de Recherche en Génie Civil et Mécanique, GeM-UMR CNRS 6183, Centrale Nantes, 1 rue de la Noe, BP 92101,F-44321 Nantes Cedex 3, Franceb Service BATir, Université Libre de Bruxelles, Brussels, Belgiumc Service 4MAT, Université Libre de Bruxelles, Brussels, Belgium
a r t i c l e i n f o
Article history:Received 21 April 2013Received in revised form 10 February 2014Accepted 20 February 2014Available online 15 March 2014
Keywords:AggregatesWater saturationConcreteShrinkageCracking risk
a b s t r a c t
This work consists in studying the effect of the water saturation of aggregates on the development ofshrinkage and the potential cracking risk of early age ordinary concrete. Different concretes were obtainedfrom a given concrete mixture by changing only the initial degree of saturation of limestone aggregates.Three degrees of saturation were studied, namely: 0% (dry aggregates), 50% (partially saturated aggregates)and 100% (saturated aggregates). From the experimental results, the early age behaviour and the mechan-ical properties of the concrete strongly depend on the water saturation of aggregates. A relative crackingrisk was estimated from a stress-based approach and experimentally assessed parameters. The potentialrisk of cracking of these different concretes was shown to be different. Even if the total water content is keptconstant, the water remaining in the cement paste actually depends on the initial water saturation ofaggregates. The early age behaviour of concrete and the development of its early age properties dependon the amount of added water during the mixing.
� 2014 Elsevier Ltd. All rights reserved.
1. Introduction
Plastic shrinkage cracking is often observed on slabs, slabs ongrade, and raft slab foundations. The starting point of this studywas a site investigation. Cracking across a 20 cm thick raft slabfoundation was observed during the first 24 h after casting. Thedistribution and the direction of the cracks showed that they werenot due differential settlement or bending. The concrete mixtureand curing complied with standard requirements. The targetEffective water/Cement (Weff/C) ratio was 0.42. The Effective watercontent used in the mix design of concrete is the total watercontent (mixing water + water supplied by aggregates + water pro-vided by chemical admixtures) from which the water absorbed bythe aggregates is subtracted. The mixture proportions were ana-lysed from the data provided by the ready-mix concrete supplier.The water saturation of aggregate was relatively high thus theAdded water/Cement ratio (0.34) was significantly lower thanthe target Effective water/Cement ratio (0.42). The lower thewater/cement ratio, the higher the plastic shrinkage strain andearly age cracking risk. This example confirms that the water
saturation of aggregates is an influencing parameter to understandthe cracking risk of concrete subjected to restrained shrinkage.
Plastic shrinkage refers to shrinkage occuring during the settingand early hardening of concrete. It is due to external drying andself-dessiccation caused by the hydration of cement. Externaldrying can be avoided by a good curing of concrete at early age,thus this study mainly deals with autogenous shrinkage. Whenshrinkage is restrained, the concrete is subjected to tensile stressesthat are likely to cause cracking. The concrete cracking phenomenadepend on the magnitude and kinetics of shrinkage, the evolutionof the mechanical properties of the concrete (elastic modulus andtensile strength), and creep. Creep is significant at early age.However early-age creep and relaxation magnitudes are difficultto assess unless sophisticated testing is used.
It should be mentioned that the aggregates form 70% of theconcrete total volume. Even if aggregates are usually consideredas inert material, their properties influence the shrinkage of con-crete. Aggregate restrains the shrinkage of hardened cement paste,thus the modulus of elasticity is an influencing property. Aggregateis a porous material and it is likely to shrink or swell [1]. The poros-ity and pore size distribution influences the water saturation andthe capillary tension. How could the supplied or absorbed waterbe taken into account? The Effective water concept is approximatebecause it does not take into consideration the actual aggregates
2 R. Cortas et al. / Cement & Concrete Composites 50 (2014) 1–9
absorption kinetics. The actual amount of water absorbed by theaggregates can be different from the theoretical amount, which isbased on absorption capacity of the aggregates. As a result, theactual paste porosity is quite different from the corresponding the-oretical one and particularly in the zones surrounding aggregates,where an interfacial transition zone is likely to appear betweenthe paste and the aggregates [2]. Aggregates have a significantinfluence on the shrinkage, strength, and other concrete properties[1,3,4], and consequently on the concrete cracking.
The effect of lightweight aggregate saturation on the concreteshrinkage has already been investigated in literature [5–8]. Theseresearchers have proposed the use of saturated lightweight aggre-gates to provide ‘‘internal’’ curing for the concrete and mitigateautogenous shrinkage. Few studies deal with the influence of watersaturation of natural aggregates on early age shrinkage [9]. Theporosity of aggregates is generally expressed in terms of 24-hwater absorption (WA24). Water absorption usually ranges from0.5% to 2%. But the availability of natural aggregate for concreteis becoming a crucial question. As a consequence concrete produc-ers must use locally available resources even if aggregates showhigher water absorption. Limestone aggregates constitute 25% ofaggregates used in France for concrete production. Their waterabsorption usually ranges from 0.5% to 4%. Alhozaimy [10] haveshown that dry limestone aggregates did not fully absorb the partof added water required to compensate the aggregates absorption,and thus, lead to an increase of the actual (W/C) ratio of the mixesincreasing the initial slump and decreasing the compressivestrength. Pereira et al. [11] concluded that wet aggregates willnot absorb water from the cement paste contributing to a densecement-aggregate interface whereas dry aggregates absorb watercontributing to a porous cement-aggregate interface zone. Somestudies suggest improved interfacial properties when water andcement-based materials are drawn into the porous aggregate.The absorption of water by the partially saturated lightweightaggregate results in a thinner interfacial transition zone (ITZ) thanin normal aggregate mortar and a denser paste between 10 and50 lm from the surface of the lightweight aggregate [12]. More-over lightweight aggregate such as pumice affects the morphologicproperties of ITZ [13]. The results are consistent with studies aboutthe interface between repair mortars and concrete substrates.Courard et al. [14] have shown that the saturation levels of sub-strate concrete higher than 50% and lower than 90% are requestedto a better bonding of repair mortars. Mallat and Alliche [15] havealso shown that saturated concrete substrate with a dry surfacecan be considered as the best solution and gives the highest bondstrengths compared to the other moisture conditions.
This paper presents a comprehensive experimental study on theeffect of the water saturation of limestone aggregates on theshrinkage induced cracking risk of concrete at early age. The waterabsorption of the limestone aggregate used in this study (3.2%) isrelatively high, but the limestone aggregate complies with thespecifications of the standards on aggregate for concrete and it isordinarily used as aggregate. The investigation was carried out un-der sealed and drying conditions. The cracking analysis is based onautogenous shrinkage strains and elastic stress/strength approach.The results obtained for concrete mixtures with different satura-tion degrees of aggregates (0%, 50%, and 100%) are presented, ana-lysed and discussed in this paper to demonstrate the prevailingeffect of the (Added water/Cement) ratio.
2. Materials and concrete mixtures
2.1. Materials
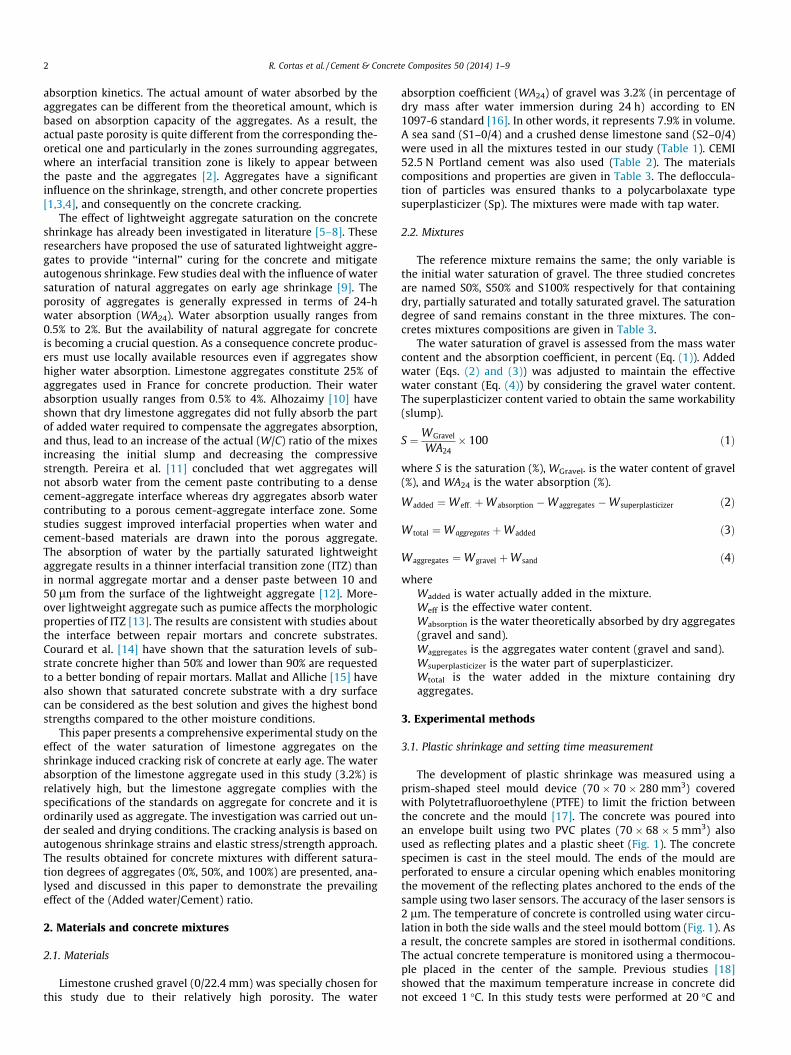
Limestone crushed gravel (0/22.4 mm) was specially chosen forthis study due to their relatively high porosity. The water
absorption coefficient (WA24) of gravel was 3.2% (in percentage ofdry mass after water immersion during 24 h) according to EN1097-6 standard [16]. In other words, it represents 7.9% in volume.A sea sand (S1–0/4) and a crushed dense limestone sand (S2–0/4)were used in all the mixtures tested in our study (Table 1). CEMI52.5 N Portland cement was also used (Table 2). The materialscompositions and properties are given in Table 3. The defloccula-tion of particles was ensured thanks to a polycarbolaxate typesuperplasticizer (Sp). The mixtures were made with tap water.
2.2. Mixtures
The reference mixture remains the same; the only variable isthe initial water saturation of gravel. The three studied concretesare named S0%, S50% and S100% respectively for that containingdry, partially saturated and totally saturated gravel. The saturationdegree of sand remains constant in the three mixtures. The con-cretes mixtures compositions are given in Table 3.
The water saturation of gravel is assessed from the mass watercontent and the absorption coefficient, in percent (Eq. (1)). Addedwater (Eqs. (2) and (3)) was adjusted to maintain the effectivewater constant (Eq. (4)) by considering the gravel water content.The superplasticizer content varied to obtain the same workability(slump).
S ¼WGravel
WA24� 100 ð1Þ
where S is the saturation (%), WGravel. is the water content of gravel(%), and WA24 is the water absorption (%).
Wadded ¼Weff : þWabsorption �Waggregates �Wsuperplasticizer ð2Þ
W total ¼Waggregates þWadded ð3Þ
Waggregates ¼Wgravel þWsand ð4Þ
whereWadded is water actually added in the mixture.Weff is the effective water content.Wabsorption is the water theoretically absorbed by dry aggregates(gravel and sand).Waggregates is the aggregates water content (gravel and sand).Wsuperplasticizer is the water part of superplasticizer.Wtotal is the water added in the mixture containing dryaggregates.
3. Experimental methods
3.1. Plastic shrinkage and setting time measurement
The development of plastic shrinkage was measured using aprism-shaped steel mould device (70 � 70 � 280 mm3) coveredwith Polytetrafluoroethylene (PTFE) to limit the friction betweenthe concrete and the mould [17]. The concrete was poured intoan envelope built using two PVC plates (70 � 68 � 5 mm3) alsoused as reflecting plates and a plastic sheet (Fig. 1). The concretespecimen is cast in the steel mould. The ends of the mould areperforated to ensure a circular opening which enables monitoringthe movement of the reflecting plates anchored to the ends of thesample using two laser sensors. The accuracy of the laser sensors is2 lm. The temperature of concrete is controlled using water circu-lation in both the side walls and the steel mould bottom (Fig. 1). Asa result, the concrete samples are stored in isothermal conditions.The actual concrete temperature is monitored using a thermocou-ple placed in the center of the sample. Previous studies [18]showed that the maximum temperature increase in concrete didnot exceed 1 �C. In this study tests were performed at 20 �C and
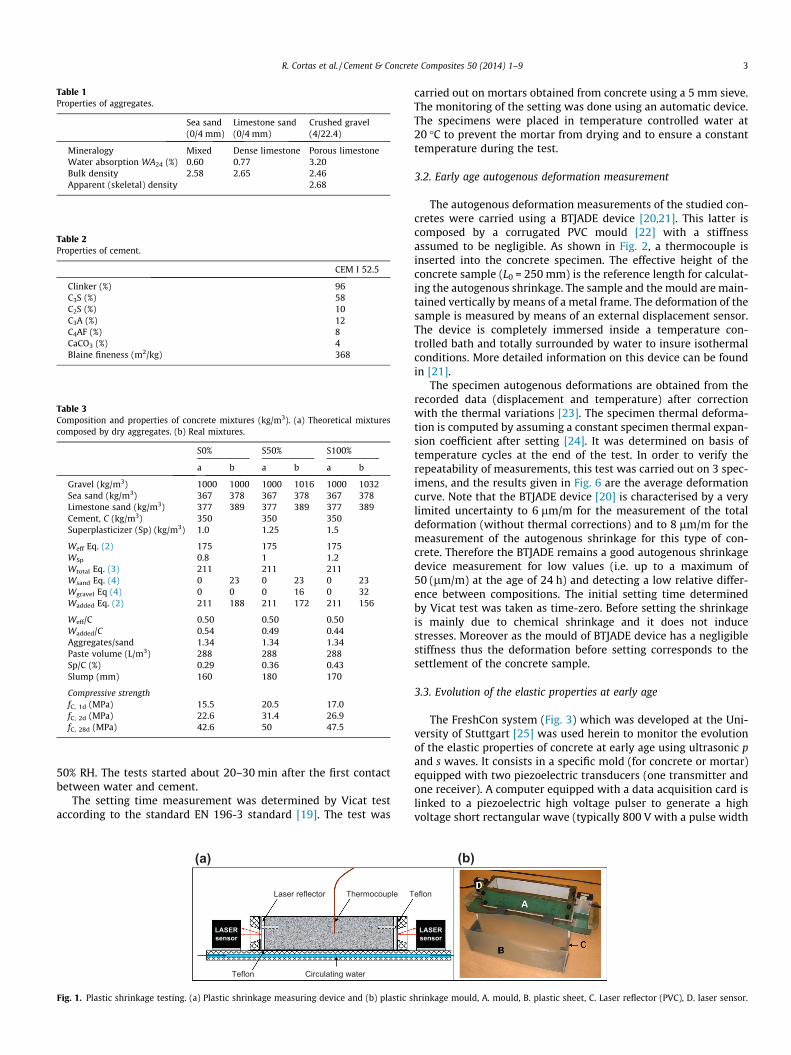
Table 1Properties of aggregates.
Sea sand(0/4 mm)
Limestone sand(0/4 mm)
Crushed gravel(4/22.4)
Mineralogy Mixed Dense limestone Porous limestoneWater absorption WA24 (%) 0.60 0.77 3.20Bulk density 2.58 2.65 2.46Apparent (skeletal) density 2.68
Table 2Properties of cement.
CEM I 52.5
Clinker (%) 96C3S (%) 58C2S (%) 10C3A (%) 12C4AF (%) 8CaCO3 (%) 4Blaine fineness (m2/kg) 368
Table 3Composition and properties of concrete mixtures (kg/m3). (a) Theoretical mixturescomposed by dry aggregates. (b) Real mixtures.
S0% S50% S100%
a b a b a b
Gravel (kg/m3) 1000 1000 1000 1016 1000 1032Sea sand (kg/m3) 367 378 367 378 367 378Limestone sand (kg/m3) 377 389 377 389 377 389Cement, C (kg/m3) 350 350 350Superplasticizer (Sp) (kg/m3) 1.0 1.25 1.5
Weff Eq. (2) 175 175 175WSp 0.8 1 1.2Wtotal Eq. (3) 211 211 211Wsand Eq. (4) 0 23 0 23 0 23Wgravel Eq (4) 0 0 0 16 0 32Wadded Eq. (2) 211 188 211 172 211 156
Weff/C 0.50 0.50 0.50Wadded/C 0.54 0.49 0.44Aggregates/sand 1.34 1.34 1.34Paste volume (L/m3) 288 288 288Sp/C (%) 0.29 0.36 0.43Slump (mm) 160 180 170
Compressive strengthfC, 1d (MPa) 15.5 20.5 17.0fC, 2d (MPa) 22.6 31.4 26.9fC, 28d (MPa) 42.6 50 47.5
R. Cortas et al. / Cement & Concrete Composites 50 (2014) 1–9 3
50% RH. The tests started about 20–30 min after the first contactbetween water and cement.
The setting time measurement was determined by Vicat testaccording to the standard EN 196-3 standard [19]. The test was
LASERsensor
Laser reflector T
Teflon Circulating water
Thermocouple
(a)
Fig. 1. Plastic shrinkage testing. (a) Plastic shrinkage measuring device and (b) plastic s
carried out on mortars obtained from concrete using a 5 mm sieve.The monitoring of the setting was done using an automatic device.The specimens were placed in temperature controlled water at20 �C to prevent the mortar from drying and to ensure a constanttemperature during the test.
3.2. Early age autogenous deformation measurement
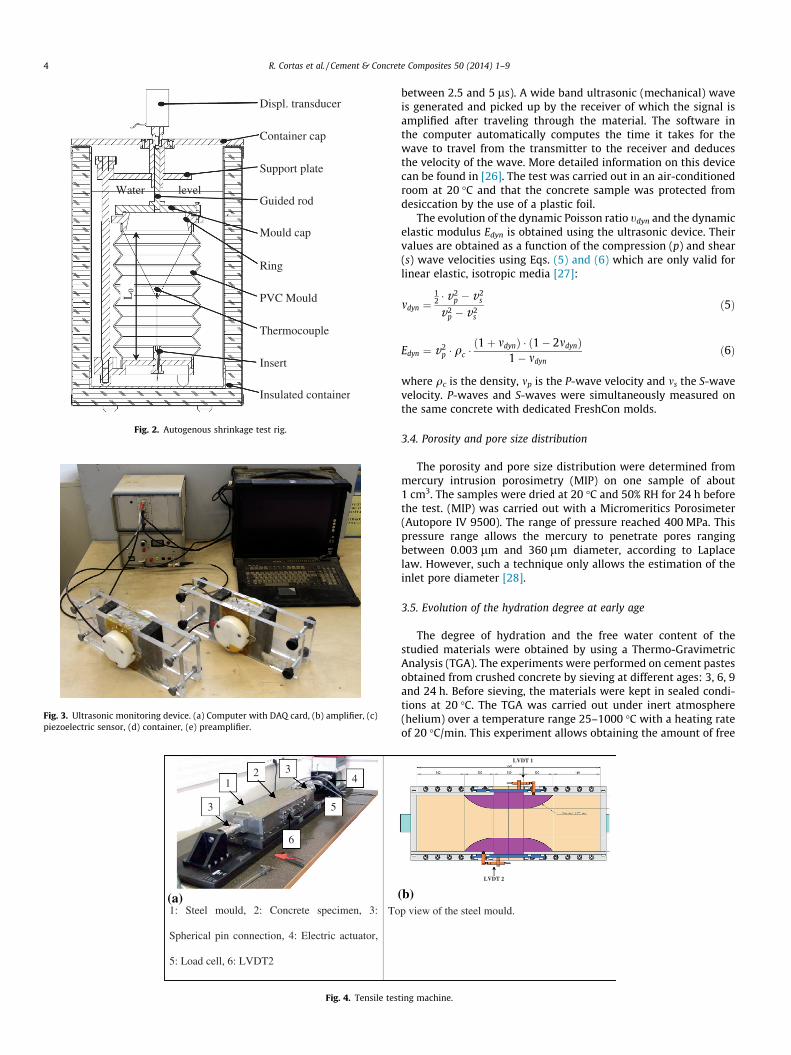
The autogenous deformation measurements of the studied con-cretes were carried using a BTJADE device [20,21]. This latter iscomposed by a corrugated PVC mould [22] with a stiffnessassumed to be negligible. As shown in Fig. 2, a thermocouple isinserted into the concrete specimen. The effective height of theconcrete sample (L0 = 250 mm) is the reference length for calculat-ing the autogenous shrinkage. The sample and the mould are main-tained vertically by means of a metal frame. The deformation of thesample is measured by means of an external displacement sensor.The device is completely immersed inside a temperature con-trolled bath and totally surrounded by water to insure isothermalconditions. More detailed information on this device can be foundin [21].
The specimen autogenous deformations are obtained from therecorded data (displacement and temperature) after correctionwith the thermal variations [23]. The specimen thermal deforma-tion is computed by assuming a constant specimen thermal expan-sion coefficient after setting [24]. It was determined on basis oftemperature cycles at the end of the test. In order to verify therepeatability of measurements, this test was carried out on 3 spec-imens, and the results given in Fig. 6 are the average deformationcurve. Note that the BTJADE device [20] is characterised by a verylimited uncertainty to 6 lm/m for the measurement of the totaldeformation (without thermal corrections) and to 8 lm/m for themeasurement of the autogenous shrinkage for this type of con-crete. Therefore the BTJADE remains a good autogenous shrinkagedevice measurement for low values (i.e. up to a maximum of50 (lm/m) at the age of 24 h) and detecting a low relative differ-ence between compositions. The initial setting time determinedby Vicat test was taken as time-zero. Before setting the shrinkageis mainly due to chemical shrinkage and it does not inducestresses. Moreover as the mould of BTJADE device has a negligiblestiffness thus the deformation before setting corresponds to thesettlement of the concrete sample.
3.3. Evolution of the elastic properties at early age
The FreshCon system (Fig. 3) which was developed at the Uni-versity of Stuttgart [25] was used herein to monitor the evolutionof the elastic properties of concrete at early age using ultrasonic pand s waves. It consists in a specific mold (for concrete or mortar)equipped with two piezoelectric transducers (one transmitter andone receiver). A computer equipped with a data acquisition card islinked to a piezoelectric high voltage pulser to generate a highvoltage short rectangular wave (typically 800 V with a pulse width
LASERsensor
eflon
(b)
hrinkage mould, A. mould, B. plastic sheet, C. Laser reflector (PVC), D. laser sensor.
Support plate
Guided rod
Mould cap
Ring
PVC Mould
Thermocouple
Displ. transducer
Container cap
Insert
Insulated container
Water level
L0
Fig. 2. Autogenous shrinkage test rig.
Fig. 3. Ultrasonic monitoring device. (a) Computer with DAQ card, (b) amplifier, (c)piezoelectric sensor, (d) container, (e) preamplifier.
1
3
34
6
2
5
1: Steel mould, 2: Concrete specimen, 3:
Spherical pin connection, 4: Electric actuator,
5: Load cell, 6: LVDT2
To(a)
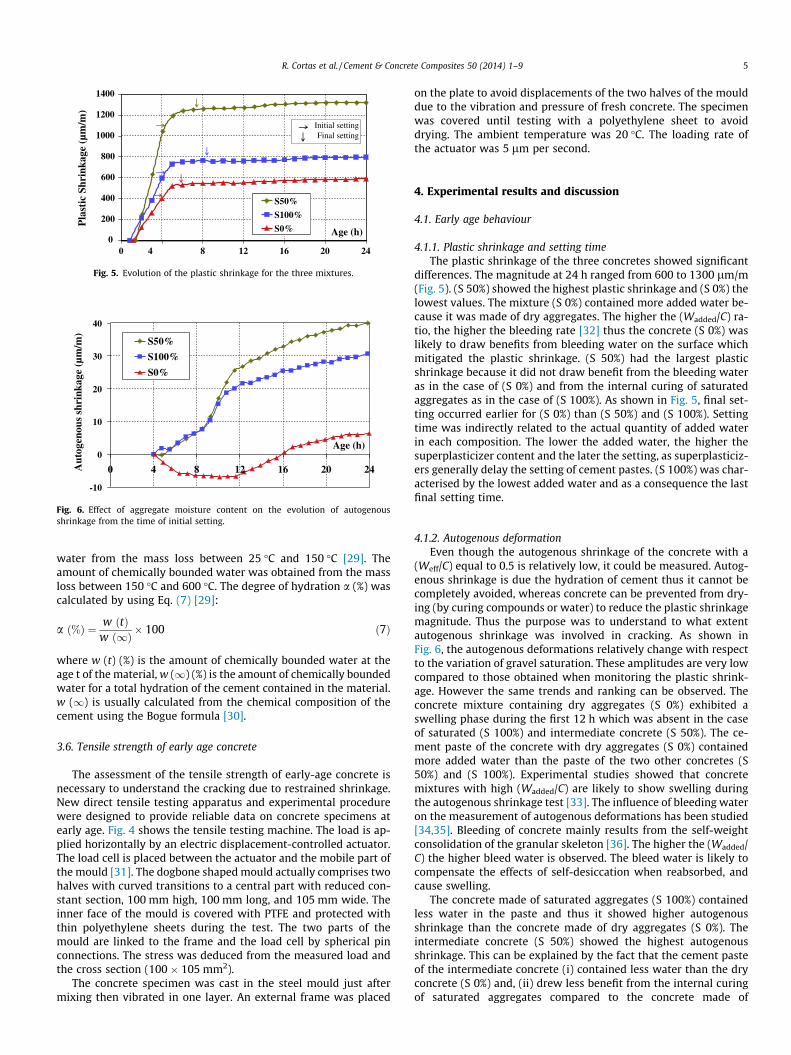
Fig. 4. Tensile tes
4 R. Cortas et al. / Cement & Concrete Composites 50 (2014) 1–9
between 2.5 and 5 ls). A wide band ultrasonic (mechanical) waveis generated and picked up by the receiver of which the signal isamplified after traveling through the material. The software inthe computer automatically computes the time it takes for thewave to travel from the transmitter to the receiver and deducesthe velocity of the wave. More detailed information on this devicecan be found in [26]. The test was carried out in an air-conditionedroom at 20 �C and that the concrete sample was protected fromdesiccation by the use of a plastic foil.
The evolution of the dynamic Poisson ratio tdyn and the dynamicelastic modulus Edyn is obtained using the ultrasonic device. Theirvalues are obtained as a function of the compression (p) and shear(s) wave velocities using Eqs. (5) and (6) which are only valid forlinear elastic, isotropic media [27]:
mdyn ¼12 � v2
p � v2s
v2p � v2
sð5Þ
Edyn ¼ v2p � qc �
ð1þ mdynÞ � ð1� 2mdynÞ1� mdyn
ð6Þ
where qc is the density, mp is the P-wave velocity and ms the S-wavevelocity. P-waves and S-waves were simultaneously measured onthe same concrete with dedicated FreshCon molds.
3.4. Porosity and pore size distribution
The porosity and pore size distribution were determined frommercury intrusion porosimetry (MIP) on one sample of about1 cm3. The samples were dried at 20 �C and 50% RH for 24 h beforethe test. (MIP) was carried out with a Micromeritics Porosimeter(Autopore IV 9500). The range of pressure reached 400 MPa. Thispressure range allows the mercury to penetrate pores rangingbetween 0.003 lm and 360 lm diameter, according to Laplacelaw. However, such a technique only allows the estimation of theinlet pore diameter [28].
3.5. Evolution of the hydration degree at early age
The degree of hydration and the free water content of thestudied materials were obtained by using a Thermo-GravimetricAnalysis (TGA). The experiments were performed on cement pastesobtained from crushed concrete by sieving at different ages: 3, 6, 9and 24 h. Before sieving, the materials were kept in sealed condi-tions at 20 �C. The TGA was carried out under inert atmosphere(helium) over a temperature range 25–1000 �C with a heating rateof 20 �C/min. This experiment allows obtaining the amount of free
LVDT 2
LVDT 1
p view of the steel mould.
(b)
ting machine.
0
200
400
600
800
1000
1200
1400
0 4 8 12 16 20 24
Age (h)
Pla
stic
Shr
inka
ge (
µm/m
)
S50%
S100%
S0%
Initial settingFinal setting
Fig. 5. Evolution of the plastic shrinkage for the three mixtures.
-10
0
10
20
30
40
0 4 8 12 16 20 24
Age (h)
Aut
ogen
ous
shri
nkag
e (µ
m/m
)
S50%
S100%
S0%
Fig. 6. Effect of aggregate moisture content on the evolution of autogenousshrinkage from the time of initial setting.
R. Cortas et al. / Cement & Concrete Composites 50 (2014) 1–9 5
water from the mass loss between 25 �C and 150 �C [29]. Theamount of chemically bounded water was obtained from the massloss between 150 �C and 600 �C. The degree of hydration a (%) wascalculated by using Eq. (7) [29]:
a ð%Þ ¼ w ðtÞw ð1Þ � 100 ð7Þ
where w (t) (%) is the amount of chemically bounded water at theage t of the material, w (1) (%) is the amount of chemically boundedwater for a total hydration of the cement contained in the material.w (1) is usually calculated from the chemical composition of thecement using the Bogue formula [30].
3.6. Tensile strength of early age concrete
The assessment of the tensile strength of early-age concrete isnecessary to understand the cracking due to restrained shrinkage.New direct tensile testing apparatus and experimental procedurewere designed to provide reliable data on concrete specimens atearly age. Fig. 4 shows the tensile testing machine. The load is ap-plied horizontally by an electric displacement-controlled actuator.The load cell is placed between the actuator and the mobile part ofthe mould [31]. The dogbone shaped mould actually comprises twohalves with curved transitions to a central part with reduced con-stant section, 100 mm high, 100 mm long, and 105 mm wide. Theinner face of the mould is covered with PTFE and protected withthin polyethylene sheets during the test. The two parts of themould are linked to the frame and the load cell by spherical pinconnections. The stress was deduced from the measured load andthe cross section (100 � 105 mm2).
The concrete specimen was cast in the steel mould just aftermixing then vibrated in one layer. An external frame was placed
on the plate to avoid displacements of the two halves of the moulddue to the vibration and pressure of fresh concrete. The specimenwas covered until testing with a polyethylene sheet to avoiddrying. The ambient temperature was 20 �C. The loading rate ofthe actuator was 5 lm per second.
4. Experimental results and discussion
4.1. Early age behaviour
4.1.1. Plastic shrinkage and setting timeThe plastic shrinkage of the three concretes showed significant
differences. The magnitude at 24 h ranged from 600 to 1300 lm/m(Fig. 5). (S 50%) showed the highest plastic shrinkage and (S 0%) thelowest values. The mixture (S 0%) contained more added water be-cause it was made of dry aggregates. The higher the (Wadded/C) ra-tio, the higher the bleeding rate [32] thus the concrete (S 0%) waslikely to draw benefits from bleeding water on the surface whichmitigated the plastic shrinkage. (S 50%) had the largest plasticshrinkage because it did not draw benefit from the bleeding wateras in the case of (S 0%) and from the internal curing of saturatedaggregates as in the case of (S 100%). As shown in Fig. 5, final set-ting occurred earlier for (S 0%) than (S 50%) and (S 100%). Settingtime was indirectly related to the actual quantity of added waterin each composition. The lower the added water, the higher thesuperplasticizer content and the later the setting, as superplasticiz-ers generally delay the setting of cement pastes. (S 100%) was char-acterised by the lowest added water and as a consequence the lastfinal setting time.
4.1.2. Autogenous deformationEven though the autogenous shrinkage of the concrete with a
(Weff/C) equal to 0.5 is relatively low, it could be measured. Autog-enous shrinkage is due the hydration of cement thus it cannot becompletely avoided, whereas concrete can be prevented from dry-ing (by curing compounds or water) to reduce the plastic shrinkagemagnitude. Thus the purpose was to understand to what extentautogenous shrinkage was involved in cracking. As shown inFig. 6, the autogenous deformations relatively change with respectto the variation of gravel saturation. These amplitudes are very lowcompared to those obtained when monitoring the plastic shrink-age. However the same trends and ranking can be observed. Theconcrete mixture containing dry aggregates (S 0%) exhibited aswelling phase during the first 12 h which was absent in the caseof saturated (S 100%) and intermediate concrete (S 50%). The ce-ment paste of the concrete with dry aggregates (S 0%) containedmore added water than the paste of the two other concretes (S50%) and (S 100%). Experimental studies showed that concretemixtures with high (Wadded/C) are likely to show swelling duringthe autogenous shrinkage test [33]. The influence of bleeding wateron the measurement of autogenous deformations has been studied[34,35]. Bleeding of concrete mainly results from the self-weightconsolidation of the granular skeleton [36]. The higher the (Wadded/C) the higher bleed water is observed. The bleed water is likely tocompensate the effects of self-desiccation when reabsorbed, andcause swelling.
The concrete made of saturated aggregates (S 100%) containedless water in the paste and thus it showed higher autogenousshrinkage than the concrete made of dry aggregates (S 0%). Theintermediate concrete (S 50%) showed the highest autogenousshrinkage. This can be explained by the fact that the cement pasteof the intermediate concrete (i) contained less water than the dryconcrete (S 0%) and, (ii) drew less benefit from the internal curingof saturated aggregates compared to the concrete made of

0
5
10
15
20
25
30
0 4 8 12 16 20 24
Age (h)
Edy
n (G
pa)
S100%
S50%
S0%
Fig. 7. Effect of aggregate moisture content on the evolution of dynamic modulus atearly age.
6 R. Cortas et al. / Cement & Concrete Composites 50 (2014) 1–9
saturated aggregates (S 100%). As a conclusion, the intermediateconcrete (S 50%) was the most sensitive to autogenous shrinkage.
4.1.3. Evolution of dynamic Young’s modulusFig. 7 shows the evolution of the dynamic Young’s modulus as a
function of the age of concrete. This dynamic elastic modulus wasslightly larger in the case of (S 50%) and (S 100%) compared to(S 0%). This is because a smaller quantity of added water was usedin theses mixtures which lead to lower actual (W/C) ratios andhigher strengths (thus a larger dynamic elastic modulus). It shouldbe noticed here that at the age of 6 h the difference of modulusbetween (S 0%) and the S (100%) was 70% whereas at the age of24 h the difference was only 10%.
4.2. Microstructural characterization
4.2.1. Porous network propertiesMercury Intrusion Porosimetry (MIP) was performed on con-
crete and cement pastes obtained from crushed concrete by sievingat different ages: 3, 6, 9 and 24 h. MIP analyses provided main porediameters. The main pore diameter was determined from the dif-ferential intrusion vs. pore diameter curve. The peak observed onthe curve is the diameter corresponding to the maximum intru-sion. The main pore diameter is plotted as a function of the ageof concrete in Fig. 8 and the cumulative intrusion of mercury isplotted as a function of pore diameter in Fig. 9.
The main pore diameter of concrete decreased as a consequenceof the hydration of cement. It was strongly influenced by the prop-erties of the cement paste. At 6 and 9 h, the main pore diameter ofthe concrete made of dry aggregates (S 0%) was significantly higherthan the main pore diameter of concretes S 50% and S 0%. TheAdded water/Cement ratio increased with a decrease of the initialwater saturation of aggregates, which caused an increase of themain pore diameter of hardening cement paste.
Paste
0.01
0.1
1
0 4 8 12 16 20 24
Age (h)
M
ain
pore
di
amet
er (
µm)
S0%S50%S100%
(a)
Fig. 8. Main pore diameter of
According to Fig. 9a, the cumulative porosity was differentdepending on the water saturation of aggregates for the same the-oretical concrete mixture. Fig. 9.b presents the distribution ofporosity for each concrete at the age of 24 h:
� 1st Phase: microporosity, pore diameters smaller than 0.1 lm.� 2nd Phase: mesoporosity, pore diameters between 0.1 and
0.4 lm.� 3rd Phase: macroporosity, pore diameters greater than 0.4 lm.
The microporosity (1) represents the porosity of hydrationproducts [37], it was approximately the same for the three con-cretes. Microporosity is directly related to the degree of hydrationof cement. The mesoporosity (2) represents the intermediateporosity of concrete, it depended on the initial degree of saturationof aggregates. The macroporosity (3) is influenced by the quantityof added water in concrete [38]. (S 0%) showed the highest macrop-orosity because it had the highest added water content in thepaste. According to Table 3, it should be noticed that (S 100%)had a higher long term compressive strength (Age > 24 h) thanconcrete made of dry aggregates (S 0%) and this observation is con-sistent with the difference of the macroporosity. (S 50%) showedthe same micro and macroporosity as (S 100%) but lower mesopo-rosity. This is consistent with higher strength. It can be explainedby the following assumptions (i) it contained less added water thanthe concrete (S 0%), (ii) and the lower mesoporosity could be due toa less developed interfacial transition zone [2,39] compared to theconcrete (S 100%) (This should be verified). It is important to notethat the trends and the classification of the compressive strengthare the same as for plastic and early age autogenous shrinkage.The concrete (S 50%) containing partially saturated aggregatesshowed the highest compressive strength, plastic shrinkage, andautogenous shrinkage magnitudes, whereas the concrete (S 0%)containing dry aggregates showed the lowest values.
4.2.2. Hydration evolutionAs shown in Fig. 10, the three concrete mixtures had the same
evolution of the hydration degree during the first 24 h. The hydra-tion degree is directly related to chemically bounded water whichis relatively the same for the three compositions the first 24 h.Hydration degree can be correlated to the microporosity (Fig. 9).The microporosity is actually related to the progress of the reactionof hydration of cement because it represents the porosity of hydra-tion products which was the same for the three compositions.
4.3. Early age cracking risk of concrete
A comprehensive assessment of the cracking risk should notonly take into account the stress-inducing phenomena, i.e.shrinkage and increase of elastic modulus, but also the beneficialeffects of creep or relaxation. The analysis is generally made using
M
ain
pore
di
amet
er (
µm)
(b) Concrete
0.01
0.1
1
0 4 8 12 16 20 24
Age (h)
S0%S50%S100%
paste (a) and concrete (b).
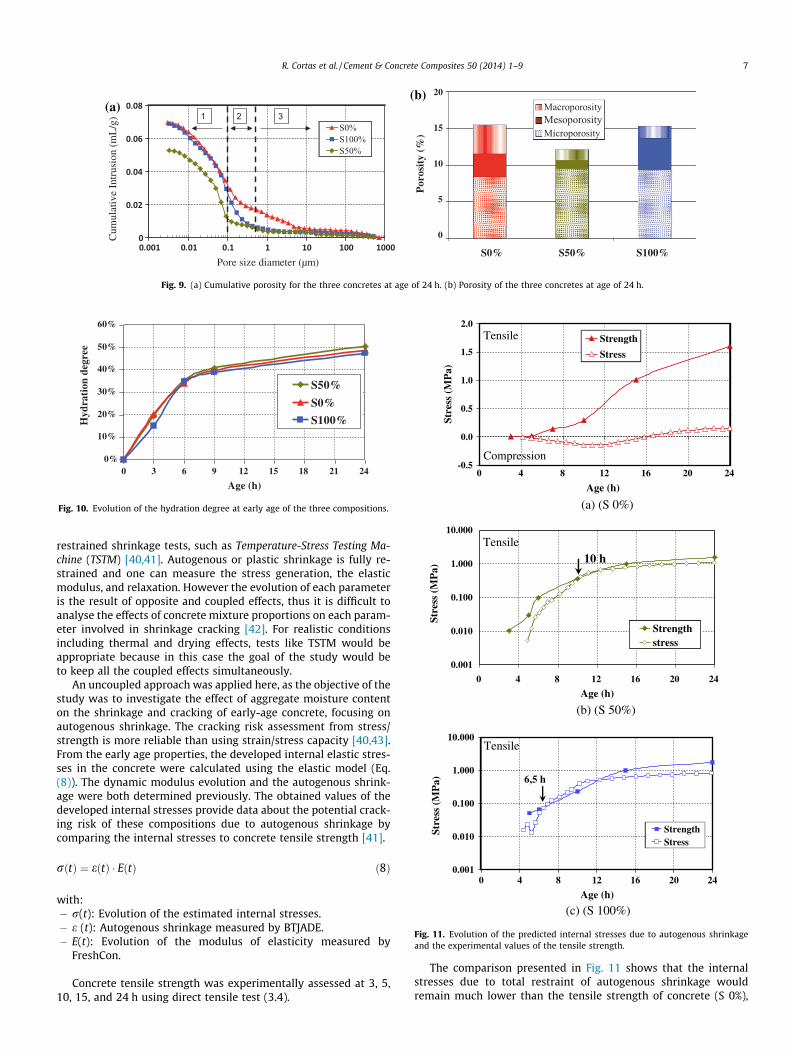
Fig. 9. (a) Cumulative porosity for the three concretes at age of 24 h. (b) Porosity of the three concretes at age of 24 h.
0%
10%
20%
30%
40%
50%
60%
0 3 6 9 12 15 18 21 24
Age (h)
Hyd
rati
on d
egre
e
S50%
S0%
S100%
Fig. 10. Evolution of the hydration degree at early age of the three compositions.
-0.5
0.0
0.5
1.0
1.5
2.0
Age (h)
Stre
ss (
MP
a)
Strength
Stress
Tensile
Compression
(a) (S 0%)
0.001
0.010
0.100
1.000
10.000
Age (h)
Stre
ss (
MP
a)
Strengthstress
10 hTensile
(b) (S 50%)
0.001
0.010
0.100
1.000
10.000
0 4 8 12 16 20 24
0 4 8 12 16 20 24
0 4 8 12 16 20 24
Age (h)
Stre
ss (
MP
a)
StrengthStress
6,5 h
Tensile
(c) (S 100%)
Fig. 11. Evolution of the predicted internal stresses due to autogenous shrinkageand the experimental values of the tensile strength.
R. Cortas et al. / Cement & Concrete Composites 50 (2014) 1–9 7
restrained shrinkage tests, such as Temperature-Stress Testing Ma-chine (TSTM) [40,41]. Autogenous or plastic shrinkage is fully re-strained and one can measure the stress generation, the elasticmodulus, and relaxation. However the evolution of each parameteris the result of opposite and coupled effects, thus it is difficult toanalyse the effects of concrete mixture proportions on each param-eter involved in shrinkage cracking [42]. For realistic conditionsincluding thermal and drying effects, tests like TSTM would beappropriate because in this case the goal of the study would beto keep all the coupled effects simultaneously.
An uncoupled approach was applied here, as the objective of thestudy was to investigate the effect of aggregate moisture contenton the shrinkage and cracking of early-age concrete, focusing onautogenous shrinkage. The cracking risk assessment from stress/strength is more reliable than using strain/stress capacity [40,43].From the early age properties, the developed internal elastic stres-ses in the concrete were calculated using the elastic model (Eq.(8)). The dynamic modulus evolution and the autogenous shrink-age were both determined previously. The obtained values of thedeveloped internal stresses provide data about the potential crack-ing risk of these compositions due to autogenous shrinkage bycomparing the internal stresses to concrete tensile strength [41].
rðtÞ ¼ eðtÞ � EðtÞ ð8Þ
with:� r(t): Evolution of the estimated internal stresses.� e (t): Autogenous shrinkage measured by BTJADE.� E(t): Evolution of the modulus of elasticity measured by
FreshCon.
Concrete tensile strength was experimentally assessed at 3, 5,10, 15, and 24 h using direct tensile test (3.4).
The comparison presented in Fig. 11 shows that the internalstresses due to total restraint of autogenous shrinkage wouldremain much lower than the tensile strength of concrete (S 0%),
8 R. Cortas et al. / Cement & Concrete Composites 50 (2014) 1–9
thus the potential risk of cracking was relatively low. This comesfrom the early age swelling due to higher bleeding. As shown inFig. 11, internal stresses due to autogenous shrinkage are likelyto become higher than the tensile strength of (S 50%) and(S 100%) at early age. (S 100%) was characterised by the higheststresses development before 8 h. This shows the prevailing influ-ence of the rapid increase of the elastic modulus during the firsthours, whereas the tensile strength remained relatively low. As aconsequence, the potential risk of cracking by restrained autoge-nous shrinkage of these formulations was high relatively tostrength at this age. (S 0%) remained the safest concrete compara-bly to (S 50%) and (S 100%), dealing with the potential risk ofcracking by restrained autogenous shrinkage. This effect of the(Added water/Cement) ratio is consistent with an experimentalstudy on the effect of the (Water/Cement) ratio on the stress gen-eration due to restrained shrinkage [9]; the stress increases with adecrease in (Water/Cement) ratio.
It is important to note that such results do not take into accountthe creep and relaxation phenomena of the concrete and any cou-pling between shrinkage and strength development. The creepstrain develops rapidly at very early age thus stress relaxationdue to creep can overcome the rapidly increasing shrinkage-in-duced tensile stress. As the three concretes were made of the sameraw materials and derived from the same reference mixture, the(Added water/Cement) ratio mainly influences creep and relaxa-tion. Experimental studies have shown that creep increases with(Water/Cement) ratio [44,45]. Moreover model codes such asCEB-FIP Model Code 1990 [46] often consider that creep increaseswith a decrease in compressive strength. As a consequence con-crete (S 0%) would benefit from the highest relaxation and showthe lowest risk of cracking due to restrained shrinkage.
5. Conclusions
In this paper, a comprehensive set of experimental data aboutthe effect of the initial water saturation of limestone aggregateson shrinkage is presented. The experimental study deals withearly-age cracking. Assuming that good curing practice has beendone, the paper is focused on the causes and consequences ofautogenous shrinkage. The investigation was carried out at macro-scopic and microscopic scale. An estimation of the relative risk ofcracking risk due to restrained autogenous shrinkage was alsoproposed based on the evolution of the elastic properties and theautogenous shrinkage evolution at early age. The main conclusionsof this study can be summarized as follows:
� The concept of the effective water is overly simplified whenusing aggregates with significant water absorption. The effec-tive water consists in adjusting the added water to take intoaccount the absorption of mixing water into porous aggregatethat has been batched dry or at moisture content less than itsabsorption, in order to keep the total water constant. Three con-crete mixtures were derived from a reference concrete mixtureby varying only the initial water saturation of gravel, namely:dry, partially saturated and totally saturated. This results inconcretes with significantly different behaviour. The actualamount of water absorbed by dry or partially saturated aggre-gates can be different from the theoretical amount, which isbased on absorption capacity of the aggregates. The behaviourof concrete is strongly related to the (Added water/Cement)ratio, which depends on the aggregates initial degree of satura-tion for given effective water content.
� Concrete made of partially saturated aggregates (S 50%) did nothave intermediate behaviour between concrete made of dryaggregates (S 0%) and saturated aggregates (S 100%). It showed
the highest autogenous and plastic shrinkage at early age, andthe highest compressive strength. (S 50%) contained less addedwater than (S 0%) and did not take advantage of the internalcuring by saturated aggregates as (S 100%).
� The investigation carried out at the macroscopic scale can bringinteresting information about the microstructure to understandthe effect of the water saturation of aggregates. As suggested bythe values of strength and porosimetry mesurements, the initialwater content of aggregates is likely to influence the porositydistribution of the cement paste. Initially dry aggregates(S 0%) resulted in higher macroporosity and lower strength.Concrete made of saturated aggregates (S 100%) showed highermesoporosity and lower strength than partially saturatedaggregates (S 50%).
� The methodology to assess the relative cracking risk was basedon the stress/strength evaluation and experimental parameters.Stresses were calculated using autogenous shrinkage and elasticmodulus data. The strength of early-age concrete was obtainedfrom direct tensile testing. The concrete with initially saturatedaggregates showed the highest potential risk of cracking,because of the rapid evolution of elastic modulus from initialsetting time.
Acknowledgements
This work was supported by the Fédération Nationale desTravaux Publics, FNTP (French National Association of Contractors).The authors gratefully acknowledge material supplied by UNPG(National Association of Aggregate Producers). This research ispartially financed by grants funded by the Belgian NationalFoundation for Scientific Research (FRFC), which is gratefullyacknowledged.
References
[1] Fujiwara T. Effect of aggregate on drying shrinkage of concrete. J Adv ConcrTech 2008;6(1):31–44.
[2] Ollivier J-P, Maso J-C, Bourdette B. Interfacial transition zone in concrete. AdvCem Bas Mater 1995;2(1):30–8.
[3] Verbeck G, Landgren R. Influence of physical characteristics of aggregates onfrost resistance of concrete. ASTM, Philadelphia 1960;3(60):1063–79.
[4] Bisschop J, Van Mier JGM. Effect of aggregates on drying shrinkagemicrocracking in cement-based composites. Mater struct 2002;35(8):453–61.
[5] Zhutovsky S, Kovler K, Bentur A. Efficiency of lightweight aggregates forinternal curing of high strength concrete to eliminate autogenous shrinkage.Mater Struct 2002;35:97–101.
[6] Bentz DP, Snyder KA. Protected paste volume in concrete extension to internalcuring using saturated lightweight fine aggregate. Cem Concr Res1999;29:1863–7.
[7] Lura P. Internal water curing with Liapor aggregates. HERON 2005;50:1.[8] Henkensiefken R, Bentz D, Nantung T, Weiss J. Volume change and cracking in
internally cured mixtures made with saturated lightweight aggregate undersealed and unsealed conditions. Cem Concr Compos 2009;31:427–37.
[9] Toma G, Comportement des bétons au jeune âge, PhD Thesis, Canada:University of Laval; 1999.
[10] Alhozaimy AM. Effect of absorption of limestone aggregates on strength andslump loss of concrete. Cem Concr Compos 2009;31:470–3.
[11] Pereira CG, Castro-Gomes J, Pereira de Oliveira L. Influence of natural coarseaggregates size, mineralogy and water content on the permeability ofstructural concrete. Constr Build Mater 2009;23:602–8.
[12] Elsharief A, Cohen MD, Olek J. Influence of lightweight aggregate on themicrostructure and durability of mortar. Cem Concr Res 2005;35:1368–76.
[13] Ayhan M, Gönül H, Gönül I, Karakus A. Effect of basic pumice on morphologicproperties of interfacial transition zone in load-bearing lightweight/semi-lightweight concretes. Constr Build Mater 2011;25:2507–18.
[14] Courard L, Lenaers J-F, Michel F, Garbacz A. Saturation level of the superficialzone of concrete and adhesion of repair systems. Constr Build Mater2011;25:2488–94.
[15] Mallat A, Alliche A. Mechanical investigations of two repair mortars andrepaired system, Actes de la 29ème Rencontre de l’AUGC, 29–31 mai 2011,Tlemcen, vol. I – Génie de la construction, p. 355.
[16] BS EN 1097-6, Tests for mechanical and physical properties of aggregates.Determination of particle density and water absorption; June 2001.
R. Cortas et al. / Cement & Concrete Composites 50 (2014) 1–9 9
[17] Turcry P, Loukili A. Evaluation of plastic shrinkage cracking of self-consolidating concrete. ACI Mater J 2006;103(4):272–9.
[18] Saliba J, Rozière E, Grondin F, Loukili A. Influence of shrinkage-reducingadmixtures on plastic and long-term shrinkage. Cem Concr Compos2011;33:209–17.
[19] EN 196-3. Methods of testing cement – Part 3: determination of setting timesand soundness; 2005.
[20] BTJADE. Equipment for the determination of autogenous shrinkage of concreteat early age. <http://www.lcpc.fr/francais/produits/materiels-mlpc-r/fiche-mlpc-r/article/btjade>.
[21] Boulay C. Test rig for early age measurements of the autogenous shrinkage of aconcrete, CONCRACK3 – RILEM-JCI international workshop on crack control ofmass concrete and related issues concerning early-age of concrete structures,15–16 March 2012, Paris, France.
[22] Boulay C, Patiès C. Mesure des déformations du béton au jeune âge. MaterStruct 1993;26:307–11.
[23] Staquet S, Boulay C, Robeyst N, De Belie N. Ultrasonic monitoring of setting andautogenous shrinkage development of high performance concrete, creep,shrinkage and durability mechanics of concrete and concrete structures,Tanabe et al. editor. In: proceedingc. of the 8th international conference oncreep, shrinkage and durability of concrete and concrete structures(CONCREEP 8), 321–327.
[24] Laplante P, Boulay C. Evolution du coefficient de dilatation thermique du bétonen fonction de sa maturité aux tout premiers âges. Mater struct1994;27:596–605.
[25] Reinhardt HW, Grosse CU. Continuous monitoring of setting and hardening ofmortar and concrete. Constr Build Mater 2004;18:145–54.
[26] Kurz JH, Grosse CU, Reinhardt HW. Strategies for reliable automatic onset timepicking of acoustic emissions and of ultrasound signals in concrete. Ultrasonics2005;43:538–46.
[27] Krauß M, Hariri K. Determination of initial degree of hydration forimprovement of early-age properties of concrete using ultrasonic wavepropagation. Cem Concr Compos 2006;28:299–306.
[28] Diamond S. Review – Mercury porosimetry, an inappropriate method for themeasurement of pore size distributions in cement-based materials. Cem ConcrRes 2000;30:1517–25.
[29] Loukili A, Khelidj A, Richard P. Hydration kinetics, change of relative humidity,and autogenous shrinkage of ultra-high-strength concrete’. Cem Concr Res1999;29:577–84.
[30] Bogue RH. Calculation of the compounds in Portland cement. Indust Eng ChemAnal Ed 1929;1:192–7.
[31] Roziere E, Cortas R, Loukili A. How to investigate the tensile behaviour of earlyage concrete? Amsterdam: Microdurability; April 2012. p. 11–13.
[32] Almusallam AA, Maslehuddin M, Abdul-Waris M, Khan MM. Effect of mixpropotions on plastic shrinkage cracking of concrete in hot environments.Constr Build Mater 1998;12:353–8.
[33] Darquennes A. Comportement au jeune âge de bétons formulés à base deciment au laitier de haut fourneau en condition de déformations libre etrestreinte, PhD thesis. Université Libre de Bruxelles; 2009.
[34] Bjøntegaard Ø, Thermal dilation and autogenous deformation as driving forcesto self-induced stresses in high performance concrete, Dr.ing. theses 1,Trondheim: The Norwegian University of Science and Technology; 1999. p.121.
[35] Hammer TA, Bjøntegaard Ø, Sellevold EJ. Measurement methods for testing ofearly age autogenous strain. In: Early age cracking in cementitious systems.Cachan: RILEM TC 181-EAS Committee, RILEM; 2002. p. 207–15.
[36] Josserand L, Coussy O, de Larrard F. Bleeding of concrete as an ageingconsolidation process. Cem Concr Res 2006;36:1603–8.
[37] Verbeck GJ, Helmuth RH. Structures and physical properties of hardenedcement paste. In: 5th International Symposium On The Chemistry Of Cement,Tokyo, 3(7–1) 1968, p. 1–11.
[38] Diamond S. Cement paste microstructure: an overview at several levels. In:Proceeding. of the conference of Sheffield on hydraulic cement pastes, vol. 8–9,Cement and Concrete Association; April 1976.
[39] Scrivener K, Alison K, Laugesen C et P. The interfacial transition zone (ITZ)Between Cement Paste and Aggregate in concrete. Interf Sci 2004;12:411–21.
[40] Bjøntegaard Ø. Thermal dilation and autogenous deformation as driving forcesto self-induced stresses in high performance concrete. PhD thesis. Norway:NTNU; 1999. p. 256.
[41] Hammer TA, Fossa KT, Bjøntegaard Ø. Cracking tendency of HSC: tensilestrength and self generated stress in the period of setting and early hardening.Mater struct 2007;40:319–24.
[42] Darquennes A, Staquet S, Delplancke-Ogletree M-P, Espion B. Effect ofautogenous deformation on the cracking risk of slag cement concretes. CemConcr Compos 2011;33:368–79.
[43] Ravina D, Shalon R. Plastic shrinkage cracking. ACI J 1968;65(22):282–94.[44] Domone PL. Uniaxial tensile creep and failure of concrete. Mag Concr Res
1974;26(88):144–52.[45] Lee Y, Yi S-T, Kim M-S, Kim J-K. Evaluation of a basic creep model with respect
to autogenous shrinkage. Cem Concr Res 2006;36:1268–78.[46] CEB-FIP, editor. Model code 1990 – design code. London: Thomas Telford;
1993.