Embed Size (px)
Citation preview
O CO
mc. 13 o-1
Pi'ipa.TQd by
RESEARCH AND ADVANCED DEVELOPMENT DIVISION AVCO CORPORATION
Wilmington, Ma saachusetts
•ft
EFFECT OF THE KINETICS OF CONTAMINANTS ON WAKE I0NIZATI0N
Technical Memorandum
RAD-TM-65-30 Contract No. DA-31-124-AR0-D-218
7?^
3^'
THIS REPORT WAS PREP-RED IN ACCORDANCE WITH DEPARTMENT OF THE ARMY CONTRACT DA-31-124.ARO.D-218. IT IS SUBMITTED IN PARTIAL FULFILLMENT OF THE CONTRACT AND IN ACCORDAN ; WITH ARPA ORDER NO. 553.
June 196 5
Prepared for
ADVANCED RESEARCH PROJECTS AGENCY M. S. ARMY RESEARCH. OFFICE
Durham North Carolina
Project DEFENDER ARPA Order No. ^53
mmw If

BEST AVAILABLE COPY
Thi» document consist» of 84 pogos, 182 copi«i, Sofi«» A
EFFECT OF THE KINETICS OF CONTAMINANTS ON WAKE I0NIZATI0N
Prenared by
J. Eckerman, R Back, H. Lien and D Argentini
RESEARCH AND ADVANCED DEVELOPMENT DIVISION AVCO CORPORATION
Wilmington. Massachusetts
Technical r^morandum
RAD-TM-65-30 Contract No. DA-31-124-AR0-D-218
THIS REPORT WA«, PREPARED IN ACCORDANCE WITH DEPARTMENT OE THE ARMY CONTRACT DA.31.124.ARO.O-218. IT IS SUBMITTED IN PARTIAL FULFILLMENT OF THE CONTRACT AND IN ACCORDANCE WITH /iRPA ORDER NO. 553.
June 1965
APPROVED
A. J. Pallone, Manager Aerophysics Department
Prepared for
ADVANCED RESEARCH PROJECTS AGENCY TT. S. ARMY RESEARCH OFFICE
Durham North Carolina
Project DEFENDER ARPA Order No. 553
ABSTRACT
Experimental values for recombination rates between electrons and cesium ions are presented in this report. Measurements cover temperature& from 4300° K to l<i00oK at electron densities from 1. 5 (1014) to 2 (10i2j cc'1. The cesium plasma is generated by a high-velocity steel spherical projectile fired into a special chemical kinetics ballistic range. Microwave F-band and Ka-band focused probe measurements of electron density were made as a function of time at two wave locations. Measured and calculated electron density decays are shown to agree satisfactorily. The experimental recombination rates are compared to tl eoretical values from Bates, King8ton,and McWhirter; agree- ment is reasonable.
The experimental apparatus and techniques are described in detail in the report.
■in-

BLANK PAGE
CONTENTS
I. Introduction , . . , '
II. Experimental Technique , 3
III. Experimental Meaöurernents 6
IV. Determination of Recombination Rates 10
V. Summary 20
VI. References 23
Appendixes
A. The Chemical Kinetics Ballistics Range 26 B. Optical Measurements:: Rotating Mirror Streak
Photography and Optical Spectra ... 39 C. Microwave Measurements: Theory of the Focused
Probe Interaction wj h a Cylindrica.' Plasma and Description of the Apparatus Used in These Experiments ... 44
D. Theoretical Turbulent Wake Analysis with Electron- Ion Recombination o 1
ILLUSTRATIONS
Figure 1 Sketch of the Chemical Kinetics Ballistic Range Facility 4
2 Volume Wake Electron Density as a Function of Time ( Prs = 0. 10 Torr) 8
3 Volume Wake Electron Density as a Function of Time (Pcs =0.6 Torr) 9
4 Inverse Electron Density as a Function of Time 13
5 Comparison of Theoretically and Experimentally Determined Recombination Coefficients for Round 4-A. . 15
6 Comparison of Theoretically and Experimentally Determined Recombination Coefficients for Round 4-B . . 16
7 Comparison of Theoretically and Experimentally Determined Recombination Coefficients for Round 4-C. . 17
8 Comparison of Theoretically and Experimentally Determined Recombination Coefficients for Round 4-D.. 18
9 Recombination Coefficient from Bates, Kingston, McWhirter, (reference 6) as a Function of Temperature and Electron Density 19
10 Centerline Wake Temperature as a Function of Distance Behind Sphere; Velocity = 1300 ft/sec 20
li Ratio of Mid-Range Experimental to Mid-Range Theoretical Values of Rate Constant as a Function of Temperatore 21
12 Photograph of the Entire Facility 27
1 3 Sketch of Light Gas Launcher ..... 28
14 Sketch of Oven 30
1 5 Cross-St ctional Sketch of Oven 31
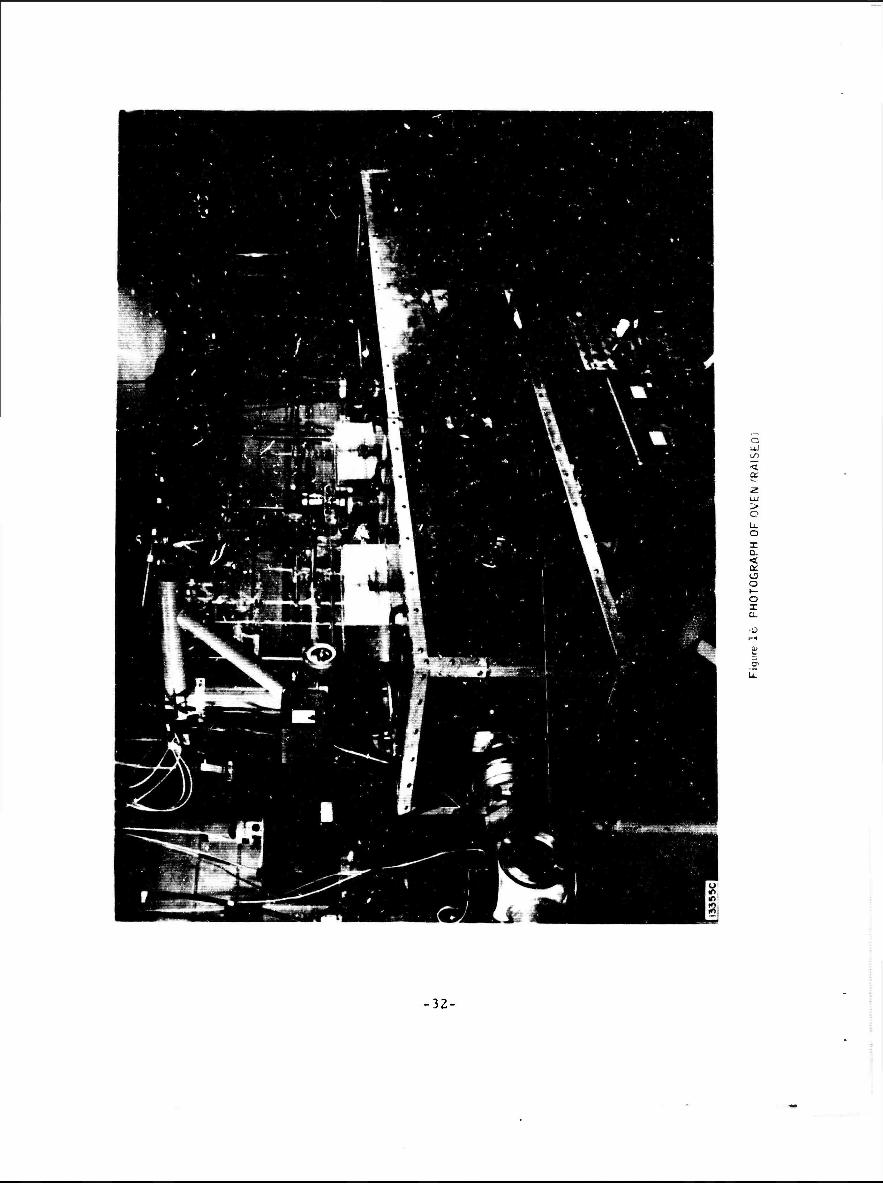
16 Photograph of Oven (Raised) 32
-VI'
ILLUSTRATIONS (Concl'd)
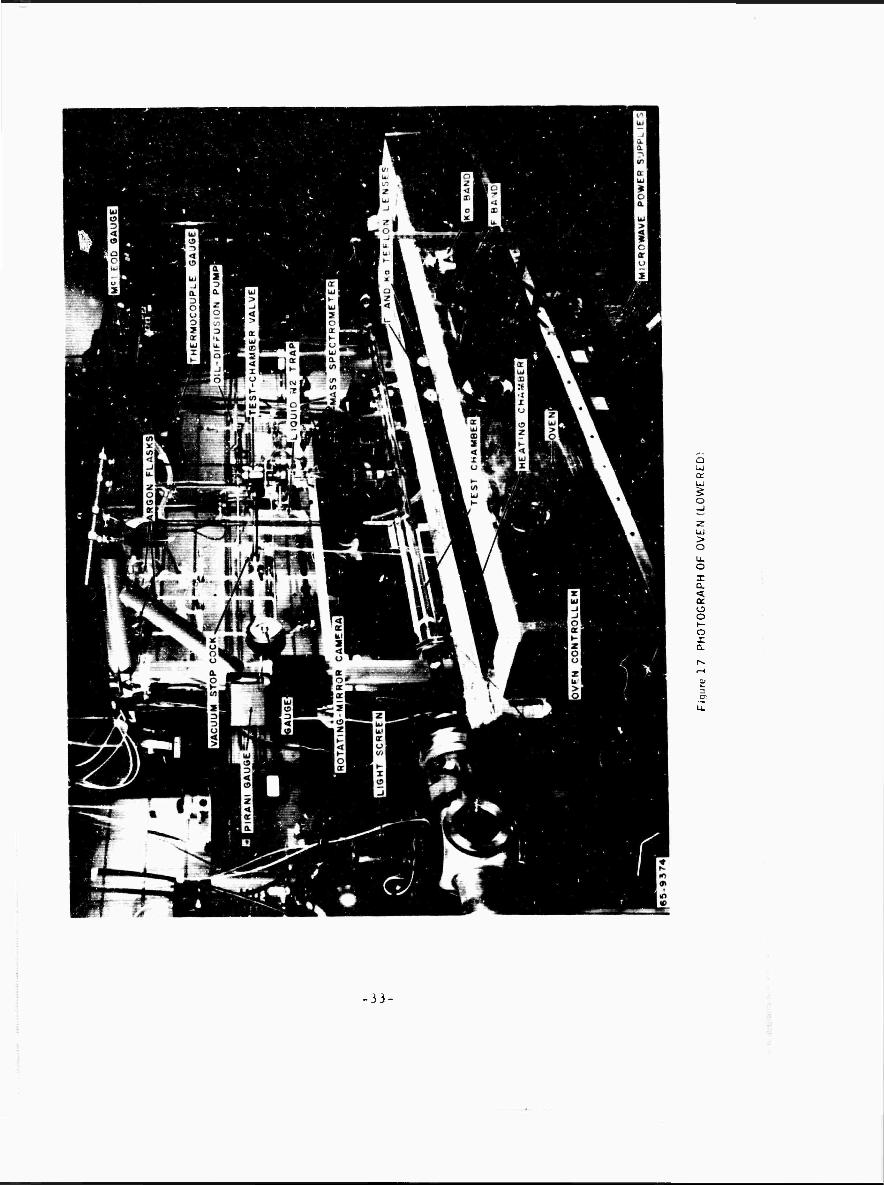
Figure 17 Photograph of Oven (Lowered; , 33
1 8 Gas Generation Rate 37
19 Rotating Mirror Streak Photograph -- Clean Shot 40
20 Rotating Mirror Streak Photograph -- Shot With Debris. . 41
21 Time Integrated Spectra 43
22 Electron-Ion Collision Frequency as a Function of Electron Density 46
23 Schematic Diagram of Focused Free Space Microwave Probe Installation . 48
24 Attenuation in DB for 12. -i-mm Length of Plasma as a Function of Electron Density 49
25 Index of Refraction as a Function of Electron Density at 35 and 117 kmc 50
26 Illustration of the Effect of Microwave Refraction by Plasma Cylinder 51
27 Attenuation by Refraction of Rays by Cylindrical Plasma 52
28 Reflection Coefficient and Attenuation from Reflection as a Function of Electron Density 54
29 Ka-Band Probe Calibration 57
30 F-Band Probe Calibration 58
31 Correspondance Between Microwave Measurements and the Reduced Data 59
32 Flew Configuration for a Sphere at Hypersonic Speed .... 62
r
-Vll-
TABLES
Table i Previous Measurements of Recombination in a Cesium Plasma ,....,..
II Wavelengths and Relative Intensities of Spectral Lines . . 42
-vxii-

ACKNOWLEDGEMENT
The authors wish to acknowledge the contributions from W. McKay for xauncher designs; K. Coughlin for oven design and fabrication; N. Petrozio and W. Keene assisting technicians; and T. Warms5 programer.
The patient editing and redrafting of the manuscript by Dr. A. Wood is grate- fully appreciated.
1
-XI"
i

BLANK PAGE
H
-^-- '■ - :-^..:_:-^-.r;;;;.:-: ^i^ ■ »i' "'-^ "nmuM iapyi
V M- a2
b
Ci
Cs, Cs*, Cs
D:
k
M i
n _ c
r
q
LIST OF SYMBOLS
Constants in polynomial
A, A', A* Argon atom, ion, excited atom
Molar concentration of ith species
Wake half-width
Constant of proportionality
Mass fraction of ith8pecie8
Cesium, ion, excited atom
Diffusion coefficient of species i
Constants in polynominal Vere2
{ Velocity profile
g Enthalpy profile
h Enthalpy
hl. Photon energy
Reaction rate
Molecular weight of i1 species
Rate of cliange of electron density
Pressure
Concentration profile
Radial coordinate
Temperature "K
Velocity in direction x
Velocity in direction y
-ix-
LIST OF SYMBOLS (Concrd)
W. Mass rate of production of species i, cc-
i Axial distance
y Density transformed coordinate inr direction
at S. cond-order reaction rate
5 Displacement thickness
f,, Eddy diffusivity
fp Eddy diffusivity in transformed coordinate
V Nondimensionalized distance from wake axis
9 Momentum thickness
i'j Stcchiometric coefficients
p Gas density
Subscripts
0, 1, 2, 3 ...Terms in polynominal
i Species type
e Edge
*o Infinity
ex Excitation
d« Deexcitation
re Radiation
1 Reaction I
1 Reaction II
III Reaction III
A Volume density species i
-x-
I. INTRODUCTION
Interest in alkali-metal ion recombination with electrons at Avco RAD was stimulated by discrepanciet among available experimental rate ccnstants. Previous measurements by Mohle", ^ Dandurand and Holt2, Wada and Knechtli3
D'Anpelo and Rynn^, and King^, are summarized in table I.
Measurements from references 1, 3,4, 5 were all carried out at approximately 2000°K, Although the electron densities for this group of measurements varied by a factor of 4000, the recombination constants were of the same order of magnitude. The room temperature measurement in reference 2 is unique; it appears to belong to an entirely different mechanism than the higher temper ature values.
The problem of ion-electron recombination has bv-'jn treatf-l theoretically by Bates, Kingston, McWhirter" and D'Angelo' Bot,; these models treat re- combination of the electron into a bound excii -d state and are called radia- tional recombination. The treatmen' -eference 6 for hydrogen-like ions is the most precise available and \.ill be ueed in this report both as L asis for flow-field calculations to predict the electron density distribution and for comparison with experimental rate constants. In a recent report Byron, Stabler, Bortz^ showed that the results of reference 6 could be obtained readily with some simplifying assumptions. This work however did not alter the phy- sical model or numerical values of reference 6.
Two recent recombination experiments in helium plasma have been carried cur by Hinnov and Hirschberg and Robben, Kunkel and Talbot^. Both groups of authors compared their data with reference 6. The agreement was excell- ent in both papers.
The experiments discussed in this paper treat electron-ion recombination i-i a thermal cesium plasma over a temperature range from 4300 to 1200 degrees helium at electron densities from 1. 7 (1014) to lO1^ electrons per cubic cen- timeter. The plasma investigated was a turbulent nonequilibriu n wake gen- erated by the passage of a hypersonic free-flight sphere through an argon- cesium vapor mixture. Electron density was measured by two microwave focused probes at frequencies of i 17 and 35 kilome^acycles. In general, the measureü recombination rates in these experiments are in reasonable agree- ment with the theoretical values of reference 6.
In this report, the experimental technique and equipment will be described. This incluacs a discussion of the microwave plasma diagnostic apparatus. The flow-field features as well as computing model employed for determining temperature and evaluated nonequilibrium electron density distribution are presented. Finally, the electron density measurements, recombination rates, and compai .son with theoretical values from reference 6 are given.
-1-
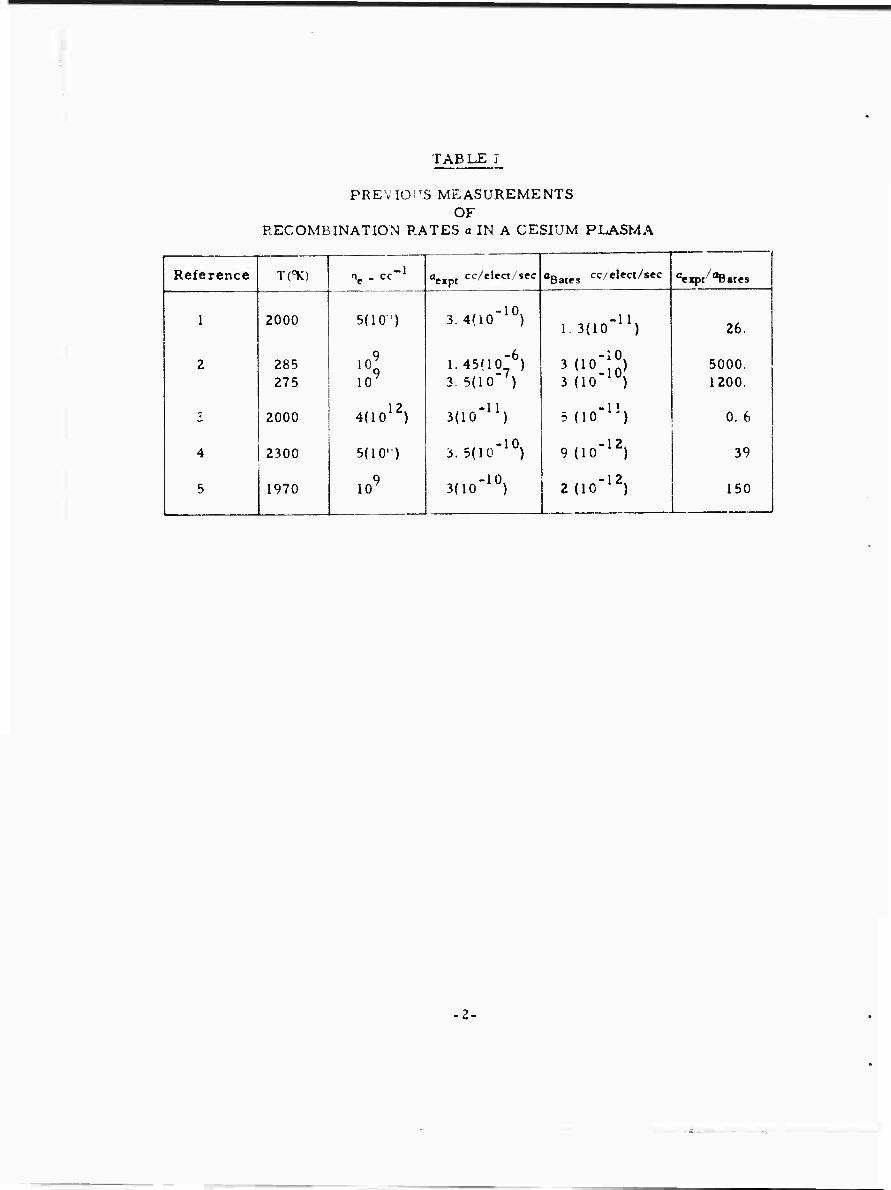
TABLE I
PREVIOUS MEASUREMENTS OF
RECOMBINATION RATES a IN A CESIUM PLASMA
Reference TOC) öä-^, cc/elect/sec rxpt "Bates c«-/elect/sec ceKpt/oB«tes |
1 2000 5(10') 3,4(10-10) i.sdo'11) 26.
! 2 285 275 10^
1.45(10'6) 3. 5(10"7)
3^:i0o) 3 (10 1U)
5000. 1200.
1 3 2000 4(1012) sdo-11) -1' 5(10 l*) 0. 6 1
1 4 2300 5(10") 3. 5(10'10) 9(10'12) 39
5 1970 109 3(10-10) 2 do"12) 150
-2-
II. EXPERIMENTAL TECHNIQUE
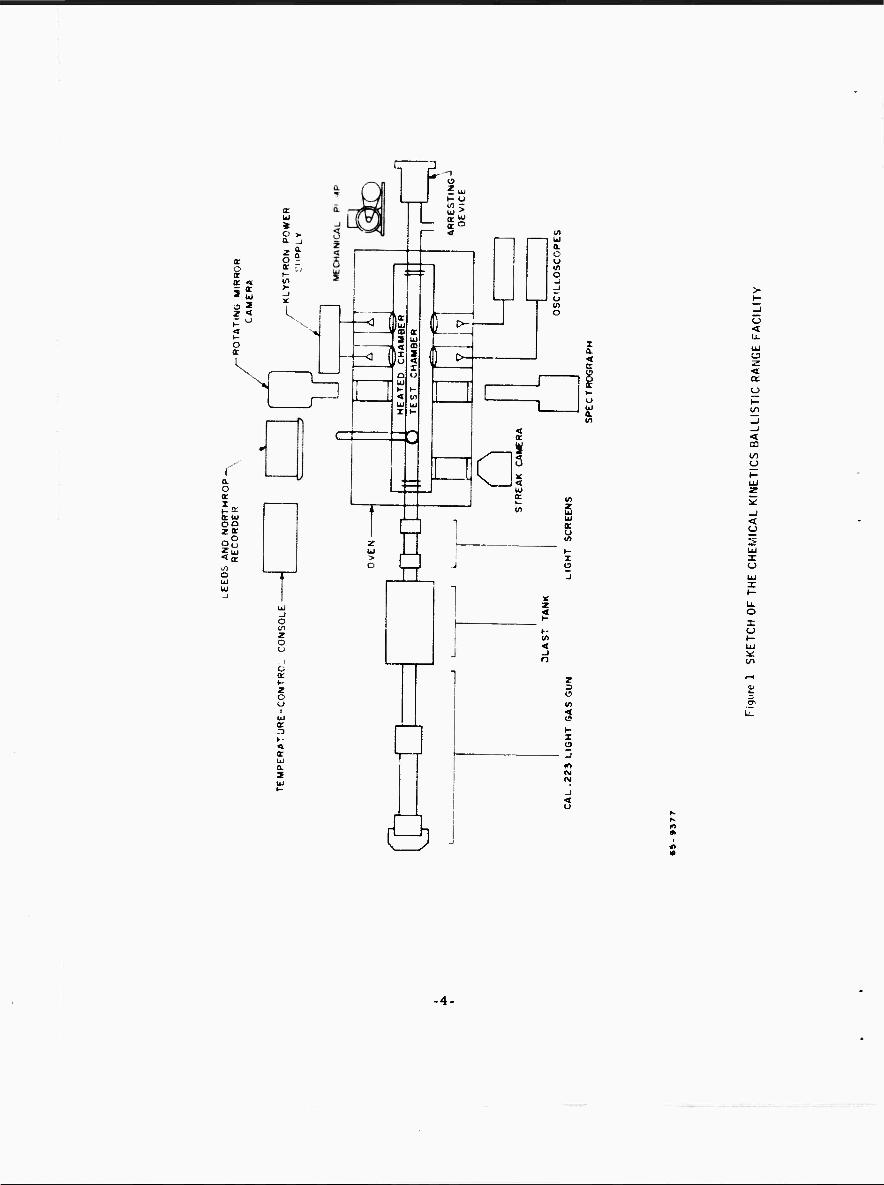
The cesium plasma investigated in this study was generated thermally behind the bow shock wave of a 5. 67-mm diameter hypervelocity steel sphere tra- velling in an argon-cesium vapor. The bore-sized projectile was accelerated to 13. 000 ft/sec by compressed hydrogen in a light gas launcher. The experi- mental facility is sketched schematically in figure 1. A detailed description of the launcher, range apparatus, and experimental piocedure is contained in appendix A
The projectile travels through a sir all tank which absorbs the blast irom the expanding hydrogen driver gas. Next, it parses through two stations with light screens for measurement of the projectile velocity and generation of electronic pulses for triggering the sweeps of the oscilloscope for the down- stream microwave apparatus The blast tank is filled with commercial grade argon at the same pressure as used in the test section. Next, the projectile pierces a thin stainless steel üaphram (.0005 inches thick) and commences to traverse the 10 feet long, 1-i/2-inch diameter pyrex test section. This heated test section is previously filled with reagent grade argon and chemically pure cesium vapor. The details of the construction and operation of the oven unit as well as the gas loading cycle are contained in appendix A. Each firing re- quires several days. The cesium is allowed to coat-out the interior walls of the reaction vessel. This method was established by Haught (reference il) using a heated shock tube to measure onset of ionization. Cesium is admitted to the test section is liquid form. The pressure is determined from the vapor pressure-temperaU're data in reference (12).
The projectile then passes in front of an unfiltered radiometer (photomultiplier type) which monitors the variation with time of the level of visible radiation from the projectile and wake at that station. This is a qualitative device to establish the absence of high-velocity particles which might arise from up- stream events (launch tube fragments, diaphram pieces, etc. ). Further down- stream, the spherical model goes through the focused spot (15-mm diameter) of the 1 17 kilomegacycle (F-band) microwave station. After another foot of travel, the projectile arrives at the focused spot of the 35 kilomegacycle (K-band) microwave plasma diagnostic station. Electron density is measured at both stations
Two additional measurements are made at the end of the test section. These are the rotating mirror streak photographs and the spectra. The first of these provides a photographic measurement of the projectile velocity, establishes the absence (or presence) of debris in the wake, and indicates the extent of wake radiation (which results showed to be limited to a region within three diameters of the sphere) The spectra are used to check the purity of the gas samples used in the program. They showed only lines from cesium and
•3-
a: <i
it 2
*
_ a.
k N
r a o c
oS
C UJ
-I
3i Ji
L a: c1
o r
U1 UJ a O u o
u o
0-
>- i a. < a
a
a o
UJ
£ Ui ac u
I
< UJ o
a: o
2
UJ
LÜ
ti. o
2 O O
b i >-■
? o
<£
I-- <l a: Ui CL
3
I
IT,
s
en
t?
•4-
argon with the sole exception of the sodium resonance line. Rotating mirror streak and spectra measurements are discussed in appendix B. Finally, the projectile pierces the stainless steel exit diaphram and is ultimately disinte- grated in the steel plates of the arresting device. The theoretical model employed for analysis of the microwave measurements and the microwave apparatus, are described in detail in appendix C. These measurements were based on the low refractive index n, (o<n< 1. 0) of the highly ionized cylindrical plasma. Using a ray-tracing technique, it is snown in appendix C that the power of the signal received at the detecting horn is related to the refractive index (or equivilent electron density) in the plasma.
■5-
Ill EXPERIMENTAL MEASUREMENTS
The experimental program was carried out in a gaseous mixture of argon and cesium. This was necessitated by the fact that the highest usable oven temp- erature was limited to 260°C by the volatility of several teflon seals. This factor limited the maxxmum ceuium vepor pressure to 0. 7 torr. Calculations based on shock-tube measurements by Haught^ on the rate of ionization in argon-cesium mixtures indicated that for 5. 67-mm diameter spheres at 0. 7 torr the incubation time for ionization in the shock layer would exceed the residence time in the shock layer. Thus, it was necessary to dilute the cesium with an inert gas in ordei to increase the frequency of collisions in the shock layer.
The danger in the procedure was that (a) the argon might ionize and (b) with the higher argon density three-body recombination between a cesium ion. an electron and an Argovi atom might dominate the electron removal process.
Preliminary experiments were carried out in pure argon (16 electron volts ionization potential) (reference 13) at 50 torr. These demonstrated negligible wake ionization, Several higher velocity experiments were run subsequently. Again electron density in pure argon at 50 torr was observed to be negligible. However, experiments at 500 torr produced a significant ionization contri- bution from the argon. It was concluded that the experiments could be run at velocities up to 15, 000 ft/sec in argon at pressures up to 50 torr without contributions from the argon ionization.
Discharge tube measurements of electron-ion recombination in argon and neon plasmas have been made by KentyO4) at 3000°K, while Biondi and Brown^ 15), and Redfield and HoltOM (17) have reported measurements at 300"K. Their quoted recombination rates fitted, to within a factor of three, a three-body ion-electron-atom recombination rate of (3) (10"^) cc2/(particle)2/8ec
T "K
Under the conditions of the experiments carried out in the investigation re- ported here, this three-body mechanism would result in a second-order rate of 2(10"8) cc/elect, /sec. This rate is at least two order of magnitude faster than the radiative collision rates of reference (6) for cesium plasmas. Thus, the experimental measurements would readily demonstrate the effect of the Argon atoms on recombination rate. This effect will be discussed further in section V.
The 1 IT-kilomegacycle microwave probe detects plasma in the range iOl^ < ne- < 2 (1014) cc"l. The 35 kilomegacycle probe operates in the range lO1^ < n« - < 1013, These probes are separated by approximately one foot along the test section. The data from each probe is plotted on the same figure
-6-
for each run. This provides a contiguous record of the electron density-time history in the range cf electron densities from 2(10^) through 10^ cc"^ All the microwave data were reduced according to the calibration plots derived in appendix C. Approximately twenty runs were made, but many had to be rejected because the projectile trajectory deviated by more than a projectile radius from the focused spot of the microwave probe, or spurious particles were present in the wake On four runs the projectile impacted and damaged the test section.
Shown in figure 2 is a composite of the experimental data for the 0. I torr cesium shots The vertical bars on the experimeDtal graphs indicate the un- certainty in measurements. These uncertainties are discussed in appendix C This same figure also shows calculated electron density distributions. These were determined usin«, the nonequilibrium computing program described in appendix D. Two calculated curves are shown which correspond to upper and lower limits in the initial enthalpy assumption. This assumption is dis- cussed in appendix D.
It is interesting to note that the 10-percent variation in initial temperaiare in- herent in the upper and lower calculated limits did not cause significmt devia- tion in the electron density curves The calculated and experimental curves are very similar in shape but displaced by about a factor of two in absolute magnitude of the electron density.
Similar results were obtained for the 0. 6 torr cesium data shown in figure 3. Here, the calculated electron density is lower by approximately a factor of three from the data.
Since the computed electron density distribution is based on the theoretical recombination rates of reference (6), this agreement between experiment and calculation is indicative of agreement between experimental recombination rates and the theoretical values in reference (6). In the next section, the electron density data will be analyzed to determine recombination rates and these will be compared with values from reference (6).
10" f
pAR00N -50 TORR PCCSIUM =0 1 TORR ROUND 4-A I3,?00 FT/SEC
4-B 12,600 FT/SEC 4-C I 3,000 FT/SEC
800
6ä -9 391
Figure 2 VOLUME WAKE ELECTRON DENSITY AS A FUNCTION OF TIME (p,. - 0.10 TORR)
8-
z o H- u 2
<
Zd O w
O a. LLf ^.
<
6 > to
w
8>
.9iw\i
-9-
IV. DETERMINATION OF REACTION RATES
A. FLOW FIELD
In the chemical kinetic experiments being performed in this program, a small amount of cesium mixed with argon is heated to temperatures greater than 15, OOO'K in the shock layer of a hypersonic spherical projectile. In equilib- rium, the cesium would be completely ionized, while only 10 4 parts of the argon would be ionized. Thus, initially the cesium ions will dominate the ionized species. It may be expected that the cesium ions will dominate the nonequilibrium regions al: . Equilibrium ionization does not occur instan- taneously in the sho :k layer.
Several reactions may occur as the gas traverses the chock layer. These are:
A + A - A+ + e- + A RH)
A -. e- - A"1" + e" + e- R(2)
Cs + A * Cs+ 4 c- + A R^
Cs ^ Cs - Cs+ + e- + Cs R(4)
Cs + e- -. Cs* + e- + e- R(5)
Here A and A+ represent an argon molecule and ion; Cs and Cs+ indicate a cesium molecule and ion; e~ ie the symbol for an electron.
Reactions R{l}l R (3), and R (4) refer to atcm-atom collisions which result in the ionization of one of the atoms. Tue cross sections for these reactions are small compared with those for reactions R.{2) and R (5) resulting from electrun-atom collisions. However, since the atom concentrations are very large, ionization by atom-atom collisions dominate initially (except for reaction R(4) which, due to the small cesium concentration, may be neglected). When the electron concentration is within a few orders of magnitude of equilib- rium, electron-atom processes R( 2) and R (5) become dominant.
The preliminary experiments, reference (13), were carried out in velocities lower than 9500 ft/ser. Low levels of wake ionization (109 cc"*) were ob- served. This was attributed to failure of the cesium to achieve equilibrium ionization in the shock layer. This was overcome, in the set of experiments reported here, by increasing the sphere velocity to 13,000 ft/sec. This in- creased the shock layer temperature, and the wake electron density was ob- served to be in excess of 2 (I0i4) cc .
-10-
In the wake region, mixing of the high temperature core with the cool outer fluid caases the temperature to decrease. Recombination of electrons, pri- marily by the inverse of reaction (R5)1 is the mechanism by which the plasma adjufts to the lower temperature.
Inasmuch as the recombination reactions lake place in a turbulent wake, the reduction and interpretation of the experimental data require a theoretical model of such a nonequilibnum wake.
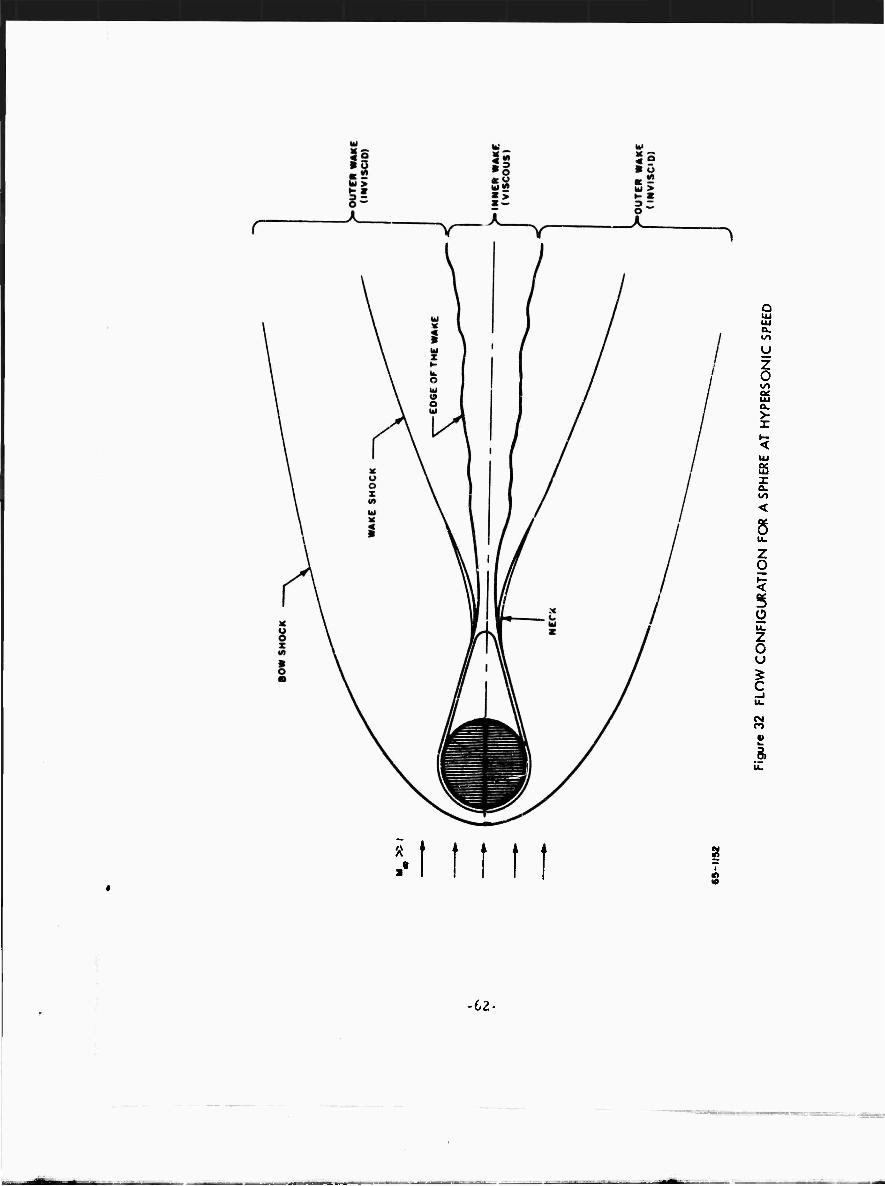
The wake produced uy a ballistic range model, moving at hypersonic speed through a fluid medium, is considered to be composed of inviscid and viscous portions. The outer wake is a region which spreads from the outer edge of the inner wake across the wake shock to the bow shock, and the inner wake is a strongly decelerated core portion of the flow behind the body. The viscous inner core initially becomes very hot because of the viscous heating in the boundary layer over the body surface and the recompression at the wake neck. The flow passing through the strong portion of the bow shock and coming into the outer inviscid region is also heated to high temperatures. Under this condition, ionization initially occurs in the vicinity of the model, and in the downstream (cooler) region of the wake, recombination will begin. It is the purpose of the present study to utilize the results of a turbulent wake-flow field analysis to interpret ballistics range experiments concerning the recombi- nation rate in a cesium-argon plasma.
To minimize the efforts ind the cost of the operation, and also to eliminate the effect ui ablation as well as the effect of the angle of attack, spheres havt been used as the testing models in the ballistic range experiments fo* the pr-ssei.t. study.
Unlike the wake behind a slender body, where the boundary conditions along the edge of the inner wake are uniform, the analysis of the wake behind a blunt body requires a careful treatment oi the swallowing of the hot inviscid outer wake by the viscous inner wake. Moreover, the pressure gradient terms appear- ing in the momentum and energy equations, which are usually neglected for a slender body case, must now be retained. The detailed analysis is described in appendix D.
B. EVALUATION OF ENVIRONMENTAL DATA
The agreement between calculated and measured magnitudes of the electron- density decay with time is reasonable, as seen from figures 2 and 3. How- ever, the recombination rate is proportional to the rate of change of the elec- tron density with time. In this regard, measurement and calculation differ markedly. Thus, it has been necessary to develop a procedure for determin- ation of the rate constants directly from the data. It is desirable to fit the data with a second order rate constant, since the experimental values will be com- pared with theoretical values, reference (6), which are tabulated in second- order form.
-11-
The rate of change of electron density in a plasma with only electrcn-ion recombination processes occuring is
2 (i)
where a is the second-order recombination rate in cc/elec*Ton/sec
The effect of diffusion was evaluated separately by calculating several frozen flow cases using the computing program described in appendix D. These calculations showed that diffusion produced a negligible electron density de- cay in the time interval of these measurements (t - lO"-* sec. ). Thus, it is satisfactory to account for the electron removal by only recombination pro- cesses.
Integration of this rate equation over the time interval from t to t yields
i l2
a (n _ , T) dt n _/ Vn _/ I e (2)
For a sufficiently small time interval, the recombination may be considered constant. Tien equation (2) becomes
n _ e 2
a(t2 - tj) (3)
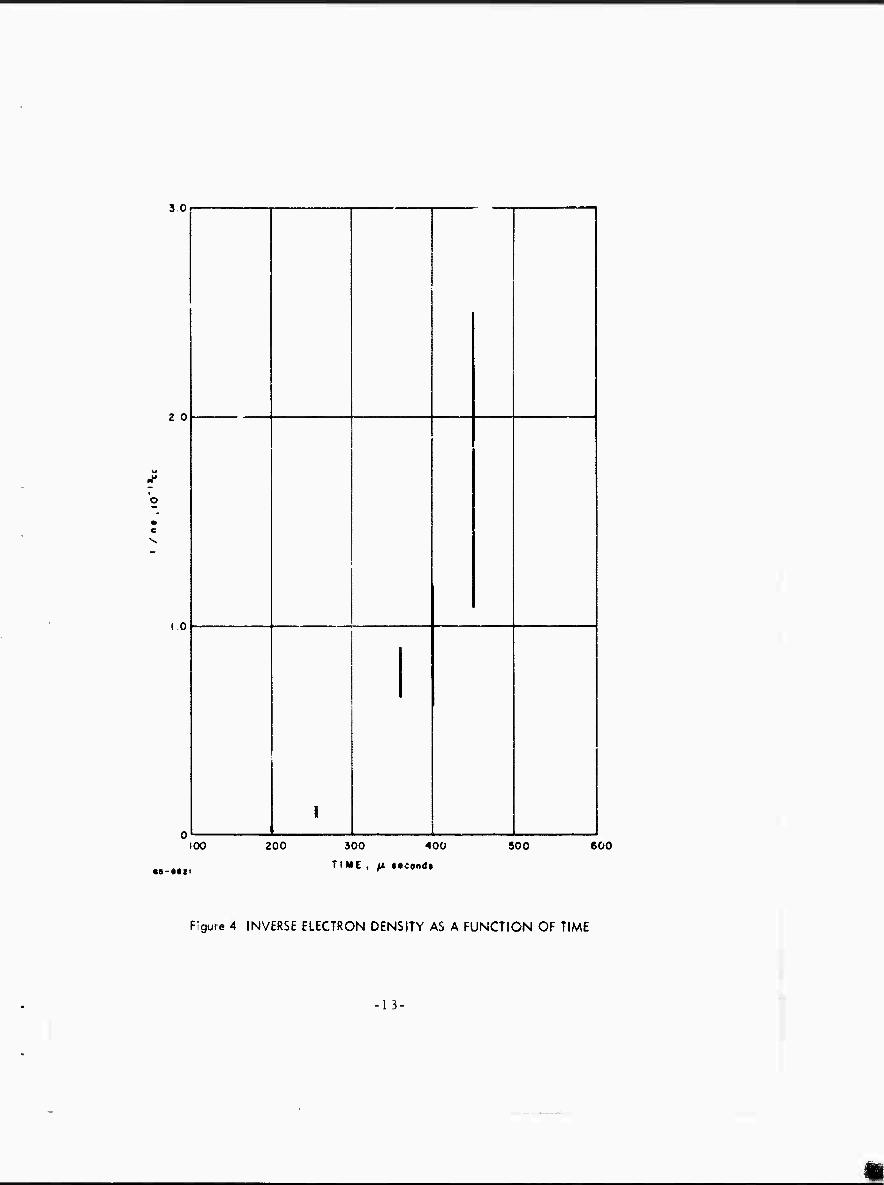
Values of a were aetermined from the experimental data using equation (3) after the data was replotted as inverse jctron density as a function of time. Such a plot is shown in figure 4. Uprer and lower limits for the rate constants were found by measuring the maximrm and minimum slopes through groups of
adjacent data points. An initial point I— , t. required to evaluate the
first measured electron density data point, was defined by an equilibrium wake flow field calculation. This was taken to be the most downstream wake loca- tion for which the cesium could remain completely ionized (T. = 5000° K). Be- yondtj, the calculated temperature and associated equilibrium electron density decay rapidly and nonequilibrium in the electron-ion reactions causes the electron density to persist at higher than equilibrium levels. It is only in this
region 'hat equation (3) is valid. The calculated initial points are!—j =10
cc/electron, t. - 20Ö microseconds for 0. 1 torr = p (—1 , _ ,„-16 i cesium; V n / =1.7 10
cc/electron, t^ = ^00 microseconds for 0. 6 torr = Pcesiam
-12-
3 0
2 0
o
c
10
1
100 200
•«-•flit
300 400
TIME , fi. ««eondt
900 600
Figure 4 INVERSE ELECTRON DENSITY AS A FUNCTION OF TIME
13-
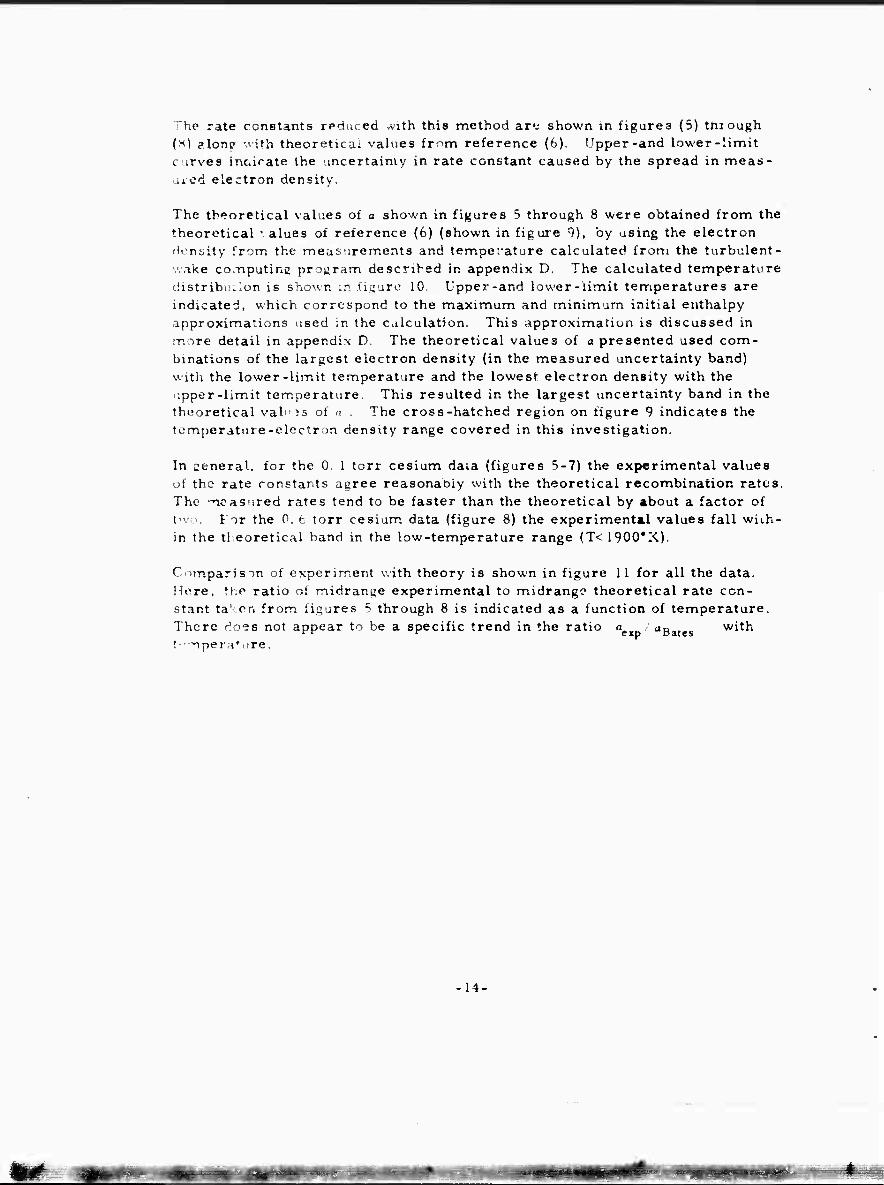
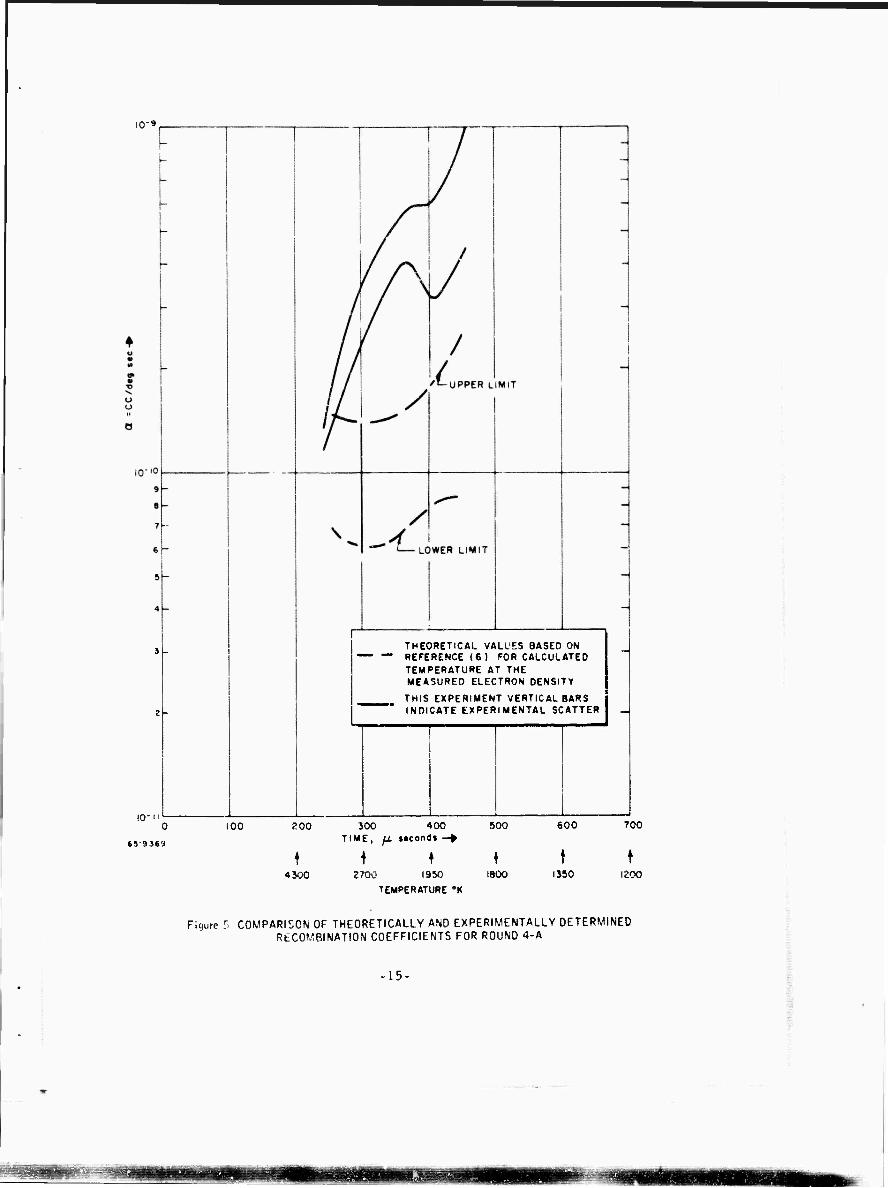
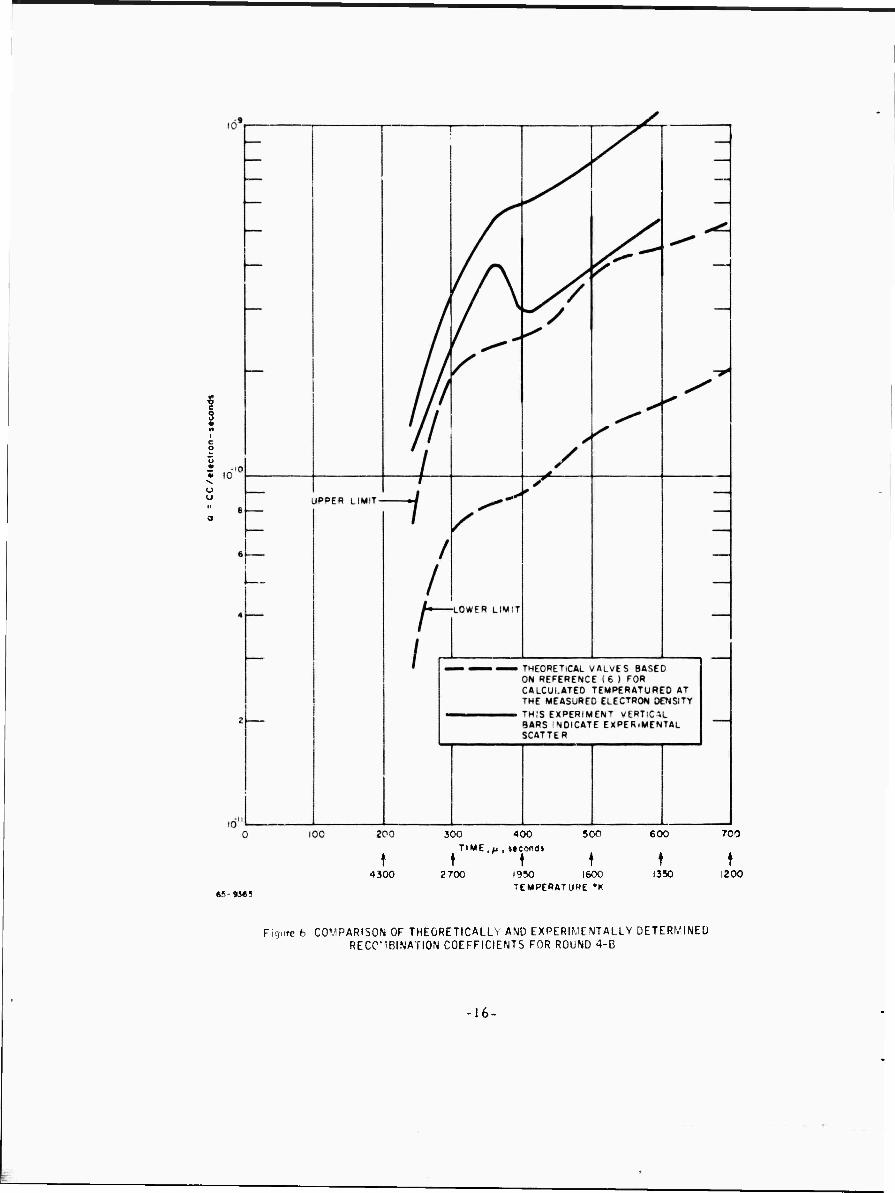
The rate constants reduced .vith this method arv shown in figures (5) thtough (H) ?.lonp with theoretical values from reference (6). Upper-and lower-limit curves incirate the uncertainly in rate constant caused by the spread in meas- uied electron density,
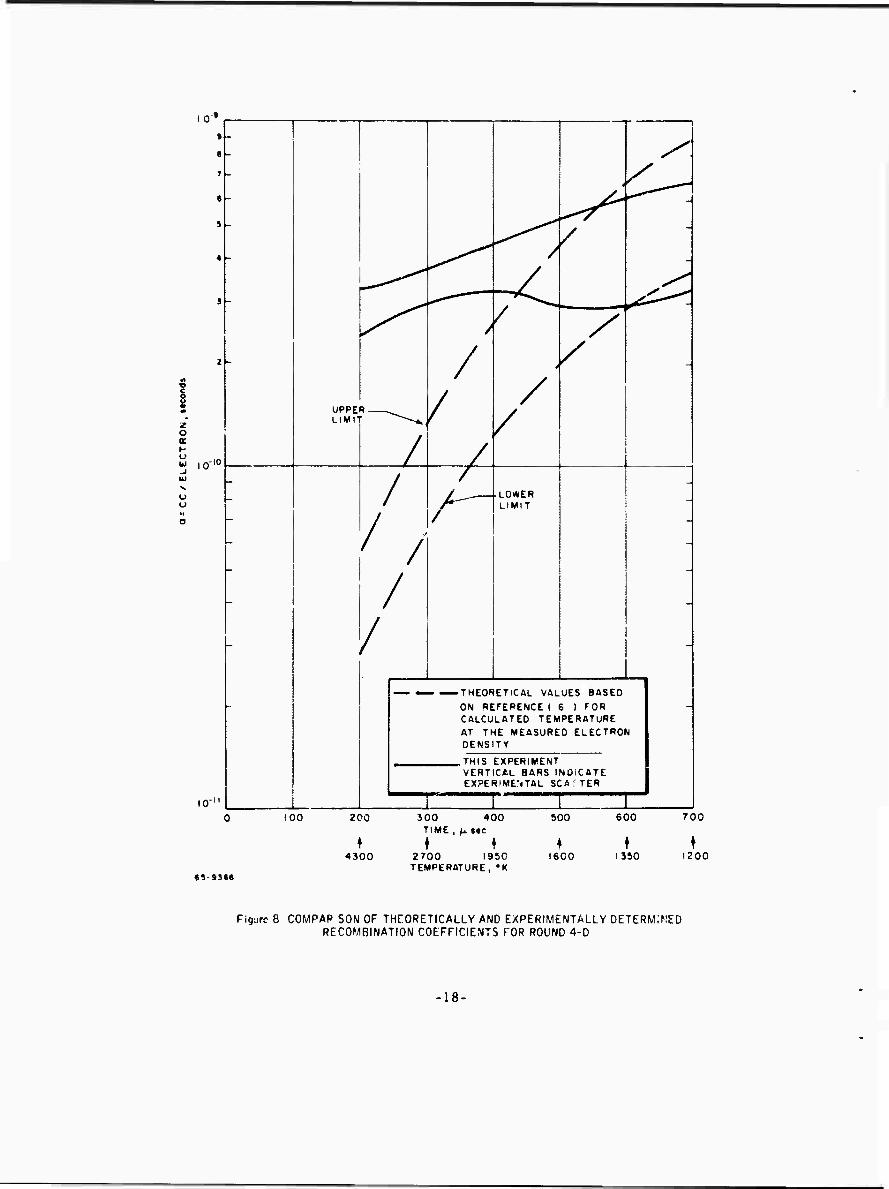
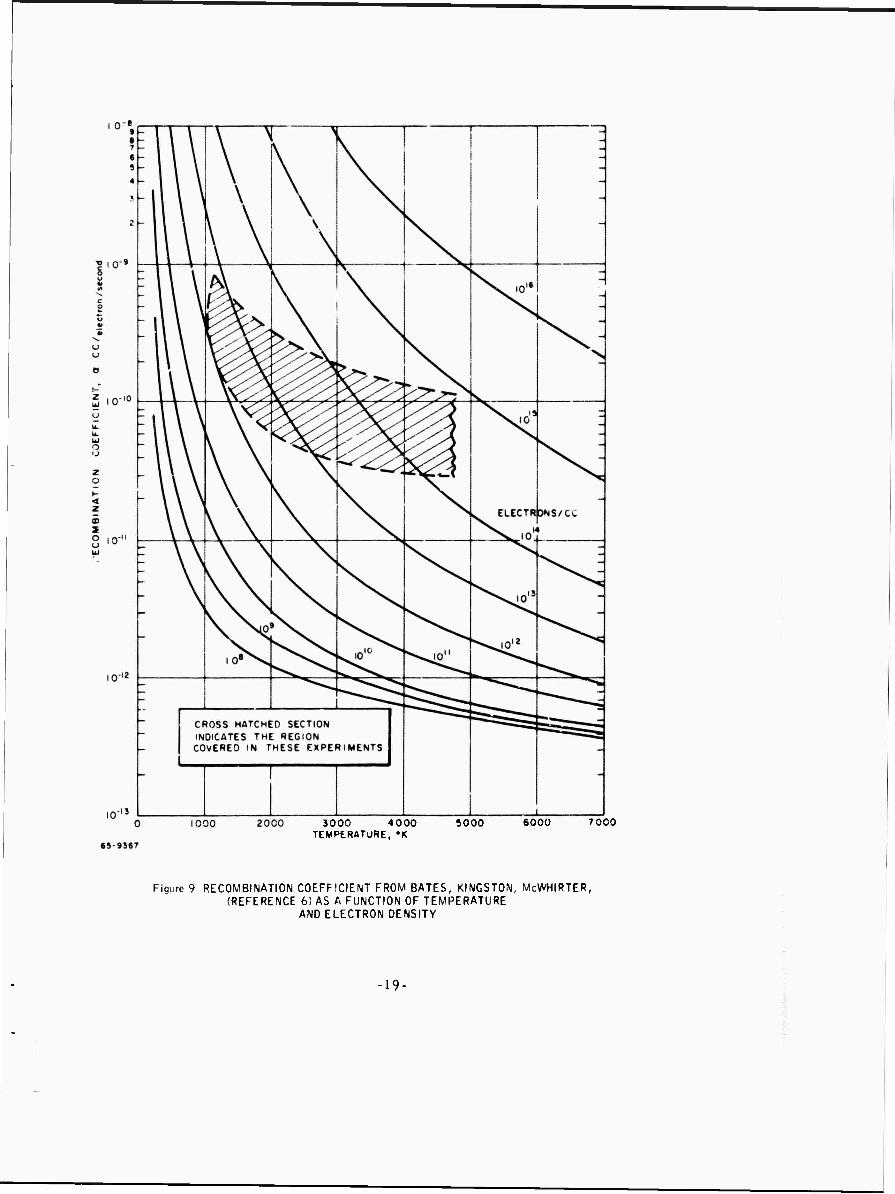
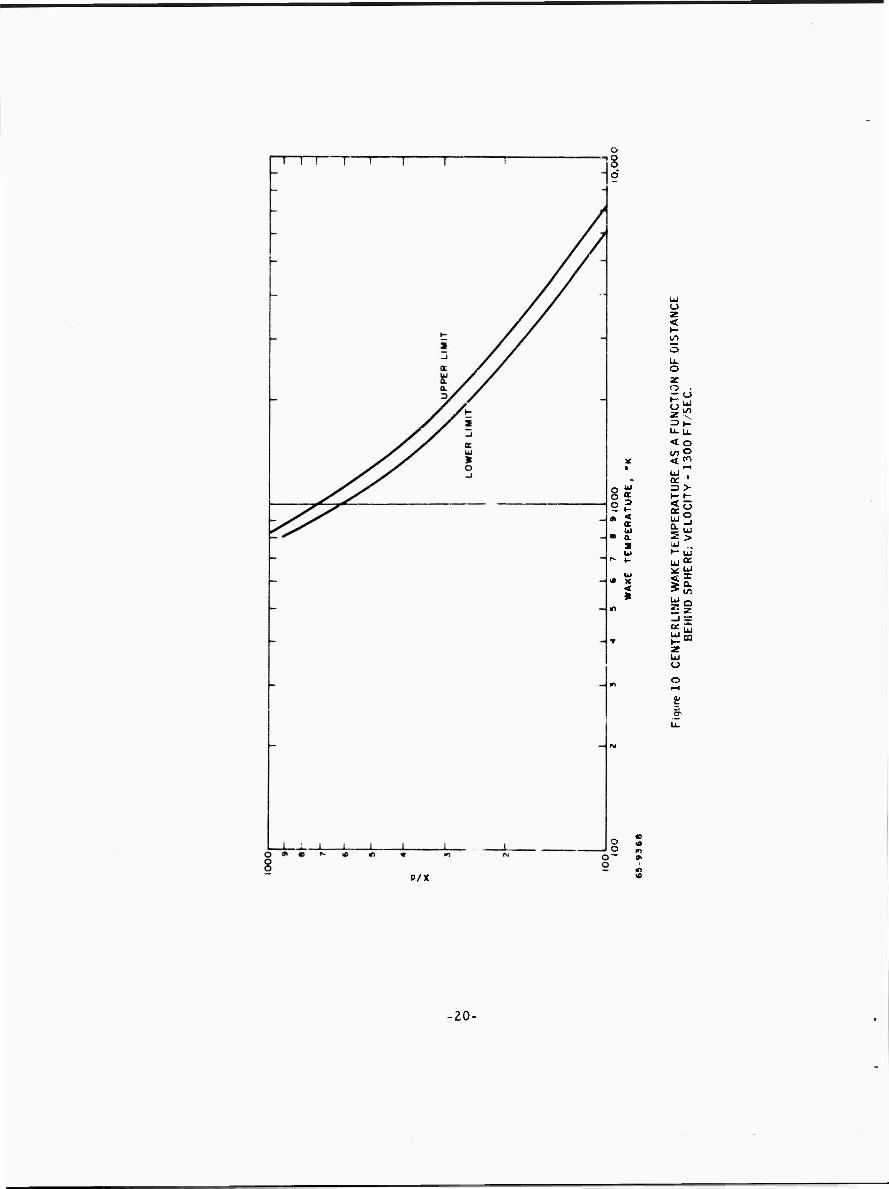
The theoretical values of a shown in figures 5 through 8 were obtained from the theoretical •. alues of reference (6) (shown in figure 9), by using the electron density from the measurements and temperature calculated from the turbulent- wake computing program described in appendix D. The calculated temperature distribiivlon is shown in figure 10, üpper-and lower-limit temperatures are indicated, which correspond to the maximum and minimum initial enthalpy approximations used in the calculation. This approximation is discussed in more detail in appendix D. The theoretical values of a presented used com- binations of the largest electron density (in the measured uncertainty band) with the lower-limit temperature and the lowest, electron density with the upper-limit temperature. This resulted in the largest uncertainty band in the theoretical values of « . The cross-hatched region on figure 9 indicates the temperature-electron density range covered in this investigation.
In general, for the 0. 1 torr cesium data (figures 5-7) the experimental values of the rate constants agree reasonably with the theoretical recombination rates. The measured rates tend to be faster than the theoretical by about a factor of two. For the 0. 6 torr cesium data (figure 8) the experimental values fall wiih- in the theoretical band in the low-temperature range (T< ^OO'X).
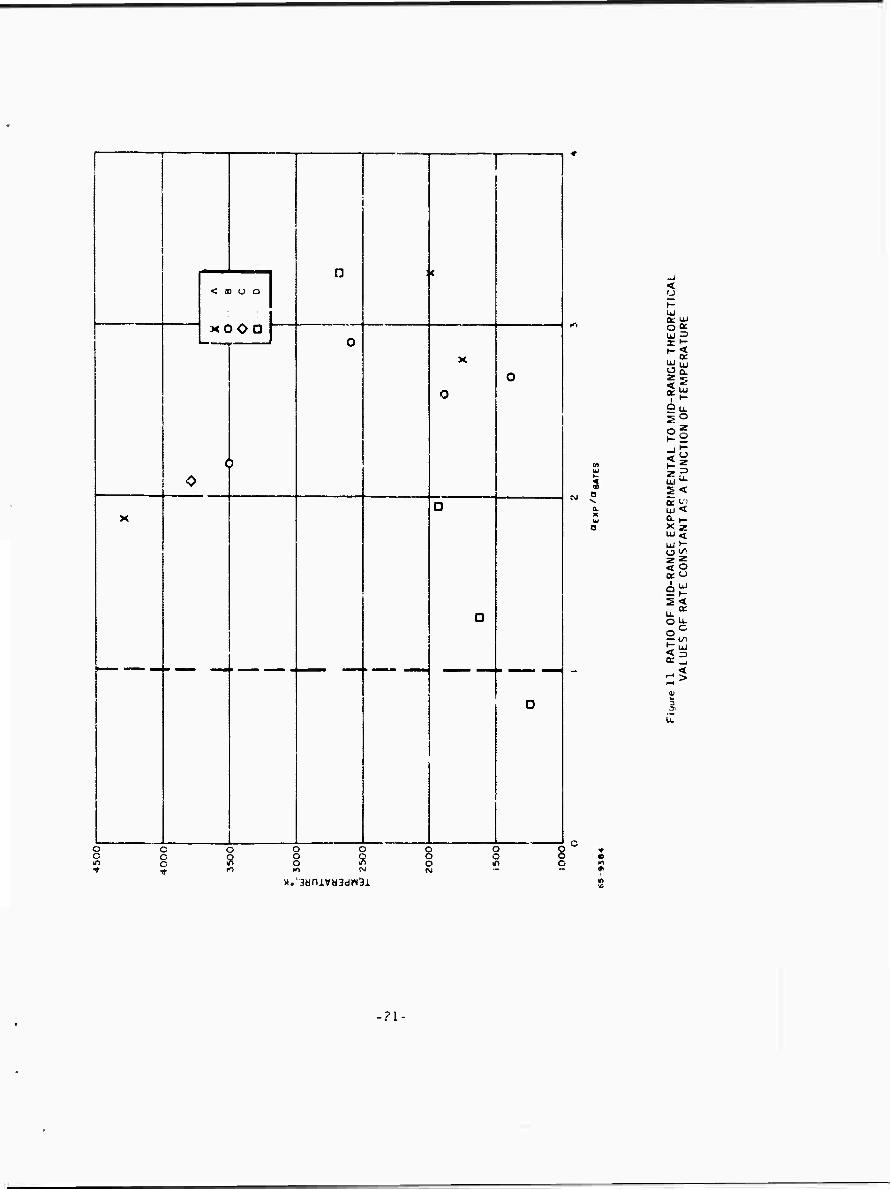
Comparis-m of experiment with theory is shown in figure 11 for all the data. Hore, the ratio of midrance experimental to midrange theoretical rate con- stant taken from, figures 5 through 8 is indicated as a function of temperature. There does not appear to be a specific trend in the ratio aexD/««Bates with t'-mperattire.
14-
IQ"«,
IQ- ll'— 0
659369
THEORETICAL VALL'ES BASED ON REFERENCE (6) FOR CALCULATED TEMPERATURE AT THE MEASURED ELECTRON DENSITY
THIS EXPERIMENT VERTICAL BARS INDICATE EXPERIMENTAL SCATTER
100 200 300 400 TIME , fJ. »«cond» —f
500 600 700
t * 1 ♦ t t 300 2700 1950
TEMPERATURE *K
leoo 1350 1200
Figure r. COMPARISON OF THEORETICALLY AND EXPERIMENTALLY DETERMINED RtCOMBINATION COEFFICIENTS FOR ROUND 4-A
-15-
4300
6? 93«!
300 400 500
TIME ^ »»cond»
t 2 700 1950 1600
TEMPERATURE "K
t 1350
700
i20O
Figure 6 COMPARISON OF THEORETICALLY AND EXPERIMENTALLY DETERMINED RECOMBINATION COEFFICIENTS FOR ROUND 4-B
-16-
10'
u -I LJ
o u
10 X \
N.^/
\
/
^- LTPER LIMI
A- LOWER LIMIT
.J /
THEORETICAL VALUES BASED ON REFEMENCE (6 ) FOR CALCULATED TEMPERATURE AT THE MEASURED ELECTRON DENSITY
, THIS EXPERIMENT VERTICAL BARS INDICATE EXPERIMENTAL SCATTER
100 ZOO
♦ 4J00
500 TIME,
♦ 2 TOO
400
fi, Mcondt
500
1950 1600
TEMPERATURE**
600
t 1350
700
t 1200
65-9J70
Figure 7 COMPARISON OF THEORETICALLY AND EXPERIMENTALLY DETERMINED RECOMBINATION COEFFICIENTS FOR ROUND 4-C
17-
9
1 _ A r
e
- y^X 5
- ^
^7 /
\
5
y^ • / ^
/ ^\
2 - /
i / A
1 m z" o
UPPE LIMIT
R -^ / /
/ K
/ / J l0
w
u o
: /
/ -LOWER LIMIT
A
»1
a
-
/
/
\
- / -J
— ^THEORETICAL VALUES BASED
ON REFERENCE ( 6 ) FOR CALCULATED TEMPERATURE AT THE MEASURED ELECTRON DENSITT
Tm<l EXPERIMENT VERT CAL BARS INDICATE EXPERIMENTAL SCfi'TEH J
lO"" l l 100 200
4300
«S-93SS
3 00 400 500 TIME, K>ec
t ♦ S 2700 1950 !600 TEMPERATURE,'K
600
f 1350
roo
1200
Figure 8 COMPAP SON OF THCORETICALLY AND EXPERIMENTALLY DETERMINED RECOMBINATION COEFFICIENTS FOR ROUND 4-D
18-
3000 4000 TEMPERATURE, »K
6000 7000
Figure 9 RECOMBINATION COEFFICIENT FROM BATES, KINGSTON, McWHIRTER, (REFERENCE 6) AS A FUNCTION OF TEMPERATURE
AND ELECTRON DENSITY
19-
uJ O z < t- m O u. o z o .
§1 =>l- U-U.
<o U)0
X <^ • - ö: '
O U 3> o ft t- t- o 91
3 i- 4 C u a. IS » y ., u t-ui K
v; UJ * < <n
» ^9
z Ui
5T1
P/X
-20-
< 31 U O
KOOO
o o in t
D < u
Su. 5°
w • 5< a- fl Ui < a. f- X ?• UI < Ui t- (T (^ i» ^ < O a u a UI
l-- 5< rr u. O u O
c in
H MI < -> tt
< >
o o o *
o o o o rfl o Kl Kl
o s
x.'3aniv«3d«3i
o o o
o o in
8
-?i-
V. SUMMARY
The results of an experimental determination of electron-cesium ion recombin- ation rate have been presented. The cesium was ionized thermally by tho bow shock wave uf a spherical proiectile travelling 13, 000 feet per second. In the wake turbulent wave behind the sphere, the plasma decays, since the temperature decreases rapidly and recombination becomes important. The recombination rate was determined from the measured wake electron density decrease wih time. F-band and Ka-band focused microwave probes were used in this measurement. The electron density distribution was in reasonable agreement with calculations from a nonequilibrium turbulent wake computing program. Similarly, the recombination rates obtained from the electron density-time data were in agreement with the theoretical values of Bat^s, Kingston, and McWhirter based on collisional radiative recombination. Values of the re- combination rate constant were determined ranging from 1. 3 (10" 10)cc/elect/ sec at a temperature and electron density of 3400°K and 1. 4 (lO1^) elect
-10 12 CC
respectively to (8. 0) 10 cc/elect/sec at 1250oK and 2 (10 ) elect/cc. The rate constant was approximately twice of the Bates value throughout. The temperatures used were calculated values from the wake program.
The microwave and ballistic range equipment and techniques used in these ex- periments are discussed in deta 1 in the appendixes to this report.
-22-
VI. REFERENCES
1. Mohler, F. L. , Bu. Stand. J. Res. 19, 447(1937).
2. Dandurand, P. and R. B. Holt, Electron Density and Light Intensity Decay in Cesium Afterglows, Phys. Rev. 82, 278(1951).
3. Wada, J. Y. and R. C. Knechtli, Generation and Application of Highly Ionized Quiescent Cesium Plasma in Steady State, I. R. E. Proceedings (Dec. 1961).
4. D'Angelo, N. and N. Rynn. Phys. Fluids. 4, 1303(1962),
5. King, I. R. , Recombination Rates of Alkali Metal Ions, J Chem. Phys. 36, 553 (1962).
6. Bates, D. R. , A. E, Kingston, and R. W. P. McWhirter, RecombineiUci- Between Electrons and Atomic Ions. (I) Optically Thin Plasmas. Proc. Royal Soc. , 267, 297(1962).
7. D'Angelo, N, Phys, Rev. 121, 505(1961).
8. Byron, S. , R. C. Stabler, and P. I. Bortz, Electron-Ion Recombination by Collisional and Radiative Processes. Phys. Rev. Letter? 8, 376 (1961).
9. Hinnov, E. and J. G. , Hirschberg, Electron-Ion Recombination in Dense Plasmas, Phys, Rev., 125, 795(1962).
10. Pobben. F. . W. B. Kunkel, and L. , Talbot, Spectro^copic St'idy of Electron Recombination with Monatonic Ions in a Helium Plasma, Phys. Rev. , 132, 2363 (1963).
11. Haught. A., Phys. of Fluids, S. 1337(1962).
12. Handbook at the American Institute of Physics, 2nd Edition.
13. Eckerman, J. , Effect of the Kinetics of Contaminants on Wave loniza,- tion, Avco RAD-SR-05-18 (January 1965).
14. Kenty, C. , The Recombination of Argon Ions and Electrons, Phye Rev. , 32. 624 (1928).
15. Biondi, M. A. and S, C. Brown, Measurement of Electron-Ion Recombin- ation, Phys. Rev., 76. 1697(1949).
■23-
' V Redfield, A. and R. B. Holt, Electron Removal in Argon After Glows, Phvs. Rev. , 82, 874 (1951).
17. Holt, R. B. , J. M. Richardson, B. Howland, and B. T. McClure, Recombination Spectrum and Electron Density Measurements in Neon Afterflowe, Phys. Rev. 11, 23Q (1950).
-24-
APPENDIXES
A. THE CHEMICAL KINETICS BALLISTICS RANGE
B. OPTICAL MEASUREMENTS
C. MICROWAVE MEASUREMENTS
D. THEORE1ICAL TURBULENT WAKE ANALYSIS WITH ELECTRON-ION RECOMBINATION
-25-

APPENDIX A
THE CHEMICAL KINETICS BALLISTICS RANGE
The experimental invistigation has been carried out in a ballistic range designed for chemical kinetic studies. As such it contains many innovations in design as compared to conventional range facilities, and its operation requires applica- tion of new techniques. The design and operation of this facility is described in the appendix.
1. DESCRIPTION OF FACILITY
The facility is composed of a light gas gun for Irunching the model, a blast tank for absorbing the gun blast, a test section, and an arresting device for stopping the projectile. A axillary equipment includes a light screen for measuring the projectile velocity and necessary instrumentation to make experimental meas- urements. The instrumentation and its use is described in some detail in appendixes D and C.
The test section in which the measurements a.r'i made consists of a pyrex glass- pipe range tube in which the atmosphere and pressure are controlled, and is surrounded by a temperature-controlled oven. Additional equipment consists of a vacuum system for exhausting the test chamber and the range, a gas infec- tion system for injecting high-purity gase ■ into the test chamber, and an ampoule crusher for introducing high-purity metal vapors into the test chamber.
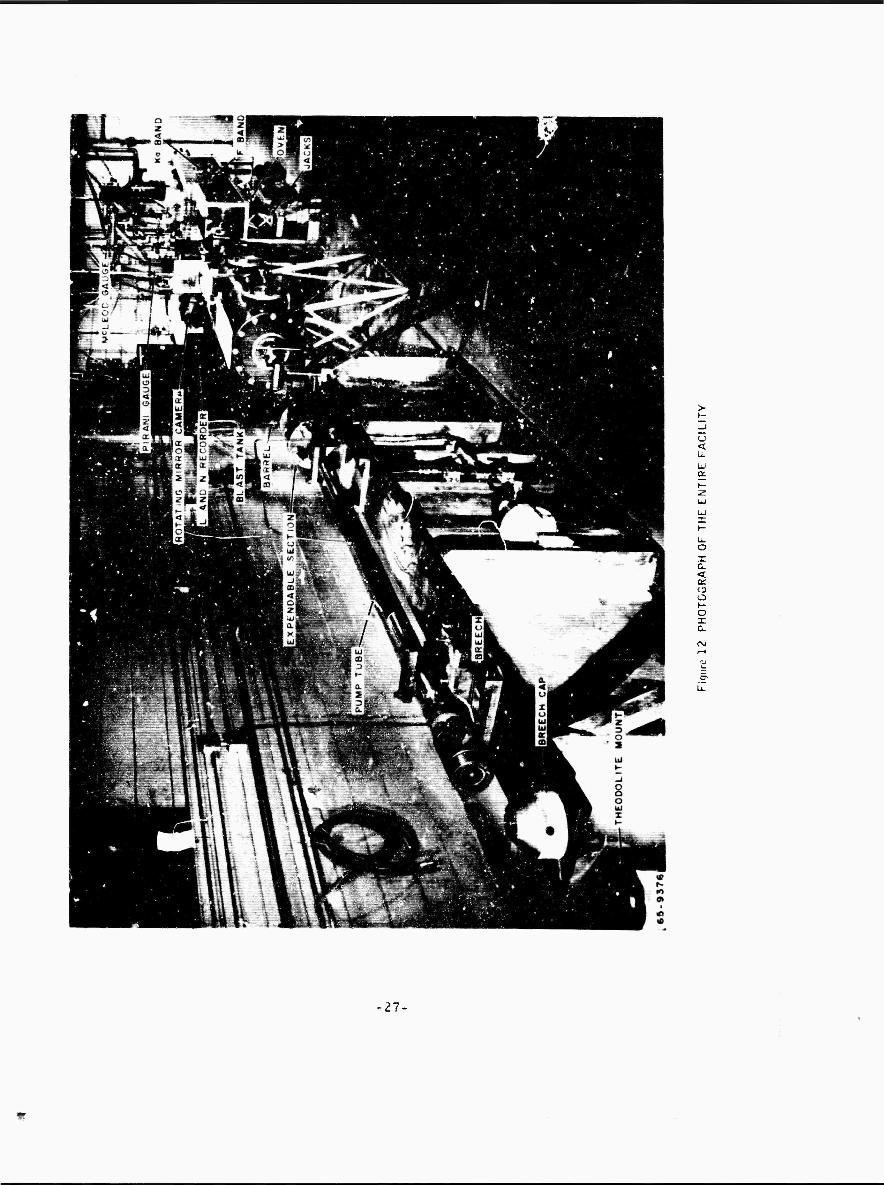
A photograph of the entire facility is shown in figure 12. The individual com- ponents are described in detail in the following praagraphs.
a. Light-Gas L. icher, Blast Tank, and Arresting Device
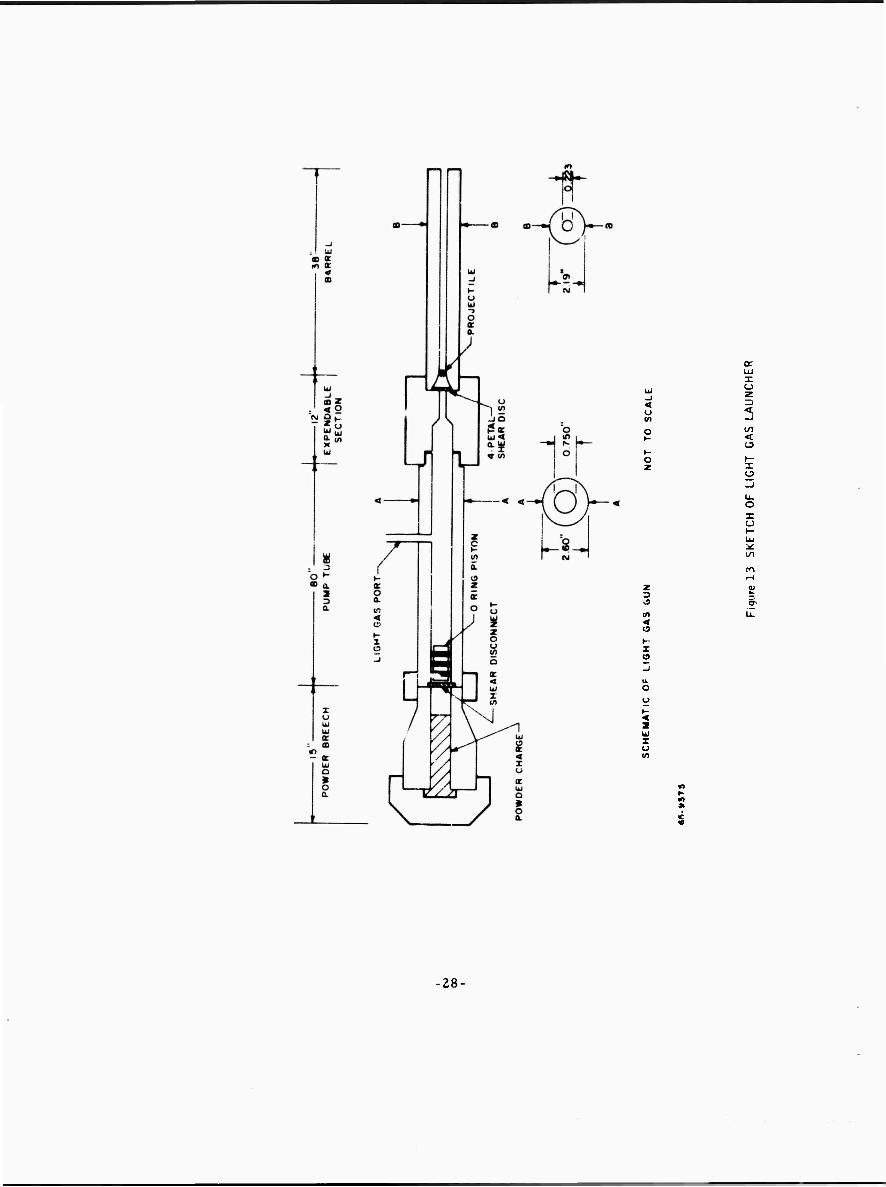
The light-gas launcher (figure 13) is a two-stage ballistic launching device which uses gunpowder to drive an aluminum piston into the first-stage pump tube which is filled with a light gas such as hydrogen or helium, under a pressure of 500 psi. The piston compresses the gas, which in turn ruptures a shear disc at the entrance to a second-stage barrel that contains a bore- size spherical projectile. The gas propels the projectile through the barrel and into the test ange. Velocities up to 15, 000 fps are thus attained, using type 440 stainless steel spheres. An expendable section with a con- stricted bore is employed between the two stages to trap the piston.
The circular steel four-petal shear disc has two transverse serrations which begin to rupture cleanly at their intersection and then fold forward into a crrved conical section at the breech of the second-stage barrel. This technique was developed to prevent pieces of the shear disc from con- taminating the experiment. The projectile is held by friction fit at the
-?.6-
>
o •a.
X
a < cr o o t- o X c
-11-
_i < o in
z
.3
< I- X o
o u
I o tn
X
<
(- X o
X
-28-

exit of the conicaJ section, until it is dislodged by the pressure pulse from the ruptured shear disc.
The blast (absorbing) tank, shown in figure I, is a six-foot long cylinder with a diameter of eighteen inches.
The projectile arresting device 's a lb-inch length of 8-inch diameter pipe coupled to the end of the test chamber by glass pipe. It contains a series of increasing thickness steel plates, backed by 1-inch armor plate. A 0.035-inch aluminum plate is placed foremost to determine the point of projectile impact to be used as a check on the projectile trajectory align- ment.
b. Light Screens
Two light screens, spaced three feet apart, are mounted on quad- ruple-port aluminum couplings. They are of the dark-fiald type, where a tungsten light source is projected through the projectile flight path, to a low-reflectance mat on the opposite side of the range test section. A photomultiplier tube is directed at th^ mat and receives a light pulse only by reflection from the passing projectile. The light screen signals are used to start and stop an Events Per Unit Time counter and to trigger the operation of the microwave apparatus,
c. Environmental Test Section
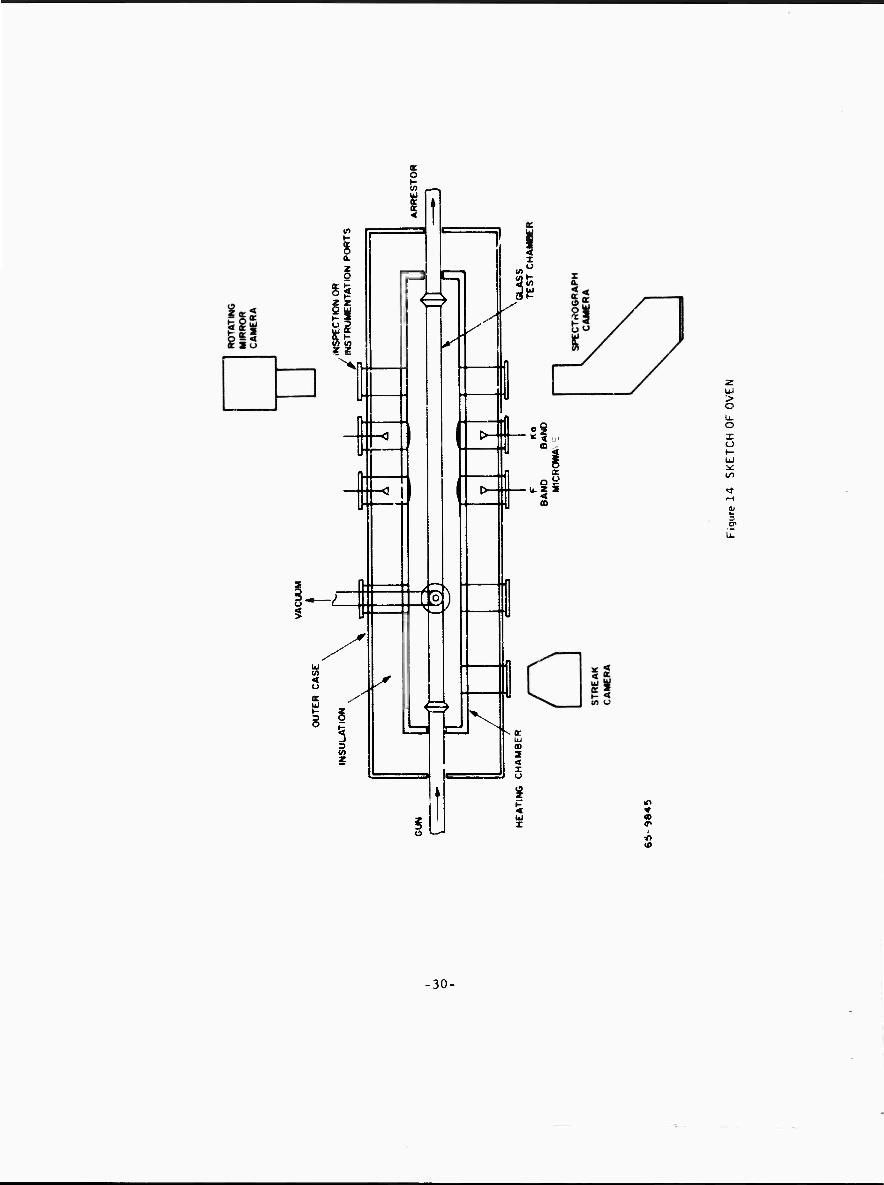
The test chamber is a Pyrex glass tube 1-1/^-inch diameter by 108 inch long, through which the projectile is fired. It is separated from the r st of the range by diaphragms placed at each end. A 5/4-inch by 16-inch verti- cal glass pipe stem is located near one end of the Pyrex pipe to permit evacuation and for insertion of test gases. The stem is coupled to the vacuum system by a glass stopcock. A fixture on the stem provides the means for crushing a glass ampoule in vacuo, thereby permitting the injection of suitable materials into the test chamber. Heating of the ampoule crusher, stopcock, and vertical stem by electrical heating tap.?s is necessary to prevent cesium condensation in these parts which protrude from the oven.
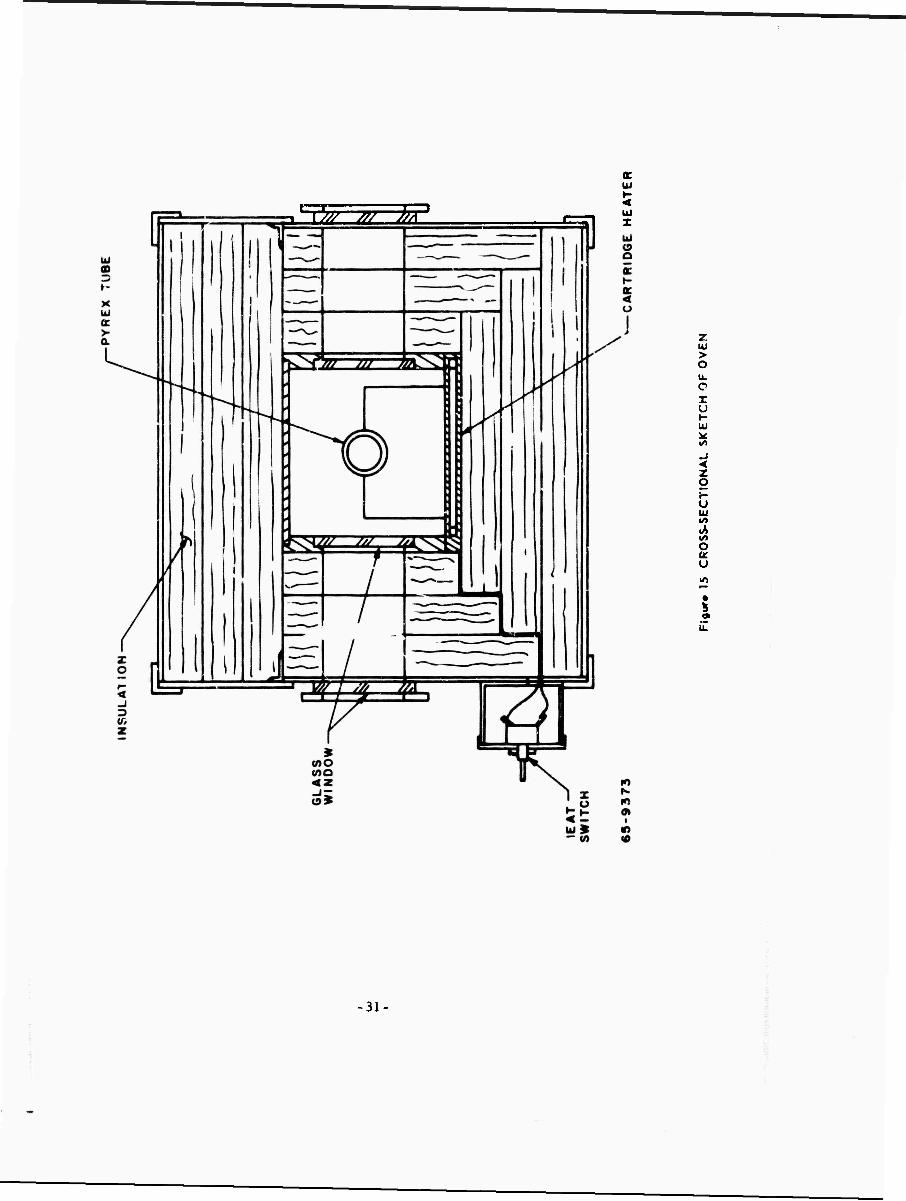
The oven, figure (14), is a 130-inch long reinforced case with a 23-inch square cross-section, and is made of 1/4-inch shftet aluminum. It encloses an 8-iiich square cross section heating chamber made of 1-inch thick aluminum plate, (^ee figure 15.) The opace between the two is filled with fiberglass insulation. The heating chamber rests on 6 inches of Marinite slab insulation. A removable 6-inch thick insulated cover serves to close both the heating chamber and case. The entire ove-\ is mounted on two screw jacks which serve to raise, and lower it (figures 16 and 17). In the lowered position,v/ork may proceed unhampered on the glass test chamber.
•29-
K o ISi UJ I
»- % a. z o
% -. in Z Z
"All
I
m
O C
3
^
M
i i
lie
F5i. .ü.2 Z
> o u. o i o
OD
2 < I o
UJ I
in
30-
V \>// /// fa
r. > o
o I u
Z o
«/»
O U
-31
u. o x a. < a: U o >~ o X a.
32-
Q UJ Oi UJ
ä o
UJ > o
X Q. < a u o I- o X a.
33-
The one-inch thick bottom plate of the heating chamber lias 20Chromalox heating elements spaced evenly along its length. Thesi elements are installed in holes bored transversely through the plate. Initial heating of the elements causes them to expand and contact tue wal'.s of their holes, thereby increasing heat conduction. The total powei consumption of the 20 elements is 7000 watts. The elements are paired by means of switches to provide 10 heat zones. Ezrh pair of elements has three heat positions, HIGH, LOW, and OFF, corresponding to i50 watts, 175 wattr,, and 0 per e'Jment. This permits the maintenance of various temperature gmdients along the heating chamber. Thermal pumping of the medium within the test chamber ma> then take place. Oven temperature may be controlled from ambient to 300oC. Oven-temperature protection is provided by a detector imbedded in the bottom, plate and another inside the oven proper. Heat-up time from ambient to lOO'C is approximately 2 hours. Tempera- ture uniformity (to * 2 C*) is established in an addiiional hour. Along the sides of the oven and in line with the glass test chamber are four pairs of double-glassed ports and one single port. These may be used for visual inspection of the range or for instrumenation. The inner glas; ports are of Pyrex. The outer ports are selected plate glass, Chromel-Alumel thermocouples, a reference cold junction, and a Leeds and Northrup recorder are used to monitor temperatures.
The vacuum system is in two sections. The first section is a mechanical pump for evacuating the blast tank, pump tube, projectile arresting device, and range piping exclusive of the test chamber. The second section used to (evacuate) the test chamber, consists of a mechanical roughing pump, three-stage oil diffusion pump, and cold traps. The test chamber is separated from the rest of the range by 0.005-inch stainless steel diaphrams just inside the ends oi the oven.
Independent operation of the mechanical pumps permits evacuation of the range proper and test chamber, so that a minimum pressure differential exists across the frangile diaphragms. Viton O rings are used as inter- face glass-to-glass seals, A large ground-glass ball joint is used to inter- connect the oil diffusion pump and the liquid Nitrogen cold trap. All vacuum components are readily demountable for cleaning, A minimum of vacuum grease is used. A Wallace and Tiernan absolute pressure gauge is used to indicate range pressure, A Coons diaphragm vacuum gauge is used to indicate rough test chamber pressure. A Pirani thermal conductivity gauge and a McLeod gauge are used to indicate test chamber pressure. A thermocuple vacuum gauge is used to indicate roughing pump pressure.
The ampoule crusher is an ovvoen-free high-conductivity copper tube with a screw jack at one end and a range coupling adapter at the other. Glass heating tape is used to elevate its temperature. A glass ampoule of the correct material is inserted in the crusher when assembling the range. At the appropriate time, the screw jack is activated, thereby crushing the glass
•34-
ampoule, and permitting the material )t contains to drop down into the test chamber.
Z. EXPERIMENTAL TECHNIQUE
It is essential that the projectile oe fired through 'he center of the glass test chamber within ± i mm. To do this, the barrel is aligned on a paper target by means of a theodolite. A powder breech is then affixed to the barrel and a bore size Zelox projectile is fired at 4000 fps velocity. Corrections in barrel orientation are made until it is shooting centrally.
Th'j barrel is then cleaned and the remainder of the light gas gun is assembled to the barrel without changing varrel orientation. This condition is verified by means of four dial indicators which are in contact with the barrel. Soft copper washers are used to sial all interfaces of the light gas gun.
The ends of the Pyrex chamber are fitted with stainless steel diaphragms and Teflon gaskets. The chamber is coupled to the range at both ends with spring- loaded flanges, which allow for any thermal expansion as well as for any Teflon flow at elevated temperatures. The range piping outside the oven is fitted with Teflon expansion bellows to allow lor longitudinal expansion of the test chamber, as well as, minor manufacturing variations in tubing length.
Several different diaphragm materials were tested to find the most suitable one. Some materials were subject to premature rupture due to the corrosive Teflon sheet overlays and Teflonized aluminum were also tr'ed. These materials did not corrode; however, the presence of carbon lines in the slit spectrograph indicated that contamination by vaporizing Teflon was taking place. Ultimately, stainless steel diaphragms of 0.0005-inch thickness were employed.
An additional contaminant was discovered in the reaction of Silicone stopcock grease with cesium. A stainless steel bellows valve with Viton seals was tried in place of the greased stopcock. Failuve of the Viton when maintained a» 200oC for prolonged periods forced its removal from the system. Ultimately, the problem was alleviated by returning to the glass stopcock and carefully wiping out the excess grease after the stop cock plug had been inst ved and seated. In the low-temperature glass piping external to the oven, it was found that Viton O rings formed a better vacuum seal than the Teflon gaskets normally used with the commerical flanges.
The cesium vapor is introduced into the test chamber from a Z. 5-gram ampoule of cesium. The ampoule is placed ir the crusher and yealed with a piston, located at the end of the screw, which contains two Viton O rings. The ampoule must be free of all labeling substances to avoid introducing contaminant into the system.
-35-
A rough vacuum is drawn on the test chamber and range simultaneously, ?ad the system is checked for leaks. A minimum pressure differential is maintained across the diaphragms.
When the test chamber pressure is 100 microns of less, the three-stag^ oil diffusion pump is activated. After attaining a further decrease in pressure to b microns or less, the liquid nitrogen traps are filled. A mass spectrometer is thtr: employed to detect any remaining leaks in the test chamber. A satis- factory condition is attained when the leak rate is l.ss than 1 micron per minute, without cryogenic or oil diffusion pumps operating.
The lower portion of the oven is then elevated to enclose the test chamber, ?nd the oven lids are put in place. Marinite collars are used to support the test chamber in the oven. A two-piece cupola is ujed to enclose the vertical range stem. Glass-asbestos heating tape is wound about the ampoule crusher assembly and range stopcock. The oven and the heating tapes are turned on. Temperatures of both oven and heating tape are indicated by Chromel-Alumel thermocouples.
Reagent grade argon is injected into the test chamber to a pressure of 5 torr gauge for one minute, after which the chamber is again evacuated. This serves to flush thn chamber.
After a final check ot the leak rate, the test chamber stopcock is closed and the ampoule crusher activated. The cesium drops into the test chamber, forming a small pool in the r xnge pipe. The minimum amount of cesiurn required to conduct the experiment is 0. 01 grams. The ampoule contains 2. 50 grams, thereby assuring a sufficient quantity of cesium in the test chamber. The cesium will coat the inner walls of the test chamber. The partial pressure of cesiwn is not measured directly, but is determined from the vapor pressure temperature table {reference 1Z), the temperatur? being measured by the six Chromel-Alumel thermocouples located along the test section,
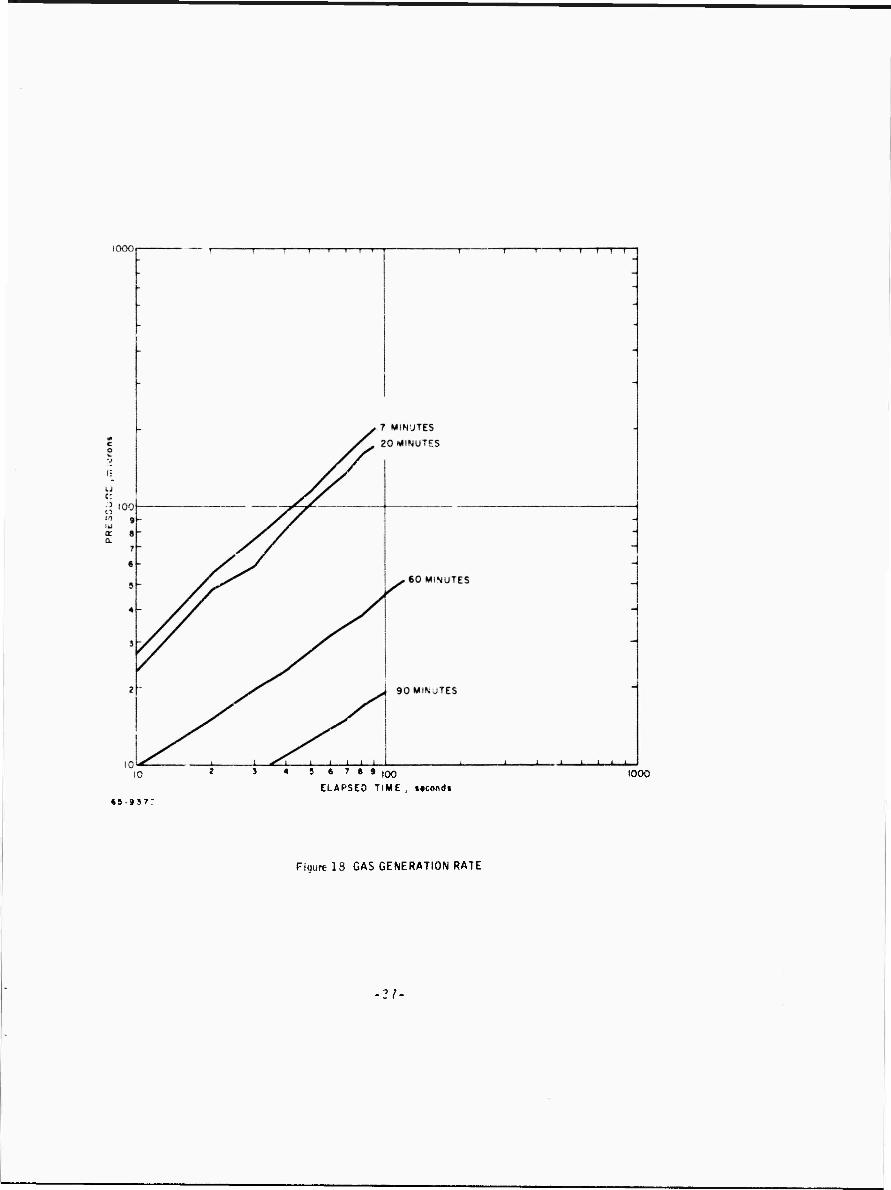
Tüllowing the car urn injection, and at periods of 7 minutes, 20 minutes, 1 hour, and at l~hour intervals thereafter, a check is made to determine the impurity gas generation rate caused by reaction of some cesium with impurities in the system. To determint the gaa gene-ation rateat each of these times, the test section is evacuted. The higu vacuum system stopcock is then shuv off and the test chamber stopcock is opened, leaving the test clumber connected to the Piram gauge. The pressure reading is noted, and a series of readings taken at 10-second intervals foi 1-1/2-minute period. This series of readings, figure 18, constitute the gas generation ra«v, and are indicative of the mpuri- ties remaining in the system. The test chamber heating cycle is continued until the impurity is less than 100 micronj at the two-minute check peiiod.
The vacuum system stopcock is closed, sealing off the test chamber and gauges. Keagsnt g. ^de argon is injected to the d< sired pressure, five minutes are
-36-
10
«5337:
5 6 7 8 9 ,00
ELAPSED TIME
1000 ««cnndt
Figure IS GAS GENERATION RATE
21-
allowed for the argon to diffuse throughout the chamber. The range is charged with sufficient air to reduce the pressure differential across the diaphragms to less than 1 torr gauge.
At this point the proper gf d mixture, pressure, and temperature have been established in the test chamber. The projectile may now be fired and the data recorded.
•38.
APPENDIX B
OPTICAL MEASUREMENTS
1. ROTATL-IÜ MIRROR STREAK PHOTOGRAPH
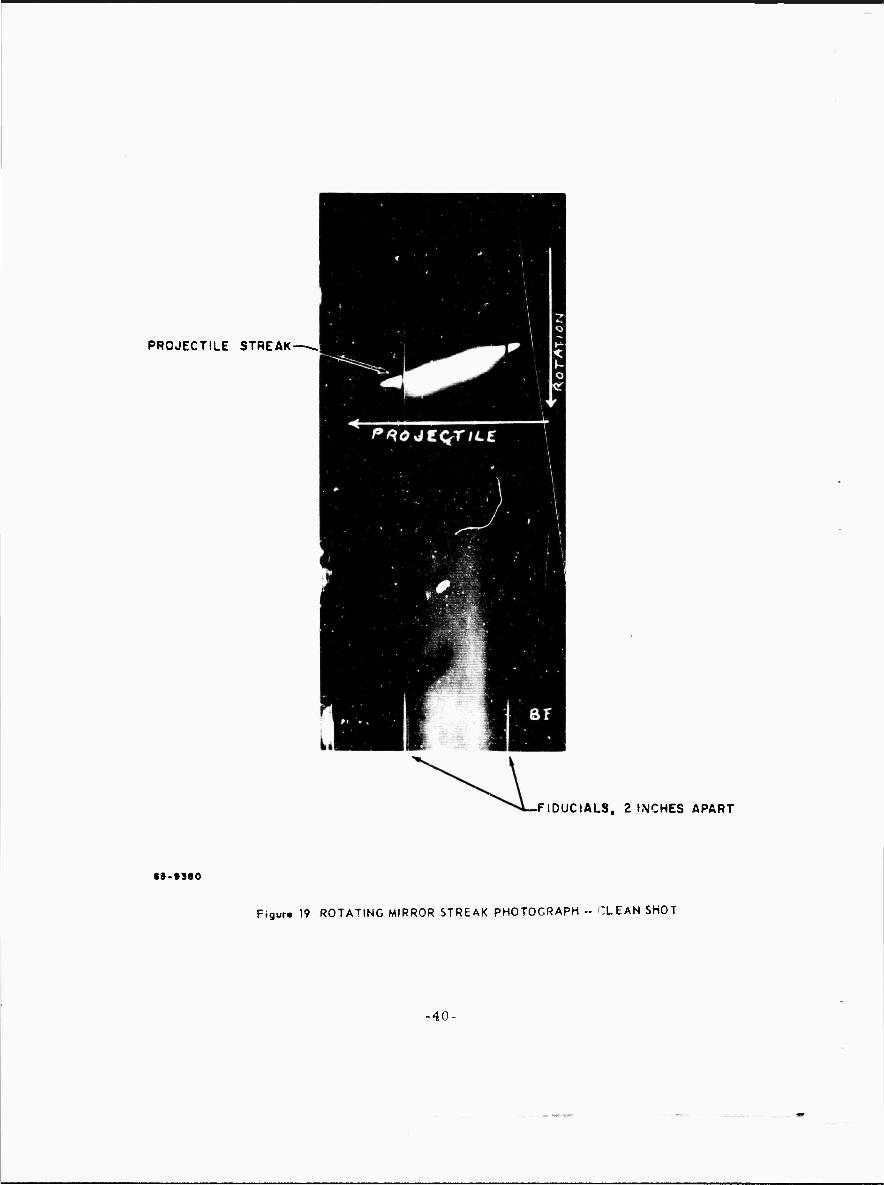
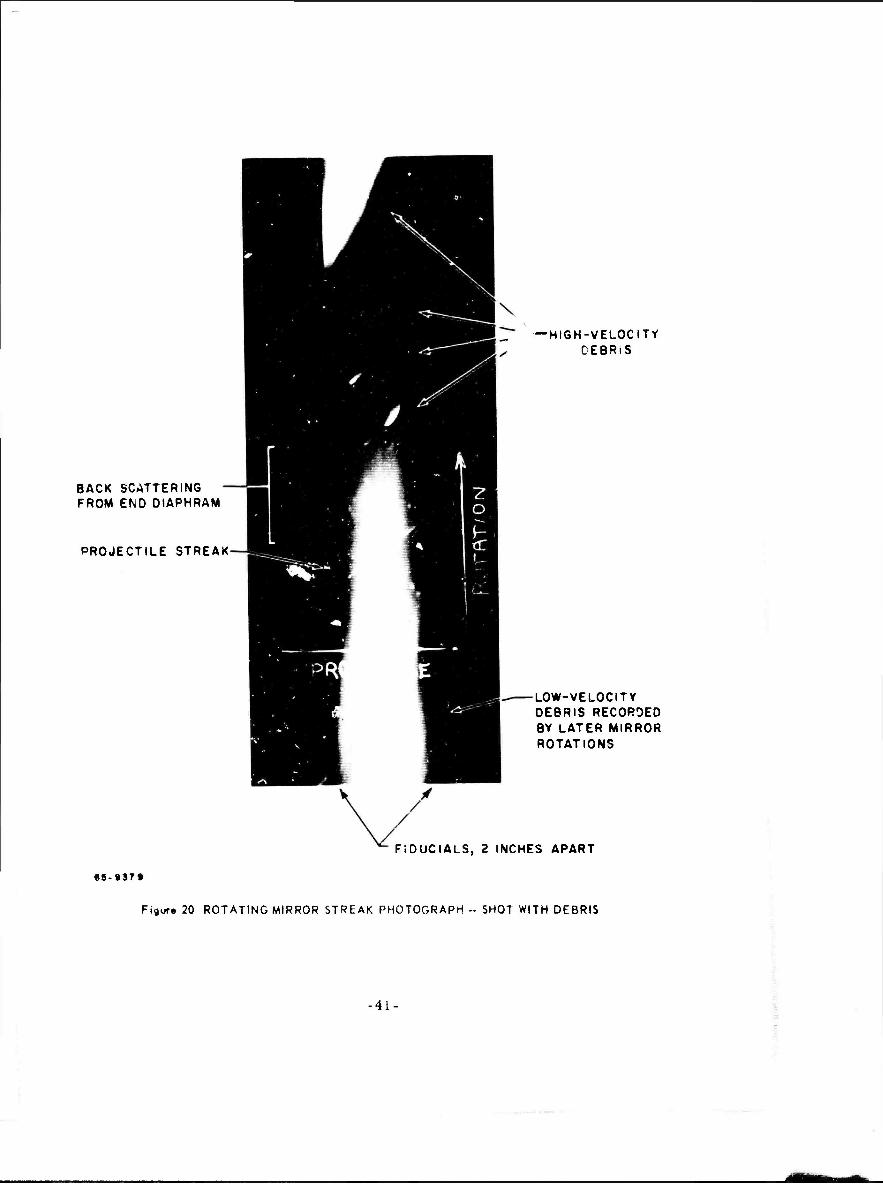
An Avco Mode1 MC300-1 rotating mirror camera io used to record the possible presence of debris, such as diaphram or shear disc fragments which may follow the projectile down the range. The appearance of any such fragments would signify the presence of impurities and hence, invalidate ihe data ccilected on the test firing. Also, the camera provides a check on the projectile velocity measurement made from the light screens. Figure 19 showns a debris-.ree test firing, while figure 20 showns a test firing which has debris.
In operation the camera receives an image from the object source and sweeps the image by means of a rotating mirror onto fast emulsio.i film strips. The resulting trace presents a direct position versus time record of the events being studied. This camera utilizes a magnetic tachometer to accurately measure the rotational speed of the mirror, which in turn determines the writing speed.
2. OPTICAL SPECTA
Primary interest in the optical spectral was the application cesium line broaden- ing (Stark effect* to measure electron density optically. Since the Stark con- stants for cesium lines have veen evaluated by Criem^, this technique offered a useful comparison to the microwave diajnosticg. This theory shows that even for the most sensitive lines, line widths must be resolved to approximately one Angstrom for determination of electron densities of 1C . cm"-'. This resolu- tion was obtainable vvith available spectrographs.
A preliminary test was conducted to see if the intensity of the cesium spectra was sufficient to obtain spectra with an f6 time-resolved Tropel spectrograph. The results of these measurements showed that the intensity was not sufficient to obtain an exposure.
Spectral data were obtained with a transmission grating spectrograph, however, this spectrograph is non-time resolving; i.e., it integrates all the radiation from the projectile and its wake. The increased exposure levels obtained through the use of a wide slit (500 microns) allowed spectral data to be recorded at the expense of spectral resolution. Table U shows the relative intensities of spectral lines for four test firings in the facility. A considerable enhancement of the cesium spectrum is shown when the cesium pressure is increased from CO to 0.7 torr. Figure 21 shows some of the spectra taken by the spectrograph. While these spectra were interesting, they were inadequate as a backup electron density determination. • (-Tifm. H. R , I'h,mj Spectroscopy. V)cC.raw-Hill, New York (l%i).
-39-
PROJECTILE STREAK-
F1DUCIALS, 2 INCHES APART
«ä-9580
Figur« 19 ROTATING MIRROR STREAK PHOTOGRAPH - CLEAN SHOT
-40-
BACK SCATTERING FROM END OIAPHRAM
PROJECTILE STREAK
— HIGH-VELOCITY CEBRiS
-LOW-VELOCITY DEBRIS RECORDED BY LATER MIRROR ROTATIONS
FIDUCIALS. 2 INCHES APART
«9-9379
FiSur« 20 ROTATING MIRROR STREAK PHOTOGRAPH - SHOT WITH DEBRIS
-41-
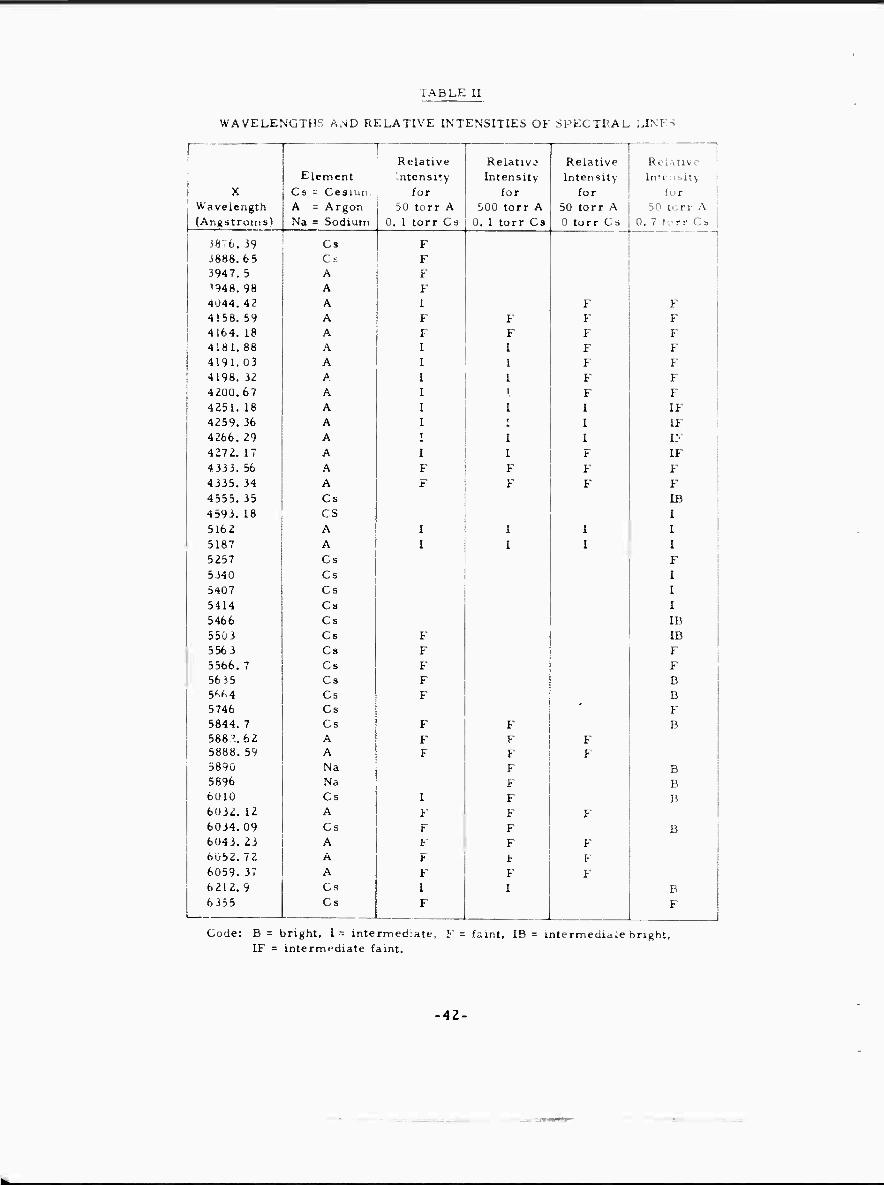
TABLE II
WAVELENGTHS AND RELATIVE INTENSITIES OF SPECTRAL LINES
Code: B= bright, I- intermed.-^te, F= faint, IB = intermediate bright, IF = intermediate faint.
-42-
f ■■ r Relative Relative Relative Relative
Element intensity Intensity Intensity Imeuaity X Cs = Cesiun for for for for
Wavelength A = Argon 50 torr A 500 torr A 50 torr A 50 tcrr A (Angstroms) Na = Sodium 0. 1 torr Cs 0. 1 torr Cs 0 torr Cs 0. 7 torr Cs
3876. 39 Cs F
3888.65 Cs F 3947. 5 A F ^948.98 A F
4044.42 A I F F 4158.59 A F F F F 4164. 18 A F F F F 4181. 88 A I I F F
4191. 03 A I I F F 4196. 3^ A I I F F 4Z00.b7 A I i F F 4251. 18 A I I 1 IF
4259. 36 A 1 T 1 iF
4266.29 A T I I iy
4272, 17 A I I F IF
4333. 56 A F F F F 4335.34 A F F F F
4555. 35 Cs IB
4593. 18 CS I 516 2 A I 1 I I 5187 A I I I I 5257 Cs F
5340 Cs I
5407 Cs I
5414 Cs I
5466 Cs IB 5503 Cs F IB 556 3 Cs F F
5566.7 Cs F F 56 35 Cs F B 5AM Cs F B 5746 Cs '
F 5844.7 Cs F F B 588?. 62 A F F F 5888. 59 A F F F 589Ö Na F B 5896 Na F B 6010 Cs I F B 6032. 12 A F F F 6034. 09 Cs F F B 6043. 23 A F F F 6052. 72 A F i F 6059. 37 A F F F 6212,9 Cs I I B 6355 Cs F F

3500 4000 4500 5000 5500 6000 6500A
4-20 SO MM ARGON 200C I5P00 "'l«C
C$A A AA C,AC» CJC, t I I ' !
3500 4000 4500 5000 5500 6000 6500 A
4-9 50 MM ARGON 0 1 MM Cs 200 0C 12,600 fV,.c
c»c. C, C,0» (?C^tNac< q, C,
3500 4000 4500 5000 5500 6000 6500A
4-23 50 MM ARGON 0.7 MMC« 2650C
65-9378
Figure 21 TIME INTEGRATED SPECTRA
-43-
APPENDIX C
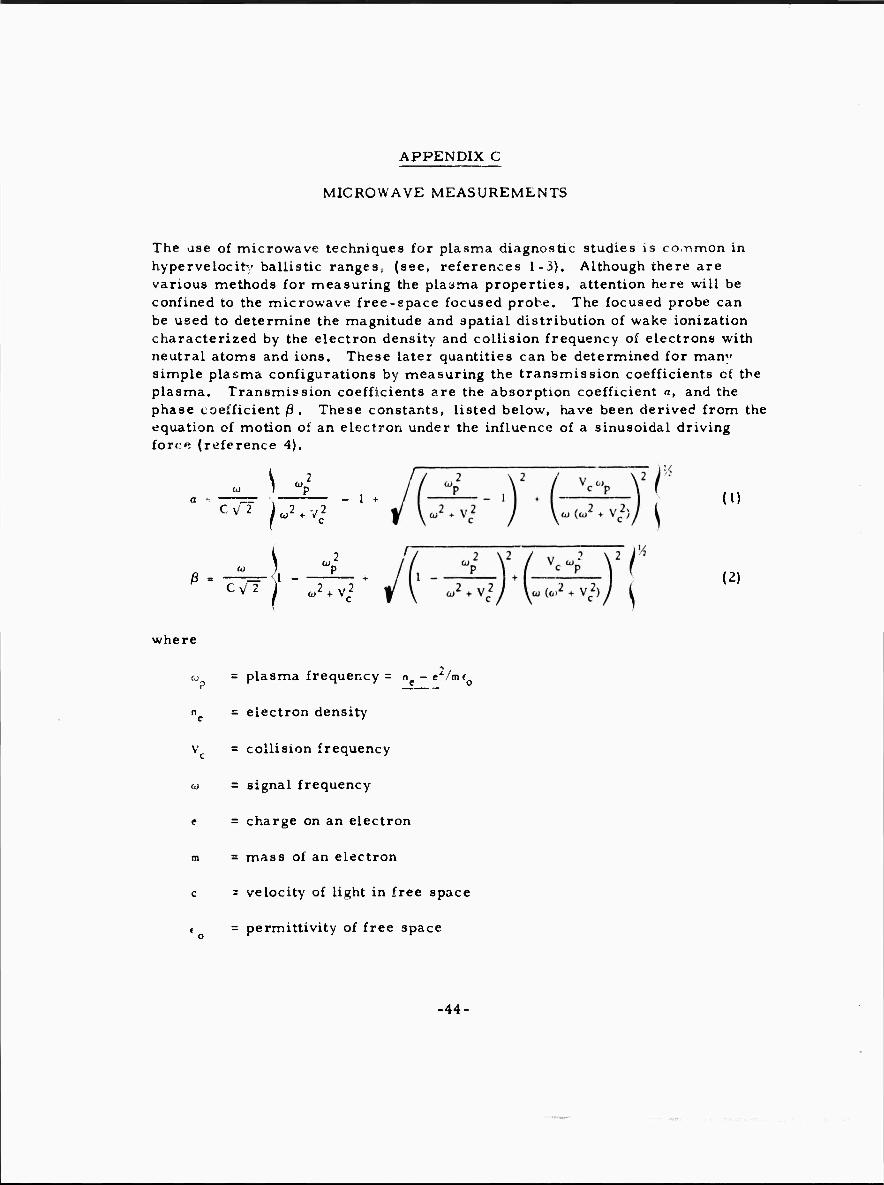
MICROWAVE MEASUREMENTS
The use of microwave techniques for plasma diagnostic studies is co.-nmon in hypervelocity ballistic ranges, (see, references 1-3). Although there are various methods for measuring the plaama properties, attention here will be confined to the microwave free-space focused probe. The focused probe can be used to determine the magnitude and spatial distribution of wake ionization characterized by the electron density and collision frequency of electrons with neutral atoms and ions. These later quantities can be determined for man" simple plasma configurations by measuring the transmission coefficients of the plasma. Transmission coefficients are the absorption coefficient a, and the phase coefficient/9 . These constants, listed below, have been derived from the equation of motion of an electron under the influence of a sinusoidal driving force (reference 4).
\ -t CV2 ifJ*w2
where
H \
*Vc
I (JL)^ + V^
(I)
ß'^rn-ib* -/ii--^M-^-ri ) (2)
w = plasma frequency = n - e'/mi
nc = electron density
V = collision frequency
oi = signal frequency
e - charge on an electron
m = mass of an electron
c = velocity of light in free space
f = permittivity of free space
■44-
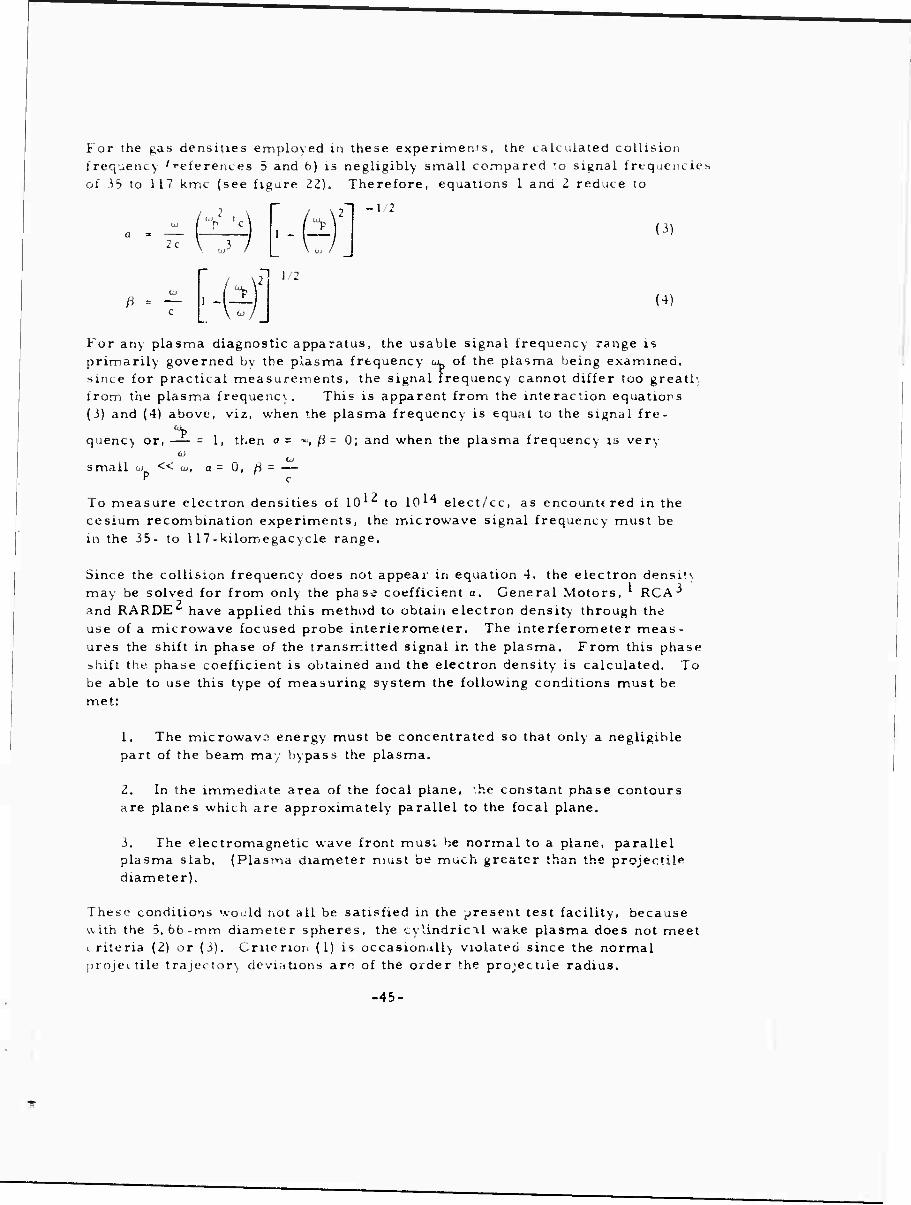
For the gas densities employed in these experimen's, the calculated collision frequency ''■eferences 5 and 6) is negligibly small compared "o signal frequencies of 35 to 117 kmc (see figare iZ), Therefore, equations I and 2 reduce to
-1/2
ß = — c -•)
1 -
n 12 "t
(3)
(4)
For any plasma diagnostic apparatus, the usable signal frequency range is primarily governed by the plasma frequency C^L of the plasma being examined, since for practical measurements, the signal frequency cannot differ too grealh from! the plasma frequency. This is apparent from the interaction equations (i) and (4) above, viz, when the plasma frequency is equal to the signal fre-
quency or, - I, then a - ■», ß-Q; and when the plasma frequency is ver\
small oi << OJ, 0, ß = — c
To measure electron densities of 10 to 10*^ elect/cc, as encountt red in the cesium recombination experiments, the microwave signal frequency must be in the 35- to 1 17-kilomegacycle range.
Since the collision frequency does not appear in equation 4. the electron density may be solved for from only the phase coefficient a. General Motors, RCA-^ and RARDE'- have applied this method to obtain electron density through the use of a microwave focused probe interferometer. The interferometer meas- ures the shift in phase of the transmitted signal in the plasma. From this phase shift the phase coefficient is obtained and the electron density is calculated. To be able to use this type of measuring system the following conditions must be met:
1. The microwave energy must be concentrated so that only a negligible part of the beam may bypass the plasma,
2. In the immediate area of the focal plane, '.he constant phase contours are planes which are approximately parallel to the focal plane.
3. The electromagnetic wave front must be normal to a plane, parallel plasma slab. (Plasma diameter must be much greater than the projectile diameter).
These conditions would not all be satisfied in the ^resent test facility, because with the 5, bb-mm diameter spheres, the cylindrical wake plasma does not meet i riteria (2) or (3). Criterion (I) is occasionally violated since the normal projectile trajectory deviations are of the order ^he projecuie radius.
-45-
i-rrrrr-T—i 1 ' i n i i i i i
at <
»1 ' o
h u O
mil 1 -r ■ -r -
u o -t o Ul «
| s N
EL
EC
TR
ON
-NE
UT
RA
L A
TC
4000
«K
5
0 m
m
AR
OO
N
il l 1.1 1 1 1 1 11 1 1 1 1 1 1 i i i i i i i i 1
2y u z w ZI o Ul K u.
o
O
o Z o t— u z D
> u Z
u. Z zS 2z ^2 0 —l et
Ö G utü
o 1 z
o
• •*•«* V
i-3j 'i.iiSN30 NOMisata
-46-
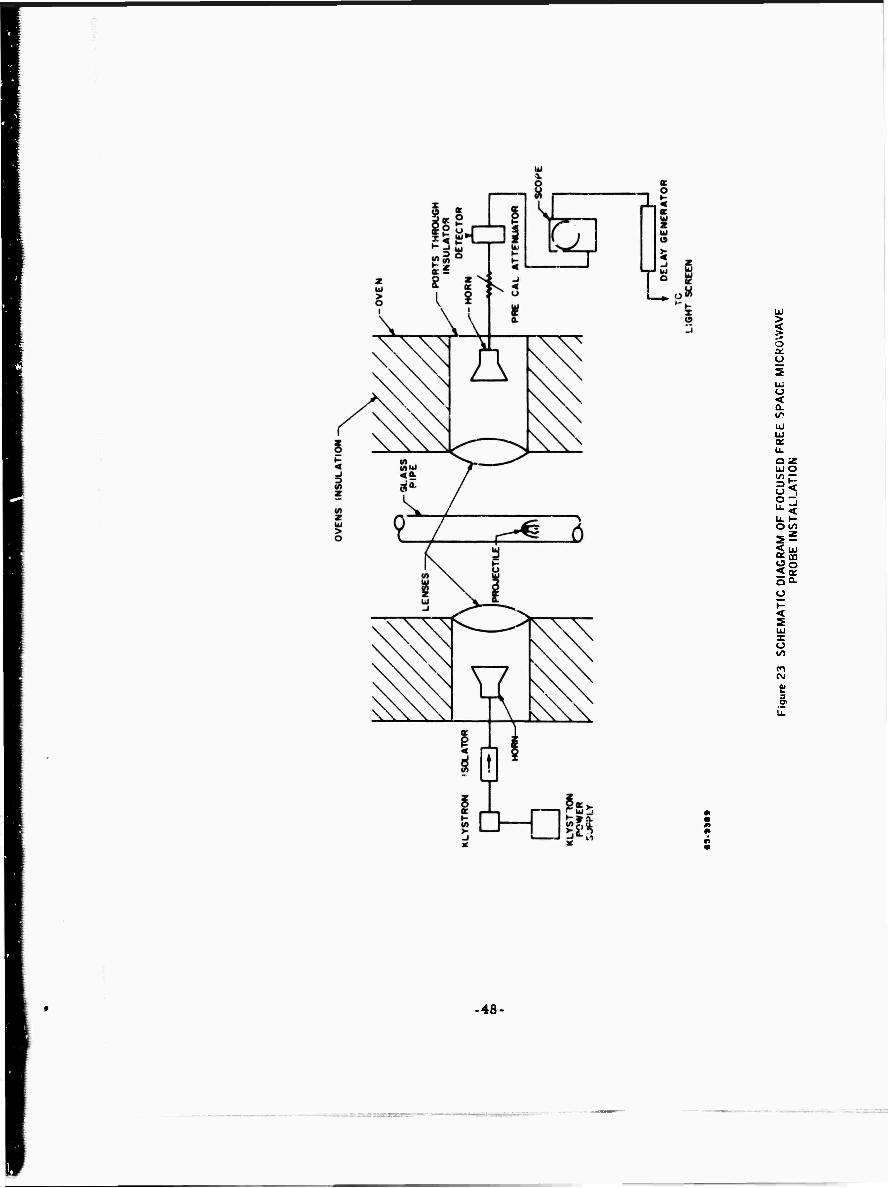
Several types ot microwave apparatus could be employed ior the necessdry meadurements. f^or example, transverse parallel focused microwave probes discussed in reference 7 wt uld overcome the difficulty of the projectile tra- jectory deviation. Unfortunately, microwave components were not available for this type apparatus. Consequently, a different microwave attenuation measuring technique was developed for installation in the chemical kinetics range. In this method,measurements of electron densiu from ?(10^) to 10*^ elect/cc are made using two focused free-space probes operating at frequencies of ib kmc and 117 kmc. The probes are aligned normal to the projectile tra- jectory. Each probe consists of a klystron transmitter, transmitting horn antenna, tv o Teflon dielectric focussing lenses, receiving horn and crystal detector (see figure 23). One lens focuses the transmitted energy to the axial center of the ballistic range and the other lens collects and refocusses the beam to the receiving horn antenna. The focus spot size of the beam for both probes is 16 mm in diameter. This is large enough to encompass any deviations form the projectiles normal flight path, since the wake diameter in the region
x {-->150)of measurement is greater than 28 mm (i.e., nearly twice the spot
diameter).
The probes measure the attenuation in the transmitted signal due to the com- bined effects of the absorption coefficient a, the phase coefficient ß. (see Equations 3 and 4) This measured attenuation is a function of:
1. Attenuation in the plasma due to the absorption coefficient.
2. Refraction or defocussing of the focused beam due to the phase coefficient.
3. Reflection from the plasma boundaries due to the phase coefi cient.
By applying the calculated theoretical collision frequencies (figure 22) and their corresponding electron densities to equation 3, the attenuation caused by can be calculated. The attenuation in the plasma as a result of is shewn in figure 24 as a function of electron density for signal frequencies of both 35 anu 177 kmc. The index of refraction, n , ( n= cß/aj) attenuates the transmitted signal by causing refraction at the plasma boundaries.
Index of refraction versus electron density for 33- and 117-kmc signal fre- quencies is shown in figure 25. Assuming a homogeneous plasma, Snell's law of refraction is applicable. Also, if the plasma is assumed to h; ve a known cylindrical shape, geometric ray tracing can be applied (reference 8). As the electron density increases, the index of refraction decreases towards 0, and the number of rays which are deflected away from the receiving norn increases. This effect is illustrated schematically in figure 26. By applying '.he ray-trac- ing technique to plasma cylinders of varying indices of refraction, the attenua- tion due to refraction as a furction of electron density is obtained (see figure 27).
-47-
i o
m o < a
LÜ UJ er u.
UJ o
o-.
OW1
< UJ QC CO
< «
o
-48-
o 3
<
t/1 <
Li. O
So
i-i H-
o
<
CM
il
0.
oo'AiisNao NOMioana
■49-
10
to"
13 ' 10 u u >-
m z UJ o z o K t- u
«"lO12
10
10 0
6S-9387
■ ■ 1
IITKMC
_
—
3? KMC
X
\ —
—
—
—
„
—
2 —
, '0
02 0 4 0 6 08 INDEX OF REFRACTION, n
1 0 i 2
Figure 25 INDEX OF REFRACTION AS A FUNCTION OF FLECTRON DENSITY AT 35 AND 117 KMC
oO-

MICROMWE SIGNAL
n» 10 r«0.0
DIELECTRIC LENie MICHOWAVE—/
HORN
•«.•It*
D3
Figure 26 ILLUSTRATION OF THE EFFECT OF MICROWAVE REFRACTION BY PLASMA CYLINDER
-51

0 12 16 ATTENUATION, decibels
20 24 28
Figure 2 7 ATTENUATION BY REFRACTION OF RAYS BY CYLINDRICAL PLASMA
-52-
Reflection at the plasma boundar'es causes attenvitation in the transmitted signal also. The reflection coeffi?ient as a function of electron density for 35 an*. 117 kmc is shown in figure 28, where the reflection coefficient is given by
. 1 - n Reflection «joefficient =
1 + n
The total attenuation is obtained from the triple product of the attenuations caused by the absorption coefficient, refractive index, and the reflection coefficient. The curve of this triple product is shown in figures 28 and 29 for the two signal frequencies.
To obtain the greatest accuracy from this measuring system, electron density data points were usually only taken in the regions where the index of refraction was nearly zero and unity. This procedure yields four electron-density data points per test firing; two from the 35-kmc probe at 2 x 10 and I. 5 x 10 el-cc"^ and two from the 117-kmc probe at 1 x 10^3 and I, 7 10^ el-cc"^. The inaccuracies in this system due to the assumptions that the plasma is homogeneous, isotropic, and of known size have been taken into account in the electron density profile curves by presenting the data points and their inaccur- acies as error bands. In addition to uncertainties in the data from noise level in the oscillograms, certain errors are inherent in the microwave techniques.
The error bands were estimated in the following way:
1. The 35-kmc and the 117-kmc probe data points were compared to each ether in the region of overlapping sensitivity.
2. Three-kmc microwave cavity plasma measurements from earlier pure argon results shots were compared to the 35-kmc and the 117-kmc probe results,
3. Errors were determined in measurements of dielectric rods of known refractive index.
The limits on the error bands estimated by this procedure are as follows:
117-kmc probe n - 0 I. 3 to 1. 714 el cc-3
n - 1 0.8 to 2. 013 el cc-3
35~kmc pro' n *■ 0 1. I to I. 513 el cc-3
n „ I 1.0 to 4.012 el cc-3
.53-
10' ,'»
10'
o
w .is
z o
o Ul -i Ul
10 it
10'
tl- ■ h T h
• \-
* h » r-
t - MI KMC
1
-1
{
39 Kl IC -
f
{ -
y -
I L.
• 8-*STI
0 0.9 1.0 1.6 2.2 3 4 9.2 7 10 » ATTENUATION FROM REFLECTION, dteibtlt
I I 'l I I I'l' L J I 0.1 0.2 03 0.4 0.9 0.6 0.7 0.8 0.9 1-0
REFLECTION COEFFICIENT
Figure 28 REFLECTION COEFFICIENT AND ATTENUATION FROM REFLECTION AS A FUNCTION OF ELECTRON DENSITY
-54-
The following is a listing of the components used in the microwave circuits (figure 23)
Equipment Description 35-kmc Equipment 177-kmc Equipment
Klystron power supply Micro power supply mod. FXR mod. Z815B dfd-cs-em-av
Klystron VarionAssoc. V0Z39A 400 mw - 35 kmc
VarionAssoc. V0715D 140 mw - 117 kmc
Isolation Cascade research Mod. KA-13-1
TRG mod. 110-41
Horn antenna DeMornay Bonardi DBD 520 10 db horn
DeMornay Bonardi DBW 520 15 db horn
Lenses Avco-made Teflon lenses
Avco-made Teflon lenses
Crystal detector Microwave Assoc. Mod. 539c
Microwave Assoc. MA4147
Oscilloscope Tektronix Mod. 502 Tektronix Mod. 502
To assure stability of the tramsmitter, the klystron was isolated from the rest of the circuit by a ferrite isolator.
The focusing lenses are made of Teflon to withstand the cesium oven tempera- tures. Surfaces of the lenses are hyperbolic to avoid spherical aberrations. The lenses are of nonsymmetrical design with the surfaces facing the horns aaving a focal length of 3. 0 inches and the surface facing the plasma having a focal length of 3. 5 inches. The field distribution, or focus spot size, was measured by passing two identical small spheres through the focal plane for various spacings between the spheres. Where the two spheres are separated by more than the beamwidth, the field distribution in the focal plane is traced out by each sphere. As the spheres are placed closer together, the two pat- terns ultimately overlap. The focused spot size is defined as the separation distance between the two identical spheres in the focal plane which produces field patterns that overlap that overlap at the 3-db points. The focal spot size for the lenses used measured 16 mm in diameter.
A precision calibrated attenuator is used to calibrate the output voltage of the crystal detector receiver in terms of relative input power. The output voltage is displayed vertically on an oscilloscope, while the scope's horizontal trace is swept in time, resulting in a display of attenuation versus time. Sines the velocity of the projectile is known from the light screen measurements, the
-55.
time can be converted into distance and a plot of attenuation versus distance behind the projectile can be obtained. The sweep of the oscilloscope is triggered externally from the light screens via a time delay trigger generator. The delay of the trigger generator is adjusted to allow the projectile to travel from the light screen station to a position a few inches ahead of the microwave probe stations before the scope is triggered. This results in the best possible time resolution by allowing faster scope sweep rates to be used. The oscilloscope trace is recorded with a poloroid camera.
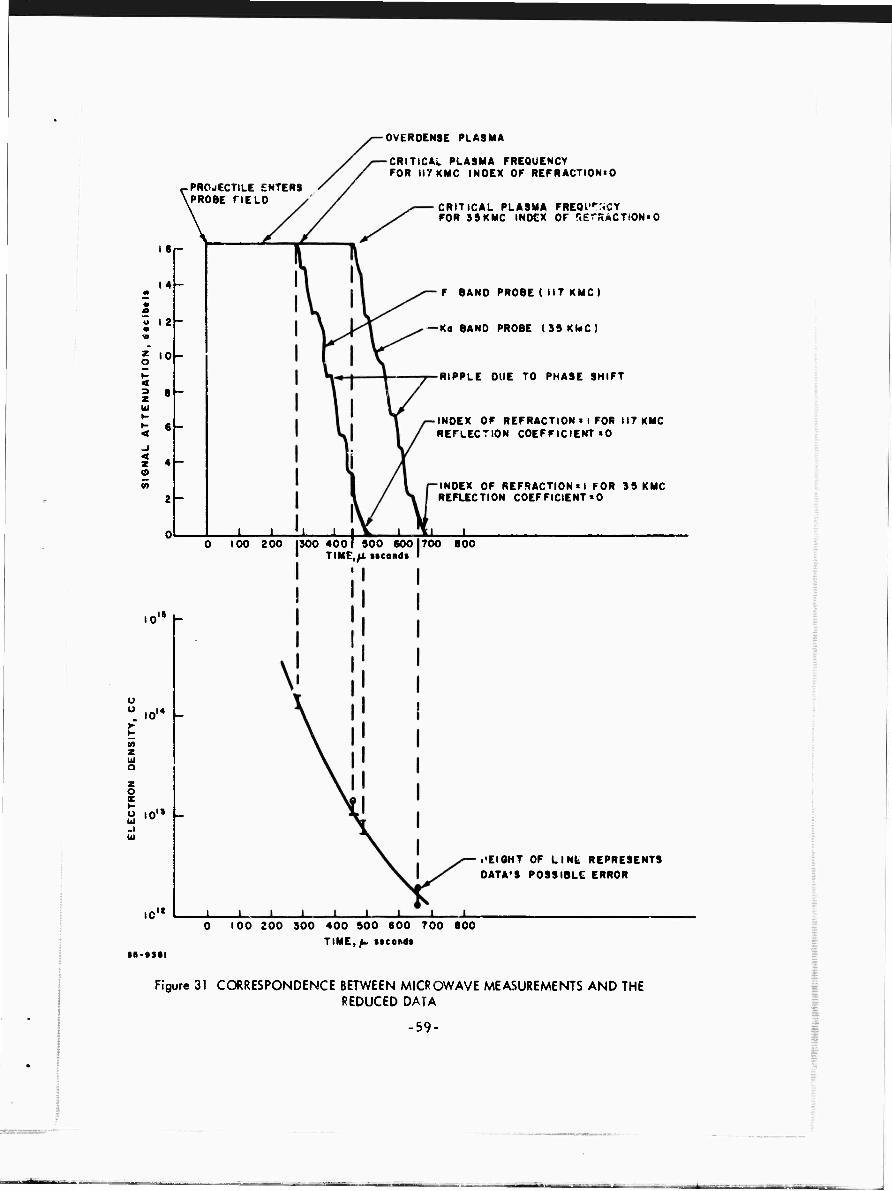
Electron-density profiles are obtained by applying the calibration curves, (figures 29 and 30), to the oscilloscope attenuation record. This procedure is illustrated in figure 31. As previously mentioned, the electron density data points are taken in the region where the index of refraction is approximately 0 and 1, for it is in this region that the greatest accuracy is obtained. Inter- mediate points are taken in those few cases where a small particle followed too closely behind the sj-here to permit the attenuation to return to the zero-db level. The riples in the output signal as the plasma decays is the result of phase shift in the microwave signal passing through the cylindrical-shaped plasma. The portion of the signal that passes nearer the edges of the plasma through the center of the plasma cylinder. Therefore, the microwave signal emerging from the plasma consists of several phase fronts. How these phase fronts combine vectorially after leving the plasma will determine the attenuation deviation from the calibration curves. Sim, ^ these attenuation perturbations are small, they have only a minor effect on the accuracy of the measuring system and, hence, are neglected.
-56-
i r o
T r d
Sea —
d o ö T
NOU0VBjt3a iO X30NI 01 « s rt N — in m <i UD f- r-. oo aj d o d ooo ö
"1—r—I " T ~r T 5
rt N 0> Ü 0> 3> 01 O d d d - —r—rr-!
■■■ I - ' T" _ 1 r_. J ~I - 1 1 |
..- H
[- \
-J
k
\
-]
k \
k -|
k \ s
-^
k \
-^
i- \ V
-|
i- \ 4
i- \
4
i- \ 4
[■ 4
1 l 1 1 .J _. 1 1 i 1 , 1
o
3 Z UJ l- (-
< a: CO
-i < o UJ 03 O x CL
<
9 N O V ^
3|.0I » 1-33 'AilSNaO N0biD3Ti
-57-
N0UJVHJ3U JO X3GNI
o
n z
o CO
jlPl « i-3D'AilSN3a NOaj.D3T3
-58-
.PROJKTILE ENTERS
.PROBE riELD
16
I 4
o I 2
10
< ? « w »-
_l
2 4 (9
.o'^h
". 10'*
o z o B
w v
-i bi
IC it
tS-llil
X
X
OVEROENSE PLASMA
CRITICAL PLASMA FREQUENCY FOR II7KMC INDEX OF REFRACTIONiQ
CRITICAL PLASMA FRE0l'r:.CY FOR 3SKMC INDEX OF r<£r^ACTtONt0
F BAND PROBE ( 117 KMC)
Ko BAND PROBE (39 KMC)
RIPPLE DUE TO PHASE SHIFT
INDEX OF REFRACTION • l FOR 117 KMC REFLECTION COEFFICIENT«0
INDEX OF REFRACTION'I FOR 39 KMC REFLECTION COEFFICIENT *0
0 100 200 X
1300 4001900 600|TOO 800 TIME,/1 Mcondt
-•EIGHT OF LINL REPRESENTS DATA'S POSSIBLE ERROR
0 100 200 300 400 900 600 700 800 TIME,/* MCOftd«
Figure 31 CORRESPONDENCE BETWEEN MICROWAVE MEASUREMENTS AND THE REDUCED DATA
-59-
REFERENCES
1. Primich, R.I. and R. A. Hyami, Millimeter Wave Length Focused Probes and Focused Resonant Probes for Use in Studying Ionized Wakes behind Hypersonic Velocity Projectiles. Gensral Motors Defense Research Laboratories, TR 63 21TC, Contract No. DA04-495 ORD3567(2), Santa Barbara, California (July 1963).
2. Frood, D.G. H. , P. W. W. Fuller, and A. Täte, An X Band Fabry-Perot Resonator for Wake Studies. (Presented at Seventh Meeting of Aeroballistics Range Assoc. , October 5-6, 1964, R.A.R.D.E., Fort Halstead-, Kent, England (5-6 October 1964).
3. Carswell, A. I. and C. Richards, Focused Microwave Systems for Plasma Diagnostics, R. C.A. Victor Company. Ltd. Research Labs. Report No. 7-801-32, Montreal, Canada (Decemb r 1964).
4. Stratton, J. A. , Electromagnetic Theory. McGraw-Hill Book Compnay, Inc.. New York, po. 326(1941).
5. linzourg, V. L. , Propagation of Electromagnetic Waves in a Plasma, Gordon and Breach Science Publishers, Inc., New York, pp. 78-84(1901).
6. Shkarofsky, J. P. M. P. Bachynski, and T. W. Johnston, Collision Frequency Associated with High Temperature Air and Scattering Cross- sections of the Constituents. Plan, and Space Science, Vol. 6 (1961).
7. Mc . «od, J, and S. Zevanovic, A Method for Determining P.-ofiles of Radial Electron Density and Collision Frequency in the Wakes of Hypersonic Projectiles Uning Tranverse Microwave Probes. General Motors Defense Research Laboratories, TR 64-02M, Contract No. DA-01-021-AMC-11359(2), Santa Barbara, California.
8. Williamson, R. C., Ray Tracing Through a Plasma Cylinder. Avcc Research and Advanced Div., Eng. Physics Memo No. 148 (September 1962).
-60-
■H Mik Mi
APPENDIX D
THEORETICAL TURBULENT WAKE ANALYSIS WITH ELECTRON-ION RECOMBINATION
Inasmuch as the recombination reactions take place in a turbulent wake where the coupling of chemical an ' iluid dynamic effects is significant, the interpreta- tion of the experimental daca requires a theoretical solution of such a non-
quilibrium wake. In this appendix, a physical model is developed and the method of solution is described.
The wake produced b;- a ballistics range model, moving at hypersonic speed through a fluid medium, is considered to be composed of inviscid and viscous portions, as illustrated in figure 32. The outer wake is a region which spreads from the outer edge of the inner wake across tl vake shock to the bow shock, and the inner wake is a strongly decelerated cc portion of the flow behind the body. The viscous inner core initially becc nes very hot because of the viscous heating in the boundary layer over the body surface and the recom- pression at the wake neck. The flow passing through the strong portion of the bow shock and coming into the outer inviscid region is also heated to high temperatures. Under this condition, ionization initially occurs in the vicinity of the model, and in the downstream (cooler) region of the wake recombination will begin. It is the purpose of the present study to utilize the results of a turbulent wake-flow field analysis to interpret ballistics range experiments concerning the recombination rate in a cesiunn-argon plasma.
To minimize the efforts and the cost of the operation, and also to eliminate the effect of ablation as well as the effect of the angle of attack, spheres have been used as the testing models in the ballistic remge experiments for the present study. It must be pointed out here that the analysis of the wake be- hind a blund body is not exactly the same as the analysis of the slender body case. The effects of the swallowing and the pressure gradient, which are usually neglected for a slender body case, may not be neglected for a blunt body. However, under certain conditions of the present experiments, these two effects are considered unimportant. This conclusion is made based upon the following observations:
(1) The theoretical study of Lees and Hromas^, indicates that the process of swallowing enthalpy or momentum defect originally contained in the outer wake is almost completed in about 300 diamete s. From the Schlieren photographs of Reference 2 the swallowing under the present experimental conditionb is found to be completed in the vicinity of 150 diameters.
(2) It is known, from characteristic calculations, that the effect of pressure gradient seldom extends beyond the region of 100 diameters.
-61-
y z o in LU a. > I
LU X a. 'S)
<
z o
u. z o u a u-
:■! ff 11
•62.
Specifically, the distance to the point where the pressur in the wake returns lo ambient is approximately 25 diameters for M ^ = 8. 5 and SO diameters for M = 22.
(3) The fully developed turbulent far-wake is usually preceded by a short region of laminar wake. The transition location varies according to the local Reynolds and Mach numbers. Over the range of the present ex- periments, transition is found to occur prior to the completion of the swallowing.
(4) In the präsent analysis, the theoretical computation starts from the location where the swallowing is completed. The initial conditions for the turbulent wake development are matched to those obtained from the experim«int8. The detailed discussion on matching conditions is given later. To sta^-t the theoretical computation from the completion of swallowing is necessary not only for the simplification of the theoretical treatment, but also for matching the experimental conditions. The electron density prior to the completion of swallowing is much higher than the range of the instrumentation used in the present experiments.
Thus , it is corcluded that the effects of swallowing, pressure gradient, and the laminar wake development are all contained in the portion of the wake prior to the initial point of the experiment, and therefore they are excluded in the turbulent wake analysis which is described in the following paragraphs.
The basic equations for the flow of a chemically reacting multicomponent gas mixture are:
dip*) ax
L d{pvt)
'~Tt = 0 (1)
pu 17 + pi 3t
d
17 (2)
^u du
dx at - - (., —) r dt Y dt) 0)
and (4)
dh pL •-— + P' —
tit. a
(3h 1 d J lc
r r dt \
\ dt I
^EFF-K
.63-
The notation uced in these equations is contained in the list of symbols. The governing equations tor turbulent flow are obtained when concentration, velocity, and enthalpy are decomposed into their mean and fluctuating parts. After time averging, they reduce to a set of equations
pu dC:
pv <9C:
dt at Pr1 W: (5)
pu
pu
c*u
dh
17
pv
pv
dv 1 (? 1" du]
17 ^ T 17 L M "J
dh /d*\2 i s r
Pr'
<?h
dt
(6)
(7)
where €„ is the turbulent eddy diffusivity and Pr1 is the turbulent Prandtl num- ber. For simplicity, the usual barred notation denoting averaged quantity (e. g. , ü) has been dropped. In deriving the above eruations. it is assumed that the turbulent diffusion is predominant over the laminar diffusion and the value of turbulent Lewis number is unity. According to the measurements made by Fage and Falkner in the wake of a cylinder, and Reichardt in a free jet, both of which are described in reference 3, the magnitude of a turbulent Prandxl number, Pr1 , was found to vary from 0. 5 to 0. 8. A value of 0. 7 is used throughout the present computations.
It is well known that the treatment of the turbulent problem is necessarily semiempirical. The knowledge of the variation of some physical quantities, such as the eddy viscosity and the correlation functions, is primarily obtained from experimental data. The magnitude of eddy viscosity in the prese..: analysis is estimated from a combination of mixing-length theory and the ex- perimental results of Townsend^ as
t - c.b. ( Au)
where C is a proportionality constant, defined as the recipncal of the universal eddy Reynolds number, b is the half width of the wake, and u is the mean vel - ocity defect across the wake
Instead of trying to solve the governing equations exactly, a modified integral method is applied. In terms of the displacement thickness ( 5») the mo- mentum thickness ( ' ), and the enthalpy transfer thickness ( 5h) defined as
-64-
■■(
(l- J^- fdi (8)
6 =
and
fij, .
J Peue V ue/ 0
rdr
1) rdr ,
(9)
(10)
the momentum integral and the energy relations become
de — = o dx
d5h = 0
dx
(ID
(12)
which can be solved provided that suitable forms of the velocity and enthalpy profiles are assumed. In the present approach, polynomials of fourth degree are chosen, i. e. ,
i = a0 - aj 7j + a2 TJ2 + a3 »j? + a4 T;4
and
h- h.
K-K -l 1 + «2 ^ + e3 ^ + e4 I4
Eight of the 10 free constants, a , a, a „, e , e ., a o 1 4 o 1 can be determined from the following eight boundary conditions.
At 7j = 0: f = 0, g - 1,
rj = 1: f - 1, g - 0,
The velocity and enthalpy profiles, therefore, can be written as
-65-
V
I
t » 4^3 - 31?4 4. A(JJ2 - 2J73 + rj4)
g - i - 47J3 + 3'?4 ♦ a(»,2 - 2^ + rj4)
(13)
(14)
where X and a are usually called the shape factors. These parameters. A(x) and a (x) , are determined by satisfying the momentum and energy equations along the wake axis in the forms
and
du_
dx
dz
2 t.
2(.
Pt'
d2u
dy^ - 4 V (ue " V —T
(15)
d'h
dy^
4*.
Pr1 (ho - M -r (16)
with the subscript o indicating the value at the wake axis. The integration of species conservation equations across the wake can be treated in a similar way. They can be reduced to
(5c>. du
dx
d(5c).
dx ^± bL ...) . ü f ±
dx \ 2 / \ J P idt, (17)
where the concentration exchange thickness for species i is defined by the re- lation
(M - / "^ tCe.(Ce). . 1 ydy
The concentration profiles for species i are derived, similar to the velocity and enthalpy profiles, as
^i
Ci-KU
"o\ - (Cc):
- I - 4^ + 3r;4 + fj (r,2 - 2,3 + ,4) (18)
with the shape parameters ^j determined hy the species continuity equation along the wake axis
-66-
2T„ d2C:
P/
(Vo>i
y- -o
4V r -i 5i -7 L^o)! - (Cc);] -
(W )■ (19)
The mass rate of production of species i per unit volume by chemical reactions, W., which appears everywhere in the species continuity equation, is deter- mined from the Law of Mass Action
dA;
M; dt =-. („/' - i/pkf n (A.) * + (^j - i^pkb n (A.) » (ZO)
v" , are the stoichio- where A. i3 the moiar concentration (mole/cc) and «-' metric coefficients for the reaction products and reactants, respectively.
The complete wake solution can be obtained by comgining equations (11) through (19) together with an expression for species production (or deletion) from equation (20).
The chemical reactions being studied in the ballistics range at Avcc RAD in- volve the ion-electron recombination of the pure alkali metals. In the first series of such experiments, 5.67-mm diameter sphere is fired into argon gas mixed with cesium vapor. Since the argon cannot react with the cesium, the only reactions whir.h will be observed after expansion into the wake will be
k, Cs+ + e" + (e") Cs + (e~)
II
III
Cs+ + e- 4 (A) Cs + (A)
CS+
Mil Cs + hv
(21)
Applying equation (20) for the reactions of (21) yieloc
^A ^ ^ -> -L+- -kjA ,1 [A 12
dt
and
■f-+--k.[v][v]2-k"[v][v]M-k".[v] [v]
dA
~d ~- j'lK-] +k"M +km [V]
(22)
SK *+ k" M | [v] (23)
-67-
where
K' - Ic, A 1 c- :ni (24)
The combined rate constant K*. which may be called the collisional radiative recombination coefficient, has been determined from a statistical theory in reference 5. Its value, tabulated as a function of temperature and electron den- sity, is reproduced figure 9. As to the three-body recombination rate K only limii.ed information is available at the present time. However, the importance of argon as a third body can be tested experimentally by varying the concentra- tion in the ballistics range at fixed velocity and cesium concentration. From the expression (23), it can be seen that tha electron density decay rate is con- trolled by argon density, if K* «K (A ). Under the experimental conditions of the present study, the argon density is kept relatively low and the electron- density decay rate is found to be little affected by the argon density. Therefore, theterm K (A ) is neglected in comparison with K*, and the theoretical elec tron diiitr " ~ tributions in the wake are made with
dA; 1 (25)
where the values oi K* are obtained form figure (9).
Computational Procedure
Following the method of theoretical analysis presented above, a computer pro- gram was written to facilitate thenumerical integration by IBM 7094 computer. The initial conditions for the computation are specified by the experiments as follows:
{!) The computation starts from the point where the swallowing is com- pleted. This is determined from the Schlieren photographs of reference 2.
(2) The initial electron density is matched to the experimental value.
(3) The wölke growth rate is also matched to the experimental value meas- ured from the Schlieren photographs of reference 2.
The only initial condition which involves some uncertainty is the initial enthalpy. Since measured temperature data are not available, the initial value is obtained from the approximated calculation of reference 6. To include the effect of un- certainty in the initial temperature ettimation, two rune representing upper and lower limits are computed for eazh case. The possible range of the solu- tion is thereby determined.
-68-
Figures 2 and 3 in the text respectively indicate the center line electron density in the wake with the cesium pressure of 0. 1 and 0. 6 torr. The comparison of these two figures reveals that the variation of initial cesium affects mostly the upstream portion of the wake, while the downstream electron concentrations are essentially the same. This behavior is explained as follows: The higher initial cesium concentration (for 0. 6 torr), results in a highe- initial electron density. From figure 9, it is seen that the recombination rate K"* is also
higher and hence, from equation (25), dAe"
dc is increased. Thus the original
difference in electron density in the vicinity of the wake neck 4s largely elimin- ated downstream by the faster initial recombinatio-:. Also shown in figure 2 and 3 the effects of initial temperature. Based on previous experience, a ±5 percent uncertainty may be expected in the calculated values of initial temperature. It can be seen that this difference induces only small differences in electron density. This insensitivity of wake electron-aensitv to the initial temperature occurs because a lower initial tempera*are results in a higher recombiration rate. This causes the electron density to decrease faster than it would for a higher initial temperature (see figure 8) Hence, only small differences in recombination rates and electron densities are ultimately pro- duced.
The variation of the temperature along the wake axis is presented in figure 9. The temperature distribution is practically unaffected by the cesium pressure because the concentration of cesium is much smaller than the argon in the present study. Hence, the results for both pressures plot as single curves.
-69- -
REFERENCES
1. Lees, L. and L. Hromae, Turbulent Diffusion in the Wake of a Blunt Nosed Body at Hypersonic Speeds. J. Aero Sei. pp. 976-993 Vol. 29(1962).
2. Birkhoff, G. , J. Er'erman, and W. McKay, Turbulent Hypersonic Wakes, Avco RAD TM 6'.-17 (1964).
3. Schlichting, H. : Boundary Layer Theory. McGraw-Hill Book Co. (1961)
4. Townsend, A. A. : The Structure of Turbulent Sheat Flow. Cambridge U. Press (1956^.
5. Bates, F. R. et al: Recombination between Electrons and Atomic Ions. I. Optically thin plasmaa. Pioc. Roy. Soc. Series A pp. 297-312, Vol. 267 (1962).
6. Widhopf, G. F. : Flow Field of a Spherical Pellet at Ballistic Range Condi- tions in Argon. GASL Tech Report No. 478.
-70-