Embed Size (px)
Citation preview
2
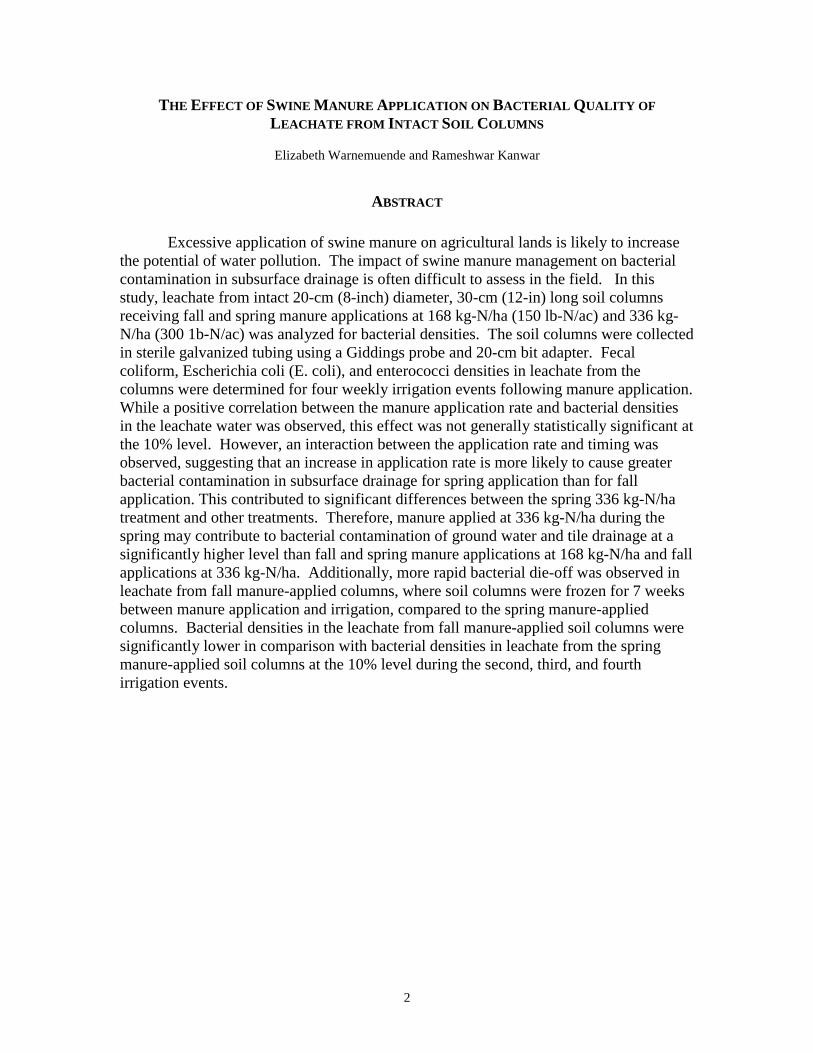
THE EFFECT OF SWINE MANURE APPLICATION ON BACTERIAL QUALITY OF
LEACHATE FROM INTACT SOIL COLUMNS
Elizabeth Warnemuende and Rameshwar Kanwar
ABSTRACT
Excessive application of swine manure on agricultural lands is likely to increasethe potential of water pollution. The impact of swine manure management on bacterialcontamination in subsurface drainage is often difficult to assess in the field. In thisstudy, leachate from intact 20-cm (8-inch) diameter, 30-cm (12-in) long soil columnsreceiving fall and spring manure applications at 168 kg-N/ha (150 lb-N/ac) and 336 kg-N/ha (300 1b-N/ac) was analyzed for bacterial densities. The soil columns were collectedin sterile galvanized tubing using a Giddings probe and 20-cm bit adapter. Fecalcoliform, Escherichia coli (E. coli), and enterococci densities in leachate from thecolumns were determined for four weekly irrigation events following manure application.While a positive correlation between the manure application rate and bacterial densitiesin the leachate water was observed, this effect was not generally statistically significant atthe 10% level. However, an interaction between the application rate and timing wasobserved, suggesting that an increase in application rate is more likely to cause greaterbacterial contamination in subsurface drainage for spring application than for fallapplication. This contributed to significant differences between the spring 336 kg-N/hatreatment and other treatments. Therefore, manure applied at 336 kg-N/ha during thespring may contribute to bacterial contamination of ground water and tile drainage at asignificantly higher level than fall and spring manure applications at 168 kg-N/ha and fallapplications at 336 kg-N/ha. Additionally, more rapid bacterial die-off was observed inleachate from fall manure-applied columns, where soil columns were frozen for 7 weeksbetween manure application and irrigation, compared to the spring manure-appliedcolumns. Bacterial densities in the leachate from fall manure-applied soil columns weresignificantly lower in comparison with bacterial densities in leachate from the springmanure-applied soil columns at the 10% level during the second, third, and fourthirrigation events.

3
INTRODUCTION
The total number of swine (Sus spp.) farms in the United States having at least10,000 sows increased from 31 to 54 between 1994 and 1997 (Freese, 1994, 1997). Theresultant manure, which is often land applied to cropland as fertilizer or soil conditioner,has been shown to effectively improve soil tilth and increase water holding capacity,resistance to crusting, and resistance to compaction (Letson and Gollehon, 1996). Theshift towards larger hog confinement units has intensified the need for proper manurehandling techniques. Appropriate manure application rates, timing, and methods arenecessary maximize manure utility, while minimizing the pollution potential from the useof manure.
Potential pollutants, which may emanate from land-applied manure, includebacteria. Bacterial water quality determines suitability for drinking and recreational uses.Drinking water supplies must not contain more than 2,000 colony forming units per100ml (cfu/100ml) fecal coliform prior to primary treatment, and recreational watersmust not contain more than 200 cfu/100ml fecal coliform (limited contact). Typical swinemanure contains 6,500,000 cfu/100ml fecal coliform. Under current manure applicationguidelines, leachate from manure-amended fields reaching subsurface tile drain oftenexceeds drinking water supply and recreational use standards. This paper will focussubsurface bacterial leaching, which may result in the movement of bacteria to receivingsurface and ground waters. Specifically, the impacts of different manure managementregimes on fecal coliform, Escherichia coli (E. coli), and enterococci densities in leachatefrom intact soil columns were examined.
The objective of this study was to identify the optimum swine manure applicationrate and timing, in order to minimize bacterial transport to receiving surface and groundwaters via subsurface bacterial leaching.
REVIEW OF LITERATURE
Bacterial Pollution From Land Applied Manure
Bacteria in land-applied manure may pollute soil and vegetation, as well assurface and ground waters. This pollution threatens the environment and human health.Bacterial pollution may impair soil when nutrient cycling and decomposition rates arealtered by competition of manure-borne bacteria with indigenous soil bacteria (Doran,1979). Limiting the quantity of manure applied to a single site can reduce buildup ofintroduced bacteria in the soil. Bacterial pollution may additionally render vegetationunsuitable for grazing. The rate of bacterial die-off on vegetation is impacted by manureapplication timing (Brown et al.,1980), and by pasture management (Bell and Bole,1976).
Surface waters are impacted by direct surface runoff, groundwater flow, andsubsurface tile drainage that discharges to surface water. When surface waters that areused for drinking water or recreational uses become impaired by bacterial contamination,
4
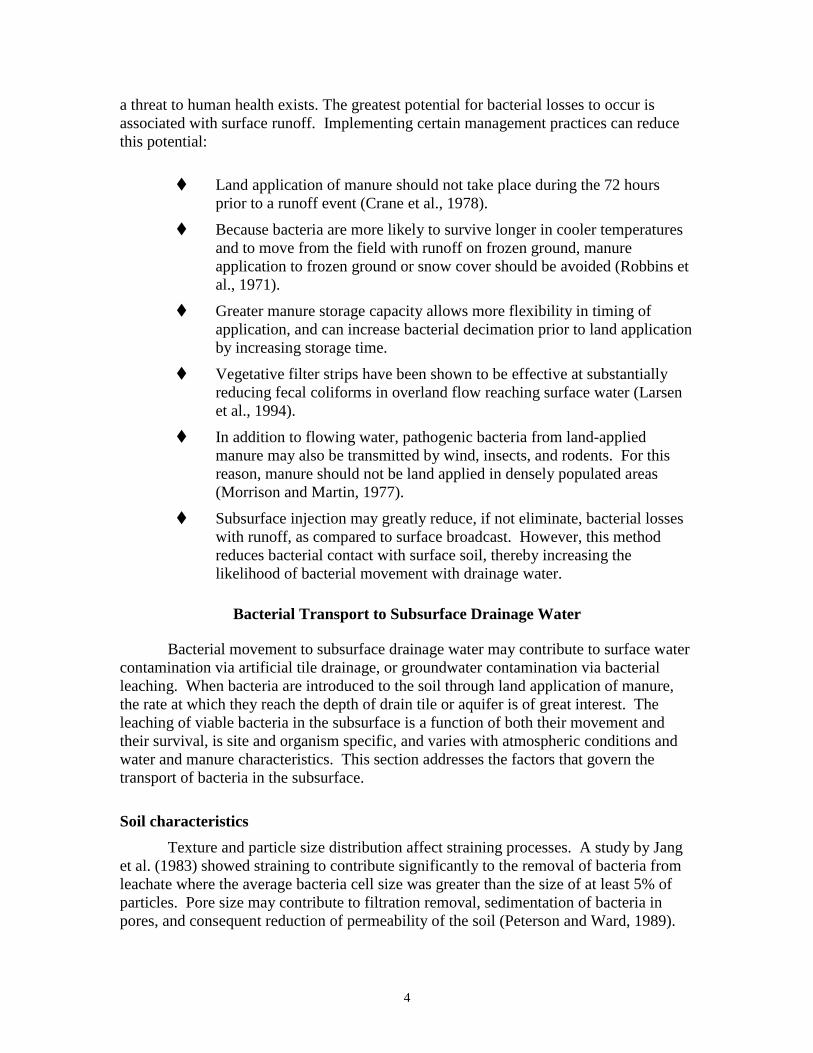
a threat to human health exists. The greatest potential for bacterial losses to occur isassociated with surface runoff. Implementing certain management practices can reducethis potential:
t Land application of manure should not take place during the 72 hoursprior to a runoff event (Crane et al., 1978).
t Because bacteria are more likely to survive longer in cooler temperaturesand to move from the field with runoff on frozen ground, manureapplication to frozen ground or snow cover should be avoided (Robbins etal., 1971).
t Greater manure storage capacity allows more flexibility in timing ofapplication, and can increase bacterial decimation prior to land applicationby increasing storage time.
t Vegetative filter strips have been shown to be effective at substantiallyreducing fecal coliforms in overland flow reaching surface water (Larsenet al., 1994).
t In addition to flowing water, pathogenic bacteria from land-appliedmanure may also be transmitted by wind, insects, and rodents. For thisreason, manure should not be land applied in densely populated areas(Morrison and Martin, 1977).
t Subsurface injection may greatly reduce, if not eliminate, bacterial losseswith runoff, as compared to surface broadcast. However, this methodreduces bacterial contact with surface soil, thereby increasing thelikelihood of bacterial movement with drainage water.
Bacterial Transport to Subsurface Drainage Water
Bacterial movement to subsurface drainage water may contribute to surface watercontamination via artificial tile drainage, or groundwater contamination via bacterialleaching. When bacteria are introduced to the soil through land application of manure,the rate at which they reach the depth of drain tile or aquifer is of great interest. Theleaching of viable bacteria in the subsurface is a function of both their movement andtheir survival, is site and organism specific, and varies with atmospheric conditions andwater and manure characteristics. This section addresses the factors that govern thetransport of bacteria in the subsurface.
Soil characteristics
Texture and particle size distribution affect straining processes. A study by Janget al. (1983) showed straining to contribute significantly to the removal of bacteria fromleachate where the average bacteria cell size was greater than the size of at least 5% ofparticles. Pore size may contribute to filtration removal, sedimentation of bacteria inpores, and consequent reduction of permeability of the soil (Peterson and Ward, 1989).

5
Several soil characteristics influence bacterial sorption, and thus bacterialtransport. Because bacteria sorb more readily to positively charged mineral surfaces thanto negatively charged mineral surfaces (Scholl et al., 1990), mineral makeup of the soilimpacts bacterial sorption. Organic matter can affect the surface charge andhydrophobicity characteristics of the base mineral (Harvey, 1991), and increase surfacearea and sorption sites. Soil pH influences the pH of infiltrating water. While the pHeffects on bacterial sorption are dependent upon soil and organism characteristics,bacterial retention is generally higher in neutral to acidic conditions than in alkalineconditions (Goldschmidt et al., 1973).
Moisture properties
Physical moisture conditions such as soil water content, temperature and flux, aswell as flow rate impact bacterial transport (McCoy and Hagedorn, 1979), (Yates andYates, 1988). These factors influence the processes of advection and dispersion, as wellas bacterial adsorption. High moisture content and flow rate contribute to bacterialleaching. The pH and ionic strength of infiltrating water impacts bacterial transport bythe same mechanisms as the pH and ionic strength of the soil.
Bacterial characteristics
The density and dimensions of the microorganism affects the processes ofstraining and gravitational leaching. In saturated conditions, bacteria may becomemobile through means of their own locomotion. This mobility depends on the type ofmicroorganism, but has been shown to be a significant means of transport for motilestrains of E. coli (Reynolds et al, 1989). A study by Huysman and Vertraete (1993)showed that cell surface hydrophobicity impacts bacterial transport. In this study,hydrophobic bacteria adhered to the soil more readily than hydrophillic bacteria. Cellsurface charge may also play a role in bacterial transport (Sharma et al., 1985).
Bacterial Survival in the Subsurface
The survival rate of microorganisms introduced to soil is a function of manyfactors. Table 1 gives a summary of these factors.
Table 1. Factors influencing the survival of bacteria in the subsurface.
Physiochemical Characteristics of Soil a) pHb) porosityc) organic matterd) texturee) temperaturef) moistureg) adsorption/ filtrationI) nutrients

6
Table 1 continued. Factors influencing the survival of bacteria in the subsurface.
Atmospheric Conditionsa) sunlightb) moisturec) temperature
Biological Interactionsa) competitionb) antibioticsc) toxic substances
Application Methodsa) techniqueb) frequencyc) organism density in waste material
MATERIALS AND METHODS
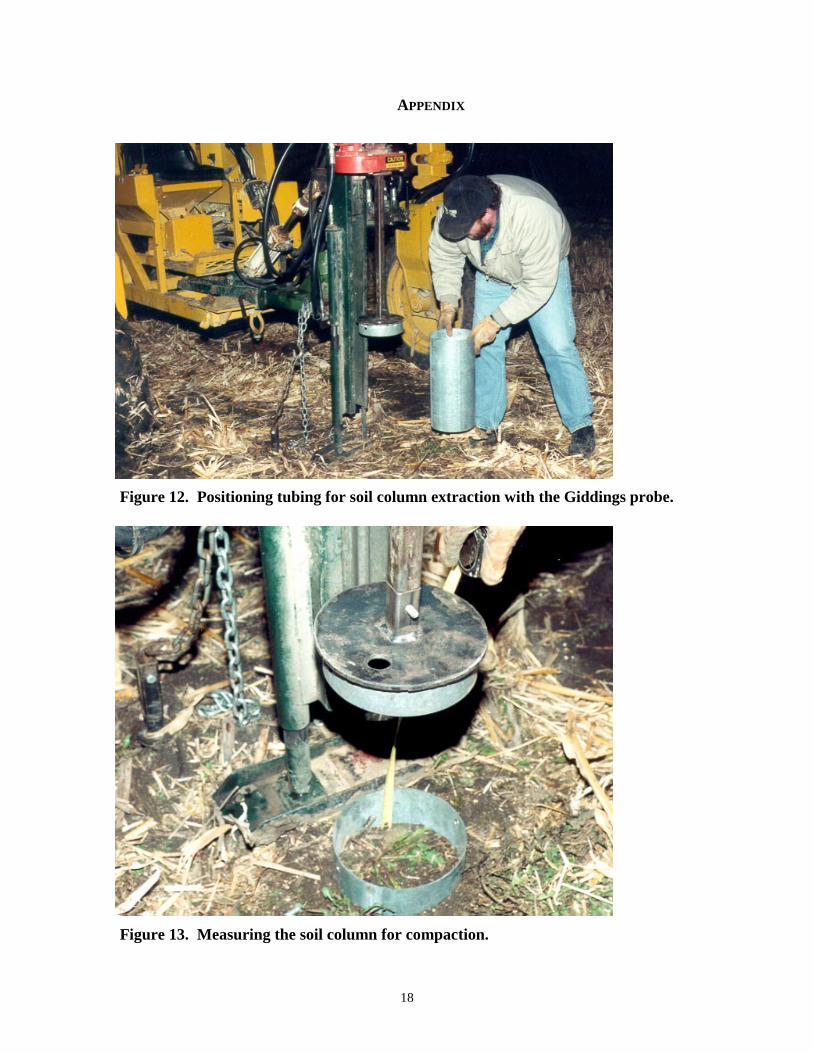
Eighteen soil columns were collected from the Iowa State University Agronomyand Agricultural Engineering Research center near Ames, IA in order to accommodatethree replications of four manure treatments and two control treatments. Soil columntreatments are listed in Table 2. The soil was a Clarion loam in annual corn and soybeanrotation. Soil columns were extracted in late fall, after the 1999 soybean harvest, using aGiddings probe and a 20-cm bit adapter. The 30-cm columns were extracted in 38-cmsections of sterilized galvanized tubing that had been sharpened on the down - facingedge (Figure 12). In order to detect compaction, the vertical distance between the topedge of the column and the inside soil surface was measured and compared to the verticaldistance between the top edge of the column and the outside soil surface, prior toextraction of each soil column (Figure 13). No compaction was detected.
Table 2. Experimental Treatments.
Spring Control Not amended
Fall Control Not amended
Spring Inject 1X Manure application at a rate of 168kg-N/ha (150lb-N/ac)
Spring Inject 2X Manure application at a rate of 336kg-N/ha (300lb-N/ac)
Fall Inject 1X Manure application at a rate of 168kg-N/ha (150lb-N/ac)
Fall Inject 2X Manure application at a rate of 336kg-N/ha (300lb-N/ac)
The soil columns were transported to a growth chamber, simulating the soiltemperature at the 10 cm (4 inch) depth during the typical periods of fall and springmanure application. Autoclaved screen was installed on the bottom of each column in
7
order to prevent soil loss. The columns were then arranged in a random block design in aleachate collection apparatus consisting of 25-cm autoclaved funnels and a guide tablethat prevented the columns from deviating from the vertical position (Figure 14). Theywere saturated with 5000ml of water and allowed to drain for four days. After thisperiod, manure was incorporated to the 10 cm depth. The manure was obtained from afinishing unit at Bilsland Memorial swine farm near Luther, IA and was less than 7 daysaged. Bacterial analysis revealed a fecal coliform density of 2,000,000 cfu/100ml.
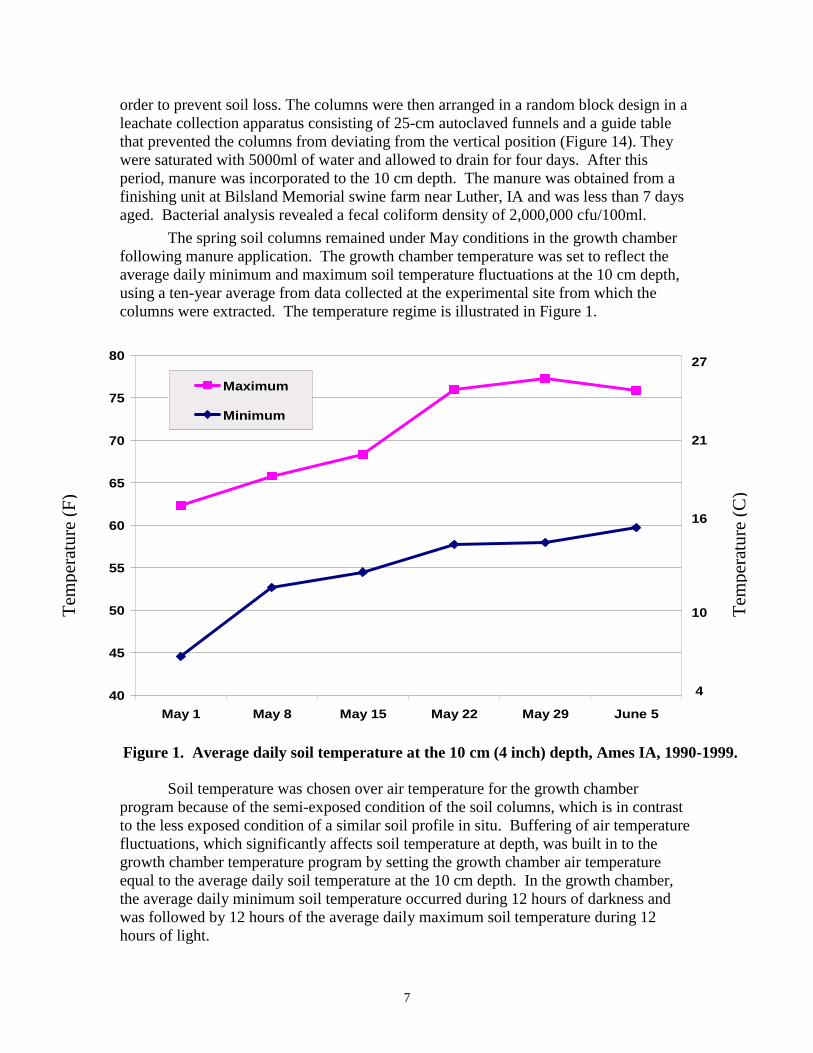
The spring soil columns remained under May conditions in the growth chamberfollowing manure application. The growth chamber temperature was set to reflect theaverage daily minimum and maximum soil temperature fluctuations at the 10 cm depth,using a ten-year average from data collected at the experimental site from which thecolumns were extracted. The temperature regime is illustrated in Figure 1.
Soil temperature was chosen over air temperature for the growth chamberprogram because of the semi-exposed condition of the soil columns, which is in contrastto the less exposed condition of a similar soil profile in situ. Buffering of air temperaturefluctuations, which significantly affects soil temperature at depth, was built in to thegrowth chamber temperature program by setting the growth chamber air temperatureequal to the average daily soil temperature at the 10 cm depth. In the growth chamber,the average daily minimum soil temperature occurred during 12 hours of darkness andwas followed by 12 hours of the average daily maximum soil temperature during 12hours of light.
40
45
50
55
60
65
70
75
80
May 1 May 8 May 15 May 22 May 29 June 5
Maximum
Minimum
27
21
16
10
4
Figure 1. Average daily soil temperature at the 10 cm (4 inch) depth, Ames IA, 1990-1999.
Tem
pera
ture
(F)
Tem
pera
ture
(C
)
8
Six days after manure application, the first of four irrigation events took place.Water was irrigated to a ponding depth of 5.3 cm (volume = 1700ml), which is a typicalweekly rainfall amount for the first week in May. Weekly rainfall depths were based onweekly rainfall data and irrigated in a single event in order to produce the effects ofmacropore flow and yield enough leachate to perform bacterial analyses. The leachatewas collected in sterile plastic sample bottles and analyzed for fecal coliform, E. coli, andenterococci using Standard Methods 9222D, 9222G, and 9230C, respectively. Thisprocess was repeated for the second, third, and fourth irrigation events. Ponding depthfor these events was 3.7 cm (volume = 1200ml), 3.4 cm (volume = 1100ml), and 3.4 cm(volume = 1100ml), respectively. Outflow was quantified in order to provide datanecessary to complete water budgets on each column, and confirm uniform moisturecontents. Average outflows between treatments were similar.
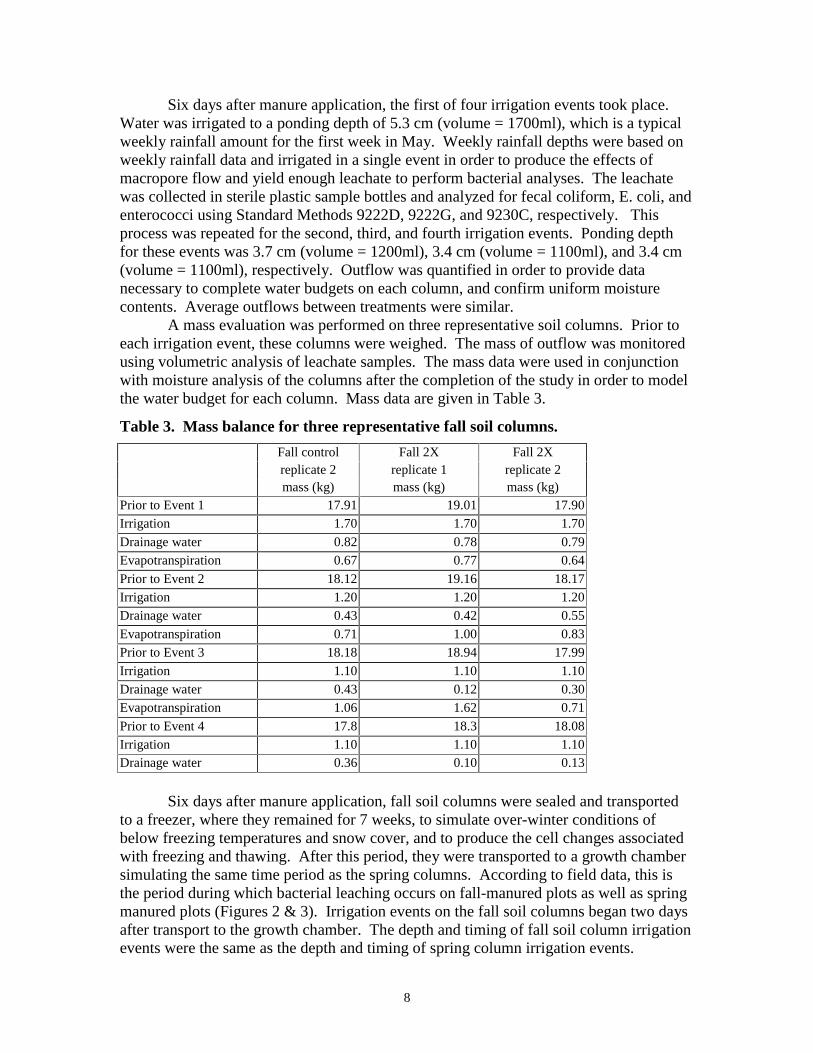
A mass evaluation was performed on three representative soil columns. Prior toeach irrigation event, these columns were weighed. The mass of outflow was monitoredusing volumetric analysis of leachate samples. The mass data were used in conjunctionwith moisture analysis of the columns after the completion of the study in order to modelthe water budget for each column. Mass data are given in Table 3.
Table 3. Mass balance for three representative fall soil columns.
Fall control Fall 2X Fall 2Xreplicate 2 replicate 1 replicate 2mass (kg) mass (kg) mass (kg)
Prior to Event 1 17.91 19.01 17.90Irrigation 1.70 1.70 1.70
Drainage water 0.82 0.78 0.79Evapotranspiration 0.67 0.77 0.64
Prior to Event 2 18.12 19.16 18.17Irrigation 1.20 1.20 1.20Drainage water 0.43 0.42 0.55
Evapotranspiration 0.71 1.00 0.83Prior to Event 3 18.18 18.94 17.99
Irrigation 1.10 1.10 1.10Drainage water 0.43 0.12 0.30Evapotranspiration 1.06 1.62 0.71
Prior to Event 4 17.8 18.3 18.08Irrigation 1.10 1.10 1.10Drainage water 0.36 0.10 0.13
Six days after manure application, fall soil columns were sealed and transportedto a freezer, where they remained for 7 weeks, to simulate over-winter conditions ofbelow freezing temperatures and snow cover, and to produce the cell changes associatedwith freezing and thawing. After this period, they were transported to a growth chambersimulating the same time period as the spring columns. According to field data, this isthe period during which bacterial leaching occurs on fall-manured plots as well as springmanured plots (Figures 2 & 3). Irrigation events on the fall soil columns began two daysafter transport to the growth chamber. The depth and timing of fall soil column irrigationevents were the same as the depth and timing of spring column irrigation events.

9
Figure 2. Fecal coliform densities in Subsurface Drainage from field plots.
0
10
20
30
40
50
Date
ControlSpring Inject 1XSpring Inject 2XFall Inject 1XFall Inject 2X
0
10
20
30
40
50
60
5/10/1999 5/12/1999 5/18/1999 6/7/1999
Date
CF
U/1
00m
l
ControlSpring Inject 1X
Spring Inject 2X
Fall Inject 1XFall Inject 2X
Figure 3. E. coli densities in Subsurface Drainage from field plots.
5/10/1999 5/12/1999 5/18/1999 6/7/1999

10
RESULTS AND DISCUSSION
Bacterial densities in soil column leachate from irrigation events 1 through 4 aregiven in Figures 4 through 7 and in Tables 4 through 11 of the Appendix. In general, thedouble rate manure treatment resulted in slightly higher bacterial densities in soil columnleachate. This difference became more significant with successive irrigation eventsbecause of the higher organic matter present in double rate columns, which minimizedthe stress of between – event drying on bacteria. The application rate effect wasstatistically significant at the 10% level for enterococci during event 3. The fall columnsyielded similar bacterial densities as the spring columns for event one, and lowerbacterial densities for events 2, 3, and 4. The application timing effect was significant atthe 10% level during events 3 and 4 for fecal coliform, during events 2 and 3 for E. coli,and during event 2 for enterococci. Fall bacteria survived the freeze-thaw cycle andover-winter conditions in a weakened state and experienced more rapid die-off than thespring columns. The higher organic matter available to bacteria in the double ratecolumns contributed positively to the survival of bacteria, particularly the fall bacteria.An interaction between rate and timing interaction was significant for fecal coliformduring event 4 and E. coli during events 3 and 4.
While bacterial densities were higher in leachate from double rate manurecolumns during event 1, no significant differences between treatments were detectedduring this event. However, bacterial densities from control columns were significantlylower than in manured columns, with the exception of enterococci in leachate from thespring control column. Enterococci have a high degree of survivability in the soil. Forthis reason, the effects of wildlife activity or general farm operations on the soil columnextraction site prior to soil column extraction, which may have caused bacterialcontamination of control columns, would be most visible and most persistent inenterococci densities. With the exception of enterococci, bacteria were not detected inthe control columns after the first irrigation event, and control columns were alwayssignificantly different from manure treated columns.
Event 2 resulted in higher bacterial densities in leachate from columns receivingdouble manure application rate, although this difference was not significant. The effectof timing was significant however, with E. coli and enterococci densities significantlylower in fall columns leachate than in spring column leachate. E. coli densities inleachate from spring columns were significantly lower than E. coli densities in leachatefrom the fall double rate columns.
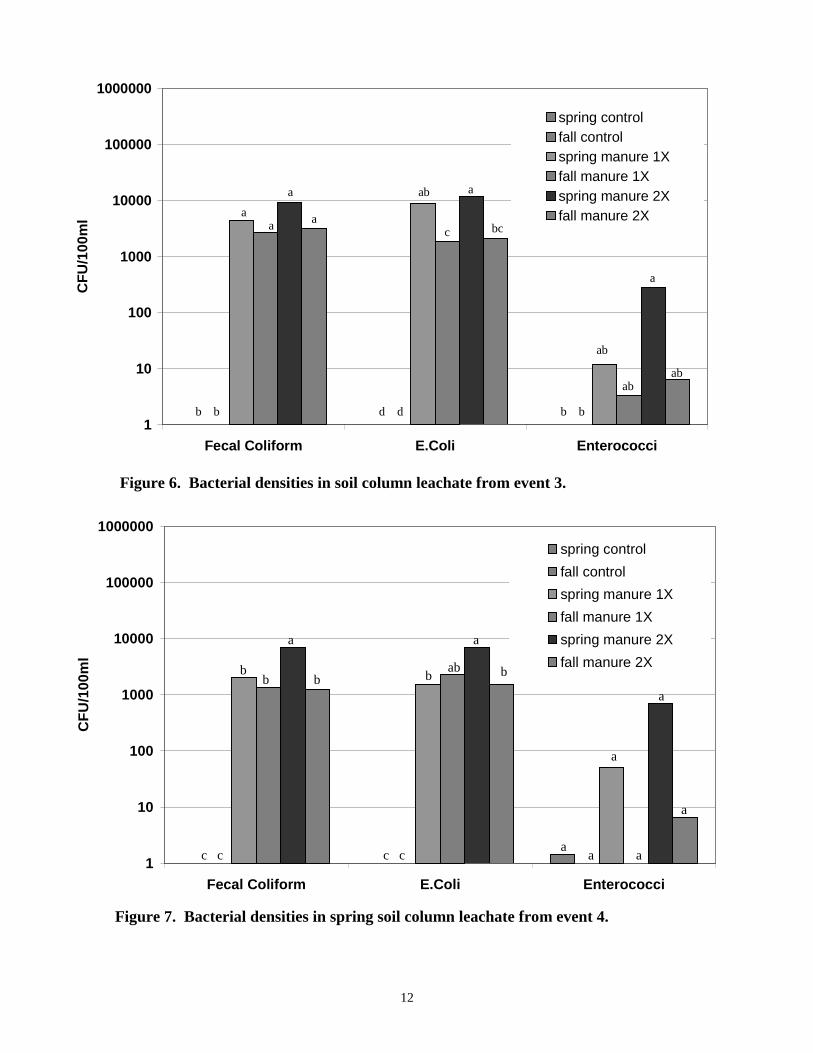
Bacterial quality of leachate resulting from event 3 was significantlyinfluenced by both timing and rate, and was poorest among the spring double ratecolumns. Spring double rate columns resulted in significantly higher E. coli densitiesthan fall single and double rate columns. Spring single rate columns resulted insignificantly higher E. coli densities in leachate than fall single rate columns. Otherdifferences between treatments were evident, although not statistically significant at the10% level.
During event 4, spring double rate columns continued to result in the poorestquality leachate. This treatment resulted in fecal coliform densities in leachatesignificantly higher than all other treatments, and E. coli densities higher than springsingle rate and fall double rate treatments.

11
Figure 4. Bacterial densities in soil column leachate from event 1.
Figure 5. Bacterial densities in soil column leachate from event 2.
1
10
100
1000
10000
100000
1000000
Fecal Coliform E.Coli Enterococci
CF
U/1
00m
l
spring control
fall control
spring manure 1X
fall manure 1X
spring manure 2X
fall manure 2X
1
10
100
1000
10000
100000
1000000
Fecal Coliform E.Coli Enterococci
CF
U/1
00m
l
spring control
fall control
spring manure 1X
fall manure 1X
spring manure 2X
fall manure 2X
a aa
a a aa a
a
a
b
a
a a
bb b
b
a a
a
a
a
ab
a
b
aa
ab ab
ab
bc cb b
12
Figure 6. Bacterial densities in soil column leachate from event 3.
Figure 7. Bacterial densities in spring soil column leachate from event 4.
1
10
100
1000
10000
100000
1000000
Fecal Coliform E.Coli Enterococci
CF
U/1
00m
l
spring controlfall controlspring manure 1Xfall manure 1Xspring manure 2Xfall manure 2X a
a
a
a
a
a
ab
c bc
ab
ab ab
b b d d b b
1
10
100
1000
10000
100000
1000000
Fecal Coliform E.Coli Enterococci
CF
U/1
00m
l
spring control
fall control
spring manure 1X
fall manure 1X
spring manure 2X
fall manure 2X
c c c c
b b b
a
b b ab
a
a a
a
a
a
a
13
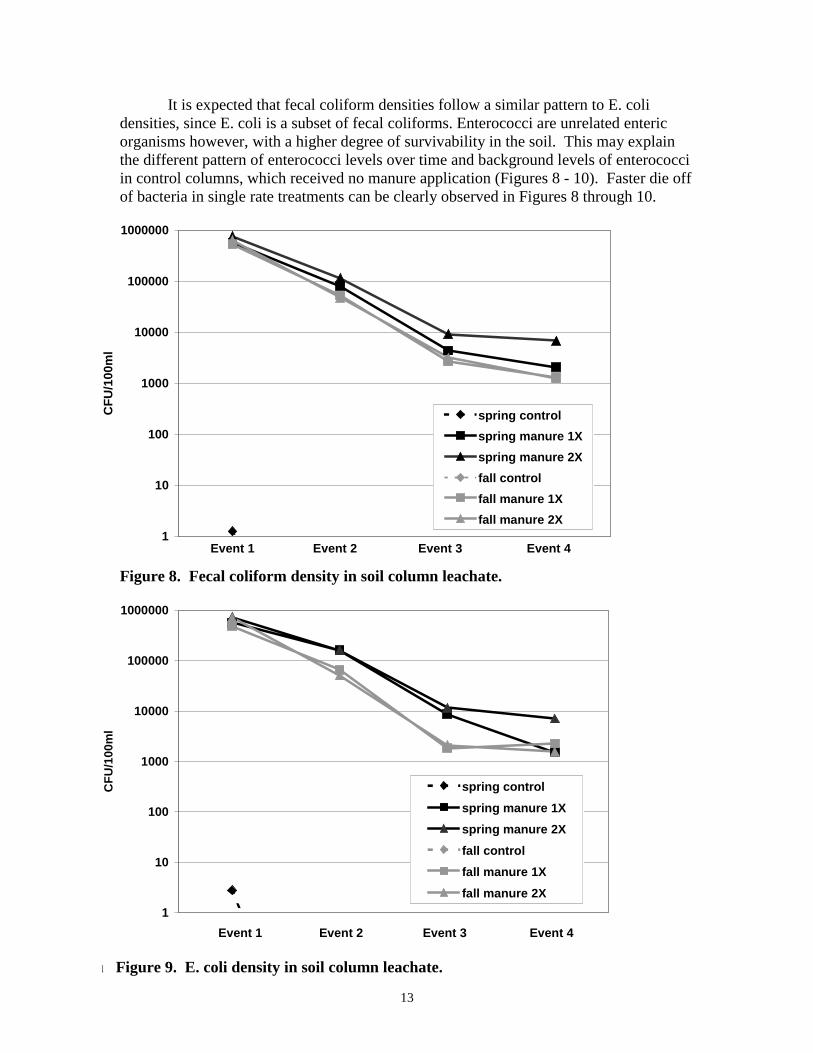
It is expected that fecal coliform densities follow a similar pattern to E. colidensities, since E. coli is a subset of fecal coliforms. Enterococci are unrelated entericorganisms however, with a higher degree of survivability in the soil. This may explainthe different pattern of enterococci levels over time and background levels of enterococciin control columns, which received no manure application (Figures 8 - 10). Faster die offof bacteria in single rate treatments can be clearly observed in Figures 8 through 10.
Figure 8. Fecal coliform density in soil column leachate.
1
10
100
1000
10000
100000
1000000
CF
U/1
00m
l
spring control
spring manure 1X
spring manure 2X
fall control
fall manure 1X
fall manure 2X
Event 1 Event 2 Event 3 Event 4
1
10
100
1000
10000
100000
1000000
CF
U/1
00m
l
spring control
spring manure 1X
spring manure 2X
fall control
fall manure 1X
fall manure 2X
Event 1 Event 2 Event 3 Event 4
u Figure 9. E. coli density in soil column leachate.

14
Figure 10. Enterococci density in soil column leachate.
Fluctuations in soil column gravimetric moisture content are believed to havebeen the major factor contributing to bacterial die-off in this study. These fluctuationscan be observed in Figure 11. It is possible that more significant differences resultingfrom application timing and rate would be observed under more ideal moistureconditions.
1
10
100
1000
CF
U/1
00m
l
spring control
spring manure 1X
spring manure 2X
fall control
fall manure 1X
fall manure 2X
Event 1 Event 2 Event 3 Event 4
0
5
10
15
20
25
30
0 100 200 300 400 500 600
Time (hours)
Gra
vim
entr
ic S
oil
Mo
istu
re C
on
ten
t (%
)
Event 1 Event 2Event 3
Event 4
Figure 11. Average gravimetric moisture content of soil columns over time.

15
Statistical analysis of bacterial counts yielded similar results to statistical analysisof bacterial densities. There were no significant differences in drainage volume betweentreatments.
CONCLUSIONS
Intact soil columns were used to model the movement of bacteria to subsurfacedrainage following fall and spring swine manure applications at a rate of 168 kg-N/ha anda rate of 336 kg-N/ha. In almost every case, leachate from manured columns hadsignificantly higher bacterial densities than leachate from non-manured control columns.This suggests that land application of swine manure is likely to cause bacterialcontamination of subsurface drain water, even at the recommended application rate of168 kg-N/ha.
Clear differences in bacterial densities were identified between treatments duringthe second, third, and fourth irrigation events following manure application. Springapplication of swine manure resulted in higher bacterial densities in subsurface drainagethan fall application during the five-week period following spring manure application.Specifically, the spring 336 kg-N/ha treatment yielded higher bacterial densities thanother treatments during all but the first irrigation event. This suggests that manureapplied to the field at a rate of 336 kg-N/ha during the spring may contribute significantlymore bacterial contamination to ground water and tile drainage than fall and spring 168kg-N/ha manure applications and fall 336 kg-N/ha applications.
Although few significant differences were detected between application rates, thecolumns that received 336 kg-N/ha swine manure almost always yielded higher bacterialdensities in leachate than the columns that received 168 kg-N/ha swine manure during thesame season. Additionally, an interaction between the application rate and timing wasobserved, suggesting that an increase in application rate is more likely to cause greaterbacterial contamination in subsurface drainage for spring application than for fallapplication.

16
LITERATURE CITED
Bell, R.G. and J.B. Bole. 1976. Elimination of fecal coliform bacteria from reed canarygrass irrigation with municipal lagoon effluent. J. Environmental Quality, 5:417.
Brown, K.W., S.G. Jones and K.C. Donelly. 1980. The influence of simulated rainfallon residual bacteria and virus on grass treated with sewage sludge. J.Environmental Quality, 9(2):261-265.
Crane, S.R., M.R. Overcash and P.W. Westerman. 1978. Swine manure microbial die-off and runoff transport under controlled boundary conditions. Unpublishedpaper, 15 pp.
Doran, J.W. and D.M. Linn. 1979. Bacteriological quality of runoff water frompastureland. Applied Environmental Microbiology, 37:985.
Freese, B. 1994. Pork Powerhouses. Successful Farming. 92(10):20-24.
Freese, B. 1997. Pork Powerhouses 1997. Successful Farming. 95(10):22-26.
Goldschmidt, J., D. Zohar, Y. Argamon, and Y. Kott. 1973. Effects of dissolved salts onthe filtration of coliform bacteria in sand dunes. In Advances in water pollutionresearch. Edited by S.H. Jenkins Pergamon Press, New York, N.Y. p.147.
Harvey, R.W. 1991. Parameters involved in modeling movement of bacteria ingroundwater. In Modeling the environmental fate of microorgansims. Edited byC.J. Hurst. American Society for Microbiology, Washington, D.C. pp. 89-114.
Huysman, F. and W. Verstraete. 1993. Water-facilitated transport of bacteria inunsaturated soil columns: influence of cell surface hydrophobicity and soilproperties. Soil Biol. and Biochem, 25(1):83-90.
Jang, L.K., P.W. Chang, J. Findley, and T.F. Yen. 1983. Selection of bacteria withfavorable transport properties through porous rock for the application of microbialenhanced oil recovery. Applied Environmental Microbiology, 46:1066-1072.
Larsen, R.E., J.R. Miner, J.C. Buckhouse, and J.A. Morre. 1994. Water quality benefitsof depositing manure away from streams. Bioresource Technology, 48:113-118.
Letson, D. and Gollehon, N. 1996. Confined Animal Production and the ManureProblem. Choices. 11(3):18-21,24.
McCoy, E.L. and C. Hagedorn. 1979. Water, Air, and Soil Pollution, 11:467.
Morrison, S.M. and K.L. Martin. 1977. Pathogen survival in soils receiving waste. In:R.G. Loer (ed.) Land as a Waste Management Alternative. Proc. 1976 CornellAgric. Waste Management Conf. Cornell Univ., Ithica, NY. pp. 371-389.
Peterson, T.C., and R.C. Ward. 1989. Development of a bacterial transport model forcoarse soils. Water Resource Bulletin, 25:349-357.

17
Reynolds, P.J., P. Sharma, G.E. Jenneman, and M.J. McInerney. 1989. Mechanisms ofmicrobial movement in subsurface materials. Applied EnvironmentalMicrobiology, 55:2280-2286.
Robbins, J.W., G.J. Kriz and D.H. Howells. 1971. Quality of effluent from farm animalproduction sites. In: Livestock Waste Management and Pollution Abatement.Proc. 2nd. Inter, Symp. On Livestock Wastes, ASAE Pub. Proc. 271, St. Joseph,MI 49085, pp. 166-169.
Scholl, M.A., A.L. Mills, J.S. Herman, and G.M. Hornberger. 1990. The influence ofmineralogy and solution chemistry on the attachment of bacteria to representativeaquifer minerals. Journal of Contaminant Hydrology, 6:321-336.
Sharma, M.M., Y.I. Chang, and T.F. Yen. 1985. Reversible and irreversible surfacecharge modifications for facilitating transport through porous media. ColloidsSurf., 16:193-206.
Yates, M.V. and S.R. Yates. 1988. Modeling microbial fate in the subsurfaceenvironment. CRC Crit. Rev. Environ. Control, 12:307-343.
18
APPENDIX
Figure 12. Positioning tubing for soil column extraction with the Giddings probe.
Figure 13. Measuring the soil column for compaction.

19
Figure 14. Spring soil columns in the leachate collection apparatus.

20
Table 4. Bacterial densities in spring soil column leachate for event 1.
Event 1 Fecal Coliform E.coli Enterococci VolumeColumn (CFU/100ml) (CFU/100ml) (CFU/100ml) (ml)Spring control 1 <1 <1 <10 300Spring control 1 <1 <1 2 300Spring control 2 <10 <10 1 400Spring control 2 8 10 <1 300Spring control 3 <1 <1 5 300Spring control 3 <1 <1 31 300Spring 1X 1 580,000 640,000 32 300Spring 1X 1 600,000 610,000 48 300Spring 1X 2 530,000 500,000 30 250Spring 1X 2 520,000 570,000 24 300Spring 1X 3 550,000 570,000 66 400Spring 1X 3 590,000 460,000 58 300Spring 2X 1 1,000,000 960,000 52 300Spring 2X 1 1,000,000 990,000 70 300Spring 2X 2 990,000 1,000,000 150 350Spring 2X 2 700,000 680,000 86 300Spring 2X 3 510,000 420,000 152 450Spring 2X 3 460,000 440,000 110 300
Table 5. Bacterial densities in spring soil column leachate for event 2.
Event 2 Fecal Coliform E.coli Enterococci VolumeColumn (CFU/100ml) (CFU/100ml) (CFU/100ml) (ml)Spring control 1 <1 <1 83 325Spring control 2 <1 <1 <2 330Spring control 3 <1 <1 <10 440Spring 1X 1 98,000 190,000 440 301Spring 1X 2 85,000 210,000 100 480Spring 1X 3 57,000 62,000 55 325Spring 2X 1 220,000 240,000 150 500Spring 2X 2 77,000 170,000 160 420Spring 2X 3 22,000 57,000 20 400
*Leachate samples from spring columns were divided by time of collection for event 1 in order to detectbacterial changes between first and final flushes within the event. None were detected and samples werecomposited for the remaining events.

21
Table 6. Bacterial densities in spring soil column leachate for event 3.
Event 3 Fecal Coliform E.coli Enterococci VolumeColumn (CFU/100ml) (CFU/100ml) (CFU/100ml) (ml)Spring control 1 <2 <2 2 198Spring control 2 <1 <1 <1 320Spring control 3 <1 <1 <1 520Spring 1X 1 1000 3000 <10 395Spring 1X 2 6300 9900 27 475Spring 1X 3 6400 17,000 <10 195Spring 2X 1 2700 2700 650 500Spring 2X 2 21,000 25,000 110 415Spring 2X 3 5500 9100 50 480
Table 7. Bacterial densities in spring soil column leachate for event 4.
Event 4 Fecal Coliform E.coli Enterococci VolumeColumn (CFU/100ml) (CFU/100ml) (CFU/100ml) (ml)Spring control 1 <2 <2 7 180Spring control 2 <1 <1 <1 280Spring control 3 <1 <1 <1 440Spring 1X 1 1300 1000 <10 170Spring 1X 2 2500 1800 82 350Spring 1X 3 1500 1300 <10 50Spring 2X 1 2000 1900 80 360Spring 2X 2 5200 5000 3400 140Spring 2X 3 15,000 16,000 <10 240
Table 8. Bacterial densities in fall soil column leachate for event 1.
Event 1 Fecal Coliform E.coli Enterococci VolumeColumn (CFU/100ml) (CFU/100ml) (CFU/100ml) (ml)Fall control 1 <3 <3 <3 980Fall control 2 <1 <1 <1 820Fall control 3 <1 <1 10 720Fall 1X 1** 4,800,000 3,700,000 1200 780Fall 1X 2 690,000 650,000 60 740Fall 1X 3 430,000 370,000 70 680Fall 2X 1 890,000 900,000 310 780Fall 2X 2 650,000 900,000 73 790Fall 2X 3 420,000 360,000 30 920
22
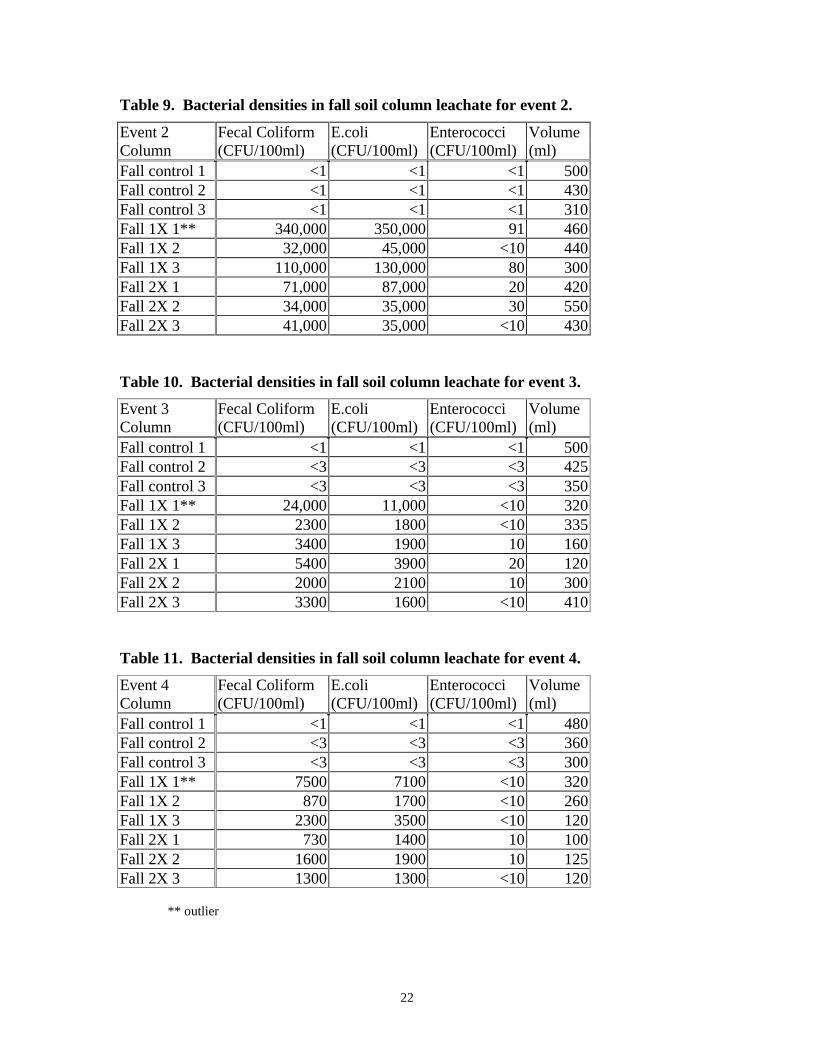
Table 9. Bacterial densities in fall soil column leachate for event 2.
Event 2 Fecal Coliform E.coli Enterococci VolumeColumn (CFU/100ml) (CFU/100ml) (CFU/100ml) (ml)Fall control 1 <1 <1 <1 500Fall control 2 <1 <1 <1 430Fall control 3 <1 <1 <1 310Fall 1X 1** 340,000 350,000 91 460Fall 1X 2 32,000 45,000 <10 440Fall 1X 3 110,000 130,000 80 300Fall 2X 1 71,000 87,000 20 420Fall 2X 2 34,000 35,000 30 550Fall 2X 3 41,000 35,000 <10 430
Table 10. Bacterial densities in fall soil column leachate for event 3.
Event 3 Fecal Coliform E.coli Enterococci VolumeColumn (CFU/100ml) (CFU/100ml) (CFU/100ml) (ml)Fall control 1 <1 <1 <1 500Fall control 2 <3 <3 <3 425Fall control 3 <3 <3 <3 350Fall 1X 1** 24,000 11,000 <10 320Fall 1X 2 2300 1800 <10 335Fall 1X 3 3400 1900 10 160Fall 2X 1 5400 3900 20 120Fall 2X 2 2000 2100 10 300Fall 2X 3 3300 1600 <10 410
Table 11. Bacterial densities in fall soil column leachate for event 4.
Event 4 Fecal Coliform E.coli Enterococci VolumeColumn (CFU/100ml) (CFU/100ml) (CFU/100ml) (ml)Fall control 1 <1 <1 <1 480Fall control 2 <3 <3 <3 360Fall control 3 <3 <3 <3 300Fall 1X 1** 7500 7100 <10 320Fall 1X 2 870 1700 <10 260Fall 1X 3 2300 3500 <10 120Fall 2X 1 730 1400 10 100Fall 2X 2 1600 1900 10 125Fall 2X 3 1300 1300 <10 120
** outlier