Embed Size (px)
Citation preview

Titlestad, J. and Fairlie-Clarke, T. and Whittaker, A. and Davie, M. and Watt, I. and Grant, S. (2006) Effect of suspension systems on the physiological and psychological responses to sub-maximal biking on simulated smooth and bumpy tracks. Journal of Sports Sciences 24(2):pp. 125-135.
http://eprints.gla.ac.uk /2779/
Glasgow ePrints Service http://eprints.gla.ac.uk

EFFECT OF SUSPENSION SYSTEMS ON THE PHYSIOLOGICAL AND PSYCHOLOGICAL RESPONSES TO SUB-MAXIMAL BIKING ON SIMULATED SMOOTH AND BUMPY TRACKS
J. Titlestad, A. Fairlie-Clarke, A. Whittaker, M. Davie, I. Watt* and S. Grant*
Department of Mechanical Engineering, University of Glasgow *Institute of Biomedical and Life Sciences, University of Glasgow
RUNNING TITLE: Effect of suspension systems during sub-maximal cycling on mountain bicycles.
Published in Journal of Sport Sciences, February 2006: 24(2): 125-135
Correspondence: A.Whittaker Department of Mechanical Engineering James Watt Building University of Glasgow Glasgow G12 8QQ UK
Telephone number: 0141-330-5044 Fax: 0141-330-4343 e-mail: [email protected]
EFFECT OF SUSPENSION SYSTEMS ON THE PHYSIOLOGICAL AND PSYCHOLOGICAL RESPONSES TO SUB-MAXIMAL BIKING ON SIMULATED SMOOTH AND BUMPY TRACKS
ABSTRACT
The aim of this study was to compare the physiological and psychological responses of cyclists riding on a hard tail (HT) bicycle and on a full suspension (SU) bicycle. Twenty male subjects participated in two series of tests. A test rig held the front axle of the bicycle steady while the rear wheel rotated against a heavy roller with bumps (or no bumps) on its surface. In the first test series, eight subjects (age 19-27 years, body mass 65-82 kg) were tested on both the SU and HT bicycles with and without bumps fitted to the roller. The second test series repeated the bump tests with a further six subjects (age 22-31 years, body mass 74-94 kg) and also involved an investigation of familiarisation effects with the final six subjects (age 21-30 years, body mass 64-80 kg). Heart rate (HR), oxygen consumption ( V ), rating of perceived exertion (RPE) and comfort were recorded during 10 min sub-maximal tests. Combined data for the bumps tests show that the SU bicycle was significantly different (P<0.001) from the HT bicycle on all four measures. V , HR and RPE were lower on average by 8.7, s=3.6 ml.kg
2O&
2OV&
2O&-1.min-1, 32.1, s=12.1 beats.min-1 and 2.6,
s=2.0 units respectively. Comfort scores were higher (better) on average by 1.9, s=0.8 units. For the no bumps tests, the only statistically significant difference (P=0.008) was in , which was lower for the HT bicycle by 2.2, s= 1.7 ml.kg-1.min-1. These data indicate that the SU bicycle provides a physiological and psychological advantage over the HT bicycle during simulated sub-maximal exercise on bumps.
Keywords Bicycle suspension, cycling, biodynamics, mountain bikes, sports engineering.
INTRODUCTION
Off-road cycling, or mountain biking, has developed as an important element of the sport of cycling in the last 20 years. It gained international recognition from the Union Cycliste Internationale (U.C.I.) in 1991 and became an Olympic sport in 1996 (U.C.I. 2001). A significant distinction between competition bicycles is whether or nor they have a suspension system. There are three categories. A rigid frame (RF) mountain bicycle has no suspension, a hard tail (HT) mountain bicycle has a front wheel suspension only and a full suspension (SU) mountain bicycle has front and rear wheel suspensions. Generally, professional cross-country cyclists have not ridden full suspension bicycles.
The potential benefits of a full suspension system on rough terrain are reduced energy cost by the rider (or higher speed for a given energy cost) and better handling and comfort. The work reported in this paper is concerned primarily with an experimental and analytical investigation of the physiological responses of cycling on the SU and HT bicycles. Previous work, in which this issue has been examined, can be divided into analytical studies, laboratory experiments and field experiments.
Analytical studies have focused on the energy lost as heat though the damping action of the suspension system. This action is relevant because it represents an inherent inefficiency associated with suspension systems that must be offset by the advantages of the system before a net gain is realised. Wang & Hull (1996) showed that a rear suspension system can dissipate as heat as much as 1.3% (6.9 W) of the input power of the cyclist due to the
1

compressions that result from the cyclic loading of the pedals. They also showed (Wang & Hull, 1997) that the average power loss can be reduced from 6.9 to 1.2 W by optimising the pivot point of a single pivot suspension system.
Laboratory experiments were used by Berry et al. (1993) to study the potential gains from using a suspension system. These authors attached a 38 mm high bump to the belt of a power driven treadmill angled at a 4% slope. Frequency of encounter with the bump was 0.7 Hz at the test speed of around 10 km.hr-1. No constraints were applied to the bicycles. Subjects were tested on bicycles with no suspension system, with a front suspension system, with a rear suspension system and with a full suspension system. The results showed advantages from using the suspension systems, but some inconsistency. When ridden over bumps, the full suspension bicycle resulted in significantly lower oxygen consumption ( V ) compared to the rigid frame, but no significant difference in heart rate (HR), whereas the rear suspension only bicycle gave a significantly lower HR but no significant difference in .
2O&
2OV&
A number of field tests have been conducted using constant speed tests and maximum exertion time trials. Seifert et al. (1997) used both constructed bumpy tracks and actual mountain bike trails. The constructed track was flat with 50 mm high bumps encountered at a frequency of 0.5 Hz at the test speed of 16.1 km.h-1. Measurements of HR, and the 24 h change in creatine kinase were recorded with subjects riding RF, HT and SU bicycles. The HR and the 24 h change in creatine kinase were significantly higher for the RF bicycle, with a trend for higher . Time trials were also conducted with the three bicycles on ascending, descending and cross-country trails. The only significant difference found between the bicycles was on the cross-country trail where the HT bicycle was faster.
2OV&
2OV&
MacRae et al. (2000) conducted up hill time trials on an ‘on road’ asphalt course and on an ‘off road’ course to compare performance of a front suspension bicycle and a dual suspension bicycle. These authors found that there was no significant difference in performance times or physiological measurements, but the power transmitted through the pedals on the full suspension bicycle was significantly (P < 0.001) higher than on the front suspension bicycle.
This review of published work shows that some advantages can be expected using suspension systems on bumpy tracks, but the results are not conclusive and there is some disagreement between test evidence, time trials and race results (Graves 2000). There is a need for a comparison of the physiological and psychological responses of cyclists riding on a HT bicycle and on a SU bicycle.
The aim of this study was to compare the physiological and psychological responses of cyclists riding a HT bicycle and a SU bicycle on level surfaces with and without bumps. The freedom of movement of the bicycle and rider were reduced as far as possible and the roughness of the track was exaggerated so that any differences between the bicycles would be highlighted. A laboratory-based test was chosen so that the actions of the riders (such as not standing up out of the saddle) could be controlled while the dynamics of the bicycle/suspension/rider system could be simulated as closely as possible and physiological, psychological and dynamic measurements could all be recorded.
This paper reports on the conduct of the tests, and the results and analysis of the measured physiological and psychological responses of the riders. Results from the analytical studies and the dynamic mechanical measurements taken during the tests are reported by Titlestad et al (2003a).
1

METHODS
Subjects A total of twenty male subjects participated in the two series of tests. The eight subjects in the first test series were aged between 19 and 27 years (mean 22.3, s = 2.5) and their body masses ranged from 65 kg to 82 kg (mean 73.0, s = 6.1). The twelve subjects in the second test series were aged between 21 and 31 years (mean 24.1, s = 3.2) and their body masses ranged from 64 to 94 kg (mean 76.3, s = 7.6). All the subjects undertook regular aerobic exercise, either cycling or activities such as running and ball games. They all gave informed consent and the study was approved by the local ethics committee.
Test Rig Trials on a standard powered treadmill have limitations because the inertia effects are not accurately simulated and the rider must exert considerable control simply to keep the bike on the treadmill. This can be a stressful task and may affect the physiological results. These limitations were overcome and the variables that might affect the results considerably reduced by using a test rig that holds the bicycle steady while the rear wheel drives a heavy roller with bumps on its surface. The same standard configuration was used with all subjects, except that the riding speed was varied to ensure that all subjects operated at a sub-maximal exercise level where the physiological variables could be shown to have stabilised.
INCLUDE FIGURE 1 AROUND HERE.
The test rig arrangement is shown in figure 1. The design of the test rig is described in detail by Titlestad et al (2003b). The main components of the test rig are the roller, the front axle support bracket and the framework that supports them. The front wheel of the bicycle is replaced by an axle that is held in a fixed position by the front bracket of the test rig such that the bicycle is free to rotate about this axle. Lateral support for the front forks is provided by arms that are pivoted on the axle axis and connected to the brake stanchions. This arrangement allows normal operation of the front suspension system.
A feature of the design is that the force required at the rear wheel to effect a change in the speed of the roller is the same as the force required to change the speed of the bicycle and rider in normal operation on a track. This occurs because the inertial effect of the roller matches the mass inertia of the bicycle and rider. Calculations show that a steel roller with diameter of 0.61 m and inertia of 8.21 kg.m2 matches the average subject mass of 74 kg and bike mass of 12.5 kg. The roller inertia is constant, so lighter subjects have to do slightly more work than they would on the road and heavier subjects slightly less, but the effect is the same on both bicycles so it cancels out when differences are calculated. The SU bicycle is about 1.2 kg heavier than the HT bicycle, so requires about 1.4% more force to accelerate on the road, but this is not simulated.
The roller surface was covered by a carpet to simulate softer ground and two bumps were fitted to the roller for the bump tests. These were 30 mm high by 70 mm long and had an equivalent linear spacing of 0.96 m. Preliminary tests showed this to be the largest bump size that riders could tolerate without becoming too uncomfortable. Resistance was provided primarily by the rolling resistance of the tyre on the carpet and the bumps. The bumps were removed for the ‘no bump’ tests and a weighted friction belt was wrapped over the roller to provide an equivalent resistance to the bumps. This was set by adjusting
2

the friction belt so that the time for the bicycle wheel and roller to come to a rest from typical test speeds was as close as possible to the time for the SU bicycle with bumps on the roller. The same friction setting was used for all subjects.
The Bicycles
Two mountain bicycles were acquired on loan for the tests. These were of the same design, except that one had an oil damped coil spring rear suspension system (Marin Mt. Vision) and one was a hard tail (Marin Rocky Ridge). Both bicycles were fitted with the same oil damped coil spring front shock absorbers (Manitou Magnum R), with the setting for pre-load and damping kept the same throughout the tests. The same rear wheel (Shimano XT hub, Mavic 222 rim and Marin Quake 7.1 XC tyre) was used in all the tests and the tyre pressure was kept constant at 3.4 bar. The mass of the SU bicycle was 13 kg and the HT bicycle 11.8 kg.
Instrumentation
Wheel, Crank & Roller Speed
A Cat Eye Velo 2 cyclometer, driven from the rear wheel, was fitted to the handlebars of each bicycle in a position that could be easily observed by the rider. Rotational velocities of the crank set and of the roller were measured using optical sensors and discs. The output frequency from the disc was converted to a voltage using a frequency to voltage converter chip. In the case of the crank set sensor, this was attached to the circuit board mounted on the base of the bottom bracket. This voltage was amplified by a factor of 2000 before being transmitted via the slip ring to the data logger, thus greatly reducing the effect of the noise generated by the slip rings.
Heart Rate
A Polar Favor heart rate monitor (Polar Heart Rate Monitor, Kempele, Finland) was used to monitor the heart rate of the subjects.
Oxygen Consumption ( ) 2OV&
Gas samples were collected using a two-way Hans Rudolph 2700 mouthpiece (Hans Rudolph, Kansas, USA), tubing and Douglas bags. All the subjects wore a nose clip. The expired air was analysed using a Servomex 570A O2 analyser (Servomex, Crowborough, UK) and a PK Morgan TD 801A CO2 analyser (Morgan, Rainham, UK). Both analysers were calibrated before testing with gases of known concentrations. Gas volumes were measured using a Harvard (Cranlea, Birmingham, UK) meter. Repeatability within 5% is achieved through good laboratory practice. Standard formulae were used to calculate O2 consumption and CO2 production (McArdle et al., 2001).
Rating of Perceived Exertion (RPE)
Rating of Perceived Exertion was measured using the Borg (1982) scale ranging from very, very light at level 6 to very, very hard at level 20. The scale was displayed in front of the subject who was asked to point to the number that best described the current level of exertion.
3
Comfort Rating
Comfort was assessed using the scale outlined by Seifert et al (1997). The scale ranges from very uncomfortable at level 1 to very comfortable at level 5. The scale was displayed on a board in front of the subject who was asked to point to the number that best described the current level of overall comfort.
Run Down Tests These were undertaken with two subjects with body masses of 64 kg and 72 kg respectively. The bicycles were set up in the standard test configuration and ridden to a speed in excess of 15 km.h –1. The subjects then held the pedals stationary and remained passively seated until the bicycle came to a rest. The decay in the roller speed was electronically recorded against time. The tests were carried out on both bicycles with bumps fitted to the roller and with the bumps removed and the friction belt fitted.
First Test Series In the first test series, each subject was tested on both the SU and the HT bicycles, both with and without bumps fitted to the roller. The friction belt was applied to the roller for the tests without bumps so that there was sufficient resistance to give a work rate similar to that during the bump tests.
Each subject attended the laboratory at the same time of day for all tests. A random choice was made as to which of the two bicycles each subject would ride first. The saddle height was set so that the subject's leg was straight with the heel on the pedal at its lowest position. The first test included a familiarization session during which the subject was instructed on the use of the measuring equipment and the RPE and comfort scales and then asked to cycle at a speed between 10 and 15 km.h-1 that could be maintained comfortably for ten minutes and would give bump encounter frequencies in the range 2.9 Hz to 4.0 Hz. To allow for different riding styles, the cyclists were permitted to ride in the rear gear of their choice, but the attachment of measuring equipment meant that only the middle gear (32 teeth) of the front chain ring could be used. This established a test speed and a gear ratio to be used for all tests with that subject
The subject was instructed to remain seated on the bicycle at all times during the tests to ensure that the body mass was primarily supported through the suspension system and not by the legs, which might otherwise be used to absorb the movements caused by bumps. This also helped to minimise inertial effects associated with body movements that could affect the operation of the suspension and the horizontal force equilibrium.
The subjects were allowed 60 seconds to attain their chosen test speed at the start of each test, which then continued for ten minutes while readings and samples were taken. The subjects were required to maintain the test speed to within 0.5 km.h-1 during all their tests. They did this by observing the cyclometer, which gives a smoothed output of speed. The electrical feedback of roller speed was observed by the researcher during the tests and the subject was prompted to adjust speed if necessary. Plots of roller speed confirmed that the target speeds were maintained. Recordings of HR were taken at one-minute intervals by observing the HR display for a number of seconds to confirm that a steady reading was obtained. Only HR recordings taken at the same time as the expired air sampling times are reported in the paper. One-minute samples of expired air were collected during the ninth and tenth minute in all tests and also during the fifth and sixth minute during the second test series. The RPE and comfort scales were recorded at the third, sixth and ninth minute into each test.
4
Second Test Series In the second test series, six subjects were tested riding on both the SU and the HT bicycles with bumps fitted to the roller. The procedure adopted was the same as for the first test series.
A further six subjects were tested to investigate for any practice or familiarization effect. These subjects were tested three times on the same bicycle with a minimum of two days between tests. Three subjects were tested on the HT bicycle and three on the SU bicycle. Bumps were fitted to the roller and the same test procedure was used.
Statistical analysis The primary requirement was to establish whether there was a statistically significant difference between results on the HT and SU bicycles. The null hypothesis two-tailed dependent paired ‘t’ test was applied to the differences between the measurements recorded for the HT and SU bicycles. The null hypothesis is that there was no difference between the bicycles and the P values indicate the confidence level at which the null hypothesis can be rejected. The 95% confidence limits and the effect size are also given to show that the difference between bicycles is meaningful. In the first test series, both the type of suspension and the type of surface (bumps or no bumps) were varied, so a two-factor analysis of variance was performed on these data.
Other issues were whether steady state conditions were achieved for the duration of each test, whether there was any practice, or familiarization, effect and whether the results from the first and second test series were equivalent. The first of these issues was investigated by applying a repeated measure analysis of variance to the measurements made at intervals during the tests. The second was investigated by applying the same type of analysis to the measurements made during three repetitions of the tests with the same subjects, and the last by an analysis of variance of the differences between the HT and SU bicycles in the first and second test series. In all these tests, the null hypothesis is that there is no difference between the means and large values of P indicate this desired outcome. The mean values are also given and the effect size between each pair of means was calculated since if the differences between the means are small this indicates that there is little variation between the means, even if the P values are low. RESULTS
Run Down Tests
Figure 2 shows the results recorded during the run down tests with two subjects riding both bicycles on bumps and on the smooth roller fitted with the friction belt. The four results on the smooth roller are all very close, with a standard deviation of 0.23 km.h-1. These are averaged and plotted as a single smooth line.
INCLUDE FIGURE 2 AROUND HERE.
Measurement Stability Table 1 shows the results of the repeated measure analysis of variance performed on the four measurements of and HR and the three measurements of RPE and Comfort taken during each of the 15 subject tests on each of the bicycles during the second test
2OV&
5

series to investigate the extent to which steady state conditions were achieved during each test.
INCLUDE TABLE 1 AROUND HERE
Practice / Familiarisation Effect A repeated measures one-way analysis of variance was performed on the second test series data to examine for any practice or familiarisation effect. Three subjects were tested on each bicycle on three separate occasions. The ‘P’ values obtained are shown in table 2 together with the mean and standard deviation of the values recorded for the three subjects on each test.
INCLUDE TABLE 2 AROUND HERE
Equivalence of First and Second Test Series An analysis of variance was used to determine if the differences between the bikes in the second series were different from those in the first series. The P values for , HR, RPE and Comfort were 0.64, 0.41, 0.06 and 0.93 respectively.
2OV&
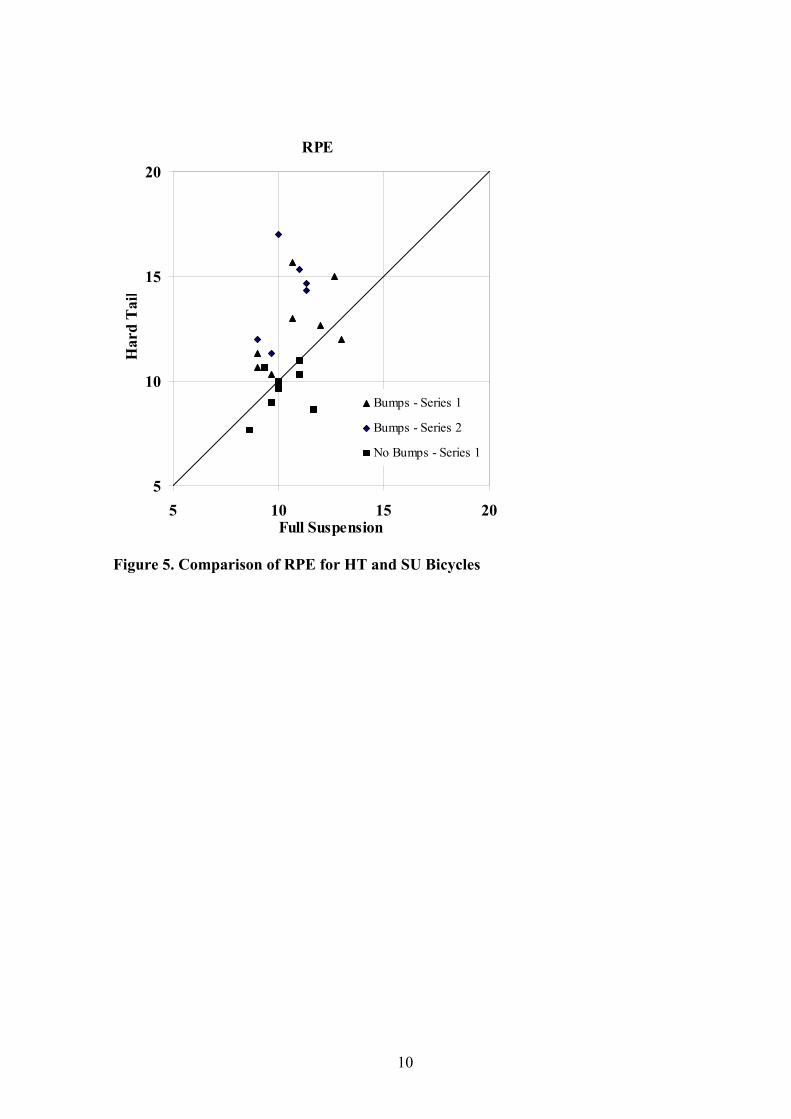
Comparison of HT and SU bicycles The representative test values from test series 1 and 2 are plotted in figures 3 to 6 to provide a comparison between the measurements taken with the HT and SU bicycles. Each point represents one subject with the value recorded on the HT bicycle given on the vertical axis and the value recorded on the SU bicycle given on the horizontal axis. Points above the equality line indicate higher readings for the HT bicycle.
INCLUDE FIGURES 3 TO 6 AROUND HERE
Differences between HT and SU bicycles The null hypothesis two-tailed dependent paired ‘t’ test was applied to calculate the probability that the differences measured between the HT and SU bicycles are purely the result of chance. The data from the first and second test series were analysed separately and as a combined data set since the test conditions were identical. The results are shown in table 3. Low probabilities (P) indicate that the measured effect in the sample is evidence of a real effect in the population. The size of the differences is indicated by the 95% Confidence Limits and by the Effect Size, calculated using the pooled standard deviation.
INCLUDE TABLE 3 AROUND HERE
The mean values from the two-factor analysis of variance are shown in table 4. The analysis shows that there are significant differences (P < 0.05) between suspensions and between bumps on all measures except for the RPE between suspensions where P = 0.25.
INCLUDE TABLE 4 AROUND HERE
6
DISCUSSION
Run down tests In the run down tests, the line for the smooth roller is very close to the two lines for the SU bicycle on bumps, showing that the resistance exerted by the friction belt is close to that experienced by the SU bicycle when negotiating the bumps. The run down times of the HT bicycle are significantly shorter, indicating that it experiences more resistance than the SU bicycle when negotiating the bumps. The slope of the curves in figure 2 is a measure of the deceleration of the bicycle during the run down test, and multiplying the deceleration by the combined mass of the subject and the bicycle gives an estimate of the resistance force acting to slow down the bicycle. The resistance acting against the SU bicycle on the smooth roller (with friction belt) and on the bumps is calculated in this way to be 32 N, while that acting against the HT bicycle on bumps is 46 N. Thus, there is 44% more resistance acting against the HT bicycle than the SU bicycle. At a speed of 12 km.h-1, this represents the expenditure of an additional 50 W of energy.
Measurement stability
Table 1 shows that there is no significant difference in the physiological ( and HR) measurements taken at intervals during a test on the HT bicycle, but on the SU bicycle there is a significant difference in both. However, the effect sizes (around 0.3 and less) show that the differences in the mean values are actually quite small. The largest effect size of 0.52 occurs between the measurements on the SU bicycle at minutes 5 and 6. This indicates a moderate difference, but the mean values show that there is no consistent trend through the duration of the tests and the mean of the last two readings (in the 9
2OV&
2OV&
th and 10th minutes) provides a good representative value for the tests and is therefore used for comparisons and analysis.
The psychological measurements show highly significant differences between the three measurements taken during each test. The effect sizes of around 0.5 indicate a moderate effect. The largest effect size of 0.9 occurs between the RPE values at minutes 3 and 9 on the SU bicycle. The mean values show that there is a consistent trend for the RPE values to increase and for the comfort values to decrease. The subjects become increasingly conscious of their exertion and discomfort as the test progresses, even though and HR do not increase. The mean of the three readings is used to provide a single representative test value for comparison and analysis purposes.
2OV&
Practice / Familiarisation effect
Table 2 shows that there is no significant practice or familiarisation effect. The size effects between the means vary from 0.08 up to 1.3. The largest values are for the mean RPE values on the SU bicycle between tests 1 and 2 and between tests 1 and 3. Values of 1.3 indicate large size effects, but the P values show that they are not statistically significant. These results are based on tests with only three subjects, but an overview of the mean values shows that there is no consistent trend from test 1 to test 3. The results of single tests with each subject on each bicycle can therefore be deemed to be representative for a given condition.
7

Equivalence of first and second test series The P values from the analysis of variance show that the differences between the two suspension systems measured in the two test series do not vary significantly except for RPE. There is considerable scatter in the RPE measurements and the difference between the tests is largely accounted for by just two measurements. It is considered that this result reflects the variability of the psychological test measurements rather than any fundamental difference between the two tests.
The second test series reinforces the findings of the first test series and the combined results are treated as a composite set.
Comparison of HT and SU bicycles For the tests with bumps on the roller, the results in figures 3 to 6 show higher values of
, HR and RPE for all subjects (except one value of RPE) when riding the HT bicycle in comparison to the SU bicycle for both test series. Comfort levels are either the same on both bicycles, or better on the SU.
2OV&
For tests with the smooth roller (no bumps), the points are closer to the equality line. is significantly higher for the SU bicycle while there is a trend for HR and RPE to be higher for the SU bicycle and for Comfort to be lower.
2OV&
The mean values of each of the variables measured during the no bump tests with both bicycles are similar to those from the bump tests with the SU bicycle. This shows that the work rate to overcome the drag caused by the friction belt on the roller in the no bump tests is similar to that required to overcome the resistance to progress of the SU bicycle caused by the bumps.
Differences between HT and SU bicycles The P (table 3) values of the differences between the HT and SU bicycles for the bump tests are all very low, indicating that there are real differences between the HT and SU bicycles. The Effect Size varies from 1.0 to 4.7, indicating that these are meaningful differences. Based on the combined bump test results, the HT bicycle requires a between 6.6 and 10.8 ml.kg2OV& -1.min-1 (30% to 50%) greater than the mean of 22 ml.kg-
1.min-1 for the SU. The HR increases by between 25 and 39 beats.min-1 (23% to 36%) compared to the mean of 110 beats.min-1 for the other conditions. The RPE increases from ‘very light’ to bordering on ‘somewhat hard’ and the perceived comfort deteriorates from ‘fairly comfortable’ to ‘very uncomfortable’.
The analysis of the no bump tests indicates that there is little difference between the HT and SU bicycles. The only significant difference is between the V measurements, with the HT results lower than the SU by a mean of 2.2 ml.kg
2O&-1.min-1. The mean values of the
differences of the other three measures also favour the HT bicycle. This is not a significant effect, but it does indicate a trend.
Other comments The research area relates to the benefits of fitting suspension systems to mountain bicycles. It is taken as self-evident from the market success of these bicycles that there is a perceived benefit for recreational cyclists, at least in improved comfort. The benefit for competitive cyclists must be measured in terms of improved race times. This benefit is not self-evident and race results have not been conclusive (Graves 2000).
8

The long-term aim of the research programme is to obtain an improved understanding of the effect of suspension systems on comfort and exertion when riding a bicycle on rough surfaces. Because the findings from the literature were not conclusive, it was decided to isolate and exaggerate the effects for the first tests in the programme (as reported here). The frequency of encounter (2.9 Hz to 4.0 Hz over the range of speeds adopted by the subjects) and the severity of the bumps were set high and the number of variables were minimised (e.g. by requiring the subjects to remain seated in the saddle at all times). The tests were not therefore representative of race conditions, but it is important that an ongoing test programme should be grounded on consistent and conclusive test results and it was hoped that the test conditions chosen would provide these.
The run down tests show that there is 44% more resistance acting against the HT bicycle than the SU bicycle over bumps on level ground. Thus, it is to be expected that V and HR will be higher over bumps on the HT bicycle than on the SU bicycle. The tests confirm this, with the percentage increase in V (30% to 50%) and HR (23% to 36%) when riding the HT bicycle being of the same order as the increase in resistance. A cyclist on the HT bicycle has to operate at a higher level of exertion and also has to tolerate higher body accelerations. This is reflected in the significantly higher RPE values and lower Comfort values. Many of the subjects also commented that it required greater concentration to maintain the test speed on the HT bicycle.
2O&
2O&
This study has shown that, under constrained sub-maximal conditions with a severely bumpy track on level ground, all four measured variables show a significant and consistent advantage for the SU bicycle. The results confirm the general findings of Berry et. al. (1993) using a less bumpy track. However, the current tests under more extreme conditions have resulted in a decrease in both and HR using a suspension system, whereas Berry et al found a lower V but no change in HR.
2OV&
2O&
The results lead to a strong expectation that in a race over a track with frequent, large bumps the SU bicycle would provide a speed advantage, although the extra weight of the SU bicycle will slightly offset this advantage. The terrain of actual racetracks differs considerably from the test conditions and race times are determined by the choice of the exact path taken by the bicycle, the forces resisting the progress of the bicycle along that path and the power that the cyclists is able to exert for the duration of the race. These are complex dynamic issues influenced by the riding style of the cyclist, which may account for the poor correlation between results of controlled experiments on bicycles with suspension systems and race results. Time trials by Seifert et al (1997) and race results show that there is not a clear advantage for SU bicycles on actual trails and, indeed, HT bicycles may have the edge. Further studies must now address how the advantages found in the current tests are modulated as the constraints are removed, track conditions made more realistic and maximal effort conditions reproduced. The next stage is to replace the roller by a treadmill that will still correctly simulate inertial effects when driven by the rider, but will allow the bumps to impact with both wheels. Bump spacing and bicycle speeds will be increased. Time trials on the treadmill will be compared with times on an equivalent outdoor track.
Mountain bicycle racetracks are very varied with some sections where the SU bicycle probably has an advantage and others that favour the HT bicycle. The advent of bicycles with adjustable suspension systems will allow riders and team mechanics to set-up the bicycle before a race for optimum performance, or to tune the suspension to suit different
9

parts of the trail during the race by adjusting spring and damper rates. Data that can help achieve an optimum configuration will be valuable. The control exerted by the rider over the bicycle is likely to prove a critical factor and further research should explore whether particular riding styles need to be adopted to realise the best performance from different types of bicycle, whether these can be categorised and whether riders can optimise their riding technique through training.
Limitations of the study It is recognised that the bumps used on the roller in this study simulated a severely bumpy track that is unlikely to be encountered on an actual mountain bike trail. However, it was considered that the use of a very bumpy roller would enable any differences between the SU and HT bikes to be clearly isolated and identified, although the very large differences between the SU and HT bicycles for HR, , RPE and Comfort may not be present in less bumpy situations as on a mountain bike trail.
2OV&
It is acknowledged that the number of subjects used to assess if there was a practice or familiarisation effect was small. However, the P values in table 2 are high and provide confidence that a single test of each subject with each bicycle is representative of a given test condition and that the findings are reliable.
CONCLUSIONS
The findings of this study indicate that there is a substantially greater physiological cost during sub-maximal exercise under the test conditions when riding the HT bicycle compared to the SU bicycle. In addition, the riders perceive the effort to be greater on the HT and the comfort less. Thus, the HT bicycle both requires a greater physiological cost and is more stressful mentally to ride than the SU bicycle. For the no bumps tests, V was found to be slightly lower for the HT. These differences have been demonstrated during sub-maximal exercise with severe and frequent bumps on level ground. Further tests will be required to determine the effects under maximal exercise conditions and to quantify the effect of bump size and spacing so that the results can be related to more realistic race conditions.
2O&
10
REFERENCES
Berry, M., Woodard, C., Dunn, C., Edwards, D. and Pittman, C. (1993). The effects of a mountain biking suspension system on metabolic energy expenditure. Cycling Science, spring issue, 8-14.
Borg, G.A.V. (1982). Psychophysical bases of perceived exertion and pain scale. Medicine & Science in Sports & Exercise, 14, 377-81.
Graves, P. (2000). Olympic preview. Mountain Biker International, 61, 62-64.
MacRae, H-S., Hise, K. and Allen, P. (2000). Effects of front and dual suspension mountain bike systems on uphill cycling performance. Medicine & Science in Sports & Exercise, 32, 1276-1280.
McArdle, W., Katch, F. and Katch, V. (2001). Exercise physiology: energy, nutrition, and human performance, 4th edition, Williams and Wilkins, London.
Seifert, J., Luetkemeier, M., Spencer, M., Miller, D. and Burke, E. (1997). The effect of mountain bike suspension systems on the energy expenditure, physical exertion, and time trial performance during mountain bicycling. International Journal of Sports Medicine, 18, 197-200.
Titlestad, J., Whittaker, A, Fairlie-Clarke, A.C., Davie, M.. and Grant, S. (2003a). Numerical and Experimental Simulation of Mountain Bike Suspension Systems Subject to Regular Impact Excitation. In Proceedings of Fifth International Conference on Modern Practice in Stress and Vibration Analysis, pp. 111-118. Glasgow: Trans Tech Publishing Ltd., Uetikon-Zuerich.
Titlestad, J., Fairlie-Clarke, A.C., Davie, M., Whittaker, A. and Grant, S. (2003b). Experimental Evaluation of Mountain Bicycle Suspension Systems. Acta Polytechnica, 43(5), 15-20.
U.C.I. (2001). About mountain biking, http://www.uci.ch/english/mtb/what_is.htm.
Wang, E. and Hull, M. (1996). A model for determining rider induced energy losses in bicycling suspension systems. Vehicle System Dynamics, 25, 223-246.
Wang, E. and Hull, M. (1997). Minimization of pedaling induced energy losses in off-road rear suspension systems. Vehicle System Dynamics, 28, 291-306.
1

Legend
Tables Table 1. Analysis of stability of measurements during tests.
Table 2. Analysis of practice effect tests.
Table 3. Pairwise comparison of HT and SU bicycles.
Table 4. Mean values from two-factor ANOVA.
Figures Figure 1. Test rig arrangement (reproduced with permission of J.Titlestad©)
Figure 2. Run down times
Figure 3. Comparison of V for HT and SU Bicycles 2O&
Figure 4. Comparison of Heart Rate for HT and SU Bicycles
Figure 5. Comparison of RPE for HT and SU Bicycles
Figure 6. Comparison of Comfort for HT and SU Bicycles
2

Average across subjects at time:
Measure Bike P 3 min. 5 min. 6 min. 9 min. 10 min.
2OV& ml.kg-1.min-1
HT 0.91 32.3
32.6
32.1
32.1
2OV& ml.kg-1.min-1
SU 0.008 20.6
22.9
21.7
21.5
HR beats.min-1
HT 0.47 154.2
152.3
153.7
153.7
HR beats.min-1
SU 0.045 120.3
119.5
121.8
119.8
RPE HT <0.001 11.3 12.1 12.6 RPE SU <0.001 9.9 10.8 11.3
Comfort HT 0.001 2.6 2.3 1.9 Comfort SU 0.024 3.7 3.4 3.3
Table 1. Analysis of stability of measurements during tests.
Average and standard deviation of recordings for three subjects for test number
Measure Bike P 1 2 3
2OV& (ml.kg-1.min-1) HT 0.88 32.9, s=5.0 32.7, s=4.7 32.1, s=5.5
2OV& (ml.kg-1.min-1) SU 0.92 20.6, s=3.1 20.3, s=4.2 20.7, s=4.0
HR (beats.min-1) HT 0.90 155.7, s=16.2 159.8, s=9.3 158.8, s=7.8
HR (beats.min-1) SU 0.57 119.5, s=16.6 121.5, s=17.5 126.7, s=10.7 RPE HT 0.43 10.8, s=1.5 10.2, s=2.3 10.8, s=2.5 RPE SU 0.29 9.8, s=0.8 11, s=1.0 11.8, s=2.0
Comfort HT 0.21 2.6, s=1.4 2.9, s=1.5 2.4, s=1.3 Comfort SU 0.22 3.8, s=0.8 3.4, s=0.8 3.1, s=0.2
Table 2. Analysis of practice effect tests.
3

2OV&
ml.kg-1.min-1
HR beats.min-1
RPE units
Comfort units
Test Series 1 (bumps)
Sample size 8 8 8 8 Mean of differences 9.1 34.5 1.8 -1.9 Standard deviation 2.6 10.9 1.8 1.0 P value < 0.001 < 0.001 0.026 < 0.001 95% upper limit 11.3 43.6 3.2 -1.1 95% lower limit 7.0 25.4 0.3 -2.7 Effect size 4.7 2.8 1 -2.8
Test Series 1 (no bumps) Sample size 8 8 8 8 Mean of differences -2.2 -3.1 -0.5 0.3 Standard deviation 1.7 6.3 1.2 0.4 P value 0.008 0.200 0.250 0.111 95% upper limit -0.8 2.1 0.5 0.6 95% lower limit -3.6 -8.3 -1.6 -0.1 Effect size -1.3 -0.4 -0.5 0.6
Test Series 2 (bumps)
Sample size 6 6 6 6 Mean of differences 8.1 28.9 3.7 -1.8 Standard deviation 4.8 13.8 1.8 0.7 P 0.009 0.037 0.004 0.001 95% upper limit 13.2 43.4 5.6 -1.1 95% lower limit 3.1 14.4 1.8 -2.5 Effect size 1.8 1.8 2.3 -2.2
Combined Test Series (bumps)
Sample size 14 14 14 14 Mean of differences 8.7 32.1 2.6 -1.9 Standard deviation 3.6 12.1 2.0 0.8 P value < 0.001 < 0.001 < 0.001 < 0.001 95% upper limit 10.8 39.1 3.7 -1.4 95% lower limit 6.6 25.2 1.4 -2.3 Effect size 2.6 2.3 1.5 -2.6
Note: all differences are (HT value – SU value)
Table 3. Pairwise comparison of HT and SU bicycles.
4
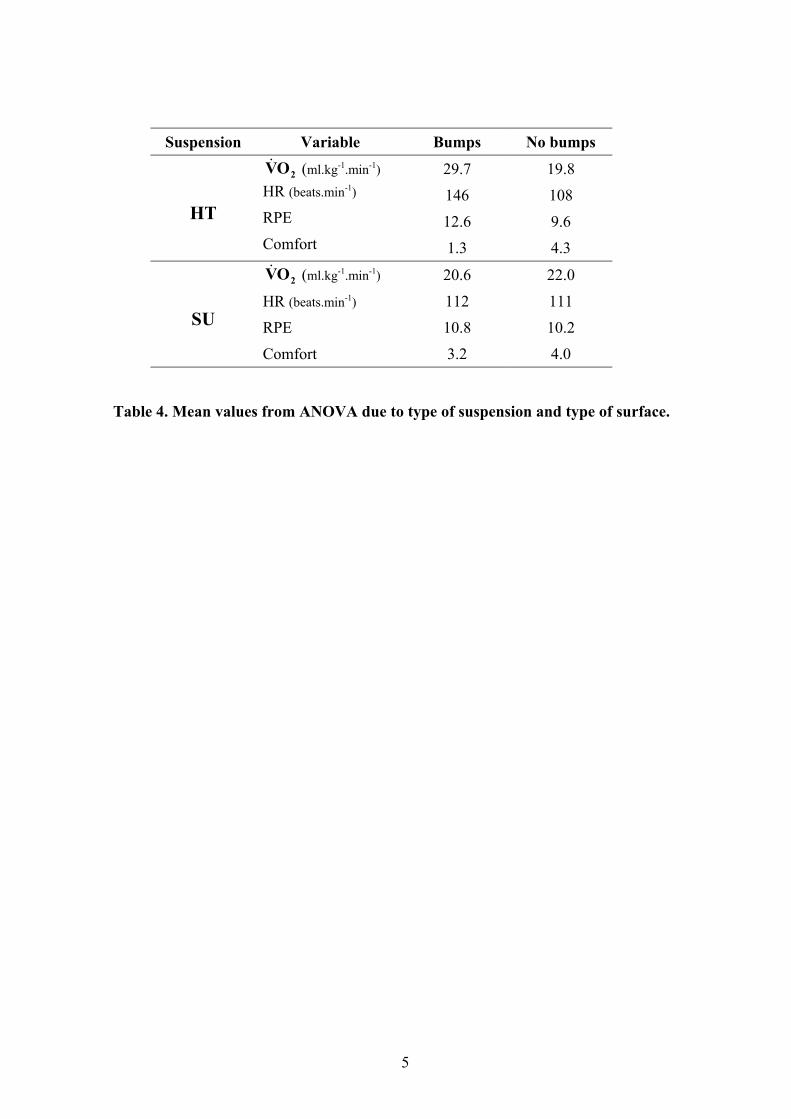
Suspension Variable Bumps No bumps
2OV& (ml.kg-1.min-1) 29.7 19.8 HR (beats.min-1) 146 108 RPE 12.6 9.6
HT Comfort 1.3 4.3
2OV& (ml.kg-1.min-1) 20.6 22.0
HR (beats.min-1) 112 111
RPE 10.8 10.2
SU
Comfort 3.2 4.0
Table 4. Mean values from ANOVA due to type of suspension and type of surface.
5
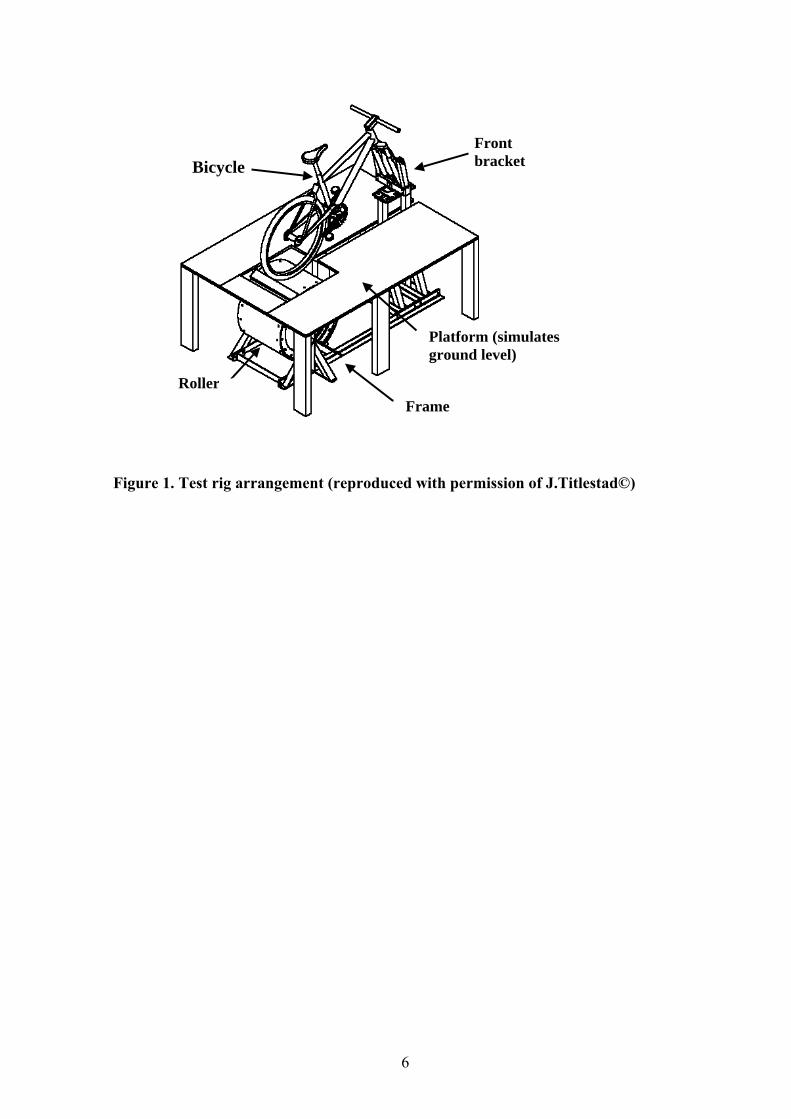
Platform (simulates ground level)
Bicycle
Front bracket
Roller
Frame
Figure 1. Test rig arrangement (reproduced with permission of J.Titlestad©)
6

Figure 2. Run down times
7

VO2 (ml.kg-1.min-1)
10
20
30
40
10 20 30 40
Full Suspension
Har
d T
ail
Bumps - Series 1Bumps - Series 2No Bumps - Series 1
Figure 3. Comparison of for HT and SU Bicycles 2OV&
8

Heart Rate (beats.min-1)
80
100
120
140
160
180
80 100 120 140 160 180
Full Suspension
Har
d T
ail
Bumps - Series 1
Bumps - Series 2
No Bumps - Series 1
Figure 4. Comparison of Heart Rate for HT and SU Bicycles
9
RPE
5
10
15
20
5 10 15Full Suspension
Har
d T
ai
20
l
Bumps - Series 1
Bumps - Series 2
No Bumps - Series 1
Figure 5. Comparison of RPE for HT and SU Bicycles
10

Comfort
0
1
2
3
4
5
0 1 2 3 4 5Full Suspension
Har
d T
ail
Bumps - Series 1
Bumps - Series 2
No Bumps - Series 1
Figure 6. Comparison of Comfort for HT and SU Bicycles
11