Embed Size (px)
Citation preview

Effect of Stress on Ultrasonic Response in Detection and Sizing of Cracks
Jorma PITKÄNEN, Posiva Oy, Olkiluoto, Finland Anssi LAUKKANEN, VTT, Espoo, Finland
Mika KEMPPAINEN, Iikka VIRKKUNEN, Trueflaw Ltd, Espoo, Finland
Abstract In different NDT techniques huge developments have been achieved during the last few years with regard to crack detection and sizing. In a large range of materials, cracks are one of the most dangerous defect types. A crack is a planar reflector, which is sometimes extremely difficult to detect and to be sized. A crack can be totally open, partly closed or even totally closed because of compressive stresses. The effects of stresses cause problems, for instance, in in-service inspections of nuclear power plants in detection and sizing of closed cracks. This phenomenon causes similar effects in all kinds of plants and components. In this study some experimental inspections have been carried out as well some FEM calculations of stress field around the crack and compared to corresponding measurements in literature. The used method is dynamic loading, which gives during ultrasonic measurement clear evidence on the effect of the crack closure as well on the amplitude variation limits in ultrasonic testing. Materials used in the study are AISI 304, AISI 321 and ferritic piping steel. The load applied to the cracks was in form of different thermal cycles. The maximum temperature variations were from 20 °C to 600 °C depending on each dynamic loading cycle. Different types of ultrasonic methods were used in the measurements. The methods applied are normally used in the field in normal ultrasonic inspections like angle shear wave, creeping wave, TOFD and phased array. The results are presented and conclusions are drawn from the stress effect on the detection and sizing. Clearly the sizing methods have some differences when using manual sizing techniques, TOFD, phased array or SAFT technique. The effect of closure on the response of normal ultrasonic practical probes was recorded.
Introduction
Ultrasonic and radiographic testing are the typical volumetric test methods. They are normally used in many kinds of in-service inspections. One of the main tasks is the detection and sizing of cracks. The cracks are planar defects. According to fracture mechanics they are usually the most severe defect types, especially on the surface of the component.
Cracks can be induced from various reasons during the manufacturing or in the use of the component. Typical in-service induced cracks are IGSCC, IGA, fatigue cracks and thermal fatigue cracks. Typically they are near the HAZ or in the weld toe, or in the geometrical discontinuities of the component. The orientation varies depending on the loading of the component.
During in-service inspections detected indications have to be evaluated. Normally the size of the detected indication is the basic decision tool, if the component should be repaired or not. In order to detect cracks in the components there are several techniques
ECNDT 2006 - Tu.3.3.4
1
applied depending mainly on the material and its geometry. The crack can have different loading history and this can affect drastically the defect detection and sizing. In the literature the cracks are normally studied under a static load situation. In these studies the corner echo and crack tip echo behaviour have been explained [1, 2, 3, 4, 5, 6, 7, 8, 9, 10]. Applied load has normally been three- or four-point bending in these studies. Bending will cause extra stresses into the large volume of tested cracked specimen. Dynamic load onsite is normally caused by the shut-down, start-up or resonance of the piping during the use of the power plant. The thermal fatigue crack initiation is combined with the temperature variation of the environment of the cracked component. In these cases the effective loading caused by the thermal stresses is mainly local.
If the crack is closed, the ultrasonic waves go partly through it and partly reflect. In this case the detection of the crack is minimised. The real information of the crack behaviour during dynamic loading, which can be similar loading as in the piping, is important for inspection. The dynamic behaviour of the crack affects the detection of cracks in the components.
This study is concentrated to loading the crack dynamically with known interval of thermal stresses induced locally. This is different compared to 3- or 4-point bending, which exhibits a long range stress field. Under the dynamic loading the crack is studied with several ultrasonic techniques. The effect of the stress on the detection and sizing of cracks has been studied in many occasions, but the information leaves always some questions after each study.
The ultrasonic behaviour of a closed crack has been studied in the following publications. Becker et al. [1] concentrated to inner-diameter transgranular cracks, which they considered as most critical crack type. In the study smooth and rough cracks were used, but no significant differences in ultrasonic response were obtained. Classification to rough or smooth cracks originated from the crack manufacturing. In the study mechanical fatigue cracks and thermal fatigue cracks were inspected. In four-point bending about 15 to 35 dB loss in corner echo response was measured, depending on the measured crack. Crack tip signals were not measured in the study. The stress cycle was about 105 - 125 % of the yield strength of the tested materials.
Boström et al. [11] made calculations from transmission and reflection coefficient using spring model to describe behaviour of closed cracks. Persson [12] calculated on the basis of geometrical theory of diffraction model that the effect of 250 MPa compression stress reduced 5 - 20 dB the backscattered amplitude. Zetterwall et al. [13] reported partly own results and partly results from other investigations. The obtained decrease under compressive stresses in ultrasonic response was between 10 – 35 dB depending on the probe and wave type. In general, it was obtained that 100 MPa increase of the compressive stress caused a 6 dB drop in ultrasonic response. Fracture surface roughness affected about 3 - 10 dB change in the reflection, when the surface roughness varies between 5 – 30 μm. The theoretical curves were compared to Arakawa measurements [13], which showed 26 dB reflection differences between 1.5 to 40 μm of the surface roughness. According to these results transmission is higher with larger compressive stresses and lower fracture surface roughness.
According to Zetterwal et al. [13] Whapman measured with TOFD 13 dB signal loss in diffraction signal response when the test specimen was loaded with 240 MPa compressive stresses. Exactly the same measurement setup as used by Whapman [13] was used by Mihara et al. [2] in their study. Mihara et al. [2] studied also the crack tip opening width effect on the measured diffraction signal and detected that between 0.01 – 0.1 μm crack tip opening during compression the ultrasonic signal disappeared.
Saka et al. [3] measured the crack depth from the ultrasonic response of the crack face during different loads. Depending on the probe position curve and the amount of
2

compressive stresses, the crack depth can be estimated. In this study it is shown that the crack behaviour under compressive stresses is more complex than just linear decrease of the ultrasonic response. The effect on ultrasonic sizing in practice has not actually been discussed in these reports, it was just commented that there is an effect on the sizing and detection. In this study non-linearity effect of the crack on the ultrasonic response was not used, even though it is very useful to give information about crack closure [14, 15, 16, 17].
Effect of degradation mechanism
Materials can be cracked in several ways. Typical cracking mechanisms are thermal fatigue cracking, mechanical fatigue or cracking induced by stress corrosion. The type of degradation mechanism is also important in order to understand the severity of the detected defects. It is not easy to be able to distinguish real crack types from each other and characterise them properly. In any case the degradation mechanism and the size of detected defects give us the need for repair or possibility to leave the defect to next in-service inspection.
Figure 1 shows the crack growth of thermal fatigue crack, fatigue crack and IGSCC. As it can be seen from Figure 1, the mechanical fatigue leaves us more time for repair as compared to IGSCC or thermal fatigue cracking. In ASME XI the maximum allowed crack size for calculations is 75% of the wall thickness [18]. If the piping has 10 mm wall thickness, then a 1 mm deep crack grows with stress corrosion mechanism in 11-12 years over the ASME XI allowable size. Correspondingly the 5 mm deep IGSCC crack reaches the ASME allowable limit in less than 2 years, according to these calculations. So the proper sizing is as important as the degradation mechanism. The used cycles are typical for nuclear power plants in one year. The loading of the component can vary so that crack growth is very rapid or slow. The loading type and the amount of load can vary the dominating degradation mechanism.
The used equations are based on ASME XI [18]. For calculation conservative half-elliptic cracks were used, with the length–depth relation of 1/6. Typical ultrasonic calibration defect for detection of cracks is 10% notch of the wall thickness. The recording level is normally 20% of the amplitude of the calibration notch. Alternative calibration reflectors are typically a flat bottom hole or side-drilled hole. According to Figure 1 case, the recording level would be -14 dB compared to 1 mm notch for this calibration type. The question arises: is a 1 mm crack detectable with this calibration type or not? According to Becker et al. [1] even large cracks (greater than 50% of pipe wall thickness) can be missed, when 100% recording level of calibration defect is used. This might be one reason, why -14 dB recording level was added to ASME XI.
Figure 1 Crack growth values for different degradation mechanisms with starting crack sizes 1 and 5 mm
3

Thermal stress state effect on crack behaviour
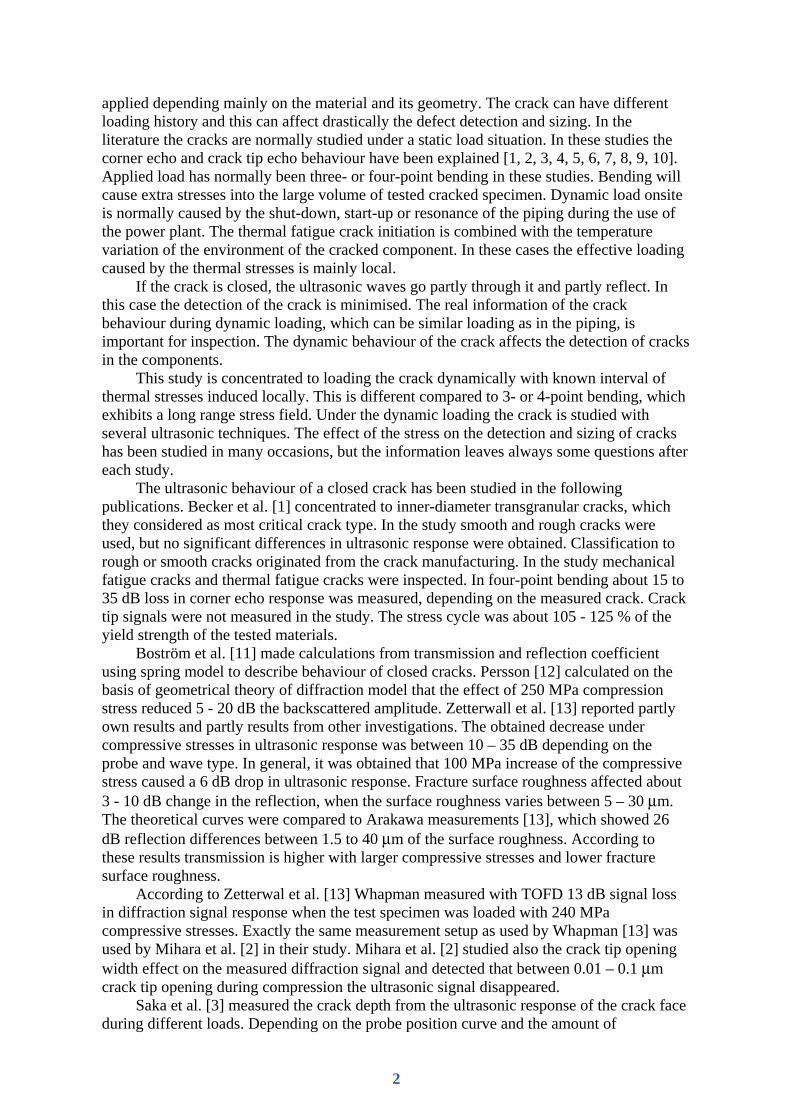
To estimate thermal stresses in the test specimens some FEM-analyses were carried out. In the analyses coupled thermal to continuum mechanical analysis were used. The analysis involved an initial crack essentially in a large test specimen of 2D nature, i.e. a through-wall crack. The constitutive formulation in the mechanical analysis was such that the material constitutive response was modelled as temperature dependent incremental isotropic elastic-plastic one (multi-linear stress-strain relationship), while the deformations were described as being finite.
The finite element formulation was of p-type, and fourth order elements were used in the mechanical analysis and second order in the thermal analysis. As the crack face contact as a result of the thermal loading is imminent, the analyses were performed with penalty function controlled contact constraints imposed on the crack faces. The models had approximately 50000 degrees-of-freedom and 4000 triangular elements of the above specified degrees of interpolation. The mesh used in the calculations is shown in Figure 2.
Figure 2 FEM mesh used in calculation with 8 mm deep crack in austenitic material
Figure 3 Temperature and 1st principal stress distribution during one heating cycle and cooling cycle
Heating and cooling cycles have been modelled. It can be seen from the calculations, that during the heating in the crack tip concentrated compression load is present and on the contrary in the cooling phase stress state changes to tensile load near the tip area, Figure 3. More accurate survey of the crack tip area shows that during the heating cycle the compression changes to tensile stresses on the left in Figure 4.
Figure 4 Stress on the fracture surface near the crack tip on the left and derivative of 1st principal stress as function of cycling time on the right
4

This can be seen also on the right in Figure 4, where normalised amplitude is defined as an integral of time rate of change of tensile stress over the crack face is presented, i.e., derivative of 1st principal stress is shown as function of cycle time with different “amplitude” integration distances from the crack tip towards the crack mouth. On the right in Figure 4 the curves are calculated to 5%, 10%, 20% and 30% of the total crack length from the crack tip. The total crack length was 8 mm and this corresponds lengths of 0.4 mm, 0.8 mm, 1.6 mm and 2.4 mm from the crack tip.
Definition of the crack for ultrasonic inspection
In the crack three different areas can be distinguished: • Corner, which corresponds to CMOD (crack mouth opening displacement) • Crack face, which corresponds to fracture surface of the crack • Crack tip, which corresponds to effective area of crack tip opening (plastic zone),
CTOD (crack tip opening displacement) and variable loading conditions
All these areas have own impact to ultrasonic response. The size of the crack tip area is actually dependend on the load at the crack tip. Under tensile load the area can be estimated to be 3-4 x crack tip opening width (plastic zone) where crack tip affects. Under compressive load cyclic plastic zone corresponds to ¼ of maximum monotonic plastic zone. Cyclic plastic zone can be in maximum about the crack tip opening width. The load affects the crack tip radius. If we assume the crack tip radius to be 1 μm, we can have an effective zone of 4 μm under tensile stress and of 1 μm under compressive stress in maximum. In a typical crack growth situation the plastic zone can vary from 10 μm even to 1 mm.
According to [2] the ultrasonic response is affected very strongly when the crack tip radius is less than about 0.1 μm. The effect of different zones of the crack on the ultrasonic response has been shown in principle in Figure 5 [19]. Other important factors are the roughness of the fracture surface, oxide films on the surfaces of the crack and orientation of the crack, because they affect the reflection behaviour of the ultrasonic waves and the crack behaviour under compressive stresses.
In front of the crack tip there can be micro-voids in the plastic zone. These can also have an effect on the received ultrasonic response. Additionally, if the crack is not straightforward, the crack tip area can produce also reflection from the crack facets near the tip. Thus, the crack tip signal can be a sum of diffraction, scattering and reflection.
Figure 5 Ultrasonic measurement of crack behaviour during dynamic loading with shear angle wave probes
5

Ultrasonic measurement techniques for detection and sizing
Several techniques are available [20, 21, 22, 23] for ultrasonic detection and sizing. Ultrasonic detection of a crack in the materials is firstly based on corner echo detection. Typical way is the use of shear waves between angles of incidence 35° - 55°.
The creeping wave technique as a part of mode conversion probe is extremely sensitive to detect crack-like defects in certain conditions. Creeping waves are not so sensitive to crack orientation compared to shear waves. Creeping wave (C2) conditions are that inner and outer surfaces have to be parallel. The outer and inner surface condition is also important factor. For instance, the counter bore is a factor which does not allow the use of creeping waves. In mode conversion probe there is also available other possibilities to characterise the crack such as 30T-70L-30T (C3) or 30T-70L-70L (C1).
In TOFD technique diffraction from discontinuities is recorded and analysed based on the diffraction effects in cracks. TOFD (Time Of Flight Diffraction) technique uses longitudinal waves for detection and sizing. The main principle is to use crack tip signals in order to receive the dimensions of the crack. TRL-probes are often used for inspection of difficult materials such as austenitic weld, casting or dissimilar metal weld.
Phased array technique is spreading fast into the industry applications. The applications of angular scanning and dynamic depth focusing in phased array analysis give good tools for defect characterisation and sizing. In this study typical manual and mechanised probes have been used in order to see the effect of stress state changes in normal inspection signals. Also some measurements with two phased array equipments have been carried out. The stress state in the material can also cause difficulties to interpret the results using TOFD as well other techniques for analysis. TOFD and phased array techniques have been utilised in measurements. For SAFT reconstruction normal angle shear wave probe has been used. Typical way to analyse defect size is to use crack tip signal if it is available. In order to analyse the defect sizing capability also crack tip signals have been recorded always, when it has been possible.
Several ultrasonic equipment were used in this study: • Sumiad V3.34 multichannel equipment for mechanised inspection (Tecnatom) • Phased array equipment MultiX (M2M) • Phased array equipment Compas-128 (BAM) • PC-SAFT equipment (IzfP).
The ultrasonic equipment Sumiad V3.34 was used to TOFD measurement and normal manual probe measurement during thermal cycling loading of the tested material. The equipment provides maximal 8 channel for data acquisition. During measurement each A-scan was digitised between 10 to 100 times in a second with 8 byte resolution. The amount of points was obtained to be too few in earlier work presented by Pitkänen et al. [19]. The collected data were either in form of RF-signals or logarithmic A-scans.
Phased array measurements of thermal cyclic loading were carried out with 128 channel equipment called Compas-128. In the measurement an 8 element phased array probe was used. The loaded specimen was measured with a range of angles between 20° - 55°. The usable range of angles of incidence for that probe is between 20° - 48° according to the information given by the manufacturer of the probe. The frequency of the probe was 4 MHz. The measured data were stored with 14 bit resolution, which gave large dynamics for the measurement. The pitch of the used probe was 1.8 mm. The stored data was in rectified A-scan form.
6

SAFT measurements have been carried out with PC-SAFT equipment, in order to receive information from cracks before thermal loading and to visualise the effects seen in the SAFT reconstruction. The equipment is using one channel with 100 MHz sampling rate.
The UT-measurements of closed cracks without thermal cycling were carried out with MultiX (M2M) using linear 64 element 5 MHz probe with 1 mm pitch (Imasonic). Omniscan was calibrated for the measurement with the help of notches of different sizes. Calibration concentrated to one notch to produce as high focus as possible for an interesting area. For the measurement, only 20 elements were used to avoid too high focusing. The passive aperture was 15 mm. The width of the notch was 1 mm with 20 mm depth in a similar austenitic specimen as the specimen with cracks.
Figure 6 Used ultrasonic equipment for the measurement from the left: Sumiad V3.34, PC-SAFT, MultiX and Compas-128
The thermal loading was made by thermal fatigue equipment. The loading cycles varied from 2 s to 10 s. In each loading the cycles were repeated several times. The effects of different thermal loading and cooling cycles on the ultrasonic response were measured. The thermal cycling behaviour in combination with ultrasonic measurement has been reported by Pitkänen et al. [19].
Effect of the stress state of the cracks in some experimental data of ultrasonic inspections of cracks SAFT measurement with thermal fatigue cracks
In austenitic steel piping material (AISI 321) several thermal fatigue cracks are detected, the origin of which is typical temperature differences between two connecting pipes. The low temperature flow in the smaller pipe had resulted a temperature difference on the inner surface of the larger pipe. This fluctuation of temperature caused the crack initiation and growth. In the measurement a 12 mm deep crack was measured with 4 MHz shear wave probe, the angle of incidence was 55° using SAFT. Reconstructions were carried out for each millimetre. The crack length was over 100 mm. The stress state of the crack itself has a strong effect on the detectability and sizing of the defect. In Figure 7 it can be seen, how the effect of the stress state of the crack changes the ultrasonic response. First picture, in the upper left, shows a weak corner echo when crack starts. In the middle area of the crack several different B-scans can be seen. Echoes are visible echoes from coming mode conversion, crack face (fracture surface) with direct sound path or through reflection and crack tip.
Additionally, double corner echoes can be seen, which shows that the sound field sees crack jumping along the crack length in passive direction of the piezo crystal. The real crack indication depends on the local stress state. Three pictures in Figure 7 show that crack is open, because the crack face is clearly detectable. In two pictures in Figure 7 the crack tip echo can be seen together with the corner echo. It seems that in these situations the
7
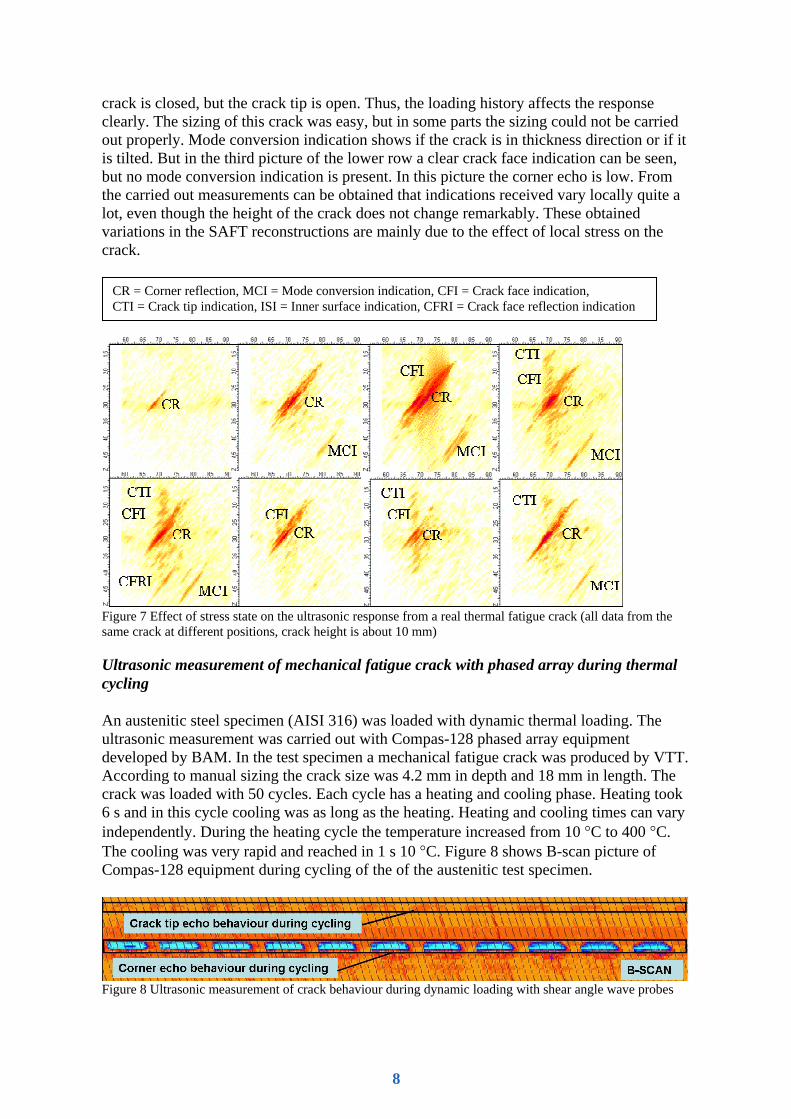
crack is closed, but the crack tip is open. Thus, the loading history affects the response clearly. The sizing of this crack was easy, but in some parts the sizing could not be carried out properly. Mode conversion indication shows if the crack is in thickness direction or if it is tilted. But in the third picture of the lower row a clear crack face indication can be seen, but no mode conversion indication is present. In this picture the corner echo is low. From the carried out measurements can be obtained that indications received vary locally quite a lot, even though the height of the crack does not change remarkably. These obtained variations in the SAFT reconstructions are mainly due to the effect of local stress on the crack.
Figure 7 Effect of stress state on the ultrasonic response from a real thermal fatigue crack (all data from the same crack at different positions, crack height is about 10 mm)
Ultrasonic measurement of mechanical fatigue crack with phased array during thermal cycling
An austenitic steel specimen (AISI 316) was loaded with dynamic thermal loading. The ultrasonic measurement was carried out with Compas-128 phased array equipment developed by BAM. In the test specimen a mechanical fatigue crack was produced by VTT. According to manual sizing the crack size was 4.2 mm in depth and 18 mm in length. The crack was loaded with 50 cycles. Each cycle has a heating and cooling phase. Heating took 6 s and in this cycle cooling was as long as the heating. Heating and cooling times can vary independently. During the heating cycle the temperature increased from 10 °C to 400 °C. The cooling was very rapid and reached in 1 s 10 °C. Figure 8 shows B-scan picture of Compas-128 equipment during cycling of the of the austenitic test specimen.
Figure 8 Ultrasonic measurement of crack behaviour during dynamic loading with shear angle wave probes
CR = Corner reflection, MCI = Mode conversion indication, CFI = Crack face indication, CTI = Crack tip indication, ISI = Inner surface indication, CFRI = Crack face reflection indication
8

By analysing Figure 9 data several results can be obtained. During cycling it can be seen that the corner echo decreases about 22 dB during the heating cycle. During the cooling small changes in the range of 2 dB can be seen in the corner echo. Small maximum can be obtained when cooling starts after 1 s in each cycle. Similar maximum can be seen in the crack tip signal, but the effect is larger than by the corner echo. After maximum crack tip closes partly and the amount of this effect is between 4 to 9 dB.
The thermally loaded material stores some part of thermal energy by slowly increasing the temperature of the test object. The crack tip changes decrease because the cooling is not sufficient to cool to the start temperature. Crack tip amplitude shows small tendency to increase little bit towards to the end of heating. This means that crack tip width (CTOD) increases in small extent. The quantity of this effect varies between 2 to 9 dB. It seems that during the heating part of each cycle by closing the CMOD makes the crack tip to open partly, but not enough to produce a proper tip signal in this case.
Figure 9 Ultrasonic measurement of crack behaviour during dynamic loading with shear angle wave probes. Corner echo and crack tip echo behaviour can be seen during dynamic thermal loading
Ultrasonic measurement of mechanical fatigue crack in ferritic piping material
The cracks were introduced by mechanical fatigue to a ferritic piping material. TOFD measurements were carried out with two 5 MHz longitudinal probes having angle of incidence 60°. The SAFT measurements were carried out with a 4 MHz 70° shear wave probe. Figure 10 shows similar results for both methods. In the TOFD picture in case of 8 mm crack height, the sizing is not clear but from the back-wall echo disturbances can be assumed, that it concerns a crack. The SAFT measurement was carried out from the same side as the crack is and TOFD measurement from the opposite side of the crack. In TOFD B-scans the lateral wave is on the bottom and the back-wall echo on the top. This has been done only for comparing and visualising the results of SAFT and TOFD methods.
The crack-tip echo is very small in case of 8 mm crack. But it can be seen with SAFT method quite clearly. In TOFD the noise level is very near the crack-tip signal level in this case. It seems that the crack is closed. This can be estimated since the back-wall echo is seen and it does not disappear. Normally in case of open crack on the opposite side
9

of test specimen the back-wall echo is disturbed. Thus, after manufacturing the fatigue crack on the surface compressive residual stresses remain, which cause that the ultrasonic waves go through in the surface area of the inspected crack. This can be interpreted that there is no crack, which opens on the surface. Crack-tip echo can be assumed to come also from another discontinuity than from a crack in this case. Same effect can be seen for the larger crack (23 mm deep). The back-wall echo is seen through the specimen. High tip indications come from several depths in TOFD measurement. The SAFT measurement is similar. In the surface the crack is clearly closed and in the crack face there are several areas where ultrasonic waves do not reflect properly. Thus, the crack is partly under high compressive load in the areas of crack face and crack tip.
Figure 10 Measurements of the specimen to analyse the cracks before thermal loading. On the left SAFT reconstructions are shown and on the right TOFD measurements of the corresponding test specimens, respectively
Figure 11 Results of thermal cycling with TOFD measurement of 8 mm crack specimen. TOFD B-scan on the left for 2 cycles is shown and on the right TOFD signal behaviour during one cooling cycle
Both ferritic specimens were also thermally loaded with different cycling. In Figure 11 changes in the TOFD signal during thermal cycling can be seen. In the left picture during the beginning of the heating, measurement shows that he crack tip opens and closes quickly after it. This happens in each similar cycle in the same way. At the beginning of
10

the cooling the crack moves. This is very clear effect. After that crack tip closes. This is a repeatable effect and it can be said that it is characteristic to the loading cycle. These effects are similar when thermal loading stays the same. The increase of temperature of test specimen changes the conditions and this can change a little the behaviour of the crack. On the right in Figure 11 the cooling phase from other type of cycles can be seen. It can be seen clearly, that an “opening wave” goes towards the crack tip and crack tip opens finally. Similar “opening wave”of the fracture surface of a crack fracture surface can be seen also in the mode conversion side of TOFD signals. Later in the cooling, the crack tip closes and cannot be seen clearly. Sizing is clearly difficult by every technique in this case when the crack tip is closed.
Ultrasonic measurement of several mechanical and thermal fatigue cracks with ultrasonic probes used for manual inspection.
By cycling measurement the sampling rate varied between 10 – 100 Hz. For instance the minimum heating cycle was 2 s. So for this heating time 200 A-Scan (samples) in 2 s were stored in maximum. From the measurement with 55° shear wave probe during cycling the effects in the dynamic crack behaviour can be recorded, Figure 12. Crack tip, indications from fracture surface and corner echo are visualised in the B-scan results. The movement of the fracture surface can be interpreted from the results. It is obvious that in the different areas of the crack the stress affects both effects: closure and opening. These closure and opening movements can be seen on the left of Figure 12.
When cooling starts, the temperature decreases rapidly and crack starts to open from the surface. The effect of this “opening wave” can be seen clearly. The yellow arrows show in Figure 12 the direction of the “opening wave”. The red arrows show in the contrary the “closure wave” direction. Crack tip opens also at the beginning of the cooling. But during cooling near the crack tip it can be seen that the crack tip divides in the two areas. On the right in Figure 12 the amplitude variation during one dynamic cycle in the crack tip area is shown.
The opening effect at crack tip in the beginning of the cooling is similar to the opening, which happens in the beginning of the heating, when the crack is closed from the outer surface. This effect opens the crack tip for some moments until the temperature increases in the crack tip area and thermal compressive stresses close the crack. The behaviour of the crack changes according to the characteristics of the dynamic cycling. During the heating phase seen in Figure 12, the amplitude decrease of the corner echo was measured to be 27 dB. The changes of the crack tip echoes were about 10 dB.
Figure 12 Ultrasonic measurement of crack behaviour during dynamic loading with shear angle wave probe. On the left B-scan as a function of time and on the right the crack tip variation during cooling (blue curve part) and heating (red curve part) is shown
Figure 13 shows B-scan of thermal cycling measurements with 4 MHz 45° shear wave probe on the left and results of the measurements with creeping wave probe (WSY60-
11
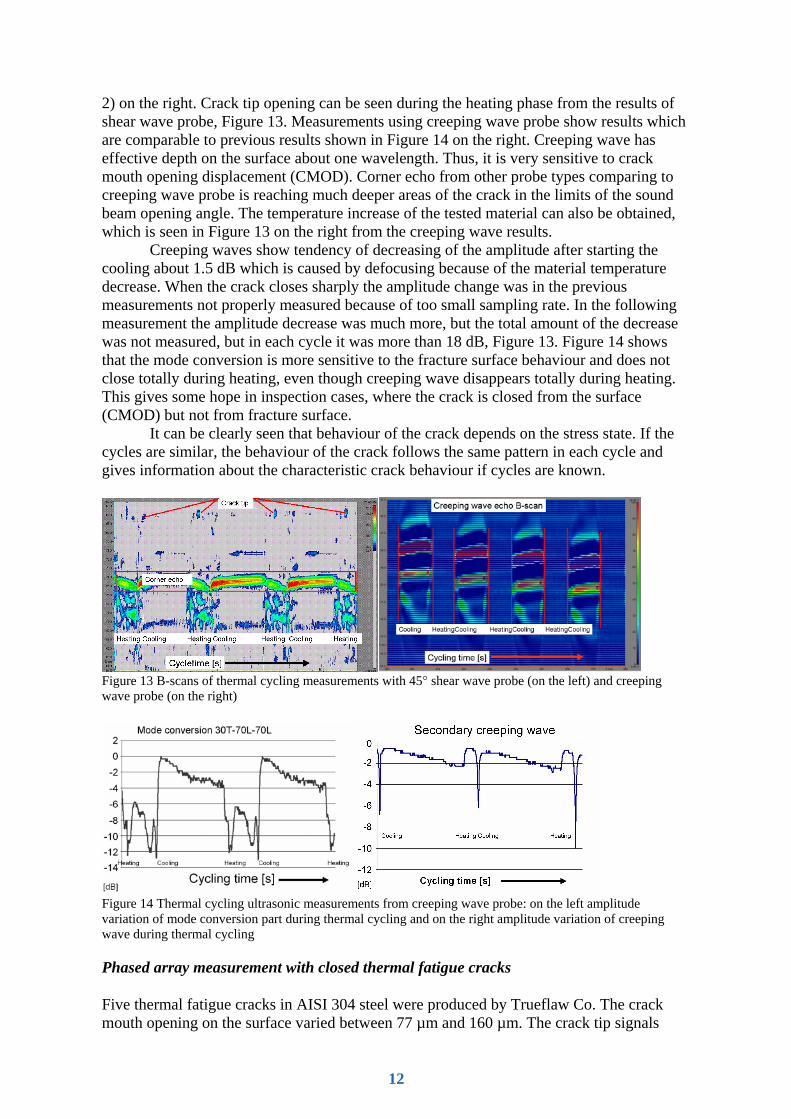
2) on the right. Crack tip opening can be seen during the heating phase from the results of shear wave probe, Figure 13. Measurements using creeping wave probe show results which are comparable to previous results shown in Figure 14 on the right. Creeping wave has effective depth on the surface about one wavelength. Thus, it is very sensitive to crack mouth opening displacement (CMOD). Corner echo from other probe types comparing to creeping wave probe is reaching much deeper areas of the crack in the limits of the sound beam opening angle. The temperature increase of the tested material can also be obtained, which is seen in Figure 13 on the right from the creeping wave results.
Creeping waves show tendency of decreasing of the amplitude after starting the cooling about 1.5 dB which is caused by defocusing because of the material temperature decrease. When the crack closes sharply the amplitude change was in the previous measurements not properly measured because of too small sampling rate. In the following measurement the amplitude decrease was much more, but the total amount of the decrease was not measured, but in each cycle it was more than 18 dB, Figure 13. Figure 14 shows that the mode conversion is more sensitive to the fracture surface behaviour and does not close totally during heating, even though creeping wave disappears totally during heating. This gives some hope in inspection cases, where the crack is closed from the surface (CMOD) but not from fracture surface.
It can be clearly seen that behaviour of the crack depends on the stress state. If the cycles are similar, the behaviour of the crack follows the same pattern in each cycle and gives information about the characteristic crack behaviour if cycles are known.
Figure 13 B-scans of thermal cycling measurements with 45° shear wave probe (on the left) and creeping wave probe (on the right)
Figure 14 Thermal cycling ultrasonic measurements from creeping wave probe: on the left amplitude variation of mode conversion part during thermal cycling and on the right amplitude variation of creeping wave during thermal cycling
Phased array measurement with closed thermal fatigue cracks
Five thermal fatigue cracks in AISI 304 steel were produced by Trueflaw Co. The crack mouth opening on the surface varied between 77 µm and 160 µm. The crack tip signals
12
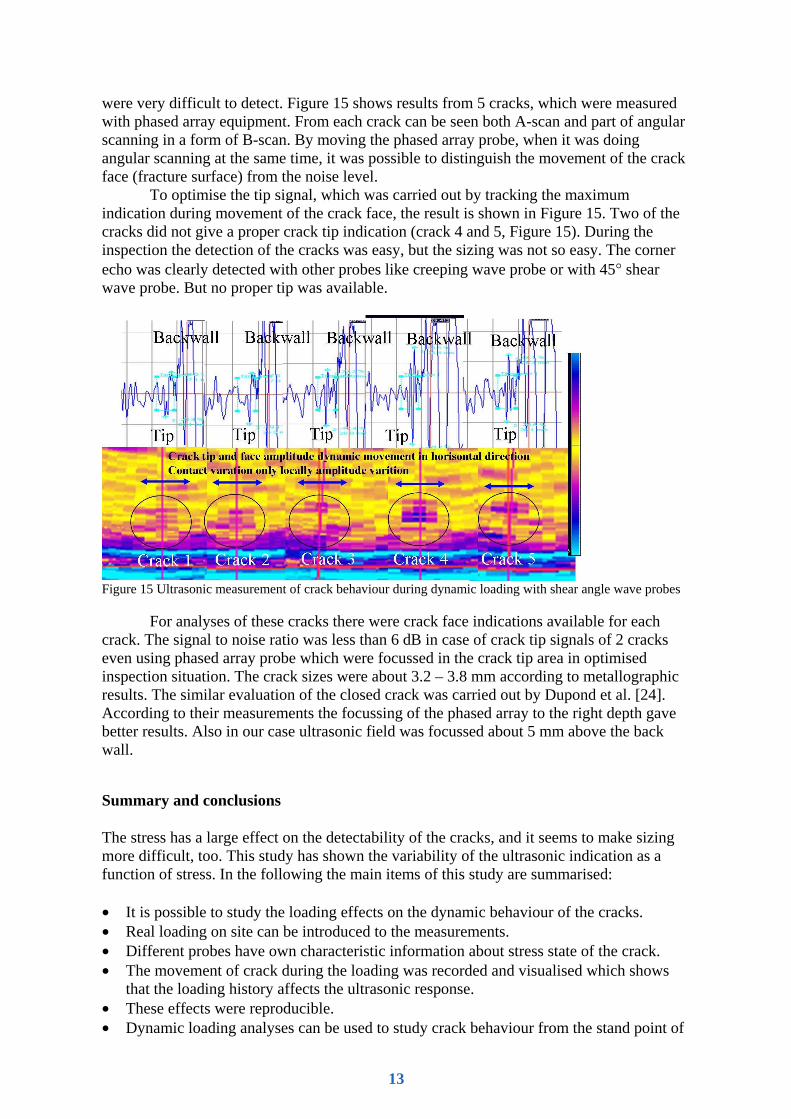
were very difficult to detect. Figure 15 shows results from 5 cracks, which were measured with phased array equipment. From each crack can be seen both A-scan and part of angular scanning in a form of B-scan. By moving the phased array probe, when it was doing angular scanning at the same time, it was possible to distinguish the movement of the crack face (fracture surface) from the noise level.
To optimise the tip signal, which was carried out by tracking the maximum indication during movement of the crack face, the result is shown in Figure 15. Two of the cracks did not give a proper crack tip indication (crack 4 and 5, Figure 15). During the inspection the detection of the cracks was easy, but the sizing was not so easy. The corner echo was clearly detected with other probes like creeping wave probe or with 45° shear wave probe. But no proper tip was available.
Figure 15 Ultrasonic measurement of crack behaviour during dynamic loading with shear angle wave probes
For analyses of these cracks there were crack face indications available for each crack. The signal to noise ratio was less than 6 dB in case of crack tip signals of 2 cracks even using phased array probe which were focussed in the crack tip area in optimised inspection situation. The crack sizes were about 3.2 – 3.8 mm according to metallographic results. The similar evaluation of the closed crack was carried out by Dupond et al. [24]. According to their measurements the focussing of the phased array to the right depth gave better results. Also in our case ultrasonic field was focussed about 5 mm above the back wall.
Summary and conclusions
The stress has a large effect on the detectability of the cracks, and it seems to make sizing more difficult, too. This study has shown the variability of the ultrasonic indication as a function of stress. In the following the main items of this study are summarised: • It is possible to study the loading effects on the dynamic behaviour of the cracks. • Real loading on site can be introduced to the measurements. • Different probes have own characteristic information about stress state of the crack. • The movement of crack during the loading was recorded and visualised which shows
that the loading history affects the ultrasonic response. • These effects were reproducible. • Dynamic loading analyses can be used to study crack behaviour from the stand point of
13

fracture mechanics. • Even though the crack is closed on the surface, the crack can still have areas which
reflect properly. • If the loading cycles of the component are known the behaviour of the possible crack
can be estimated by using similar loading as in power plant.
The decrease of corner echo was measured to be between 22 – 27 dB, when the crack closes totally. This is comparable to other measurements in the literature. The crack tip indication in measured cases showed variation of about 18 dB in maximum. The creeping wave varied more than 18 dB in the measurements. The mode conversion decreases about 14 dB during the dynamic loading. The corner echo can be detected in most cases very clearly but the sizing, which is the criterion to repair or acceptance, will be affected in all techniques. When crack closes totally then the corner echo can bee difficult to detect. There are some non-linear techniques for measuring the opening of the crack tip in spite of this. As it can be seen the crack tip will be affected by the loading of the crack. The opening of the crack tip can be characterised, but more information is needed to have a clear picture of the opening effect. According to Mihara et al. [2] when the crack tip opening width is less than 0.1 μm the ultrasonic response decreases remarkable.
The results of the measurements of this study can be interpreted so that the crack mouth opening and also the crack tip opening were less than 0.1 μm in closing phase of dynamic loading during heating. The changes for instance in the crack tip amplitude measured in this study in the beginning of the cooling let us to assume that the stress changes are about 150 MPa (9 dB in maximum) at the crack tip and 450 MPa (27 dB in maximum) at the surface of the crack according to [13]. The cyclic load affects the crack movement and can be characterised in the beginning of the heating in such away that closing affects crack mouth opening on the surface and introduces an “opening” wave towards the crack tip. Similar effect happens also when cooling starts.
This information is important for qualification cases. How to size a closed crack? At which point it is not possible to do it. Are there some techniques which give more information from the closed cracks? The dynamic sizing is certainly one possibility. Information should be collected from detected and by the metallographic inspection of verified cracks. The crack mouth opening has been in some detected defects from dissimilar metal weld inspection very small [25]. How should this affect the qualification trials? Should there be closed cracks in the qualification tests? How should they be estimated? Suggestion is to use partly closed cracks for qualification, so that the inspectors can have some experience during the training.
References
[1] Becker, F.L., Doctor, S. R., Heasler, P. G., Morris, C. J., Pitman, S. G., Selby, G. P. and Simonen F.A., 1981, Integration of NDE reliability and fracture mechanics, Phase I report Nureg/CR-1696, PNL-3469, Vol. 1, R5, October, 170 p. + appendix 54 p.
[2] Mihara, T, Nomura, S., Akino, M. & Yamanaka, K., 2004, Relationship between crack tip scattering
and diffraction of longitudinal waves, Materials Evaluation, 62(2004)9, pp. 943-947. [3] Saka, M. & Salam Akanda, M. A., 2004, Ultrasonic measurement of the crack depth and crack
opening stress intensity factor under a no load condition. Journal of Nondestructive Evaluation, 23(2004)2, pp. 49 – 63.
[4] Denby, D., Duncumb, A.,C., 1985, The effect of stress on the ultrasonic detectability of defects,
Nondestructive Testing in the Fitness-for-Purpose Assessment of Welded Constructions, London, UK, 20th – 22nd November 1984, pp. 73-81.
14

[5] Temple, J. A.G., 1985, The effect of stress and crack morphology on time-of-flight diffraction
signals, Int. J. of Pressure Vessels & piping, 19(1985)3, pp. 185-211. [6] Ibraham, S. I. & Whittaker, V. N., 1981, The influence of crack topography and compressive stresses
on the ultrasonic detection of fatigue cracks, British Journal of NDT, 23(1981)5, pp. 233 – 240. [7] Ahmed, S. R. & Saka M., 1998, A sensitive ultrasonic approach to NDE of tightly closed small
cracks, Transactions of ASME, 120(1998)10, pp. 384 -392. [8] Saka, M. & Fukuda, Y., 1991, NDT of closed cracks by ultrasonic propagation along the crack
surface. NDT International, 24(1991)4, pp. 191 – 194. [9] Brotherhood, C. J., Drinkwater, B. W. & Guild, F., J., 2002, The effect of compressive loading on
the ultrasonic detecability of kissing bonds in adhesive joints, Journal of Non-destructive Evaluation, 21(2002)3, pp. 95 -104.
[10] Mouchalin, J.-P., Ochai, M., Lévesque, D., Blouin, A., Talbot, R., & Fukumoto, A., 2003,
Characterisation of surface breaking tight cracks using laser-ultrasonic shadowing, Review of progress in quantitative non-destructive evaluation 27th July – 1st August in Green Bay Wisconsin, Vol. 23, AIP, Melville, New York, pp. 1264 – 1271.
[11] Böström, A. & Wickham, G., 1991, On the boundary conditions for ultrasonic transmission by
partially closed cracks, Journal of Non-destructive Evaluation, 10(1991)4, pp. 139 – 149. [12] Persson G., 1991, Application of the geometrical theory of diffraction to closed cracks, Journal of
Non-destructive Evaluation, 10(1991)3, pp. 97 – 109. [13] Zetterwall T. and Borgenstam C.J., 1993, Detektering och storleksbestämning av slutna sprickor,
SKI rapport 94:1, November, 1993, 49 p. [14] Akino, M., Mihara, T. and Yamanaka, K., 2003, Fatigue crack closure analysis using non-linear
ultrasound, Review of progress in quantitative non-destructive evaluation 27th July – 1st August in Green Bay Wisconsin, vol 23, AIP, Melville, New York, pp. 1256 – 1263.
[15] Zagrai, A., Donskoy, D. & Lottiaux, J.-L., 2003, N-SCAN: New Vibro –modulation system for crack
detection, monitoring and characterisation, Review of progress in quantitative non-destructive evaluation 27th July – 1st August in Green Bay Wisconsin, Vol. 23, AIP, Melville, New York, pp. 1414 – 1421.
[16] Yamanaka, K., Mihara, T., Tsuji, T., 2003, Evaluation of nanoscale cracks by low-pass filter effect
in non-linear ultrasound, Proceedings of IEEE Ultrasonics Symposium, Honolulu, 5th – 8th October, 6 p.
[17] Yamanaka, K., Mihara, T. & Tsuji, T., 2004, Evaluation of closed cracks by analysis of subharmonic
ultrasound, Insight, 46(2004)11, pp. 666 – 670. [18] ASME XI, 2001 Edition, 2001 Div 1; Article C-3300. [19] Pitkänen, J., Kemppainen, M. & Virkkunen, I, 2003, Ultrasonic study of crack under dynamic
thermal load, Review of progress in quantitative non-destructive evaluation 27th July – 1st August in Green Bay Wisconsin, Vol. 23, AIP, Melville, New York, pp. 1582 – 1586.
[20] Brekow, G., Schulz, E., Erhard, A. and Toffin, O., 1996, Ultraschallmethode zur Rißanalyse. DGzfP
Jahrestagung, 13. -15. Mai 1996 in Lindau. pp. 577 – 588. [21] Gebhardt, W., Walte, F., 1989, Crack detection and defect classification using the LLT-technique.
Review of progress in quantitative non-destructive evaluation, vol 8A, Plenum Publishing Corporation. 1989, pp. 591 – 598.
15

[22] Silk, M.G., 1987, Changes in ultrasonic defect location and sizing, NDT International, 20(1987)1, pp. 9 – 14.
[23] Erhard, A., 1983, Untersuchungen zur Ausbreitung von Longitudinalwellen an Oberflächen bei der
Materialprüfung mit Ultraschall, Forschungsbericht 88, BAM Berlin, 32 p. [24] Dupond, O., Bredif, P., Poidevin, C. & De Mathan, N, 2004, Advanced phased array transducer
detection of closed crack tip diffraction, NDE in Relation to Structural Integrity for Nuclear and Pressurised Components, 6.-8. December, London UK, pp. 724 – 733.
[25] Högberg, K., 2003, PostDas – Verifiering av ET/UT procedure för detektering och höjdbestämning av sprickor, IDSCC, i Alloy 182, Kärnteknik, 19.-20. November, 27 p.
16