Embed Size (px)
Citation preview

International Journal of Plasticity 56 (2014) 19–44
Contents lists available at ScienceDirect
International Journal of Plasticity
journal homepage: www.elsevier .com/locate / i jp las
Effect of strain rate on ductile fracture initiation in advancedhigh strength steel sheets: Experiments and modeling
http://dx.doi.org/10.1016/j.ijplas.2014.01.0030749-6419/� 2014 Elsevier Ltd. All rights reserved.
⇑ Corresponding author at: Impact and Crashworthiness Laboratory, Department of Mechanical Engineering, Massachusetts Institute of TecCambridge, MA, USA. Tel.: +1 6172534338.
E-mail address: [email protected] (D. Mohr).
Christian C. Roth a, Dirk Mohr a,b,⇑a Solid Mechanics Laboratory (CNRS-UMR 7649), Department of Mechanics, École Polytechnique, Palaiseau, Franceb Impact and Crashworthiness Laboratory, Department of Mechanical Engineering, Massachusetts Institute of Technology, Cambridge, MA, USA
a r t i c l e i n f o
Article history:Received 17 October 2013Received in final revised form 20 December2013Available online 31 January 2014
Keywords:A. Dynamic fractureB. Viscoplastic materialB. Constitutive behaviourC. Kolsky barStress-state dependence
a b s t r a c t
Low, intermediate and high strain rate tensile experiments are carried out on flat smooth,notched and central-hole tensile specimens extracted from advanced high strength steelsheets. A split Hopkinson pressure bar testing system is used in conjunction with a loadinversion device to perform the high strain rate tension experiments. Selected surfacestrains, as well as local displacements, are measured using high speed photography in con-junction with planar digital image correlation (video extensometer). Through thicknessnecking precedes fracture in all experiments. A hybrid experimental–numerical approachis therefore employed to determine the strain to fracture inside the neck. To obtain anaccurate description of the local strain fields at very large deformations, a plasticity modelwith a Johnson–Cook type of rate and temperature-dependency and a combined Swift–Voce strain hardening law is used in conjunction with a non-associated anisotropic flowrule. The incremental change in temperature is computed using a strain rate dependentweighting function instead of solving the thermal field equations. The comparison of thecomputed and measured force–displacement curves and surface strain histories showsgood agreement before and after the onset of necking. From each experiment, the loadingpath to fracture is determined describing the evolution of the equivalent plastic strain interms of the stress triaxiality, Lode angle parameter, strain rate and temperature. Anempirical extension of the stress-state dependent Hosford–Coulomb fracture initiationmodel is proposed to account for the effect of strain rate on the onset of ductile fracture.The model is subsequently calibrated and successfully validated using the results fromfracture experiments on DP590 and TRIP780 steels.
� 2014 Elsevier Ltd. All rights reserved.
1. Introduction
Advanced high strength steels (AHSS) are widely used in automotive engineering. During stamping, as well as during acci-dental crash loading, fracture may initiate in AHSS after loading at strain rates as high as 1000/s. Localized necking usuallyprecedes fracture and a significant amount of strain is accumulated inside the localized neck. The strains cannot be measureddirectly inside a localized neck and a hybrid experimental–numerical approach must be used which requires visco-plasticitymodels that are accurate at very large strains.
Existing visco-plasticity models can be classified into physics-based models and phenomenological/empirical models. Theso-called physics-based models are usually inspired by the thermodynamics and kinetics of slip as summarized in the mono-
hnology,
20 C.C. Roth, D. Mohr / International Journal of Plasticity 56 (2014) 19–44
graph by Kocks et al. (1975). The constitutive equations may be formulated at the slip system level and then used to computethe effective material response using a polycrystal plasticity approach (e.g. Balasubramanian and Anand, 2002). Alterna-tively, physics-based models may be directly formulated at the macroscopic level by substituting the mechanical variablesat the slip system level (e.g. resolved shear stress, shearing rates on slip systems) by their macroscopic counterparts (e.g. vonMises equivalent stress, equivalent plastic strain rate). The Zerilli–Armstrong model (1987) is based on a thermal activationanalysis of dislocation motion which results in two different constitutive equations for the macroscopic flow stress of FCCand BCC materials, respectively. A comparison of the performance of the physics-based constitutive models by Bodnerand Partom (1975), Zerilli and Armstrong (1987) and Khan and Huang (1992) is included in the review of rate- and temper-ature-dependent models by Liang and Khan (1999). Good agreement of the predictions of the Khan–Huang–Liang plasticitymodel with the results from static and dynamic tension experiments has been reported for AHSS (Khan et al., 2012a) and Ti–6Al–4V alloy (Khan et al., 2012b). The Rusinek–Klepaczko model (2001) assumes the additive decomposition of the flowstress into an internal and an effective stress, with an Arrhenius type of law providing the strain rate and temperature depen-dence of the latter component. Voyiadjis and Abed (2005) present an extended Zerilli–Armstrong model which can accu-rately describe the adiabatic high strain rate response of both FCC and BCC materials for large strains. A rate- andtemperature-dependent plasticity model embedded into a continuum damage mechanics framework (Brünig, 2006) hasbeen applied by Brünig and Gerke (2011). A unified viscoplastic model accounting for the rate-dependent ductile-to-brittletransition during microcracking in polycrystalline materials has been proposed by Shojaei et al. (2013). The effect of strainrate on the plastic anisotropy of advanced high strength steel has been investigated by Huh et al. (2011). Their experimentsfor strain rates of up to 100/s on TRIP590 and DP780 steels indicated a decrease in plastic anisotropy with increasing strainrate.
Unlike the above models, the widely used Johnson–Cook model (1983) has no physical basis and is purely empirical. Itpostulates the multiplicative decomposition of the flow stress into three functions that depend on the strain, the strain rateand the temperature, respectively. Many studies in impact engineering demonstrate that the simple J–C plasticity modelprovides reasonable predictions of the temperature-dependent viscoplastic response of metals up to very high strains(e.g. Johnson and Cook, 1983; Johnson and Holmquist, 1988; Clausen et al., 2004; Smerd et al., 2005; Verleysen et al.,2011; Erice et al., 2012; Kajberg and Sundin, 2013). However, it shows serious limitations when an accurate descriptionof the hardening at large strains is required. An important example is the prediction of the necking and post-necking re-sponse of sheet metal. Under static and isothermal loading conditions, the J–C model reduces to a power-law which is knownto overestimate the strain hardening capacity of automotive steels (e.g. Dunand and Mohr, 2010). This shortcoming has beenaddressed by Sung et al. (2010) through a constitutive model that makes use of a temperature-dependent combination ofpower and saturation hardening.
The effect of stress state on the ductile fracture of advanced high strength steels has been studied extensively at low strainrates (e.g. Sun et al., 2009; Mohr et al., 2010; Luo and Wierzbicki, 2010; Kim et al., 2011; Gruben et al., 2011; Chung et al.,2011; Lou et al., 2014; Lian et al., 2013). The reader is referred to Lecarme et al. (2011), Malcher et al. (2012) and Lou et al.(2014) for reviews of the current literature on ductile fracture of non-AHSS materials. Using a high speed hydraulic testingmachine, Huh et al. (2008) performed uniaxial tensile tests of four different advanced high strength steels (TRIP600, TRIP800,DP600 and DP800) for pre-necking strain rates ranging from 0.003/s to 200/s. They report an increase of the fractureelongation (engineering strain over a length of 30 mm) for the TRIP600 steel, and an approximately rate-insensitive elonga-tion for the other three materials. Curtze et al. (2009) performed static and intermediate strain rate tensile experiments on aservohydraulic testing machine and high strain rate experiments using a tensile Hopkinson bar system. In their experimentsat room temperature, the elongation at fracture (over a length of 6 mm) for a DP600 steel and a TRIP700 steel were approx-imately the same irrespective of the strain rate. It is worth noting that necking preceded fracture in all of the above highstrain rate tensile experiments, but the strain to fracture inside the localized neck has not been determined.
Estimates of the local strain at the onset of fracture in high strain rate experiments are available for bulk materials. Theresults from dynamic experiments on axisymmetric notched tensile specimens have been the basis for the formulation of theempirical Johnson–Cook failure model (Johnson and Cook, 1985). Unlike for flat specimens, the local strains at fracture inround specimens may be conveniently estimated from cross-section measurements in combination with FEA-based or ana-lytical correction formulas (e.g. Bridgman, 1952). Johnson and Cook (1985) reported an increase in ductility as a function ofthe strain rate for OFHC copper, ARMCO iron and 4340 steel. A positive strain rate sensitivity of the strain to fracture has alsobeen determined from static and dynamic notched tension experiments on aluminum 5083-H116 (Clausen et al., 2004) andmartensitic stainless steel FV535 (Erice et al., 2012). Khan and Liu (2012a,b) incorporated the effect of strain rate and tem-perature into their stress-based ductile criterion. Their model captures the significant increase in ductility observed duringhigh strain rate torsion experiments on aluminum 2024-T351.
In the present work, low, intermediate and high strain rate experiments are performed on flat specimens with a centralhole and different notches. The strain to fracture is determined inside the neck using detailed finite element analysis in con-junction with digital image correlation. To obtain a highly accurate description of the post-necking response of specimensextracted from DP590 and TRIP780 steel sheets, the Johnson–Cook plasticity model is coupled with a combined Voce–Swiftstrain hardening function and a non-associated anisotropic flow rule. The loading paths up to the onset of fracture are iden-tified from all experiments, including the evolution of stress triaxiality, Lode angle parameter, temperature, strain rate andequivalent plastic strain. Subsequently, an empirical extension of the Hosford–Coulomb fracture initiation model is proposedand validated to account for the effect of strain rate on ductile fracture.
C.C. Roth, D. Mohr / International Journal of Plasticity 56 (2014) 19–44 21
2. Experimental techniques
2.1. Material and specimens
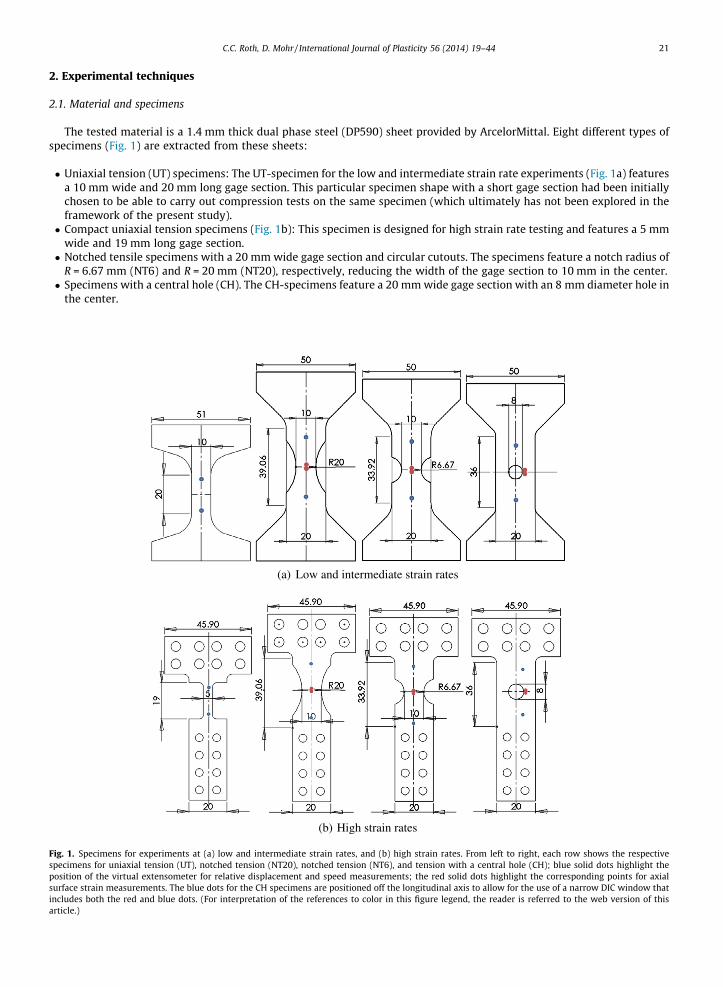
The tested material is a 1.4 mm thick dual phase steel (DP590) sheet provided by ArcelorMittal. Eight different types ofspecimens (Fig. 1) are extracted from these sheets:
� Uniaxial tension (UT) specimens: The UT-specimen for the low and intermediate strain rate experiments (Fig. 1a) featuresa 10 mm wide and 20 mm long gage section. This particular specimen shape with a short gage section had been initiallychosen to be able to carry out compression tests on the same specimen (which ultimately has not been explored in theframework of the present study).� Compact uniaxial tension specimens (Fig. 1b): This specimen is designed for high strain rate testing and features a 5 mm
wide and 19 mm long gage section.� Notched tensile specimens with a 20 mm wide gage section and circular cutouts. The specimens feature a notch radius of
R = 6.67 mm (NT6) and R = 20 mm (NT20), respectively, reducing the width of the gage section to 10 mm in the center.� Specimens with a central hole (CH). The CH-specimens feature a 20 mm wide gage section with an 8 mm diameter hole in
the center.
(a) Low and intermediate strain rates
(b) High strain rates
Fig. 1. Specimens for experiments at (a) low and intermediate strain rates, and (b) high strain rates. From left to right, each row shows the respectivespecimens for uniaxial tension (UT), notched tension (NT20), notched tension (NT6), and tension with a central hole (CH); blue solid dots highlight theposition of the virtual extensometer for relative displacement and speed measurements; the red solid dots highlight the corresponding points for axialsurface strain measurements. The blue dots for the CH specimens are positioned off the longitudinal axis to allow for the use of a narrow DIC window thatincludes both the red and blue dots. (For interpretation of the references to color in this figure legend, the reader is referred to the web version of thisarticle.)

22 C.C. Roth, D. Mohr / International Journal of Plasticity 56 (2014) 19–44
Note that the same NT and CH gage section geometries are used for all strain rates. All specimens are extracted from thesheets using water jet cutting. The hole in the CH specimen is introduced through CNC milling to minimize the effect of thesurface condition on the onset of fracture (see Dunand and Mohr, 2010). All specimens are prepared such that their tensileaxis is aligned with the rolling direction.
Prior to testing, a random speckle pattern is applied to the specimens. The relative displacement of two points on therespective upper and lower specimen shoulders (see blue dots in Fig. 1) is measured in all experiments by means of digitalimage correlation (VIC2D, Correlated Solutions). The distance between these points is equal to l0 = 17.5 mm for the UT-spec-imens, and l0 = 30 mm for the NT and CH specimens.
2.2. Experimental technique for low strain rates
The experiments at low strain rates are carried out on a MTS hydraulic testing machine with a 250 kN load cell and cus-tom-made high pressure clamps. The vertical actuator speeds for the low strain rate experiments are 2 mm/min (UT spec-imens) and 0.4 mm/min (NT and CH specimens), respectively. The software VicSnap is used in conjunction with a digitalcamera (AVT Pike F-505B/C) with a 90 mm 1:1 macro lens to acquire images at a frequency of 1 Hz with a square pixel edgelength of approximately 27 lm at a resolution of 2452 � 2054 pixels.
2.3. Experimental technique for intermediate strain rates
The intermediate strain rate experiments are conducted on the same hydraulic testing machine as the low strain rateexperiments. The UT-specimen is loaded at a cross-head speed of 20 mm/s, while the loading is applied at a constant rateof 8.3 mm/s for all other specimens. The images for DIC are acquired at a frequency of 2000 Hz using a high speed camera(Vision Research, Phantom 7.3) at a resolution of 800 � 600 pixels and a square pixel edge length of approximately 50 lm.The image acquisition is triggered by the rise in the force signal recorded by the load-cell.
2.4. Experimental set-up for high strain rates
All high strain rate experiments are carried out on a split Hopkinson pressure bar (SHPB) system equipped with a loadinversion device for tensile testing (Dunand et al., 2013). Ordering the components from the left to the right, the testing sys-tem consists of a striker bar (1204 mm long, 20 mm diameter), an input bar (3021 mm long, 20 mm diameter), a load-inver-sion device and two output bars (2041 mm long, 14 mm diameter), with all bars made out of steel. The load-inversion deviceconsists of a pusher and a stirrup (Fig. 2). The left shoulder of the specimen fits into a slot in the stirrup (matching the thick-ness of the specimen) and is clamped through eight M5 screws, while the right specimen shoulder is clamped onto thepusher. It is worth noting that the setup is designed such as to minimize the effects of bending waves due to the eccentricityof the input bar. To minimize spurious axial wave reflections, the cross section of the pusher is constant along its longitudinalaxis and matches that of the input bar. Analogously, the cross-section of the stirrup matches that of the output bars. Theassembly is guided through brass bearings with lubricated contact surfaces. A static pre-compression of about 500 N is ap-plied to the system prior to dynamic loading to ensure proper contact of all components.
The history of the axial force F[t] acting on the specimen is calculated based on the recorded output bar strain histories,etra,i[t], using strain gages positioned at a distance of 299 mm from the stirrup/output bar interface,
Fig. 2.(4) stirr
Photograph of the load inversion devicefor high strain rate tensile testing (Dunand et al., 2013): (1) input bar (Ø 20 mm), (2) pusher, (3) specimen,up, (5) first output bar (Ø 14 mm), (6) second output bar (Ø 14 mm), (7)–(9) guide blocks, and (10) base plate.

Fig. 3.enginee
C.C. Roth, D. Mohr / International Journal of Plasticity 56 (2014) 19–44 23
Fout½t� ffi �EoutAout
Xi¼1;2
etra;i½t þ Dts� ð1Þ
with the Young’s modulus Eout, and the cross section area Aout of the output bar. Note that a time shift Dts needs to be intro-duced to account for the wave travel time from the specimen/stirrup interface to the stirrup/output bar interface.
For the displacement measurements, the same high speed camera as for the intermediate strain rate experiments (VisionResearch, Phantom 7.3) is used. It is positioned at a distance of about 500 mm from the specimen which resulted in a squarepixel edge length of about 57 lm. It is set to a resolution of 448 � 32 pixels and a frequency of 111 kHz (which correspondsto a 9 ls interval between subsequent images) for the UT experiments; a resolution of 512 � 32 pixels along with an acqui-sition frequency of 100 kHz is used for the NT and CH experiments.
3. Experimental results
3.1. Uniaxial tension
As shown by Mohr et al. (2010) for other AHSS materials, the true stress–strain curve for the DP590 steel obtained fromstatic uniaxial tensile tests along different in-plane directions are almost identical (Fig. 3a), even though the correspondingLankford ratios are direction dependent: r0 = 0.98, r45 = 0.81, and r90 = 1.13. Assuming incompressibility, the Lankford ratioswere determined from the slope of the logarithmic width strain versus axial strain curve for static loading conditions.
The effect of the strain rate on the engineering stress–strain curve for uniaxial tension along the rolling direction is illus-trated by Fig. 3b. Only one curve is shown per loading velocity because of the excellent repeatability of all experiments. Ta-ble 1 provides a summary of the measured yield stresses, rYS, the ultimate strengths, rUTS, the engineering strainsat ultimate
(a) Plot of the true stress–strain curves as obtained from static uniaxial tension experiments with three different material orientations; (b)ring stress–strain curves for low, intermediate and high strain rate experiments along the rolling direction.

24 C.C. Roth, D. Mohr / International Journal of Plasticity 56 (2014) 19–44
strength, eU, and the engineering strains to fracture, eT. Observe that the material’s yield stress is about 17% higher in theintermediate strain rate experiment than in the low strain rate experiment. It is also worth noting that the elongation tofracture (engineering strain at the onset of fracture as evaluated for an extensometer length of 17.5 mm) is significantly high-er in the low strain rate experiment than in the intermediate and high strain rate experiments.
3.2. Fracture experiments
Fig. 4 shows representative force–displacement curves for the NT20, NT6 and CH experiments for three different speeds ofloading (see Table 2); all curves are truncated at the apparent point of onset of fracture. For the low and intermediate strainrate experiments the onset of fracture may be determined either from a steep drop in the force level or a visible crack on theDIC image. In the high strain rate experiments, it is determined by the first visible crack on the specimen surface, since therecorded force history does not drop abruptly (which is attributed to the low wave speed of high frequency signals in bars).
All experiments show a force maximum prior to the onset of fracture, which increases as a function of the loading speed.The shapes of the force–displacement curves for low and intermediate strain rates are similar up to the force maximum, i.e. adynamic increase factor could be used to describe the effect of the loading speed. The shape of the curve for the fast loadingspeed is different, i.e. it exhibits a significantly higher force level at the beginning of the experiment followed by a less pro-nounced hardening regime. Note that after the force maximum, the decrease in force is higher the faster the loading speed.However, it is remarkable to see that for all three specimen types, the displacement to fracture appears to be almost inde-pendent of the loading speed.
To gain further insight into the local deformation fields, we also report the strain determined from a 1 mm long virtualextensometer on the specimen surface (see secondary axis in Fig. 4). The extensometer is positioned on the longitudinalsymmetry axis of the NT6 and NT20 specimens, and at a distance of 0.5 mm from the central hole boundary of the CH spec-imen (see pairs of red dots in Fig. 1). The evolution of the local strain as a function of the axial displacement is very similarirrespective of the speed of loading. In particular, only small variations are observed at the onset of fracture. For the NT20specimens, the surface strain at the onset of fracture is 0.70 ± 0.03. The corresponding strains for the NT6 and CH specimensare 0.55 ± 0.04 and 0.66 ± 0.03, respectively. In addition to local strain measurements, post-mortem thickness profiles havebeen prepared from fractured NT20 specimens for all three loading speeds. The specimens are cut along their longitudinalaxis of symmetry. The polished cross-sections are then photographed and measured using an optical microscope. The cor-responding plots (Fig. 5a) shows the severe thickness reduction, from an initial thickness of 1.4 mm to less than 0.7 mm atthe specimen center. Observe that the thickness reduction increases as a function of the speed of loading.
4. Rate-dependent plasticity model
An extension of the rate-independent non-associated quadratic plasticity model of Mohr et al. (2010) is proposed. Themain purpose of the non-associated flow rule is to account for the direction dependency of the Lankford ratios in materialsthat exhibit a direction independent stress–strain response. Furthermore, Mohr et al. (2010) reported more realistic predic-tions of the strain localization when using a non-associated flow rule as compared to associated plastic flow. The proofs ofthe uniqueness of the stress distribution, the stability of plastic flow and the uniqueness of the stress and strain state aregiven by Stoughton (2002) for the rate-independent case. In close analogy with the Johnson–Cook plasticity model (Johnsonand Cook, 1983), the deformation resistance is multiplicatively decomposed into a strain, strain rate and temperature depen-dent function. The incremental temperature increase is related to the strain rate and the rate of plastic work. As a result, theexplicit dependence on the temperature is eliminated from the constitutive equations, while preserving the model’s abilityto account for thermal softening at high strain rates.
4.1. Yield function and flow rule
The yield function is described by the equation
Table 1DP590and the
_e½1=sa½��rYS [rUTS
eU [–eT [–
* For st** For s
f ½r; k� ¼ �r� k ¼ 0 ð2Þ
material properties determined from the tensile tests: yield stresses, rYS, the ultimate strengths, rUTS, the engineering strains at ultimate strength, eU,engineering strains to fracture, eT.
� 0.001 0.001 0.001 0.63 70 143 270 5670 45 90 0 0 0 0 0
MPa] 352 353 353 412 523 565 588 599[MPa] 607 607 605 655 * * 732 740] 0.19 0.18 0.17 0.16 * * 0.13 0.14] 0.36 0.33 0.32 0.30 * * ** 0.29
rain rates of 70/s and 145/s the experiment was stopped before reaching the point of maximum force.train rate of 270/s experiment was stopped before fracture occurred.
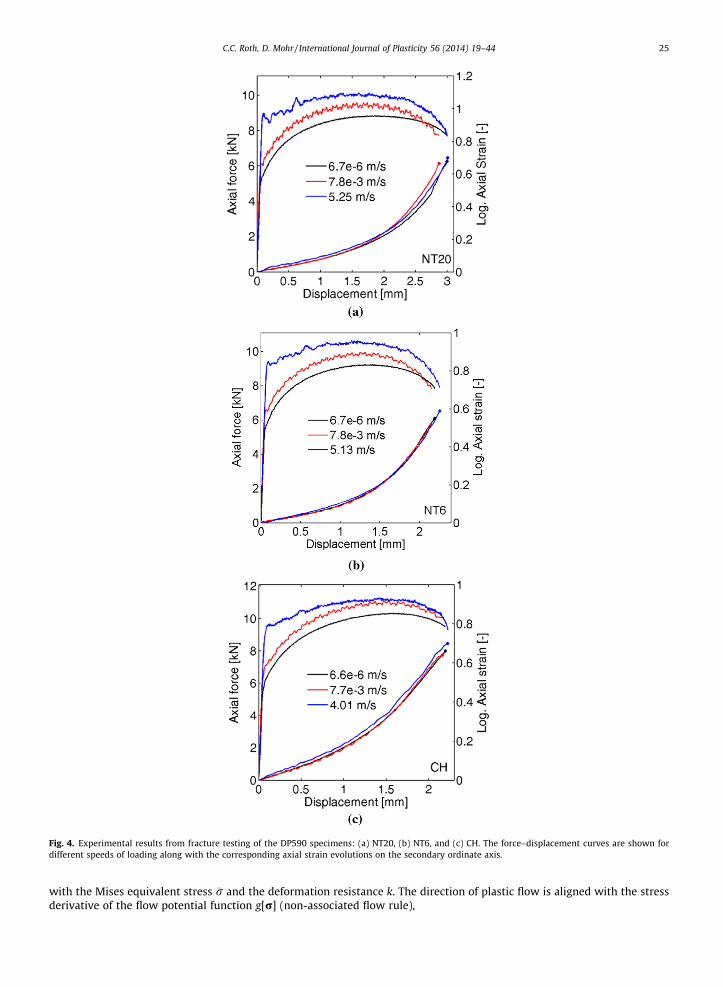
Fig. 4. Experimental results from fracture testing of the DP590 specimens: (a) NT20, (b) NT6, and (c) CH. The force–displacement curves are shown fordifferent speeds of loading along with the corresponding axial strain evolutions on the secondary ordinate axis.
C.C. Roth, D. Mohr / International Journal of Plasticity 56 (2014) 19–44 25
with the Mises equivalent stress �r and the deformation resistance k. The direction of plastic flow is aligned with the stressderivative of the flow potential function g[r] (non-associated flow rule),

Table 2Relative velocities of DP590 specimen shoulders as determined from measurements with a 30 mm longvirtual extensometer. The corresponding values for the experiments on the TRIP780 specimens are givenin parentheses.
NT20 [m/s] NT6 [m/s] CH [m/s]
Slow 6.7 � 10�6
(7.8 � 10�6)6.7 � 10�6
(7.6 � 10�6)6.6 � 10�6
(n.a.)Intermediate 7.8 � 10�3
(7.8 � 10�3)7.8 � 10�3
(7.8 � 10�3)7.7 � 10�3
(n.a.)Fast 5.25
(7.1)5.13(4.2)
4.01(n.a.)
Fig. 5. (a) Measured thickness of a fractured NT20 specimen as a function of the distance along the longitudinal axis. (b) Superposition of the thicknessprofiles from experiments (dots) with those obtained from finite element analysis (solid lines). Intermediate and fast curves are shifted by �0.4 mm and�0.8 mm, respectively to improve readability.
Table 3Lankford coefficients for DP590 and TRIP780.
r0 [–] r45 [–] r90 [–]
DP590 0.98 0.81 1.13TRIP780 0.67 0.96 0.85
26 C.C. Roth, D. Mohr / International Journal of Plasticity 56 (2014) 19–44

C.C. Roth, D. Mohr / International Journal of Plasticity 56 (2014) 19–44 27
dep ¼ dk@g½r�@r
ð3Þ
dep denotes the increment in the plastic strain vector (in the material coordinate system)
ep ¼ ½ep11 ep
22 ep33 2ep
12 2ep23 2ep
13�T ð4Þ
r is the Cauchy stress vector,
r ¼ ½r11 r22 r33 r12 r23 r13�T ð5Þ
and dk P 0 is a scalar plastic multiplier. The flow potential is defined through the quadratic form
g½r� ¼ffiffiffiffiffiffiffiffiffiffiffiffiffiffiffiffiffiðGrÞ � r
pð6Þ
with
G ¼
1 G12 �ð1þ G12Þ 0 0 0G12 G22 �ðG22 þ G12Þ 0 0 0
�ð1þ G12Þ �ðG22 þ G12Þ 1þ 2G12 þ G22 0 0 00 0 0 G33 0 00 0 0 0 3 00 0 0 0 0 3
2666666664
3777777775
ð7Þ
g[r] actually corresponds to a special case of the Hill (1948) yield function which accounts for planar anisotropy with direc-tion dependent Lankford ratios (see Table 3) through the anisotropy coefficients G12, G22 and G33. For G12 = �0.5, G22 = 1 andG33 = 3, the flow potential reduces to the isotropic von Mises equivalent stress.
The equivalent plastic strain increment d�ep is defined as work-conjugate to the von Mises equivalent stress through theidentity
r : dep ¼ �rðd�epÞ ð8Þ
4.2. Decomposition of the deformation resistance
The Johnson–Cook model suggests the multiplicative decomposition of the deformation resistance into three functionsthat represent the effect of strain hardening, strain rate and temperature, respectively,
k½�ep; _�ep; T� ¼ ke½�ep� k _e½ _�ep� kT ½T� ð9Þ
Inspired by the work of Sung et al. (2010), the strain hardening is represented by a linear combination of a power andexponential law,
ke½�ep� ¼ akS½�ep� þ ð1� aÞkV ½�ep� ð10Þ
with the power law (Swift, 1952)
kS½�ep� ¼ Að�ep þ e0Þn ð11Þ
and the exponential law (Voce, 1948),
kV ½�ep� ¼ k0 þ Qð1� e�b�ep Þ ð12Þ
The strain rate hardening term is represented by the logarithmic form
k _e½ _�ep� ¼1 for _�ep < _e0
1þ C ln½ _�ep_e0� for _�ep P _e0
(ð13Þ
with the parameter C and the reference strain rate _e0. Furthermore, the standard Johnson–Cook term is used to account forthermal softening,
kT ½T� ¼1 for T < Tr
1� ð T�TrTm�Tr
�mfor Tr 6 T 6 Tm
(ð14Þ
with the exponent m, the reference temperature Tr, and the melting temperature Tm of the tested material.
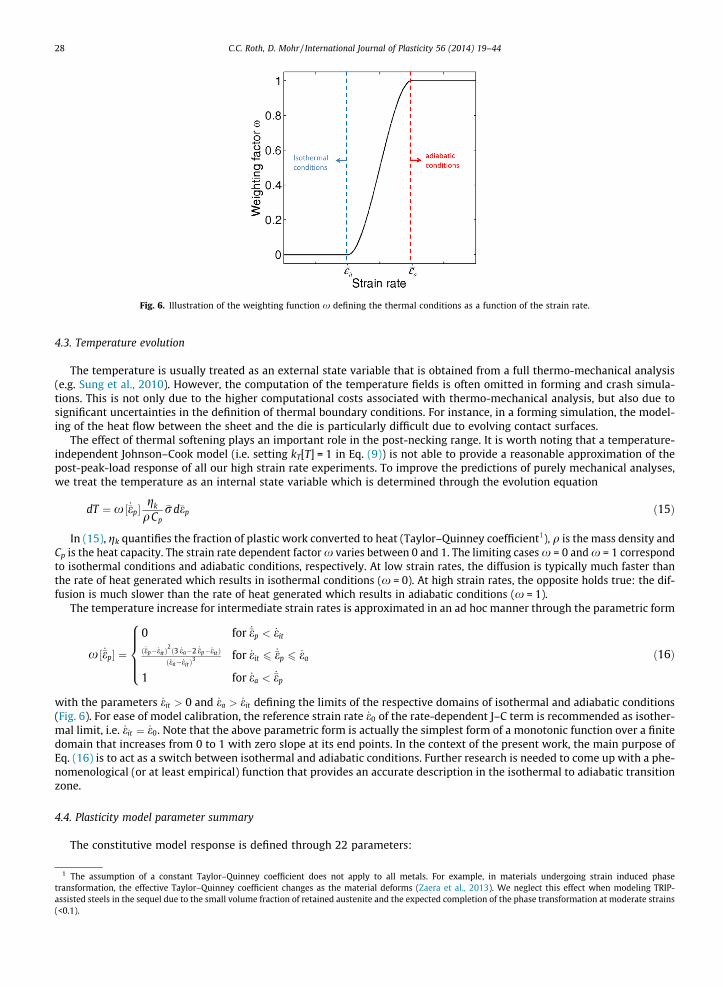
Fig. 6. Illustration of the weighting function x defining the thermal conditions as a function of the strain rate.
28 C.C. Roth, D. Mohr / International Journal of Plasticity 56 (2014) 19–44
4.3. Temperature evolution
The temperature is usually treated as an external state variable that is obtained from a full thermo-mechanical analysis(e.g. Sung et al., 2010). However, the computation of the temperature fields is often omitted in forming and crash simula-tions. This is not only due to the higher computational costs associated with thermo-mechanical analysis, but also due tosignificant uncertainties in the definition of thermal boundary conditions. For instance, in a forming simulation, the model-ing of the heat flow between the sheet and the die is particularly difficult due to evolving contact surfaces.
The effect of thermal softening plays an important role in the post-necking range. It is worth noting that a temperature-independent Johnson–Cook model (i.e. setting kT[T] = 1 in Eq. (9)) is not able to provide a reasonable approximation of thepost-peak-load response of all our high strain rate experiments. To improve the predictions of purely mechanical analyses,we treat the temperature as an internal state variable which is determined through the evolution equation
1 Thetransforassisted(<0.1).
dT ¼ x ½ _�ep�gk
qCp�rd�ep ð15Þ
In (15), gk quantifies the fraction of plastic work converted to heat (Taylor–Quinney coefficient1), q is the mass density andCp is the heat capacity. The strain rate dependent factor x varies between 0 and 1. The limiting cases x = 0 and x = 1 correspondto isothermal conditions and adiabatic conditions, respectively. At low strain rates, the diffusion is typically much faster thanthe rate of heat generated which results in isothermal conditions (x = 0). At high strain rates, the opposite holds true: the dif-fusion is much slower than the rate of heat generated which results in adiabatic conditions (x = 1).
The temperature increase for intermediate strain rates is approximated in an ad hoc manner through the parametric form
x ½ _�ep� ¼
0 for _�ep < _eit
ð _�ep� _eit Þ2ð3 _ea�2 _�ep� _eit Þð _ea� _eit Þ
3 for _eit 6_�ep 6 _ea
1 for _ea < _�ep
8>>><>>>:
ð16Þ
with the parameters _eit > 0 and _ea > _eit defining the limits of the respective domains of isothermal and adiabatic conditions(Fig. 6). For ease of model calibration, the reference strain rate _e0 of the rate-dependent J–C term is recommended as isother-mal limit, i.e. _eit ¼ _e0. Note that the above parametric form is actually the simplest form of a monotonic function over a finitedomain that increases from 0 to 1 with zero slope at its end points. In the context of the present work, the main purpose ofEq. (16) is to act as a switch between isothermal and adiabatic conditions. Further research is needed to come up with a phe-nomenological (or at least empirical) function that provides an accurate description in the isothermal to adiabatic transitionzone.
4.4. Plasticity model parameter summary
The constitutive model response is defined through 22 parameters:
assumption of a constant Taylor–Quinney coefficient does not apply to all metals. For example, in materials undergoing strain induced phasemation, the effective Taylor–Quinney coefficient changes as the material deforms (Zaera et al., 2013). We neglect this effect when modeling TRIP-steels in the sequel due to the small volume fraction of retained austenite and the expected completion of the phase transformation at moderate strains

C.C. Roth, D. Mohr / International Journal of Plasticity 56 (2014) 19–44 29
� Two elasticity constants E and m;� Seven parameters describing strain hardening: the Voce parameters {k0, Q, b}, the Swift parameters {A, e0, n}, and the
weighting factor a;� Three parameters {G12, G22, G33} specifying the anisotropic flow rule;� Two parameters fC; _e0g describing the effect of strain rate on plasticity;� Three parameters {Tr, Tm, m} describing the effect of temperature on plasticity;� Four parameters determining the temperature evolution: the Taylor–Quinney coefficient gk, the material density q and
the heat capacity Cp;� Two model parameters describing the thermal conditions: the isothermal limit strain rate _eit and the adiabatic limit strain
rate _ea. These two parameters are part of the plasticity model, but these are not material parameters per se. They aredetermined by the loading/deformation and environmental conditions.
5. Finite element analysis
Finite element simulations are performed of all experiments to (1) facilitate the inverse identification of the materialmodel parameters, to (2) validate the proposed plasticity model, and to (3) extract the so-called loading path to fracturefor different stress states and strain rates.
5.1. FE meshes and boundary conditions
All simulations are carried out as dynamic explicit analyses with the finite element program Abaqus (2011). Uniformmass scaling is applied in low and intermediate strain rate simulations, such that the simulations terminate after approxi-mately 200,000 time steps. The high strain rate simulations are performed without any mass scaling.
Due to the symmetry of the mechanical systems, only one eighth of each specimen (NT6, NT20, CH) is modeled (Fig. 7).The height of each mesh equates to half the length of the DIC extensometer from the respective experiment (recall blue dotsin Fig. 1). The measured displacement history is applied to all nodes on the upper faces of the FE meshes. A zero normal dis-placement constraint is applied to the nodes positioned on the three symmetry planes of the specimens. Following the rec-ommendation of Dunand and Mohr (2010), a mesh with an element length of le = 100 lm and eight first-order solid elementsover half the thickness is utilized to model through-thickness necking. Note that quasi-static loading conditions prevail in allexperiments (see Dunand et al., 2013). As a consequence, the modeling of the full specimen (or even the entire SHPB system)could be omitted.
5.2. Plasticity model parameter identification
The plasticity model parameters are identified as follows:
� The anisotropy parameters are determined directly from the Lankford ratio measurements (at low strain rates) using theanalytical relationships
Fig. 7.le = 100
(a) NT20 (b) NT6 (c) CH
Finite element models of the fracture specimens. Each model has eight elements through half the thickness and an element edge length oflm in the vicinity of the assumed location of onset of fracture.

Table 4Plastici
A [M
1031(152
a [–]
0.64(0.53
E [G
210(185
30 C.C. Roth, D. Mohr / International Journal of Plasticity 56 (2014) 19–44
G12 ¼ �r0
1þ r0; G22 ¼
r0
r90
1þ r90
1þ r0and G33 ¼
1þ 2r45
r90
r0 þ r90
1þ r0ð17Þ
� The Voce and Swift strain hardening parameters are obtained from a least-square fit of the true stress-true strain curveobtained from low strain rate tension tests (up to the onset of necking).� The room temperature is chosen as reference temperature Tr = 293 K.� The parameters {E, m, q, cp, gk} are taken from the literature (see Table 4).� The remaining parameters p ¼ fa;C; _e0; Tm;m; _eag are identified through inverse analysis of the NT20 experiments (which
includes the post-necking range).
After simulating the NT20 experiment for low, intermediate and high speed loading, for a given parameter set pk, the dif-ference between the experimental and computed force–displacement curves is quantified through the cost function
U½pk� ¼X3
j¼1
1Nj
XNj
i¼1
w½u�j;iðFexpj;i ½u� � Fsim
n;i ½u;pk�Þ 2 ð18Þ
Here Fexpi and Fsim
i are the force levels at the ith experimental data point (with a total of Nj = 100 points per curve). Theindex j denotes the respective experiment which is evaluated (low, intermediate or high strain rate); w[u]n,i is a weighingfactor that is chosen as wðu 6 u½Fmax�Þ ¼ 1 up to the force maximum and w(u > u[Fmax]) = 2 from the force maximum tothe point of fracture. Emphasis is put on the second part of the load–displacement curve, as most plastic strain accumulatesafter the force maximum. It is of great importance for the reliability of the fracture strain estimates that the simulated force–displacement curve matches the experimental one in this range.
A minimum of the cost function in the five-dimensional parameter space is sought using a derivative-free simplex algo-rithm (Nelder and Mead, 1965). A solution satisfying / < 0.1N2 (Table 4) is obtained after 264 iterations. To illustrate thebehavior of the calibrated constitutive model, we plotted its stress–strain response for uniaxial tension at different strainrates in Fig. 8a. To elucidate the competition of the effects of strain rate and temperature, we computed also the model re-sponse for the theoretical limiting cases of isothermal conditions (x = 0) and adiabatic conditions (x = 1). The comparison ofFig. 8a with Fig. 8b and c shows that the rate effect is dominant at small strains (up to about 0.2), before thermal softeningdominates the hardening response at intermediate and high strain rates.
5.3. Comparison of the experiments and simulations
Figs. 9–11 compare the force–displacement and axial strain–displacement curves from the simulations (solid lines) withthe experimental results (dotted lines) for all tested specimen geometries and all speeds of loading. Recall that the NT20experiments (Fig. 9) have been used to calibrate the model. The good agreement of the measured and simulated curvesfor NT6 (Fig. 10) and CH specimens (Fig. 11) may therefore be seen as validation of the proposed plasticity model.
� For the NT20 experiments at slow and intermediate speeds of loading (Fig. 9a and c), the computed force–displacementcurves (solid black lines) match those measured experimentally (dotted black curves) very well. The overall prediction ofthe surface strain evolution (blue curves) is also satisfactory. For the high speed simulation (Fig. 9e), the force–displace-ment curves also agree well, except for the onset of inelastic deformation, where the experiment exhibits a higher forcethan the simulation.� For NT6 (Fig. 10), similar observations are made as for NT20, i.e. good agreement of experiment and simulations is
observed for both the force–displacement and strain–displacement curves, except for the initial force level at high veloc-ity loading.� For the slow and intermediate speed CH experiments, the simulation results agree well with the experimental curves
(Fig. 11a and c). For the fast CH simulation (Fig. 11c), the force level at peak load is exceeded by about 10%, but the evo-lution of the axial strain is captured well by the simulation.
ty model parameters for DP590; the corresponding values for the TRIP780 steel are given in parentheses.
Pa] e0 [–] n [–] k0 [MPa] Q [MPa] b [–]
.06.5)
0.00128(0.00519)
0.199(0.242)
350(488.91)
324.25(447.5)
25.92(18.65)
C [-] _e0 [1/s] Tr [K] Tm [K] m [–]
06)
0.01366(0.00557)
0.00116(0.00321)
293(293)
1673.7(1806.7)
0.921(1.025)
Pa] m [–] Cp ½J=kg K� q [kg/m3] _ea [1/s] gk [–]
)0.33(0.33)
420(420)
7850(7850)
1.379(1.343)
0.9(0.9)

Fig. 8. Effect of strain rate on stress–strain response of the calibrated plasticity model (DP590) for (a) variable thermal conditions (x ¼ x½ _�epl�), (b) forisothermal conditions (x = 0), (c) for adiabatic conditions (x = 1).
C.C. Roth, D. Mohr / International Journal of Plasticity 56 (2014) 19–44 31
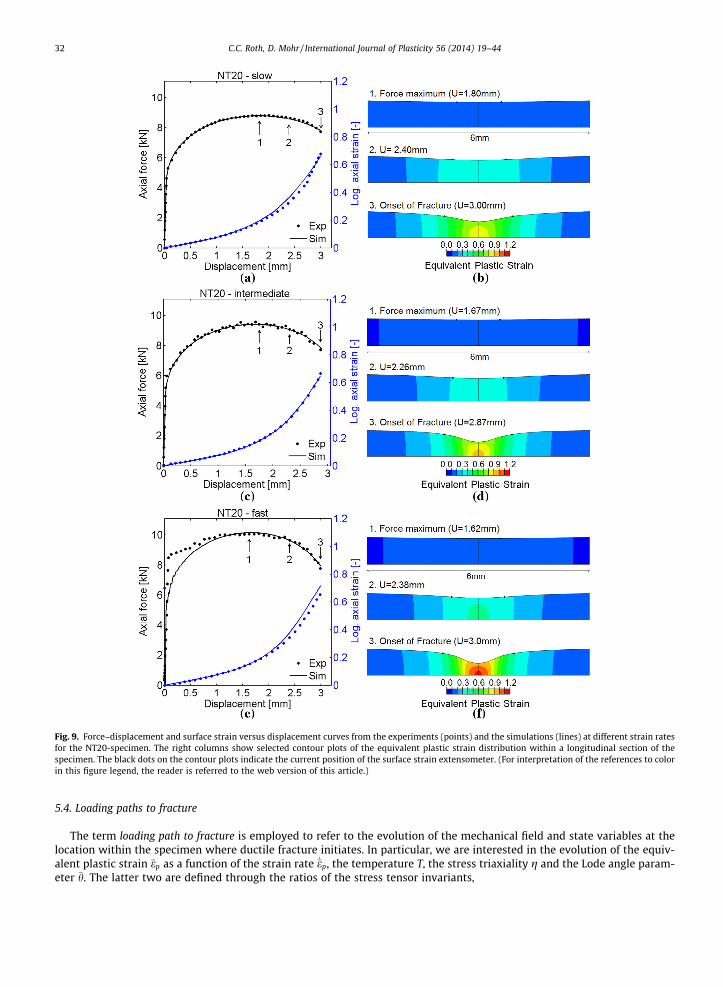
Fig. 9. Force–displacement and surface strain versus displacement curves from the experiments (points) and the simulations (lines) at different strain ratesfor the NT20-specimen. The right columns show selected contour plots of the equivalent plastic strain distribution within a longitudinal section of thespecimen. The black dots on the contour plots indicate the current position of the surface strain extensometer. (For interpretation of the references to colorin this figure legend, the reader is referred to the web version of this article.)
32 C.C. Roth, D. Mohr / International Journal of Plasticity 56 (2014) 19–44
5.4. Loading paths to fracture
The term loading path to fracture is employed to refer to the evolution of the mechanical field and state variables at thelocation within the specimen where ductile fracture initiates. In particular, we are interested in the evolution of the equiv-alent plastic strain �ep as a function of the strain rate _�ep, the temperature T, the stress triaxiality g and the Lode angle param-eter �h. The latter two are defined through the ratios of the stress tensor invariants,

Fig. 10. Force–displacement and surface strain versus displacement curves from the experiments (points) and the simulations (lines) at different strainrates for the NT6-specimen. The right columns show selected contour plots of the equivalent plastic strain distribution within a longitudinal section of thespecimen. The black dots on the contour plots indicate the current position of the surface strain extensometer.
C.C. Roth, D. Mohr / International Journal of Plasticity 56 (2014) 19–44 33
g ¼ I1
3ffiffiffiffiffiffiffi3J2
p ð19Þ
�h ¼ 1� 2p
arccos3ffiffiffi3p
2J3
ðJ2Þ3=2
" #ð20Þ
with the invariant definitions

Fig. 11. Force–displacement and surface strain versus displacement curves from the experiments (points) and the simulations (lines) at different strainrates for the CH-specimen. The right columns show selected contour plots of the equivalent plastic strain distribution within a longitudinal section of thespecimen. The black dots on the contour plots indicate the current position of the surface strain extensometer.
34 C.C. Roth, D. Mohr / International Journal of Plasticity 56 (2014) 19–44
I1 ¼ trr; J2 ¼12
s : s; J3 ¼ det½s� and s ¼ dev ½r� ð21Þ
According to (20), the Lode angle parameter varies from �h ¼ �1 (axisymmetric, generalized compression) to �h ¼ 1 (axi-symmetric, generalized tension), with �h ¼ 0 for generalized shear.
One important assumption will be that fracture initiates at the integration point with the highest equivalent plastic strainat the instant of specimen fracture. For the NT20 and NT6 specimens, this point is positioned at the very center of the spec-imen, i.e. at the intersection point of all planes of specimen symmetry. In the CH specimens, this point is positioned on thespecimen mid-plane at a distance of about 0.5 mm from the central hole boundary. This is due to the fact that the thickness

C.C. Roth, D. Mohr / International Journal of Plasticity 56 (2014) 19–44 35
reduction is most pronounced at a small distance away from the hole boundary. Decreasing the hole diameter would movethe point of highest equivalent plastic strain towards the hole boundary. However, the fracture initiation might then be af-fected by initial surface imperfections on the hole boundary due to machining.
Fig. 12 shows a summary of all loading paths to fracture in terms of the equivalent plastic strain, the stress triaxiality andthe Lode angle parameter. The cross symbols on the loading paths indicate the point at which the force maximum is reached.Irrespective of the specimen type (NT20, NT6, CH), the stress state is independent of the strain rate and remains
Fig. 12. Loading paths to fracture forNT20 (first line), NT6 (second line) and CH (third line) experiments on the DP590 steel. The left column figures showthe equivalent plastic strain as a function of the stress triaxiality, the right columns show the evolution of the equivalent plastic strain as a function of theLode angle. On each curve, the fracture strain predicted by the rate-modified Hosford–Coulomb model is indicated by a solid dot; the instant of maximumforce is highlighted by a cross symbol.
36 C.C. Roth, D. Mohr / International Journal of Plasticity 56 (2014) 19–44
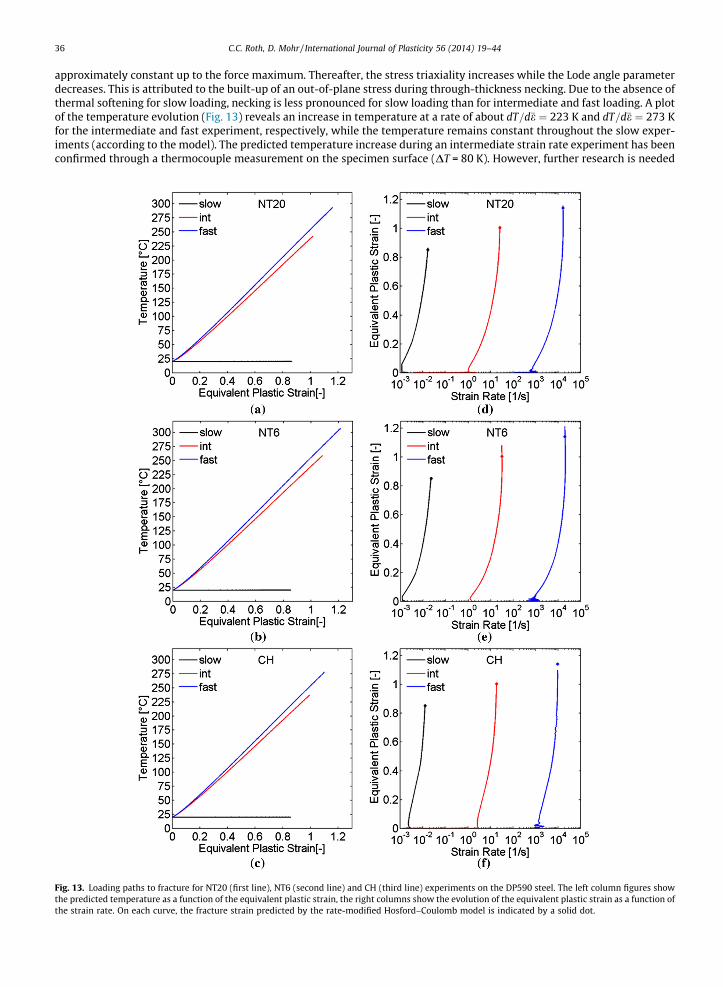
approximately constant up to the force maximum. Thereafter, the stress triaxiality increases while the Lode angle parameterdecreases. This is attributed to the built-up of an out-of-plane stress during through-thickness necking. Due to the absence ofthermal softening for slow loading, necking is less pronounced for slow loading than for intermediate and fast loading. A plotof the temperature evolution (Fig. 13) reveals an increase in temperature at a rate of about dT=d�e ¼ 223 K and dT=d�e ¼ 273 Kfor the intermediate and fast experiment, respectively, while the temperature remains constant throughout the slow exper-iments (according to the model). The predicted temperature increase during an intermediate strain rate experiment has beenconfirmed through a thermocouple measurement on the specimen surface (DT = 80 K). However, further research is needed
Fig. 13. Loading paths to fracture for NT20 (first line), NT6 (second line) and CH (third line) experiments on the DP590 steel. The left column figures showthe predicted temperature as a function of the equivalent plastic strain, the right columns show the evolution of the equivalent plastic strain as a function ofthe strain rate. On each curve, the fracture strain predicted by the rate-modified Hosford–Coulomb model is indicated by a solid dot.

C.C. Roth, D. Mohr / International Journal of Plasticity 56 (2014) 19–44 37
to confirm the particular parametric form of the function x½ _�e� given in Eq. (16). Our simulations for different forms revealednotable changes of the temperature at the specimen center for similar surface temperatures.
The longitudinal cross-sectional views of the specimens (right columns in Figs. 9–12) show the strain distributionthroughout the necking phase. Up to the force maximum, plane stress conditions prevail and the strain distribution isapproximately uniform along the thickness direction. Throughout necking, the deformation localizes within a small zonealong the longitudinal axis and through-thickness gradients built up. The comparison of the cross-sectional views at the on-set of fracture for different loading velocities clearly shows that the localization severity increases the higher the speed ofloading.
The corresponding plots of the equivalent plastic strain versus the strain rate (right columns of Fig. 13) show that thestrain rate increases by at least one order of magnitude after the onset of necking. For example, the pre-necking strain ratein the fast NT20 experiment is about 103=s, while a strain rate of about 104=s is reached at the onset of fracture.
6. Rate-dependent Hosford–Coulomb fracture initiation model
6.1. Model formulation
An empirical extension of the Hosford–Coulomb fracture initiation model is proposed to account for the effect of strainrate on ductile fracture. The rate-independent Hosford–Coulomb model has been formulated assuming that ductile fractureis imminent with the onset of shear localization at the microscale (Mohr and Marcadet, submitted for publication). Accordingto the Hosford–Coulomb model, fracture occurs at an equivalent plastic strain of �ef when the integral condition
Fig. 14.equivaltriaxial
Z �ef
0
d�epl
�eprf ½g; �h�
¼ 1 ð22Þ
(a) Illustration of the fracture surfaces (for proportional loading) for different strain rates in the space of stress triaxiality, Lode angle parameter andent plastic strain. (b) Illustration of the corresponding fracture envelopes for plane stress conditions in the equivalent plastic strain versus stressity plane.

38 C.C. Roth, D. Mohr / International Journal of Plasticity 56 (2014) 19–44
is fulfilled. In (22), the analytical expression for the strain to fracture for proportional loading is derived from the Hosford–Coulomb model in stress space,
Fig. 15.of the c
�eprf ½g; �h� ¼ bð1þ cÞ
1n
12ððf1 � f2Þa þ ðf2 � f3Þa þ ðf1 � f3ÞaÞ
� �1a
þ cð2gþ f1 þ f3Þ !�1
n
ð23Þ
with the Lode angle parameter dependent trigonometric functions
f1½�h� ¼23
cosp6ð1� �hÞ
h i; f 2½�h� ¼
23
cosp6ð3þ �hÞ
h iand f 3½�h� ¼ �
23
cosp6ð1þ �hÞ
h i:
The main model parameters are {a, b, c}. The Hosford exponent a controls the effect of the Lode angle parameter, whilethe friction coefficient c primarily controls the effect of the stress triaxiality on the strain to fracture. The model parameter bis a multiplier controlling the overall magnitude of the strain to fracture. It is defined such that it is equal to the strain tofracture for uniaxial tension (which is the same as that for equi-biaxial tension). The parameter n has only little effect onthe calibrated model as a similar effect can also be achieved by adjusting the coefficients a and b (Eq. (23)). It originates froma power law type of isotropic hardening model. We chose n = 0.1 as it is a typical hardening exponent for metals. However, itis reemphasized that a different value could also be chosen without changing the reported results.
In loose analogy with the Johnson and Cook (1985) fracture model, the effect of strain rate is incorporated into the Hos-ford–Coulomb model through the coefficient b,
b ¼b0 for _�ep < _e0
b0ð1þ c ln½ _�ep_e0�Þ for _�ep P _e0
(ð24Þ
(a) Parameter b of the rate-modified Hosford–Coulomb model as a function of the strain rate as calibrated for the DP590 and TRIP780 steels. (b) Plotalibrated fracture envelopes for different strain rates.

Fig. 16. Force–displacement and surface strain versus displacement curves from the NT20 (left column) and NT6 (right column) experiments andsimulations for the TRIP780 steel. No local strain measurements were available for fast loading (Dunand, 2013).
C.C. Roth, D. Mohr / International Journal of Plasticity 56 (2014) 19–44 39
b0 > 0 is the strain to fracture for uniaxial tension at low strain rates, while the model parameter c P 0 controls the strainrate sensitivity of the fracture initiation model. Fig. 14a illustrates the effect of the strain rate on the resulting ‘‘fracture sur-face’’ in the space of equivalent plastic strain, stress triaxiality and Lode angle parameter. The corresponding fracture enve-lopes for plane stress loading are shown in Fig. 14b.
6.2. Model validation for DP590 steel
The calibration of the fracture initiation model requires a characterization of the effects of stress state (parameters a andc) and strain rate (parameters b0 and c). Based on the results of Mohr and Marcadet (submitted for publication) on the stressstate sensitivity of the present DP590 steel under static loading, the parameters a = 1.97 and c = 0 are chosen to account for

Fig. 17. Loading paths to fracture for NT20 (first line) and NT6 (second line) experiments on the TRIP780 steel. The left column figures show the equivalentplastic strain as a function of the stress triaxiality, the right columns show the evolution of the equivalent plastic strain as a function of the Lode angle. Oneach curve, the fracture strain predicted by the rate-modified Hosford–Coulomb model is indicated by a solid dot; the instant of maximum force ishighlighted by a cross symbol.
40 C.C. Roth, D. Mohr / International Journal of Plasticity 56 (2014) 19–44
the mild influence of the Lode angle on the fracture strain. The parameters controlling the rate dependency are then cali-brated based on the loading paths to fracture for the slow, intermediate and fast NT20 experiments. The solid dots in Figs. 12and 13 highlight the instants of onset of fracture predicted by the above model using the parameters b0 = 0.82 and c = 0.025.Good agreement of the predicted instants of fracture (solid dots) and those identified experimentally (respective end pointsof the solid loading paths) is not only observed for all NT20 experiments (used for calibration), but also for all NT6 and CHexperiments, with a maximum relative error in the predicted strain to fracture of 6.5%. Fig. 15a shows the evolution of b ver-sus _�ep, while Fig. 15b shows the fracture envelope for plane stress conditions.
6.3. Model validation for TRIP780 steel
The proposed plasticity and fracture models are also applied to a 1.4 mm thick TRIP780 steel. Dunand (2013) performedNT6 and NT20 experiments for slow, intermediate and fast loading conditions on this material using the same experimentalprocedures as those outlined above. The stress state sensitivity parameters a = 1.22 and c = 0.11 had been identified for thistype of material by Mohr and Marcadet (submitted for publication) based on the experimental results from butterfly, CH, NTand punch specimens.2 Following the same procedure as for the DP590 material, the parameters of the above rate-dependentplasticity model have been identified (Table 4). The corresponding force–displacement curves are shown in Fig. 16. Note thegood agreement of the numerical simulations with the experiments in the post-necking range.
The extracted loading paths to fracture for the NT6 and NT20 experiments are shown in Figs. 17 and 18. The strain tofracture increases from 0.58 to 0.93 when increasing the speed of loading from 7.6 � 10�6 m/s to 4.2 m/s in a NT6 experiment.
2 The results for the TRIP780 steel reported in earlier publications were from a different batch of sheets which is the main reason for slight differences in thereported material properties for static loading.

C.C. Roth, D. Mohr / International Journal of Plasticity 56 (2014) 19–44 41
As for the DP590 steel, the force maximum is already reached at an equivalent plastic strain of about 0.2, i.e. a substantialportion of the total deformation is accumulated in the post-necking range. The b versus _�ep curve of the rate-dependent frac-ture model, as calibrated based on the NT20 and punch results, is shown as a dashed curve in Fig. 15a (b0 = 1.27 andc = 0.066). The corresponding model predictions of the instant of onset of fracture (solid dots in Fig. 17) agree well withthe experiments (end of the loading paths). Good agreement is also observed for NT6, with a maximum error of 6.4% inthe strain to fracture for the slow experiment. The complete fracture envelope for the TRIP780 is depicted with a dashed linein Fig. 15b.
6.4. Discussion
The proposed rate-dependent Hosford–Coulomb model integrates the effect of the strain rate on an empirical basis. Thisapproach shows reasonable results for the two advanced high strength steels considered here. However, it does not differ-entiate between the effects of temperature and strain rate. It appears to be impossible to perform high strain rate experi-ments under isothermal conditions (except for multiple loadings, e.g. Nemat-Nasser and Isaacs, 1997). Static experimentsat different temperatures would be an option, but other phenomena such as dynamic strain aging are expected to come intoplay (e.g. Queiroz et al., 2012; Chaboche et al., 2013). It is therefore expected that shear localization analysis of unit cell mod-els (see Barsoum and Faleskog (2007) and Dunand and Mohr (2014)) with a temperature- and rate-dependent matrix mate-rial will provide an answer to the fundamental question of the respective effects of strain rate and temperature on the onsetof ductile fracture.
In engineering practice, the present model is probably sufficient since the temperature fields are seldom calculated in arigorous manner. Moreover, it is worth noting that the simulation results are mesh-size dependent. Dunand and Mohr (2010)showed an example of numerical simulations with a rate- and temperature independent plasticity model that do convergewith respect to the element size even after the onset of necking precedes fracture. In other words, the stress-state dependent
Fig. 18. Loading paths to fracture for NT20 (first line) and NT6 (second line) experiments on the TRIP780 steel. The left column figures show the predictedtemperature as a function of the equivalent plastic strain, the right columns show the evolution of the equivalent plastic strain as a function of the strainrate. On each curve, the fracture strain predicted by the rate-modified Hosford–Coulomb model is indicated by a solid dot.

Fig. 19. Illustration of the mesh size dependency of the simulation results (intermediate speed NT6 simulations for DP590). The left column shows theresults for active thermal softening (i.e. the full rate- and temperature dependent constitutive model). The right column shows the results from the samesimulations with inactive thermal softening. The ‘‘normal’’ mesh features 8 elements through half the sheet thickness, the ‘‘fine’’ mesh has 16, and the ‘‘veryfine’’ mesh has 32.
42 C.C. Roth, D. Mohr / International Journal of Plasticity 56 (2014) 19–44
parameters of the fracture initiation model could be determined in a rigorous manner. However, this convergence appears tobreak down when thermal softening comes into play. This is briefly illustrated in Fig. 19 where we present the results fromnumerical simulations of the intermediate velocity NT6 experiments with active thermal softening (left column) and inactivethermal softening (right column). Observe that the simulation results converge with respect to the mesh size when thermalsoftening is inactive. The reported fracture model parameters controlling the rate dependency are therefore expected to bemesh size dependent. Different techniques are available to address this issue from a theoretical and computational point ofview (e.g. see review by Bazant and Jirásek (2002)), but further research is needed in experimental mechanics to measure thecorresponding fields (temperature, strain and strain rate) at the location of onset of fracture.
7. Conclusions
Static and dynamic experiments are performed on specimens extracted from advanced high strength steel sheets toinvestigate the effect of loading speed on fracture initiation. The experimental results for DP590 and TRIP780 steel fornotched tension and tension with a central hole indicate that the ductility increases by as much as 60% when increasingthe loading speed from 7.6 � 10�6 m/s to 4.2 m/s.
A plasticity model is proposed which couples a Johnson–Cook type of rate- and temperature dependency with a combinedSwift–Voce strain hardening law. The model treats the temperature as an internal variable and can therefore account for the
C.C. Roth, D. Mohr / International Journal of Plasticity 56 (2014) 19–44 43
effect of thermal softening in an approximate manner without solving the thermal field equations. Reasonable agreement ofthe simulation and experimental results is observed for different specimen geometries, different loading velocities and dif-ferent materials. In particular, the model is able to provide an accurate description of the post-necking phase, where most ofthe deformation accumulates. The results from the numerical simulations are subsequently used to extract the histories ofstress triaxiality, Lode angle, equivalent plastic strain, strain rate and temperature at the location of fracture initiation.
Mohr and Marcadet (submitted for publication) had proposed a Hosford–Coulomb model to describe the stress state sen-sitivity of fracture initiation of the present materials at low strain rates. Here, an empirical extension of the Hosford–Cou-lomb model is proposed to account for the effect of strain rate on fracture initiation. The two model parameters arecalibrated for notched tension (NT20), before validating the model’s predictive capabilities for all remaining static and dy-namic experiments.
Conflict of interest
No conflict of interest.
Acknowledgements
The support through the French National Research Agency (Grant ANR-11-BS09-0008, LOTERIE) and the Industrial Frac-ture Consortium is gratefully acknowledged. Special thanks are due to Dr. Matthieu Dunand (MIT/Ecole Polytechnique) fornumerous fruitful discussions and providing the experimental data for the TRIP780 steel. Stephane Marcadet (MIT) and Phi-lippe Chevalier (Ecole Polytechnique) are thanked for their help with the experimental work on the DP590 steel. Thanks arealso due to Professors Tomasz Wierzbicki (MIT) and Gérard Gary (Ecole Polytechnique) for valuable discussions.
References
Abaqus, 2011. Reference Manuals v6.11-1. Abaqus Inc.Balasubramanian, S., Anand, L., 2002. Elasto-viscoplastic constitutive equations for polycrystalline fcc materials at low homologous temperatures. J. Mech.
Phys. Solids 50 (1), 101–126.Barsoum, I., Faleskog, J., 2007. Rupture mechanisms in combined tension and shear—micromechanics. Int. J. Solids Struct. 44 (17), 5481–5498.Bazant, Z.P., Jirásek, M., 2002. Nonlocal integral formulations of plasticity and damage: survey of progress. J. Eng. Mech. 128 (11), 1119–1149.Bodner, S.R., Partom, Y., 1975. Constitutive equations for elastic–viscoplastic strain-hardening materials. Trans. ASME J. Appl. Mech. 42, 385–389.Bridgman, P.W., 1952. Studies in Large Plastic Flow and Fracture. McGraw-Hill, London.Brünig, M., 2006. Continuum framework for rate-dependent behavior of anisotropic damaged ductile metals. Acta Mech. 186, 37–53.Brünig, M., Gerke, S., 2011. Simulation of damage evolution in ductile metals undergoing dynamic loading conditions. Int. J. Plast. 27 (10), 1598–1617.Chaboche, J.L., Gaubert, A., Kanouté, P., Longuet, A., Azzouz, F., Mazière, M., 2013. Viscoplastic constitutive equations of combustion chamber materials
including cyclic hardening and dynamic strain aging. Int. J. Plast. 46, 1–22.Chung, K., Ma, N., Park, T., Kim, D., Yoo, D., Kim, C., 2011. A modified damage model for advanced high strength steel sheets. Int. J. Plast. 27, 1485–1511.Clausen, A.H., Børvik, T., Hopperstad, O.S., Benallal, A., 2004. Flow and fracture characteristics of aluminium alloy AA5083–H116 as function of strain rate,
temperature and triaxiality. Mater. Sci. Eng. A 364 (1–2), 260–272.Curtze, S., Kuokkala, V.T., Hokka, M., Peura, P., 2009. Deformation behavior of TRIP and DP steels in tension at different temperatures over a wide range of
strain rates. Mater. Sci. Eng. A 507 (1–2), 124–131.Dunand, M., 2013. Effect of Strain Rate on the Ductile Fracture of Advanced High Strength Steel Sheets: Experiments and Modeling (Ph.D. thesis). Ecole
Polytechnique, Palaiseau, France.Dunand, M., Mohr, D., 2010. Hybrid experimental–numerical analysis of basic ductile fracture experiments for sheet metals. Int. J. Solids Struct. 47 (9),
1130–1143.Dunand, M., Mohr D., 2014, Effect of Lode parameter on plastic flow localization at low stress triaxialities under radial loading. J. Mech. Phys. Solids, in press.Dunand, M., Gary, G., Mohr, D., 2013. Load-inversion device for the high strain rate tensile testing of sheet materials with Hopkinson pressure bars. Exp.
Mech. 53, 1177–1188.Erice, B., Gálvez, F., Cendón, D.A., Sánchez-Gálvez, V., 2012. Flow and fracture behaviour of FV535 steel at different triaxialities, strain rates and
temperatures. Eng. Fract. Mech. 79, 1–17.Gruben, G., Fagerholt, E., Hopperstad, O.S., Børvik, T., 2011. Fracture characteristics of a cold-rolled dual-phase steel. Eur. J. Mech. A Solids 30 (3), 204–218.Hill, R., 1948. A theory of the yielding and plastic flow of anisotropic metals. Proc. R. Soc. London Ser. A 193, 281–297.Huh, H., Kim, S.B., Song, J.H., Lim, J.H., 2008. Dynamic tensile characteristics of TRIP-type and DP-type steel sheets for an auto-body. Int. J. Mech. Sci. 50 (5),
918–931.Huh, J., Huh, H., Lee, C.S., 2011. Effect of strain rate on plastic anisotropy of advanced high strength steel sheets. Int. J. Plast. 44, 23–46.Johnson, G.R., Cook, W.H., 1983. A constitutive model and data for metals subjected to large strains, high strain rates and high temperatures. In: 7th
International Symposium on Ballistics, The Hague, pp. 541–547.Johnson, G.R., Cook, W.H., 1985. Fracture characteristics of three metals subjected to various strains, strain rate, temperatures and pressures. Eng. Fract.
Mech. 21, 31–48.Johnson, G.R., Holmquist, T.J., 1988. Evaluation of cylinder-impact test data for constitutive models. J. Appl. Phys. 64 (8), 3901–3910.Kajberg, J., Sundin, K.G., 2013. Material characterization using high-temperature split Hopkinson pressure bar. J. Mater. Process. Technol. 213 (4), 522–531.Khan, A.S., Huang, S., 1992. Experimental and theoretical study of mechanical behavior of 1100 aluminum in the strain rate range 10�5 to 104s�1. Int. J. Plast.
8, 397–424.Khan, A.S., Liu, H., 2012a. A new approach for ductile fracture prediction on Al 2024–T351 alloy. Int. J. Plast. 35, 1–12.Khan, A.S., Liu, H., 2012b. Strain rate and temperature dependent fracture criteria for isotropic and anisotropic metals. Int. J. Plast. 37, 1–15.Khan, A.S., Baig, M., Choi, S.H., Yang, H.S., Sun, X., 2012a. Quasi-static and dynamic responses of advanced high strength steels: experiments and modeling.
Int. J. Plast. 30–31, 1–17.Khan, A.S., Yu, S., Liu, H., 2012b. Deformation induced anisotropic responses of Ti–6Al–4V alloy part II: a strain rate and temperature dependent anisotropic
yield criterion. Int. J. Plast. 38, 14–26.Kim, J.H., Sung, J.H., Piao, K., Wagoner, R.H., 2011. The shear fracture of dual-phase steel. Int. J. Plast. 27, 1658–1676.Kocks, U.F., Argon, A.S., Ashby, M.F., 1975. Thermodynamics and Kinetics of Slip. Pergamon Press, Oxford, New York.

44 C.C. Roth, D. Mohr / International Journal of Plasticity 56 (2014) 19–44
Lecarme, L., Tekoglu, C., Pardoen, T., 2011. Void growth and coalescence in ductile solids with stage III and stage IV strain hardening. Int. J. Plast. 27, 1203–1223.
Lian, J., Sharaf, M., Archie, F., Münstermann, S., 2013. A hybrid approach for modeling of plasticity and failure behaviour of advanced high-strength steelsheets. Int. J. Damage Mech. 22 (2), 188–218.
Liang, R.Q., Khan, A.S., 1999. A critical review of experimental results and constitutive models for BCC and FCC metals over a wide range of strain rates andtemperatures. Int. J. Plast. 15 (9), 963–980.
Lou, Y., Yoon, J.W., Huh, H., 2014. Modeling of shear ductile fracture considering a changeable cut-off value for stress triaxiality. Int. J. Plast. 54, 56–80.Luo, M., Wierzbicki, T., 2010. Numerical failure analysis of a stretch-bending test on dual-phase steel sheets using a phenomenological fracture model. Int. J.
Solids Struct. 47 (22–23), 3084–3102.Malcher, L., Andrade Pires, F.M., César de Sá, J.M.A., 2012. An assessment of isotropic constitutive models for ductile fracture under high and low stress
triaxiality. Int. J. Plast. 30–31, 81–115.Mohr, D., Marcadet, S.J., submitted for publication. Hosford–Coulomb model for predicting the onset of ductile fracture at low stress triaxialities.Mohr, D., Dunand, M., Kim, K.H., 2010. Evaluation of associated and non-associated quadratic plasticity models for advanced high strength steel sheets
under multi-axial loading. Int. J. Plast. 26 (7), 939–956.Nelder, A., Mead, R., 1965. A simplex method for function minimization. Comput. J. 7, 308–313.Nemat-Nasser, S., Isaacs, J., 1997. Direct measurement of isothermal flow stress of metals at elevated temperatures and high strain rates with application to
Ta and Ta-W alloys. Acta Mater. 45 (3), 907–919.Queiroz, R., Cunha, F., Gonzalez, B., 2012. Study of dynamic strain aging in dual phase steel. Mater. Sci. Eng. A 543, 84–87.Rusinek, A., Klepaczko, J.R., 2001. Shear testing of a sheet steel at wide range of strain rates and a constitutive relation with strain-rate and temperature
dependence of the flow stress original research article. Int. J. Plast. 17 (1), 87–115.Shojaei, A., Voyiadjis, G.Z., Tan, P.J., 2013. Viscoplastic constitutive theory for brittle to ductile damage in polycrystalline materials under dynamic loading.
Int. J. Plast. 48, 125–151.Smerd, R., Winkler, S., Salisbury, C., Worswick, M., Lloyd, D., Finn, M., 2005. High strain rate tensile testing of automotive aluminum alloy sheet. Int. J. Impact
Eng. 32, 541–560.Stoughton, T.B., 2002. A non-associated flow rule for sheet metal forming. Int. J. Plast. 18, 687–714.Sun, X., Choi, K.S., Liu, W.N., Khaleel, M.A., 2009. Predicting failure modes and ductility of dual phase steels using plastic strain localization. Int. J. Plast. 25,
1888–1909.Sung, J.H., Kim, J.N., Wagoner, R.H., 2010. A plastic constitutive equation incorporating strain, strain-rate, and temperature. Int. J. Plast. 26 (12), 1746–1771.Swift, H.W., 1952. Plastic instability under plane stress. J. Mech. Phys. Solids 1, 1–18.Verleysen, P., Peirs, J., van Slycken, J., Faes, K., Duchene, L., 2011. Effect of strain rate on the forming behaviour of sheet metals. J. Mater. Process. Technol. 211
(8), 1457–1464.Voce, E., 1948. The relationship between stress and strain for homogeneous deformation. J. Inst. Metals 74, 537–562.Voyiadjis, G.Z., Abed, F.H., 2005. Microstructural based models for bcc and fcc metals with temperature and strain rate dependency. Mech. Mater. 37, 355–
378.Zaera, R., Rodriguez-Martinez, J.A., Rittel, D., 2013. On the Taylor–Quinney coefficient in dynamically phase transforming materials. Application to 304
stainless steel. Int. J. Plast. 40, 185–201.Zerilli, F.J., Armstrong, R.W., 1987. Dislocation-mechanics-based constitutive relations for material dynamics calculations. J. Appl. Phys. 61, 1816–1825.