Embed Size (px)
Citation preview

�������� ����� ��
Effect of steelmaking dust characteristics on suitable recycling processdetermining: Ferrochrome converter (CRC) and electric arc furnace (EAF)dusts
Mamdouh Omran, Timo Fabritius
PII: S0032-5910(16)30841-5DOI: doi: 10.1016/j.powtec.2016.11.049Reference: PTEC 12125
To appear in: Powder Technology
Received date: 12 October 2016Revised date: 7 November 2016Accepted date: 26 November 2016
Please cite this article as: Mamdouh Omran, Timo Fabritius, Effect of steelmak-ing dust characteristics on suitable recycling process determining: Ferrochrome con-verter (CRC) and electric arc furnace (EAF) dusts, Powder Technology (2016), doi:10.1016/j.powtec.2016.11.049
This is a PDF file of an unedited manuscript that has been accepted for publication.As a service to our customers we are providing this early version of the manuscript.The manuscript will undergo copyediting, typesetting, and review of the resulting proofbefore it is published in its final form. Please note that during the production processerrors may be discovered which could affect the content, and all legal disclaimers thatapply to the journal pertain.

ACC
EPTE
D M
ANU
SCR
IPT
ACCEPTED MANUSCRIPT
Effect of steelmaking dust characteristics on suitable recycling process determining:
Ferrochrome converter (CRC) and electric arc furnace (EAF) dusts
Mamdouh Omrana,b*
, Timo Fabritiusa
a Process Metallurgy Research Group, Faculty of Technology, University of Oulu, Finland.
b Mineral Processing and Agglomeration Lab, Central Metallurgical Research and
Development Institute, Cairo, Egypt.
Abstract
Utilization of dusts generated from steelmaking industries will avoid disposal of wastes, enhance
the use of secondary raw material fines and save costs. Understanding the properties of dust is
necessary before determining the suitable recycling method. The present paper describes the
chemical, morphological and mineralogical characterization of steelmaking dusts produced in steel
plants in Finland. In this paper three different steelmaking dusts: ferrochrome converter (CRC) and
electric arc furnace stainless steel (EAFSS) dusts from Outokumpu (Tornio, Finland), and electric
arc furnace carbon steel (EAFCS) dust from Ovako (Imatra, Finland) were characterized.
The characterization study showed that, the dusts from carbon steelmaking (EAFCS) are rich in
zinc, while the dusts from stainless steelmaking (CRC) and (EAFSS) are relatively low in zinc, but
richer in chromium. The zinc contents in CRC, EAFSS and EAFCS dusts are 10.83, 19.84 and
35.76 wt.%, respectively, while the chromium contents are 20.88, 3.19 and 0.47 wt.%, respectively.
In the dust from CRC, zinc is found as zinc oxide (zincite, ZnO), while in the dusts from EAFSS &
EAFCS zinc is found mostly as zinc ferrite (franklinite, ZnFe2O4). Scanning electron microscopy
(SEM) investigations indicated that CRC dust is dominated by non-spherical form and composed
mainly of aggregates of irregular particles of chromite, in addition to zincite sphere. EAFSS dust
particles are characterized by encapsulation phenomenon, franklinite particles enclosed inside
calcium-iron-silicate glass sphere. Manganese (Mn) concentrations shows positive correlation with

ACC
EPTE
D M
ANU
SCR
IPT
ACCEPTED MANUSCRIPT
Zn, which suggests the occurrence of Mn mainly with franklinite phase. EAFCS dust is dominated
by spherical form, and zinc found as franklinite and zincite. In the large particles > 3 µm of EAFCS
dust, franklinite enclosed inside glass sphere, while in finer particles < 1 µm, both zincite and
franklinite are existed as spheres.
The investigations indicate that steelmaking dusts from CRC, EAFSS, and EAFCS show significant
difference in concentration and mode of occurrence of zinc in the dusts, which will influence on
determine the suitable processing methods.
Keywords: Characterization; recycling; CRC; EAF; steelmaking dust.
Corresponding author:
Mamdouh Omran
Address: Process Metallurgy Research Group, Faculty of Technology, University of Oulu,
Finland.
P.O. Box: 4300.
E-mail: [email protected]; [email protected]
1. Introduction
There are different types of steelmaking dusts generated from steel industries [1, 2], depending on
process unit: stainless steel dust, carbon steel dust and ferrochrome dust. These dusts are by-product
waste generated by the secondary steelmaking process in an electric arc furnace and considered as a
hazardous waste in most industrialized countries [3, 4]. During the melting of scraps in the electric
arc furnace (EAF), many components of the charge including iron, zinc, and lead, are volatilized
and entered the vapour phase. The dust is formed through the conversion of vapour phases into dust
by agglomeration and physico-chemical transformations, then the dust is collected in the off-gas
cleaning system [5, 6]. Dust is fine-grained material, containing significant amounts of zinc and
iron together with variable amounts of calcium, manganese, magnesium, silicon and chromium [7].
The composition of steelmaking dust depends on the type of the steel produce, scrap used and

ACC
EPTE
D M
ANU
SCR
IPT
ACCEPTED MANUSCRIPT
operating conditions [7]. Zinc represents the major compound of the steelmaking dust, and its
content varies between 7 and 40%, depending on scrap used, and the ratio of galvanized scrap
utilized [8–10]. Compounds like zinc oxide (ZnO) and zinc ferrite (ZnFe2O4) are formed through
interaction between vapour zinc and other gaseous compounds generated during the steelmaking
process [5]. The direct recycling of dust back to steel production is hindered due to the presence of
zinc, which cause operational difficulties in the steel making processes.
The present paper describes the chemical, physical, morphological and mineralogical
characterization of steelmaking dusts produced in Finland steel plants and its implication on
determine recycling methods. Characterization will include chemical analysis (composition and
species), grain size distribution, microscopic observation, and definition of present mineral phases.
Beside the chemical analysis, further methods are used to characterize the dust in detail; these are:
Scanning electron microscopy (SEM) coupled with Energy-dispersive X-ray spectroscopy (EDS),
Thermogravimetric - Differential scanning calorimetry (TG–DSC), Mass spectroscopy (MS), and
Fourier transform infrared (FTIR) spectroscopy. Based on detailed characterization of dusts, a
possible and most suitable method for recycling each kind of dust was proposed.
2. Materials and production process
Three representative steelmaking dust samples were used in this study. Ferrochrome converter
(CRC) and electric arc furnace stainless steel (EAFSS) dusts were obtained from Outokumpu
Tornio stainless steel plant, Finland. One dust sample came from electric arc furnace carbon steel
(EAFCS) production from Ovako Imatra, Finland. The dusts were collected from bag house filter
containers behind each furnace or converter. These dusts are a mixture of different production
batches, so each dust is a representative sample of an average dust composition.
The flow sheet for the production processes in Outokumpu Stainless and Outokumpu Chrome
Tornio is presented in Fig. (1). In Tornio plant, ferrochrome is produce in the same location from

ACC
EPTE
D M
ANU
SCR
IPT
ACCEPTED MANUSCRIPT
chromite ore and concentrates as raw materials by using submerged arc furnaces (SAF). The molten
ferrochrome can be transfer directly to the stainless steel plant [11, 12]. There are two production
routes in Torino steel plant. In the Line 1 molten ferrochrome is fed as melt into ferrochrome
converter (CRC), whereas in line 2 solid ferrochrome is melted with scrap in electric arc furnace
(EAF) [11]. The charge weight of line 1 is 95 tonnes and line 2 is 150 tonnes. The Line 1 is using a
chromium converter to treating liquid ferrochrome from ferrochrome melting shop. Whereas in line
2 electric arc furnace (EAF) is used to melt the scrap, this line is scrap-based stainless steelmaking.
The ferrochrome converter (CRC) used as intermediate process between SAF and Argon oxygen
decarburization (AOD) converter, because its product is a raw material for AOD [11, 13]. The raw
materials for the CRC process are stainless steel scrap, and molten ferrochrome with high silicon
and carbon content from the submerged arc furnace (SAF) of the ferrochrome plant [12].The
purpose of a ferrochrome converter (CRC) is to remove silicon and some carbon from molten
ferrochrome by blowing oxygen into the melt before the production of stainless steel [11, 12]. The
CRC process in Tornio generates about 4000 t a-1
of CRC dust. The liquid steel is charged into
AOD converter to reach to the final quality of steel. The AOD is charged with molten ferrochrome
from chromium converter (CRC) and molten steel from EAF. During the AOD process the oxygen
and mixture of oxygen and nitrogen are injected to the melt to reduce the carbon, nitrogen and
sulphur to specified limits. The AOD is followed by ladle treatments, continuous casting, slab
grinding, hot and cold rolling as well as pickling and annealing [11].
The production processes in Ovako Imatra is shown in Fig. (2). Ovako Imatra is producing specials
steel using steel scrap as raw material in electric arc furnace (EAF) with 75 tonnes capacity. Steel
scrap is preheated and charged to EAF by two loaded buckets having typically 50 tonnes and 30
tonnes weights. Lime and crashed refractory bricks are used as slag formers and coke fines as
reductant agent. EAF is equipped with lime and carbon injectors as well as oxygen- fuel burners.
Typical tap-to-tap time is 65 minutes and total energy consumption about 38 MWh (32 MWh
ACC
EPTE
D M
ANU
SCR
IPT
ACCEPTED MANUSCRIPT
electricity and 6 MWh chemical energy). Flue gas is cleaned during scrap melting process in two
stages: large particle removed from dry flue gas and recycled back to process. Finer fractions are
separated with bag filters. Typical generated dust volume is between 15 to 25 kg per ton of liquid
steel [14]. The total amount of dust formation in Ovako Imatra about 2400 t a-1
and with higher
production rate it could exceed 3000 t a-1
. The molten steel is going into secondary metallurgical
process to remove sulphur and other impurities from the steel. The refined liquid steel goes to
continuous bloom casting.
3. Characterization methods
The mineralogical composition of the samples were measured using Rigaku SmartLab 9kW at the
centre of microscopy and nanotechnology of the University of Oulu. Before the X-ray
diffractometer (XRD) analysis, the dust was pulverized in an agate grinding mortar. The XRD
analyses were done using operating conditions of 40 kV accelerating voltage and a current of 40
mA with cobalt tube and a graphite monochromator. The measuring range from 4 to 90° 2θ using a
step size of 0.02° 2θ and a step time of 1 s per step.
Bruker AXS S4 Pioneer X-ray fluorescence (XRF) spectrometer was used to determine the
chemical composition of dust samples. The X-ray spectrometer equipped with Rh-tube with max
power of 4kW. A selection of analyser crystals, detectors (flow counter and scintillation counter)
and 66 geostandards were used for calibration of elements. About 13.16 g of ground sample was
taken and mixed with 0.84 g of C-wax. WC/Co mortar HERZOG pulverizing mill was utilized to
obtain homogeneous dispersion and uniform particle size of the resultant mixture (sorbent and C-
wax). Pressed pellets for XRF analysis were prepared from the mixture (7‒8 g) using boric acid as
binder and applying a hydraulic pressure of 10 ton to compress the sample. The total carbon content
of the dust is determined using a LECO Carbon Analyzer. The pH values of the dusts were
measured after leaching 10 g of dusts with 25 mL of doubly deionized (DDI) water. The moisture

ACC
EPTE
D M
ANU
SCR
IPT
ACCEPTED MANUSCRIPT
content of dust was calculated after drying a constant weight of dusts overnight at a temperature of
115 °C using stainless steel oven.
The morphological characteristic and microanalyses of the different zinc, iron, and chromium
phases in the steel dust samples were investigated by a combined SEM-EDS using a Zeiss ULTRA
plus field emission scanning electron microscope (FESEM), which was attached to an Energy-
dispersive X-ray spectroscopy (EDS) unit for chemical analysis. Small amounts of the dust and
liquid epoxy were placed into containers and the mixtures were dried until the material was solid.
Then polished sections with a diameter of 25mm were prepared by cutting the samples vertically
and polishing their surfaces. The granulometric analysis of the dust samples was determined using
Beckman Coulter LS 13 320.
Infrared (FT-IR) Spectroscopy provides information about the structure and the nature of the
functional groups present in the crystal lattice. FTIR was examined via Bruker Vertex V80 vacuum
FT-IR spectrometer with Harrick Praying Mantis TM DRIFT equipment. The angle of incidence of
the IR beam was 45◦and 100 scans were collected at a resolution of 4 cm
−1. The spectral were
collected within the range of 400–4000 cm−1
wave number. Differential scanning calomeritry
(DSC), Thermogravimetry (TG), and Mass spectra (MS) spectroscopy were used to determine the
thermal behavior of steel dust samples. Thermogravimetry give information about the temperature-
dependent mass loss of the sample, while mass spectroscopy detected the gases evolved during
thermal reactions. The thermoanalyses was performed using a Netzsch STA409 PC Luxx under air
atmosphere. Approximately 30.84 mg of sample was placed in a platinum crucible on a pan of the
microbalance at a heating rate of 20 °C/min. The temperature range was 20–1400 °C.
4. Results and Discussion
4.1. Granulometric analysis
The granulometric distribution analyses and the median particle size for CRC, EAFSS and EAFCS
dusts are shown in Figs. (3 – 5) and Table (1). The particles size analyses showed that the dust

ACC
EPTE
D M
ANU
SCR
IPT
ACCEPTED MANUSCRIPT
consist of very fine aggregates of particles (Table 1). It was found that, 50 % of dust particles below
(1.63 - 3.15 μm), while the majority of particles (> 90 %) below (5.42 - 7.07 μm). The results
indicated that, ferrochrome converter (CRC) dust has particles coarser than the dusts generated from
electric arc furnace (EAFSS & EAFCS). The median particle size for CRC is 3.15 μm, while the
median particle size for EAFSS and EAFCS are 2.37 and 1.63 μm, respectively (Table1).
From the granulometric analyses results, the physical separation techniques such as magnetic,
gravity and flotation, are not suitable to treat these materials. Most dust particles fall below 5 μm,
such fine particles are very difficult to beneficiate via conventional mineral processing processes
[15]. In addition to, the very fine grained distribution of steel dusts makes these materials difficult
to handle dry, and can be easily be airborne if no previous agglomeration is used [16]. The results of
particle size distribution are in agreement with the results obtained by other researchers [16-17].
They concluded that EAF dusts consist of very fine particles with almost 90% of the particles are
lower than 10 μm and the metals are more concentrated in the fine fraction of the waste [16 - 17].
4.2. Mineralogical composition
The identified phases in the CRC, EAFSS and EAFCS dusts, according to qualitative phase analysis,
are shown in Fig. (6).
The main elements in the dusts are iron, zinc and chromium mostly presented as complex oxides
with spinel structure. From the XRD pattern, peaks like the peaks of chromite (FeCr2O4), magnetite
(Fe3O4) and franklinite (ZnFe2O4) have been identified in the XRD pattern. The peaks from these
phases exhibit overlapping in some extent, as shown in Fig. 6. Because of such overlapping, the
presence of these phases cannot be unequivocally assured. Consequently, it was impossible to
identify these phases by XRD, SEM coupled with EDS used for identification of these phases. In
addition to spinel group phases, zincite (ZnO), portlandite Ca(OH)2, lime (CaO) and periclase
(MgO) have been identified. Lime and MgO particles have been caught by the gas flow when lime
ACC
EPTE
D M
ANU
SCR
IPT
ACCEPTED MANUSCRIPT
has been charged into the CRC and EAF. The main phases identified in the dusts are consistent with
the results obtained by previous study [3, 6].
4.3. Chemical composition
The chemical composition of the three representative dust samples used in this study are shown in
Table (2). The moisture contents of all dust samples are low (<1 wt.%). The pH values in the range
from 10 to 11 which indicated that the dusts are basic.
A comparison between the chemical analyses of steelmaking dusts from different origins reveals a
significant variation in the elemental composition. The chemical composition of the dust depends
on the batch feed material and the operating parameters of furnace or converter during production
[18, 4]. The results showed that, the dusts from carbon steelmaking (EAFCS) are rich in zinc, while
the dusts from stainless steelmaking (CRC & EAFSS) are relatively low in zinc, but richer in
chromium. Previous investigation stated that, the zinc content in carbon steel dust is typically from
15 to 35 wt.%, which is generally much higher than in dusts generated in stainless steel production
[18, 4]. The contents of zinc (Zn) in CRC, EAFSS and EAFCS dusts are 10.83, 19.84, and 35.76
wt.%, respectively, while the contents of chromium (Cr) are 20.88, 3.19 and 0.47 wt.%, respectively
(Table 2). It’s obvious that CRC dust contains high amount of chromium compared to the electric
arc furnace dust. This due to that, the feed material to the chromium converter is liquid ferrochrome,
which produce in the same location from chromite ore by using submerged arc furnaces (SAF). In
addition to iron, zinc and chromium the dusts are characterized by relatively high contents of
calcium oxide and magnesium oxide, due to the dolomitic lime added to the steelmaking furnace [6].
The CaO contents in CRC, EAFSS and EAFCS dusts are 14.27, 11.91 and 5.93 wt.%, respectively
(Table 2).
The concentration of Pb, Cl, S and alkaline elements (such as K) in carbon steel dust is higher than
in the dust from stainless steel. It was reported that carbon steel dust is rich in lead than the dusts

ACC
EPTE
D M
ANU
SCR
IPT
ACCEPTED MANUSCRIPT
generated from stainless steel production [18, 4]. The lead comes from the paint present in the scrap
pieces [6]. The Pb contents in CRC, EAFSS and EAFCS dusts are 0.11, 0.62 and 2.15 wt. %,
respectively (Table 2).
Distributions of trace elements in the dusts are listed in Table 2. V, Ba, Ga, Ta, Sr, Sn, Sb, Rb, Zr
and Cs records the highest concentrations in the dusts. Other elements exhibit relatively low
concentrations (below 38 ppm). Ferrochrome converter (CRC) dust has higher V, Ga and Ta
contents in the range of 426, 375 and 191 ppm, respectively. EAFSS dust contains high amount of
Ba and Mo in the range of 745 and 586 ppm, respectively. EAFCS dust has high contents of Ta, Ba
and Sn in the range of 434, 433 and 234 ppm, respectively (Table 2).
4.4. Microstructure of steelmaking dusts
The microstructure and microanalyses of the particles of the dusts were obtained by means of SEM-
EDS.
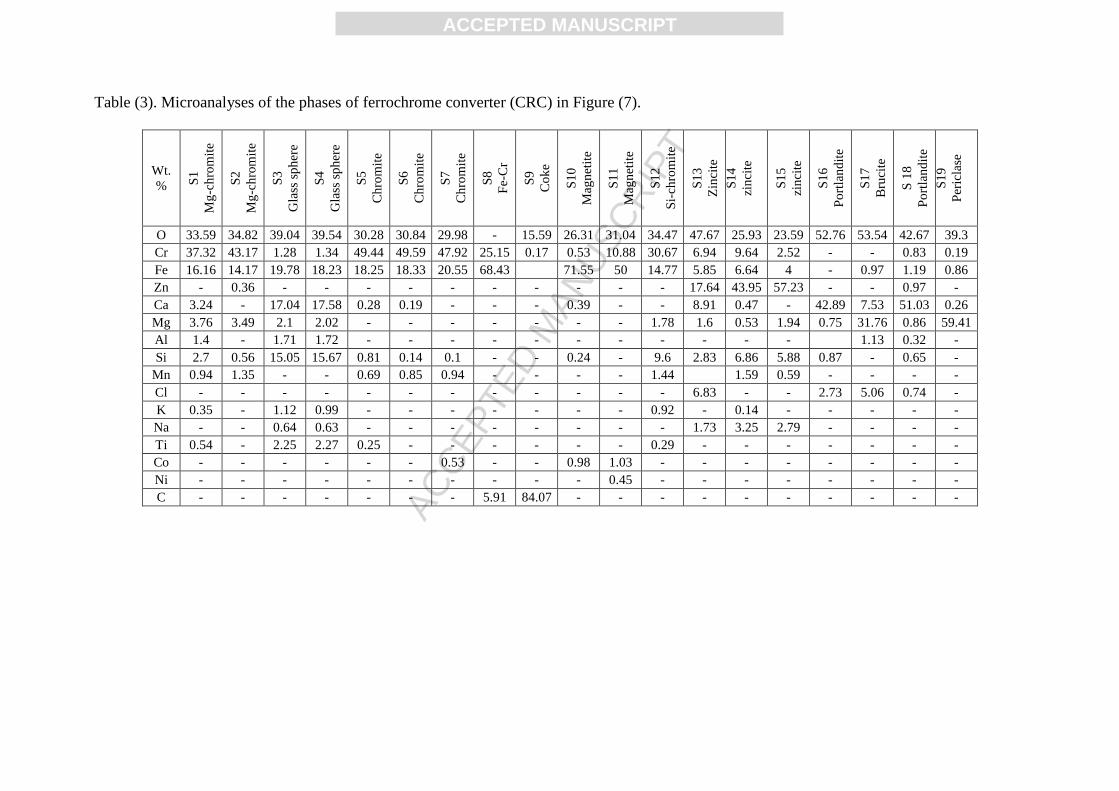
Fig. (7) shows SEM images of ferrochrome converter (CRC) dust, and Table (3) gives the
microanalyses of the phases of CRC dust in Fig. (7). The general distribution of CRC dust particles
is shown in Fig. (7A), particles are occurring as irregular particles of chromite. In addition to fine
grained of periclase (MgO), portlandite Ca(OH)2 and zincite spheres. Fig. (7B) shows that there are
angular phases enclosed in calcium-iron-silicate glass spheres, the angular phases are
magnesiochromite (Fe, Mg) Cr2O4. EDS analyses (Table 3, S1-4) demonstrate that there are
magnesiochromite crystals enclosed in calcium silicate glass sphere. Chromite particles of irregular
shape were detected (Fig.7 C&D – S5-7), these particles are probably originate from chromite raw
material which used in SAF. Fig. 7C shows large chromite fragment covered with fine grained
material of different composition with spinel structure of Ca-Si-Cr-Fe-O (Fig. 7D). Small particles
of different shape were observed in the dusts (Fig. 7E&F – S8-12). These grains are composed of
Fe-Cr, C-O, Fe-O and Si-Cr-Fe-O, probably a variation of ferrochrome, coke, magnetite and Si rich
chromite, respectively (Table 3 – S8-12). Zincite sphere of monocrystal with size lower than 2 μm

ACC
EPTE
D M
ANU
SCR
IPT
ACCEPTED MANUSCRIPT
was detected in the dust (Fig. 7F – Table 3 S14-15). These zincite sphere forms during the
condensation of the vapors of zinc contained in the fumes [14]. Figs. (7G&H) show there are
agglomeration of fine grained of MgO and CaO oxide, which related to periclase, lime and
portlandite as indicated with XRD. Close up figure (Fig. 7H) showed that, there are white spheres
of CaO particles are dispersed in MgO fine grained materials, as indicated with EDS (Table 3 –
S16-19). These particles are originated from fluxes added in the steelmaking process [6]. Makkonen
et.al. [12] indicated that the non-spherical form and different phase composition of CRC dust is
similar to FeCr slag from the submerged arc furnace (SAF) in the ferrochrome plant. Because with
molten ferrochrome from the ferrochrome plant, some FeCr slag from the SAF has been introduced
into the CRC and a particle of the slag has ended up in the CRC dust.
Electric arc furnace stainless steel (EAFSS) dust is characterized by encapsulation phenomenon
(Figs. 8A-D). The microanalyses of the phases of EAFSS dust are presented in Table (4). Figs.
(8A-C) show that the encapsulation particles are often surrounded by fine-grained particles and
spheres. From the general distribution of EAFSS dust particles, large particles of dust > 3 μm are
characterized by encapsulation phenomenon. Fig. (8A – 8C) and (Table 4 S1-11) show that
franklinite phases are enclosed in calcium-iron-silicate glass spheres. Fig. (8B – Table 4 S5-6)
shows that aggregates of franklinite enclosed in a glass sphere. Occasionally, small grains have
agglomerated and formed larger particles (Fig. 8B). Fig. (8C) and (Table 4 S10-11) shown that
franklinite particles of different shapes are enclosed in glass spheres. EDS analyses indicated that
franklinite particles are rich in Manganese (Mn) (Table 4). The correlation between Mn and Zn
concentrations in EAFSS dust particles indicated that, Mn show high concentration in franklinite
particles (Table 4). Fig. (9A) show that Mn exhibit positive correlation (r2= 0.72) with Zn,
manifesting that Mn and Zn belong to the same phase, franklinite (Zn,Mn+2
,Fe+2
) (Fe+3
,Mn+3
)2 O4.
Figure (8D) and Table (4 – S12-13) shown that there are angular phases enclosed in calcium-iron-
silicate glass sphere, the angular phases are chromite (FeCr2O4). Chromite particles are rich in
ACC
EPTE
D M
ANU
SCR
IPT
ACCEPTED MANUSCRIPT
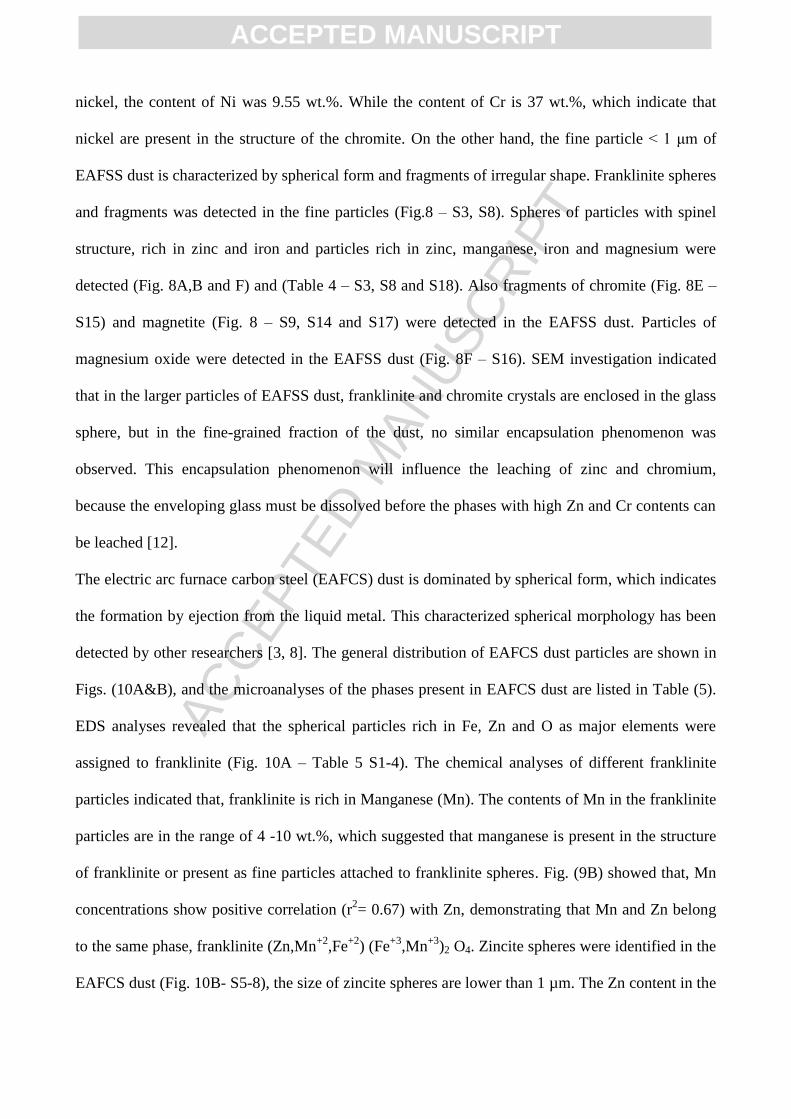
nickel, the content of Ni was 9.55 wt.%. While the content of Cr is 37 wt.%, which indicate that
nickel are present in the structure of the chromite. On the other hand, the fine particle < 1 μm of
EAFSS dust is characterized by spherical form and fragments of irregular shape. Franklinite spheres
and fragments was detected in the fine particles (Fig.8 – S3, S8). Spheres of particles with spinel
structure, rich in zinc and iron and particles rich in zinc, manganese, iron and magnesium were
detected (Fig. 8A,B and F) and (Table 4 – S3, S8 and S18). Also fragments of chromite (Fig. 8E –
S15) and magnetite (Fig. 8 – S9, S14 and S17) were detected in the EAFSS dust. Particles of
magnesium oxide were detected in the EAFSS dust (Fig. 8F – S16). SEM investigation indicated
that in the larger particles of EAFSS dust, franklinite and chromite crystals are enclosed in the glass
sphere, but in the fine-grained fraction of the dust, no similar encapsulation phenomenon was
observed. This encapsulation phenomenon will influence the leaching of zinc and chromium,
because the enveloping glass must be dissolved before the phases with high Zn and Cr contents can
be leached [12].
The electric arc furnace carbon steel (EAFCS) dust is dominated by spherical form, which indicates
the formation by ejection from the liquid metal. This characterized spherical morphology has been
detected by other researchers [3, 8]. The general distribution of EAFCS dust particles are shown in
Figs. (10A&B), and the microanalyses of the phases present in EAFCS dust are listed in Table (5).
EDS analyses revealed that the spherical particles rich in Fe, Zn and O as major elements were
assigned to franklinite (Fig. 10A – Table 5 S1-4). The chemical analyses of different franklinite
particles indicated that, franklinite is rich in Manganese (Mn). The contents of Mn in the franklinite
particles are in the range of 4 -10 wt.%, which suggested that manganese is present in the structure
of franklinite or present as fine particles attached to franklinite spheres. Fig. (9B) showed that, Mn
concentrations show positive correlation (r2= 0.67) with Zn, demonstrating that Mn and Zn belong
to the same phase, franklinite (Zn,Mn+2
,Fe+2
) (Fe+3
,Mn+3
)2 O4. Zincite spheres were identified in the
EAFCS dust (Fig. 10B- S5-8), the size of zincite spheres are lower than 1 µm. The Zn content in the

ACC
EPTE
D M
ANU
SCR
IPT
ACCEPTED MANUSCRIPT
analyses particles was 68.49 wt.% and the content of Fe was 3.45 wt.%, the high Zn content and the
low Fe content indicate that the grain is zincite than zinc ferrite (Table 5). The zincite is also
detected by XRD.
In addition to the main spherical form of the EAFCS particles, there are franklinite particles of
different shape were observed (Fig. 10C and D). Fig. (Fig. 10C) shows that smaller franklinite
particles agglomerated together to form large particle. Fig. (Fig. 10D – S10-11) shows that there
are franklinite phases enclosed in calcium-iron-silicate glass spheres, the Zn content in the
franklinite particles are much higher than in the surrounding glass. Also smaller particles of
irregular shape of franklinite (< 1µm) were detected (Fig. 10D and F – S12, S17). Franklinite with
fibers crystals also detected (Fig. 10F- S18), EDS analysis indicated that these fibers particles
contain 2.36 % Pb. An irregular and porous particles of magnetite (Fe3O4) were detected in EAFCS
dust (Fig.10 E and F – S13-16). Some magnetite particles show signs of melting, and formed from
agglomeration of small particles (Fig.10 G – S19). Large particle of irregular shape of Si-O-Al was
found (Fig.10 H – S20). Probably, it is a phase rich in magnesium, silicon and calcium originated
from fluxes added in the steelmaking process.
4.5. Fourier transform Infrared (FTIR) spectroscopy
The FTIR spectrums of CRC, EAFSS and EAFCS dusts are shown in Fig. (11). In all samples, the
sharp band that appears at 3640 cm-1
can be assigned to hydroxyl stretching modes. This band
confirms the presence of hydroxides in the dusts and corresponds to hydroxyl stretching vibrations
of calcium hydroxide [19]. XRD analyses detected portlandite Ca(OH)2 phase in the samples. In
EAFSS dust a tiny band at 3569 cm-1
has been detected, this band related to hydroxyl stretching
modes of hydrated aluminum compounds [19, 20]. XRF analyses indicated that EAFSS dust
contains about 1 % of Al oxide. In both CRC and EAFSS dusts the band at 1623 cm-1
is due to the
OH bending of water and hydrated phases present in the dusts [19]. The bands located at 626, 582,
592, 541, 440 and 465 cm-1
are a common feature of simple metal oxides (like, ZnO) and complex

ACC
EPTE
D M
ANU
SCR
IPT
ACCEPTED MANUSCRIPT
spinel group (AB2O4) [21]. The spinel phases found in the dusts include franklinite (ZnFe2O4),
magnetite (Fe3O4) and chromite (CrFe2O4). Due to the bands overlap of the different constituents in
this region of the spectrum, it is very difficult to obtain detailed structural information [19]. The
spinel group compounds have been identified by using couple SEM and EDX techniques. In both
EAFSS and EAFCS dusts, the spectra positioned at 2860, 2925 and 2960 cm-1
are assigned to C-H
stretch of aliphatic carbon chain indicating the presence of organic matter [6]. The bands in the
region from 1106 to 1141 cm-1 are assigned to Si-O vibrations [22]. In the spectrum of EAFCS dust
the band located around 1199 cm-1
is due to a sulphate (SO4-2
) vibration, the band at 626 cm-1
also
assigned to sulphate vibration [6]. The band at 626 cm-1
is overlap with the vibration band of spinel
group. In all samples the bands that appear at 1797 and 1417 cm-1
correspond to C-O stretching
modes of the carbonate CO3 2-
ion, the bands at 715 and 707 cm-1
can be assigned to deformation
modes of the C-O vibrations [23].
4.6. Thermoanalyses
Differential scanning calomeritry (DSC) and Thermogravimetry (TG) combined with Mass spectra
(MS) spectroscopy were used to study the thermal behaviour of CRC, EAFSS and EAFCS dusts.
The results of thermoanalyses are shown in Figs. (12-14).
The DSC-TG curves indicated that, CRC, EAFSS and EAFCS dusts have a similar thermal
behavior in the temperature range below 800 °C, but above this range there are apparent differences
in their thermal behavior. In the temperature range below 800 °C, the first peak occurred in the
range of 190 °C, with less weight loss (about 0.5% of the total weight), this reaction corresponding
to the evaporation of physically adsorbed water (Figs. 12-14). There are two distinct stages of
reactions at 400-450 and 560-650, associated with weight lose TG curve (Figs. 12-14). These
reactions are related to the dehydroxylation of calcium hydroxide and the decomposition of calcium
carbonate, respectively, according to the following reactions.

ACC
EPTE
D M
ANU
SCR
IPT
ACCEPTED MANUSCRIPT
Ca(OH)2 →CaO + H2O (1)
CaCO3 → CaO + CO2 (2)
Mass spectra curves indicated that the evolution of H2O and CO2 from the sample at these
temperature ranges (Figs.12-14). The result is consistent with the results obtained by other
researchers [5, 19, 24, 25]. The weight loss in the two reactions in the CRC, EAFSS and EAFCS
dusts are (0.92 – 0.82 %), (0.37 -0.70 %) and (0.17 – 1.42 %), respectively. The weight loss in CRC
dust is higher than EAFSS and EAFCS dusts, which indicated that CRC dust contains higher
Ca(OH)2 and CaCO3 than EAFSS and EAFCS dusts. Both Ca(OH)2 and CaCO3 are existing
originally in the dusts as free lime which, in turn, may have hydrated and carbonated on exposure to
ambient moisture and CO2 for extended periods of time [19]. There are weak reactions occurring in
the temperature range of 500 °C connected with a slight weight gain < 0.5 % (Figs. 12-14). This
may be due to the oxidation of some free iron oxide to a higher oxidation state [24].
In the temperature above 800 °C, Figs. (12-14) show that there are apparent differences in the mass
loss of the dust samples, although there are no corresponding gases release detected by MS or
thermal reactions observed with DSC. This phenomena was observed by other studies [5, 24], and
related to the volatilization of condensable chlorides of Zn, Pb and K. Mikhail et al. [24] found that
a white precipitate of PbCl, NaCl and KCl has been found deposited on the reaction tube after
heating steel dust sample to 1000 °C. CRC dust shows slight weight loss < 0.5 %, this may be due
to that CRC dust contain less volatile elements (0.11 wt.% Pb, 0.29 wt.% Cl, 0.74 wt.% K2O), in
addition to low carbon content < 0.3 wt.%. The carbon contained in the dust can react with zinc,
which evaporated into zinc vapour. On the other hand, EAFSS and EAFCS dusts show higher
weight loss of 4.8 and 8.3 %, respectively, due to the high contents of Pb, Cl, K and C in these dusts.
EAFSS dust contains (0.62 wt.% Pb, 1.25 wt.% Cl, 1.49 wt.% K2O and 0.5 wt.% C), while EAFCS
dust contains (2.15 wt.% Pb, 1.69 wt.% Cl, 3.21 wt.% K2O and 1.5 wt.% C). There are endothermic
peaks at 1260 °C which related to the decomposition of unfused calcium carbonate [26].

ACC
EPTE
D M
ANU
SCR
IPT
ACCEPTED MANUSCRIPT
5. Implications of present study for utilization of steelmaking dust
The direct recycling of steelmaking dust back to the blast furnace and electric arc furnace through
direct charging of briquettes or micro-pellets, is economically viable [27, 28]. The main obstacle
associated with recycling the dust back to the furnace is the high content of zinc and volatile
components [29]. Volatile components cause problems when charged to a furnace, which affect the
refractory materials, and thus decrease the productivities. Therefore, how to separate zinc from the
steelmaking dusts in an economic way becomes a crucial step for recycling of these wastes in iron
and steelmaking industry [30]. There are two main processes for zinc recovery include
hydrometallurgical [5, 31, 32] and pyrometallurgical methods [33-35]. The choice between the two
methods strongly depends on the properties of materials [16]. The factors which determine the
suitable processing method are: the mineralogical composition of dust, zinc form (zinc oxide or zinc
ferrite), concentration of zinc and alkali elements, and microstructure of particles. Therefore, before
choosing the processing method, a detailed characterization of dust is an essential step in
determining the most appropriate recycling strategy [16].
In the present study, the determination of concentration and mode of zinc occurrence in the
steelmaking dust can help to design the suitable process for utilizing these waste in steel making
industries again. In the dusts from EAFSS and EAFCS, the results indicated that hydrometallurgical
methods are not effective to remove zinc from these dusts, because zinc mostly exists in the zinc
ferrite phase which is quite stable and insoluble in most acidic and alkaline solutions [36]. SEM-
EDX investigation revealed that EAFSS dust are dominated with encapsulation particles, franklinite
crystals are enclosed in a glass sphere. This encapsulation phenomenon will influence the leaching
of zinc, because the enveloping glass must be dissolved before the phases with high Zn contents can
be leached. For these reasons, pyrometallurgical methods are more suitable for processing EAFSS

ACC
EPTE
D M
ANU
SCR
IPT
ACCEPTED MANUSCRIPT
and EAFCS dusts. On the other hand, ferrochrome converter (CRC) dust is characterized by high
chromium content (20.88 wt.%) and low zinc content (10.80 wt.%). In addition, the zinc occurs as
zinc oxide, which does not cause problems in hydrometallurgical treatment. Therefore, the low zinc
content and the existing of zinc in zincite phase leads to greater interest in the hydrometallurgical
methods than pyrometallurgical methods [37]. Makkonen et.al. [12] studied the leaching of
ferrochrome converter (CRC) dust from Outukumpu Tornio Plant, Finland with a sulfuric acid
solution. The authors [12] concluded that the highest Zn dissolution ratio (94 %) is due to the
existence of zinc in the zincite phase.
Recently, many researchers have begun to pay attention to microwave energy as an alternative
recycling method [38 -42]. Instead of conventional heating, microwave heating is exploited, which
gives different heat transfer and mass transfer mechanisms. In the second part of this work,
microwave heating technology will be utilized to handle steelmaking dusts. The main advantages of
microwave treatment of steelmaking dusts are: (1) Microwaves can heat zinc ferrite in the
steelmaking dust quickly and efficiently. (2) Microwaves can reduce zinc ferrite to iron and zinc
metals, instead of zinc oxide in conventional heating processes [38]. (3) Higher reaction rates can
be obtained by microwave [39]. (4) Microwave heating does not require any pretreatment (e.g.
injection of gas), which makes it possible to use fine particles directly [42].

ACC
EPTE
D M
ANU
SCR
IPT
ACCEPTED MANUSCRIPT
Conclusions:
Detailed characterization of steelmaking dusts from Finnish steelmaking plants with several
analytical techniques was carried out in order to get essential information for developing the
recycling methods for these wastes. The results showed that steelmaking dusts from CRC, EAFSS,
and EAFCS show significant difference in concentration and mode of occurrence of zinc in the
dusts, which will influence on determine treatment methods. In the EAFSS and EAFCS dusts, zinc
mainly exists in the zinc ferrite phase and dominated by encapsulation phenomenon, franklinite
crystals are enclosed in a calcium-iron-silicate glass sphere. Based on these observations,
hydrometallurgical methods are not effective to remove zinc from EAFSS and EAFCS dusts. The
encapsulation particles will influence on the leaching of zinc, in addition to zinc ferrite phase which
is refractory against leaching. Therefore, pyrometallurgical methods will be more suitable for
processing EAFSS and EAFCS dusts. On the other hand, CRC dust has low zinc content, and the
zinc occurs as zinc oxide sphere. The low zinc content and the presence of zinc in zincite phase
leads to greater interest in the hydrometallurgical methods than pyrometallurgical methods.
Acknowledgement:
The authors would like to thank Mr. Niko Hyttinen from Outukumpu Tornio plant, and Mrs.
Helena Erkkilä, Mr. Ville Fomkin and Mr. Kari Välimaa from Ovako Imatra, Finland, for the
discussions and for their offers of industrial samples. The authors thank Mr. Riku Mattila and Mr.
Tommi Kokkonen for their technical support throughout this work. The authors are indebted to Mr.
Ari Väliheikki for help in FTIR analyses, Mrs. Leena Palmu for the XRF analyses and Mr. Jarno
Karvonen for granulometric analyses.

ACC
EPTE
D M
ANU
SCR
IPT
ACCEPTED MANUSCRIPT
References
[1] Z. Huaiwei, H. Xin, An overview for the utilization of wastes from stainless steel industries,
Resour. Conserv. Recycl. 55 (2011) 745-754.
[2] B. Das, S. Prakash, P.S.R. Reddy, V.N. Misra, An overview of utilization of slag and sludge
from steel industries, Resour. Conserv. Recycl. 50 (2007) 40-57.
[3] J.G.M.S. Machado, F.A. Brehm, C. A.M. Moraes, C.A. dos Santos, A.C.F. Vilela, J.B.M. da
Cunha, Chemical, physical, structural and morphological characterization of the electric arc furnace
dust, J. Hazard. Mater. B136 (2006) 953-960.
[4] D.K. Xia, C.A. Pickles, Microwave caustic leaching of electric arc furnace dust, Miner. Engin.
13 (2000) 79–94.
[5] P. Oustadakis, P.E. Tsakiridis, A. Katsiapi, S. Agatzini-Leonardou, Hydrometallurgical process
for zinc recovery from electric arc furnace dust (EAFD) Part I: Characterization and leaching by
diluted sulphuric acid, J. Hazard. Mater. 179 (2010) 1-7.
[6] F.M. Martins, J.M.R. Neto, C.J. Cunha, Mineral phases of weathered and recent electric arc
furnace dust, J. Hazard. Mater. 154 (2008) 417-425.
[7] T. Sofilić, A. Rastovčan-Mioč, Š. Cerjan-Stefanović, V. Novosel-Radović, M. Jenko,
Characterization of steel mill electric-arc furnace dust, J. Hazard. Mater. 109 (2004) 59-70.
[8] G. Orhan, Leaching and cementation of heavy metals from electric arc furnace dust in alkaline
medium. Hydrometallurgy 78 (2005) 236-245.
[9] G. Salihoglu, V. Pinarli, Steel foundry electric arc furnace dust management: stabilization by
using lime and Portland cement, J. Hazard. Mater. 153 (2008) 1110-1116.
[10] C.F. Pereira, Y.L. Galiano, M.A. Rodriguez-Piñero, J.V. Parapar, Long and short term
performance of a stabilized/solidified electric arc furnace dust. J. Hazard. Mater. 148 (2007) 701-
707.
[11] E-P. Heikkinen, On the Role of Computational Thermodynamics in Research and
Development of AOD and CRC processes, Doctoral Thesis, University of Oulu, 2013.
[12] H. T. Makkonen, A. Kekki, E-P. Heikkinen, T. Fabritius, J. Aromaa, O. Forsen,
Characterization and Sulfuric Acid Leaching of Ferrochrome Converter (CRC) Dust, steel research
int. 86 (2015) 1-9.

ACC
EPTE
D M
ANU
SCR
IPT
ACCEPTED MANUSCRIPT
[13] E-P. Heikkinen, T. Fabritius, Modelling of the Refining Processes in the Production of
Ferrochrome and Stainless Steel. In: Nusheh, M., Ahuett, G.H., Arrambide, A. (eds.). Recent
Researches in Metallurgical Engineering - From Extraction to Forming, In Tech. 186 (2012) 65-88.
[14] A-G. Guèzennec, J-Ch. Huber, F. Patisson, Ph. Sessiecq, J-P. Birat, D. Ablitzer, Dust
formation in Electric Arc Furnace: Birth of the particles, Powder Technol. 157 (2005) 2-11.
[15] H. Shen, E. Forssberg, U. Nordström, Physicochemical and mineralogical properties of
stainless steel slags oriented to metal recovery, Resour. Conserv. Recycl. 40 (2004) 245–271.
[16] A.J.B. Dutra, P.R.P. Paiva, L.M. Tavares, Alkaline leaching of zinc from electric arc furnace
steel dust, Miner. Engin. 19 (2006) 478-485.
[17] N. Menad, J.N. Ayala, F.G. Carcedo, E.R. Ayúcar, A. Hernández, Study of the presence of
fluorine in the recycled fractions during carbothermal treatment of EAF dust, Waste Manag. (2003)
483-491.
[18] T. Havlik, B.V. Souza, A.M. Bernardes, I.A.H. Schneider, A. Miskufova, Hydrometallurgical
processing of carbon steel EAF dust, J. Hazard. Mater. B135 (2006) 311-318.
[19] C. Navarro, M. Díaz, M. Villa-García, Physico-Chemical Characterization of Steel Slag. Study
of its Behavior under Simulated Environmental Conditions, Environ. Sci. Technol. 44 (2010) 5383-
5388.
[20] R.L. Frost, J. Kloprogge, S. C. Rusell, J. L. Szetu, Dehydroxylation and structure of alumina
gels prepared from trisecbutoxyaluminium, Thermochim. Acta. 329 (1999) 47-56.
[21] G.C. Allen, M. Paul, Chemical characterization of transition metal spinel type oxides by
infrared spectroscopy, Appl. Spectrosc. 49 (1995) 451-458.
[22] M.J. Wilson, Clay Mineralogy: Spectroscopic and Chemical Determinative Methods, first ed.,
Champman & Hall, London, 1994.
[23] D.W. Mayo, A.M. Foil, R.W. Hannah, Course Notes on the Interpretation of Infrared and
Raman Spectra. Wiley-Interscience: New York, (2004) 316-318.
[24] S.A. Mikhail, A-M. Turcotte, Thermal reduction of steel-making secondary materials I. Basic-
oxygen-furnace dust, Thermochimica Acta 311 (1998) 113-119.
[25] S.A. Mikhail, A-M. Turcotte, J. Aota, Thermoanalytical study of EAF dust and its vitrification
product, Thermochim. Acta. 287 (1996) 71-79.
[26] I.D. Kashcheev, E.A. Terentév, K.N. Demidov, T.V. Borisova, I.D. Maryasev, Properties and
structure of magnesia modifiers for converter slags, Refract. Ind. Ceram. 48 (1) (2007) 17-22.
[27] K. Wu, T. Yang, H.W. Gudenau, Treatment of recycling fine dust formed in ironmaking and
steelmaking processes with injecting method, Iron and Steel. 34 (1999) 60-66.

ACC
EPTE
D M
ANU
SCR
IPT
ACCEPTED MANUSCRIPT
[28] H.W. Gudenau, K. Stoesser, H. Denecke, V. Schemann, Environmental aspects and recycling
of filter dusts by direct injection or use of agglomerates in shaft furnaces, ISIJ Int. 40 (2000) 218-
223.
[29] H.T. Makkonen, J. Heino, L. Laitila, A. Hiltunen, E. Pöyliö, J. Härkki, Optimisation of steel
plant recycling in Finland: dusts, scales and sludge, Resour. Conserv. Recycl. 35 (2002) 77-84.
[30] N. Ma, Recycling of basic oxygen furnace steelmaking dust by in-process separation of zinc
from the dust, J. Cleaner Product. 112 (2016) 4497-4504.
[31] T. Miki, R. Chairaksa-Fujimoto, K. Maruyama, T. Nagasaka, Hydrometallurgical extraction of
zinc from CaO treated EAF dust in ammonium chloride solution, J. Hazard. Mater. 302 (2016) 90-
96.
[32] M. Al-harahsheh, S. Kingmanb, L. Al-Makhadmah, I.E. Hamilton, Microwave treatment of
electric arc furnace dust with PVC: Dielectric characterization and pyrolysis-leaching, J. Hazard.
Mater. 274 (2014) 87-97.
[33] J.A. de Araújo, V. Schalch, Recycling of electric arc furnace (EAF) dust for use in steel
making process, J. Mater. Research Technol. 3(3) (2014) 274-279.
[34] E. Kim, T. Kim, J. Lee, Y. Kang, K. Morita, Reduction of electric arc furnace dust by graphite
powders under microwave irradiation, Ironmak. Steelmak. 39:1 (2012) 45-50.
[35] M.C. Mantovani, C. Takano, The strength and the high temperature behaviour of self-reducing
pellets containing EAF dust, ISIJ Int. 40(3) (2000) 224-230.
[36] F. Elgersma, G.F. Kamst, G.J. Witkamp, G.M. Van Rosmalen, Acidic dissolution of zinc
ferrite, Hydrometallurgy, 29 (1992) 173-189.
[37] R.L. Nyirenda, The processing of steelmaking flue-dust: a review, Miner. Engin. 4 (7-11)
(1991) 1003-1025.
[38] X. Sun, J-Y. Hwang, X. Huang, The Microwave Processing of Electric Arc Furnace Dust, JOM,
60(10) (2008) 35-39.
[39] J. Vereš, M. Lovás, Š. Jakabský, V. Šepelák, S. Hredzák, Characterization of blast furnace
sludge and removal of zinc by microwave assisted extraction, Hydrometallurgy 129-130 (2012) 67-
73.
[40] K. Nishioka, T. Maeda, M. Shimizu, Dezincing behaviour from iron and steelmaking dusts by
microwave heating, ISIJ Int. 42 (2002) S19–S22.
[41] S. Cho, J. Lee, Metal Recovery from Stainless Steel Mill Scale by Microwave Heating. Metals
Mater. Int. 14 (2) (2008) 193-196.
[42] M.B. Mourao, Jr. Parreiras de Carvalho, C. Takano, Carbothermic Reduction by Microwave
Heating, ISIJ Int. 41 (2001) S27-S30.
ACC
EPTE
D M
ANU
SCR
IPT
ACCEPTED MANUSCRIPT
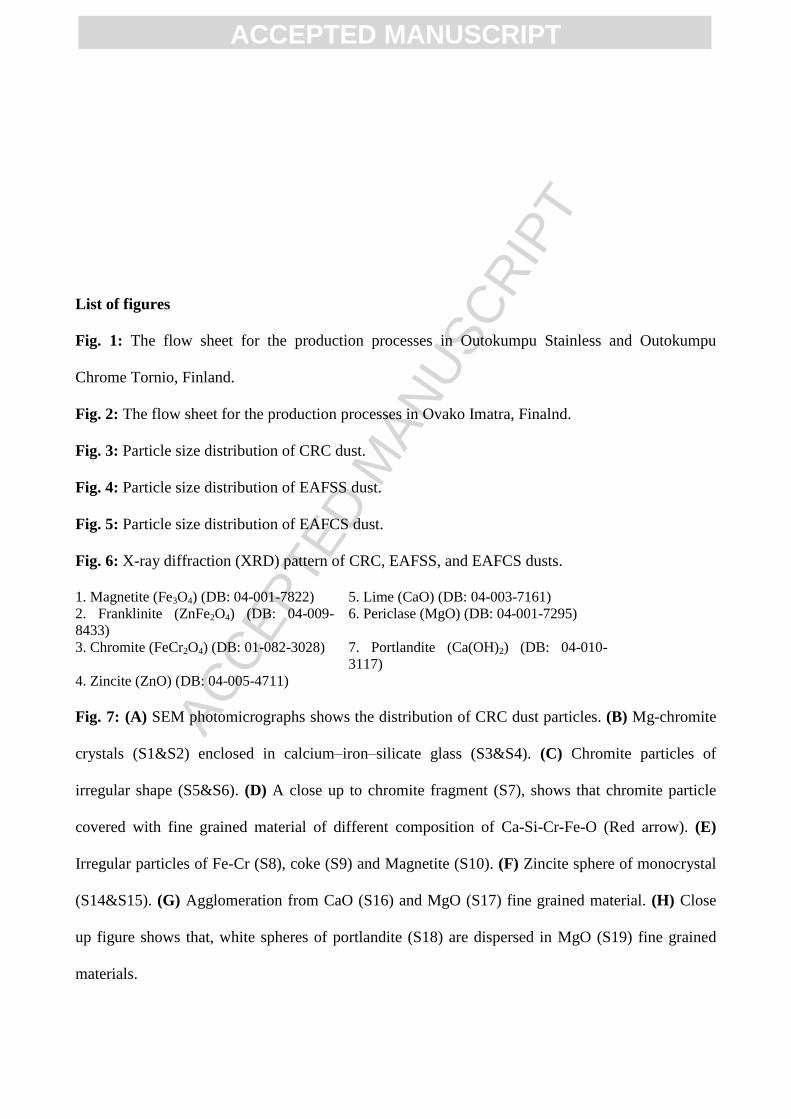
List of figures
Fig. 1: The flow sheet for the production processes in Outokumpu Stainless and Outokumpu
Chrome Tornio, Finland.
Fig. 2: The flow sheet for the production processes in Ovako Imatra, Finalnd.
Fig. 3: Particle size distribution of CRC dust.
Fig. 4: Particle size distribution of EAFSS dust.
Fig. 5: Particle size distribution of EAFCS dust.
Fig. 6: X-ray diffraction (XRD) pattern of CRC, EAFSS, and EAFCS dusts.
1. Magnetite (Fe3O4) (DB: 04-001-7822) 5. Lime (CaO) (DB: 04-003-7161)
2. Franklinite (ZnFe2O4) (DB: 04-009-
8433)
6. Periclase (MgO) (DB: 04-001-7295)
3. Chromite (FeCr2O4) (DB: 01-082-3028) 7. Portlandite (Ca(OH)2) (DB: 04-010-
3117)
4. Zincite (ZnO) (DB: 04-005-4711)
Fig. 7: (A) SEM photomicrographs shows the distribution of CRC dust particles. (B) Mg-chromite
crystals (S1&S2) enclosed in calcium–iron–silicate glass (S3&S4). (C) Chromite particles of
irregular shape (S5&S6). (D) A close up to chromite fragment (S7), shows that chromite particle
covered with fine grained material of different composition of Ca-Si-Cr-Fe-O (Red arrow). (E)
Irregular particles of Fe-Cr (S8), coke (S9) and Magnetite (S10). (F) Zincite sphere of monocrystal
(S14&S15). (G) Agglomeration from CaO (S16) and MgO (S17) fine grained material. (H) Close
up figure shows that, white spheres of portlandite (S18) are dispersed in MgO (S19) fine grained
materials.

ACC
EPTE
D M
ANU
SCR
IPT
ACCEPTED MANUSCRIPT
Fig. 8: (A-C) SEM photomicrographs show the general distribution of EAFSS dust particles, large
particles > 3 μm are characterized by encapsulation phenomenon and surrounded by fine-grained
particles. (A) Franklinite phase (S2) enclosed in glass sphere (S1). (B) Aggregates of franklinite
crystals (S5-S8) enclosed in glass sphere. (C) Franklinite particles (S10) are enclosed in glass
sphere (S11). (D) Ni chromite crystals (S12) enclosed in the calcium-iron-silicate glass spheres
(S13). (E) Magnetite particle (S14) and fragments of chromite (S15). (F) Periclase (S16) particle.
Fig. 9: Positive correlations between manganese (Mn) and zinc (Zn) concentrations in EAFSS (A),
and EAFCS (B).
Fig. 10: (A&B) SEM photomicrographs show the general distribution of EAFCS dust particles are
dominated with spherical form. (A) SEM photomicrographs show franklinite spheres (S1-S4). (B)
SEM photomicrographs show zincite spheres (S6-S8). (C) Smaller franklinite particles (S9)
agglomerated together to form large particle. (D) Franklinite phases (S10) enclosed in calcium-iron-
silicate glass spheres (S11). (E) Irregular particles of magnetite (S13-S15). (F) Fibers crystals of
franklinite rich in Pb (S18). (G) Large and porous magnetite particle show sign of melting (S19).
(H) Large particle of irregular shape of Si-O-Al (S20).
Fig. 11: FT-IR spectra for CRC, EAFSS, and EAFCS dusts.
Fig. 12: TG-DSC curves and mass spectrometry curves for CRC dust.
Fig. 13: TG-DSC curves and mass spectrometry curves for EAFSS dust.
Fig. 14: TG-DSC curves and mass spectrometry curves for EAFCS dust.

ACC
EPTE
D M
ANU
SCR
IPT
ACCEPTED MANUSCRIPT
Table (1). Granularity analyses of ferrochrome converter (CRC), electric arc furnace stainless steel (EAFSS), and electric arc furnace carbon
steel (EAFCS) dusts.
CRC EAFSS EAFCS
Particle size (μm)
d10 0.17 0.13 0.18
d25 0.84 0.31 0.48
d50 3.15 2.37 1.63
d75 4.84 3.94 2.96
d90 7.07 6.26 5.42
d100 15.42 13.00 14.62
Median (d50) 3.15 2.37 1.63
Mean 3.56 2.87 2.46
Mode 3.68 3.05 2.31
Skewness 1.57 1.62 2.47
Kurtosis 3.45 2.90 6.71

ACC
EPTE
D M
ANU
SCR
IPT
ACCEPTED MANUSCRIPT
Table (2). Chemical composition of ferrochrome converter (CRC), electric arc furnace stainless steel (EAFSS), and electric arc furnace carbon
steel (EAFCS) dusts.
CRC EAFSS EAFCS Analysing
method CRC EAFSS EAFCS
Elements Major elements (wt.%) Elements Minor elements (ppm)
C 0.3 0.5 1.5 LECO V 426 117 121
Fe 18.74 23.70 23.50 XRF Ga 375 370 184
Zn 10.83 19.84 35.76 XRF Ba 129 745 431
Cr 20.88 3.19 0.47 XRF Ta 191 301 433
CaO 14.27 11.91 5.93 XRF Mo 21 586 79
MgO 9.76 7.21 1.07 XRF Sn 44 325 234
MnO 1.56 5.82 3.99 XRF Sr 41 193 58
SiO2 9.99 8.75 3.13 XRF Rb 22 49 103
K2O 0.74 1.49 3.21 XRF Sb 38 80 94
Al2O3 0.80 0.87 0.27 XRF Cs 0 5 191
Cl 0.29 1.25 1.69 XRF Nd 0 33 78
F 0.31 0.51 0.37 XRF U 4 19 58
P2O5 0.02 0.08 0.13 XRF Ge 0 0 39
S 0.14 0.48 1.22 XRF Zr 17 19 45
TiO2 0.09 0.09 0.05 XRF Bi 4 40 0
Pb 0.11 0.62 2.15 XRF Nb 0 25 0
Ni 0.25 0.37 0.038 XRF Sc 4 4 4
Cu 0.032 0.30 0.25 XRF La 10 10 10
Pr 10 5 5
pH 10 10-11 10-11 As 13 0 0 Moisture % 0.22 0.30 0.54 Hf 6 9 16
Th 2 2 2
ACC
EPTE
D M
ANU
SCR
IPT
ACCEPTED MANUSCRIPT
Table (3). Microanalyses of the phases of ferrochrome converter (CRC) in Figure (7).
Wt.
% S1
Mg
-ch
rom
ite
S2
Mg
-ch
rom
ite
S3
Gla
ss s
ph
ere
S4
Gla
ss s
ph
ere
S5
Ch
rom
ite
S6
Ch
rom
ite
S7
Ch
rom
ite
S8
Fe-
Cr
S9
Co
ke
S1
0
Mag
net
ite
S1
1
Mag
net
ite
S1
2
Si-
chro
mit
e
S1
3
Zin
cite
S1
4
zin
cite
S1
5
zin
cite
S1
6
Po
rtla
nd
ite
S1
7
Bru
cite
S 1
8
Po
rtla
nd
ite
S1
9
Per
icla
se
O 33.59 34.82 39.04 39.54 30.28 30.84 29.98 - 15.59 26.31 31.04 34.47 47.67 25.93 23.59 52.76 53.54 42.67 39.3
Cr 37.32 43.17 1.28 1.34 49.44 49.59 47.92 25.15 0.17 0.53 10.88 30.67 6.94 9.64 2.52 - - 0.83 0.19
Fe 16.16 14.17 19.78 18.23 18.25 18.33 20.55 68.43 71.55 50 14.77 5.85 6.64 4 - 0.97 1.19 0.86
Zn - 0.36 - - - - - - - - - - 17.64 43.95 57.23 - - 0.97 -
Ca 3.24 - 17.04 17.58 0.28 0.19 - - - 0.39 - - 8.91 0.47 - 42.89 7.53 51.03 0.26
Mg 3.76 3.49 2.1 2.02 - - - - - - - 1.78 1.6 0.53 1.94 0.75 31.76 0.86 59.41
Al 1.4 - 1.71 1.72 - - - - - - - - - - - 1.13 0.32 - Si 2.7 0.56 15.05 15.67 0.81 0.14 0.1 - - 0.24 - 9.6 2.83 6.86 5.88 0.87 - 0.65 -
Mn 0.94 1.35 - - 0.69 0.85 0.94 - - - - 1.44 1.59 0.59 - - - - Cl - - - - - - - - - - - - 6.83 - - 2.73 5.06 0.74 - K 0.35 - 1.12 0.99 - - - - - - - 0.92 - 0.14 - - - - - Na - - 0.64 0.63 - - - - - - - - 1.73 3.25 2.79 - - - - Ti 0.54 - 2.25 2.27 0.25 - - - - - - 0.29 - - - - - - - Co - - - - - - 0.53 - - 0.98 1.03 - - - - - - - - Ni - - - - - - - - - - 0.45 - - - - - - - - C - - - - - - - 5.91 84.07 - - - - - - - - - -

ACC
EPTE
D M
ANU
SCR
IPT
ACCEPTED MANUSCRIPT
Table (4). Microanalyses of the phases of electric arc furnace stainless steel (EAFSS) in Figure (8).
Wt.% S1
Gla
ss
S2
Fra
nk
lin
ite
S3
Fra
nk
lin
ite
S4
Gla
ss
S5
Fra
nk
lin
ite
S6
Fra
nk
lin
ite
S7
Fra
nk
lin
ite
S8
Fra
nk
lin
ite
S9
Mag
net
ite
S1
0
Fra
nk
lin
ite
S1
1
Gla
ss
S1
2
Ni-
Ch
rom
ite
S1
3
Gla
ss
S1
4
Mag
net
ite
S1
5
Ch
rom
ite
S1
6
Per
icla
se
S1
7
mag
net
ite
S1
8
Fra
nk
lin
ite
O 32.19 30.51 30.48 36.48 29.94 26.82 28.13 29.18 25.81 29.5 32.19 30.47 38.64 27.79 30.18 38.31 27.8 27.1
Zn 11.58 19.2 4.77 2.09 18.65 19.34 18.48 22.5 0.99 7.42 7.58 0.43 0.22 0.16 3.52 - 6.99 20
Fe 10.14 12.92 39.12 17.1 25.05 32.28 7.99 14.07 64.21 30.69 10.14 9.41 6.82 69.31 35.93 0.9 63.21 34.38
Cr 0.36 2.02 1.7 0.96 0.33 0.4 1.67 0.59 1.46 7.2 0.36 37.07 1.02 0.23 19.05 - 0.85 0.39
Mg 2.13 19.55 2.01 2.23 0.43 0.52 13.75 5.69 0.82 4.01 2.13 2.25 1.65 - 1.46 59.01 - 0.5
Ca 21.21 1.31 6.35 9.76 4.55 1.72 1.04 5.29 1.12 3.22 22.21 0.33 19.21 0.79 0.66 - 0.15 1.68
Si 8.19 0.66 3.54 13.51 5.64 2.33 0.41 4.94 1 2.84 11.19 0.27 18.31 - 1.59 - - 2.32
Mn 2.68 5.24 6.51 6.04 5.41 5.4 19.9 6.41 3.42 5.99 1.68 4.45 2.9 0.41 4.1 - 0.33 5.53
Al 3.53 1.54 0.83 3.51 1.03 1.01 - 1.52 0.28 2.43 3.53 1.77 2.72 - 0.84 - - 1.12
K - - - 1.01 0.98 0.36 - 0.59 - - - - 1.61 - 0.42 - - 0.34
Na 1.28 1.81 - 2.18 3.19 2.22 2.03 2.14 - 1.04 1.28 - 1.4 - - - - 2.21
Ti 0.38 - - 0.32 - - - - - 0.19 0.38 0.19 0.9 - 0.86 - - - Co - - - - - - - - 0.9 0.81 - - - 0.88 - - 1.1 - Ni - - - - - - - - - - - 9.55 2.57 - 1.15 - - - Cu - - - - - - - - 0.99 - - - - - - - - -

ACC
EPTE
D M
ANU
SCR
IPT
ACCEPTED MANUSCRIPT
Table (5). Microanalyses of the phases of electric arc furnace carbon steel (EAFCS) in Figure (10).
Wt.% S1
Fra
nk
lin
ite
S2
fra
nk
lin
ite
S3
fran
kli
nit
e
S4
fran
kli
nit
e
S5
Zin
cite
S6
zin
cite
S7
zin
cite
S8
zin
cite
S9
Fra
nk
lin
ite
S1
0
Fra
nk
lin
te
S1
1
Gla
ss
S1
2
Fra
nk
lin
ite
S1
3
Mag
net
ite
S1
4
Mag
net
ite
S1
5
Mag
net
ite
S1
6
Mag
net
ite
S1
7
Fra
nk
lin
ite
S1
8
Pb
-Fra
nk
lin
ite
S1
9
Mag
net
ite
S
20
Al
-Si
O 28.01 27.66 23.41 26.64 18.77 18.49 20.49 22.37 26.77 29.07 32.06 23.46 27.28 24.83 30.01 28.19 26.75 28.84 28.18 48.71
Fe 33.47 32.58 35.8 34.45 5.4 3.45 9.02 4.27 40.43 37.13 32.63 28.99 52.39 57.45 51.38 62.37 32 43.6 62.42 0.51
Zn 18.86 24.04 25.38 19.87 64.1 68.49 54.59 62.45 22.3 14.46 8.29 38.05 16.22 14.42 5.27 5.11 24.64 18.47 6.71 0.09
Mn 10.36 7.84 4.57 4.1 1.49 1.37 1.6 1.04 3.07 3.82 2.22 3.55 2.06 0.58 1.99 1.08 9.25 0.87
Ca 2.42 2 3.14 2.65 0.35 0.28 1.36 0.53 1.2 9.25 16.22 0.99 0.37 0.13 0.77 0.16 0.76 1.39 0.27 2.82
Si 0.88 1.19 0.95 2.71 0.38 - 0.78 0.62 1.07 1.6 2.82 0.69 0.41 0.22 1.1 0.11 0.36 1.1 0.28 29.02
Mg 2.28 0.98 1.26 2.11 0.87 0.65 0.88 1.34 0.82 0.5 - 0.61 - - 2.6 0.54 2.55 - - -
Al 0.88 - - 0.54 - - - - 0.48 0.69 0.87 0.33 0.57 - 3.07 0.41 - - - 11.97
Cl 0.25 0.5 0.46 0.24 0.43 - 0.23 0.97 - - - 0.16 - - - - 0.19 2.13 - -
K - 0.19 0.31 0.55 0.22 - 0.26 0.48 0.32 0.37 0.41 - - - 0.35 - 0.16 0.28 0.12 -
Na 2.03 2.33 3.11 3.24 5.22 5.61 6.01 5.6 2.81 1.98 3.67 2.71 - 1.55 1.45 - 2.43 - - 6.88
P 0.17 - - 0.24 0.37 - 0.26 - - - 0.14 - - - - - - - - -
S - - - - - - - 0.32 - - - 0.15 - - - - - 1.45 - -
Cr 0.38 - - 0.83 - - - - - - - 0.3 0.7 - - 0.3 0.58 - - -
Co - - - - - - - - 0.74 - - - - 0.82 - 1.14 - - 1.14 -
Ni - - - - - - - - - - - - - - - 0.58 - - - -
Pb - - 1.09 1.83 1.45 - 0.88 - - 1.12 0.67 - - - - - - 2.36 - -

ACC
EPTE
D M
ANU
SCR
IPT
ACCEPTED MANUSCRIPT

ACC
EPTE
D M
ANU
SCR
IPT
ACCEPTED MANUSCRIPT

ACC
EPTE
D M
ANU
SCR
IPT
ACCEPTED MANUSCRIPT

ACC
EPTE
D M
ANU
SCR
IPT
ACCEPTED MANUSCRIPT

ACC
EPTE
D M
ANU
SCR
IPT
ACCEPTED MANUSCRIPT

ACC
EPTE
D M
ANU
SCR
IPT
ACCEPTED MANUSCRIPT

ACC
EPTE
D M
ANU
SCR
IPT
ACCEPTED MANUSCRIPT

ACC
EPTE
D M
ANU
SCR
IPT
ACCEPTED MANUSCRIPT

ACC
EPTE
D M
ANU
SCR
IPT
ACCEPTED MANUSCRIPT

ACC
EPTE
D M
ANU
SCR
IPT
ACCEPTED MANUSCRIPT

ACC
EPTE
D M
ANU
SCR
IPT
ACCEPTED MANUSCRIPT

ACC
EPTE
D M
ANU
SCR
IPT
ACCEPTED MANUSCRIPT

ACC
EPTE
D M
ANU
SCR
IPT
ACCEPTED MANUSCRIPT

ACC
EPTE
D M
ANU
SCR
IPT
ACCEPTED MANUSCRIPT

ACC
EPTE
D M
ANU
SCR
IPT
ACCEPTED MANUSCRIPT

ACC
EPTE
D M
ANU
SCR
IPT
ACCEPTED MANUSCRIPT
Effect of steelmaking dust characteristics on suitable recycling process determining: Ferrochrome converter (CRC) and electric arc
furnace (EAF) dusts
Abstract
Utilization of dusts generated from steelmaking industries will avoid disposal of wastes, enhance the use of secondary raw material fines and
save costs. Understanding the properties of dust is necessary before determining the suitable recycling method. The present paper describes the
chemical, morphological and mineralogical characterization of steelmaking dusts produced in steel plants in Finland. In this paper three different
steelmaking dusts: ferrochrome converter (CRC) and electric arc furnace stainless steel (EAFSS) dusts from Outokumpu (Tornio, Finland), and
electric arc furnace carbon steel (EAFCS) dust from Ovako (Imatra, Finland) were characterized.
The characterization study showed that, the dusts from carbon steelmaking (EAFCS) are rich in zinc, while the dusts from stainless steelmaking
(CRC) and (EAFSS) are relatively low in zinc, but richer in chromium. The zinc contents in CRC, EAFSS and EAFCS dusts are 10.83, 19.84 and
35.76 wt.%, respectively, while the chromium contents are 20.88, 3.19 and 0.47 wt.%, respectively. In the dust from CRC, zinc is found as zinc
oxide (zincite, ZnO), while in the dusts from EAFSS & EAFCS zinc is found mostly as zinc ferrite (franklinite, ZnFe2O4). Scanning electron
microscopy (SEM) investigations indicated that CRC dust is dominated by non-spherical form and composed mainly of aggregates of irregular
particles of chromite, in addition to zincite sphere. EAFSS dust particles are characterized by encapsulation phenomenon, franklinite particles
enclosed inside calcium-iron-silicate glass sphere. Manganese (Mn) concentrations shows positive correlation with Zn, which suggests the
occurrence of Mn mainly with franklinite phase. EAFCS dust is dominated by spherical form, and zinc found as franklinite and zincite. In the
large particles > 3 µm of EAFCS dust, franklinite enclosed inside glass sphere, while in finer particles < 1 µm, both zincite and franklinite are
existed as spheres.
The investigations indicate that steelmaking dusts from CRC, EAFSS, and EAFCS show significant difference in concentration and mode of
occurrence of zinc in the dusts, which will influence on determine the suitable processing methods.

ACC
EPTE
D M
ANU
SCR
IPT
ACCEPTED MANUSCRIPT
Highlights:
Properties of steelmaking dust and its implication on determine recycling method was studied.
EAF dust are rich in zinc, while CRC are relatively low in zinc, but richer in chromium.
In CRC, zinc is found as zinc oxide, while in EAFSS & EAFCS zinc is found as zinc ferrite.
Pyrometallurgical methods are more suitable for processing EAFSS and EAFCS dusts.
Hydrometallurgical methods will be more efficient than pyrometallurgical methods for processing CRC.