Embed Size (px)
Citation preview

EFFECT OF SOUTHERN ROOT-KNOT NEMATODE (MELOIDOGYNE INCOGNITA) ON
COTTON GROWTH, YIELD, AND FIBER QUALITY
by
PING LU
(Under the Direction of Robert C. Kemerait, Jr.)
ABSTRACT
Southern root-knot nematode [Meloidogyne incognita (Kofoid & White) Chitwood] is a
major parasite on cotton (Gossypium hirsutum L.). In this study, greenhouse experiments were
conducted to evaluate the effect of M. incognita on cotton growth and physiological variables
related to fiber development. Field experiments were conducted to evaluate the effect of different
nematode management strategies on cotton growth, yield, and fiber quality. In greenhouse trials,
most plant growth and physiological variables showed significant reduction with M. incognita
infection. In field trials, Telone II significantly reduced M. incognita populations and increased
cotton growth compared with Temik 15G and seed treatments. Cotton lint yield was improved by
Telone II in most field trials except in two out of four fields in 2009. Most fiber quality
properties were not consistently or significantly affected by different nematicide treatments
across fields and years. Nematicides performed similarly in different nematode management
zones.
INDEX WORDS: Cotton, Fiber quality, Growth, Meloidogyne incognita, Site-specific management, Southern root-knot nematode, Yield

EFFECT OF SOUTHERN ROOT-KNOT NEMATODE (MELOIDOGYEN INCOGNITA) ON
COTTON GROWTH, YIELD, AND FIBER QUALITY
by
PING LU
B.S., China Agricultural University, Beijing, 2007
A Thesis Submitted to the Graduate Faculty of The University of Georgia in Partial Fulfillment
of the Requirements for the Degree
Master of Science
ATHENS, GEORGIA
2010

© 2010
Ping Lu
All Rights Reserved

EFFECT OF SOUTHERN ROOT-KNOT NEMATODE (MELOIDOGYEN INCOGNITA) ON
COTTON GROWTH, YIELD, AND FIBER QUALITY
by
PING LU
Co-Major Professors: Robert C. Kemerait, Jr. Harald Scherm Committee: Richard F. Davis Glen L. Ritchie Pingsheng Ji Electronic Version Approved: Maureen Grasso Dean of the Graduate School The University of Georgia August 2010

iv
ACKNOWLEDGEMENTS
I would like to thank all my committee members, including major professor Dr. Robert
Kemerait, co-advisor Dr. Harald Scherm, committee members Dr. Richard Davis, Dr. Glen
Ritchie, and Dr. Pingsheng Ji, for their support during this study. My graduate program could not
have been accomplished without any of them.
I would also like to show my gratitude to all the professors and staff from Departments of
Plant Pathology and Horticulture who helped me during my research, including Dr. Marc van
Iersel, Dr. Jim Noe, Dr. Patricia Timper, Dr. Katherine Stevenson; research professionals and
specialists Andy Knowlton, Amy Savelle, Charles Laster, Joy Carter, Lina Young, Rex Allen,
Sue Dove, Ted Holladay, Tommy Hilton; and all the student research assistants. Dr. Ganpat
Jagdale, Judy Cross, and Cliff Brewer from the Extension Nematology Lab in Athens also
contributed significantly through their efforts on soil samples.
Special thank to Calvin Perry and the staff from the Department of Biological and
Agricultural Engineering, for cooperating on the risk management zone study; Amanda Smith
from the Department of Agricultural and Applied Economics for cooperating on the evaluation
of economic impacts; Richard Layton from Tifton campus for helping me with statistical
analysis; and last but not least, growers Tom Windhausen, Craig Perryman, and Mike Nugent for
contributing their field sites and cooperating with the experiments.
This project was funded by Dow AgroSciences and Bayer CropScience. I would like to
express my appreciation to these companies for their support.

v
TABLE OF CONTENTS
Page
ACKNOWLEDGEMENTS ........................................................................................................... iv
LIST OF TABLES ........................................................................................................................ vii
LIST OF FIGURES ........................................................................................................................ xi
CHAPTER
1 INTRODUCTION AND LITERATURE REVIEW .................................................... 1
1.1 References ...................................................................................................... 13
2 EFFECT OF SOUTHERN ROOT-KNOT NEMATODE (MELOIDOGYNE
INCOGNITA) ON COTTON GROWTH AND PHYSIOLOGY IN THE GREENHOUSE ........ 17
2.1 Abstract .......................................................................................................... 18
2.2 Introduction .................................................................................................... 19
2.3 Materials and Methods ................................................................................... 23
2.4 Results ............................................................................................................ 27
2.5 Discussion ...................................................................................................... 30
2.6 Summary and Conclusions ............................................................................. 35
2.7 References ...................................................................................................... 36
3 EFFECT OF SOUTHERN ROOT-KNOT NEMATODE (MELOIDOGYNE
INCOGNITA) ON COTTON GROWTH, YIELD, AND FIBER QUALITY IN THREE FIELDS
ASSESSED FOR SITE-SPECIFIC MANAGEMENT ................................................................. 47

vi
3.1 Abstract .......................................................................................................... 48
3.2 Introduction .................................................................................................... 59
3.3 Materials and Methods ................................................................................... 58
3.4 Results ............................................................................................................ 63
3.5 Discussion ...................................................................................................... 69
3.6 Summary and Conclusions ............................................................................. 73
3.7 References ...................................................................................................... 75
4 EFFECT OF SOUTHERN ROOT-KNOT NEMATODE (MELOIDOGYNE
INCOGNITA) ON COTTON GROWTH, YIELD, FIBER QUALITY, AND ECONOMIC
IMPACT ACROSS DIFFERENT VARIETIES ........................................................................... 98
4.1 Abstract .......................................................................................................... 99
4.2 Introduction .................................................................................................. 100
4.3 Materials and Methods ................................................................................. 108
4.4 Results .......................................................................................................... 112
4.5 Discussion .................................................................................................... 115
4.6 Summary and Conclusions ........................................................................... 118
4.7 References .................................................................................................... 119
5 SUMMARY AND CONCLUSIONS ...................................................................... 133

vii
LIST OF TABLES
Page
Table 2.1: Effect of different nematode inoculation levels and cotton varieties on gall rating and
egg counts .......................................................................................................................... 39
Table 2.2: Effect of different nematode inoculation levels and cotton breeding lines on gall rating
and egg counts ................................................................................................................... 40
Table 2.3: Effect of different nematode inoculation levels and cotton varieties on the areas under
the height-to-node ratio, chlorophyll content, and chlorophyll fluorescence progress curve41
Table 2.4: Effect of different nematode inoculation levels and cotton breeding lines on the areas
under the height-to-node ratio, chlorophyll content, and chlorophyll fluorescence
progress curve ................................................................................................................... 42
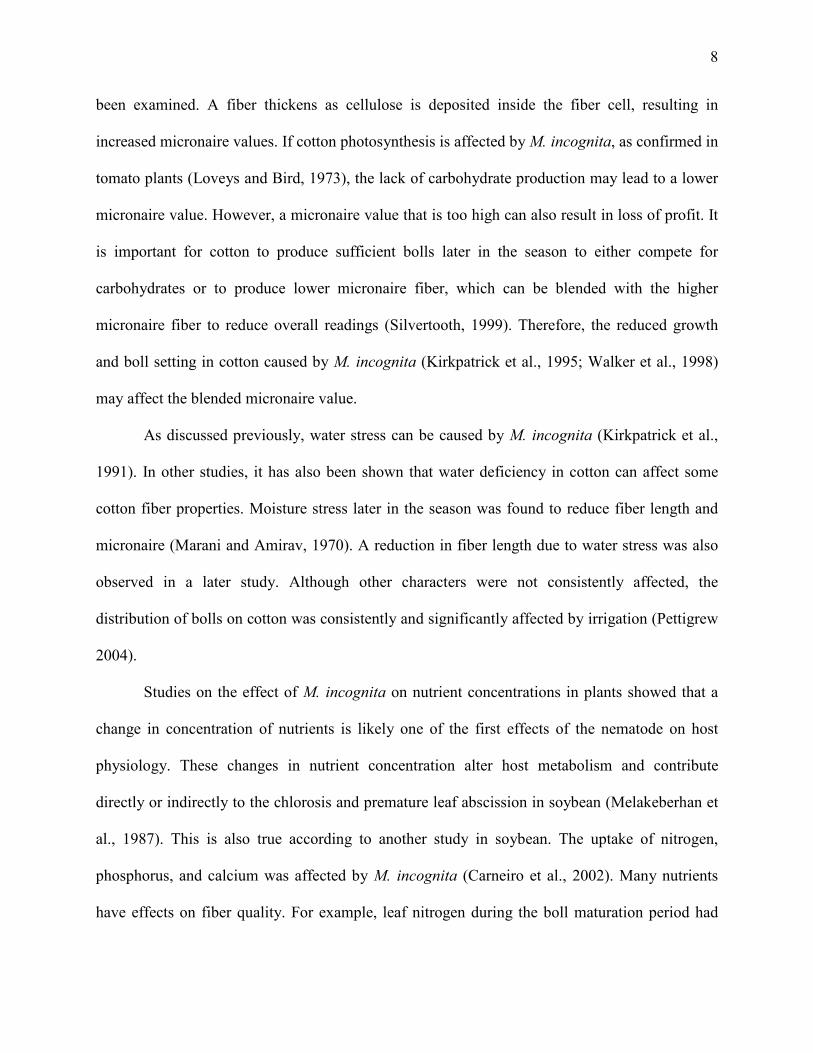
Table 2.5: Effect of different nematode inoculation levels and cotton varieties on plant dry
weight, root weight, leaf area, boll number, and boll dry weight ..................................... 43
Table 2.6: Effect of different nematode inoculation levels and cotton breeding lines on plant dry
weight, root weight, leaf area, boll number, and boll dry weight ..................................... 44
Table 2.7: Effect of different nematode inoculation levels and cotton varieties on photosynthesis45
Table 2.8: Effect of different nematode inoculation levels and cotton breeding lines on
photosynthesis ................................................................................................................... 46
Table 3.1: Soil sampling dates for southern M. incognita juvenile counts at Perryman,
Windhausen West and Windhausen East farms in 2008 and 2009 ................................... 80

viii
Table 3.2: Effect of nematicides on cotton root damage, M. incognita reproduction, and
nematode juvenile population at Perryman farm in 2008 and 2009 ................................. 81
Table 3.3: Effect of nematicides on cotton shoot height, shoot dry weight, root weight, and
height-to-node ratio at Perryman farm in 2008 and 2009 ................................................. 82
Table 3.4: Effect of nematicides on cotton root damage, M. incognita reproduction, and
nematode juvenile population at Windhausen farms in 2008 and 2009 ........................... 83
Table 3.5: Effect of nematicides on cotton shoot height, shoot dry weight, root weight, and
height-to-node ratio at Windhausen farms in 2008 and 2009 ........................................... 84
Table 3.6: Effect of nematicides on cotton yield and fiber quality at Perryman farm across all
sampling plots in 2008 and 2009....................................................................................... 85
Table 3.7: Effect of nematicides on cotton yield and fiber quality at Windhausen farms across all
sampling plots in 2008 and 2009....................................................................................... 86
Table 3.8: Effect of nematicides on cotton yield and fiber quality across the entire field at
Perryman farm in 2008 and 2009 ...................................................................................... 87
Table 3.9: Effect of nematicides on cotton yield and fiber quality across the entire field at
Windhausen farms in 2008 and 2009 ................................................................................ 88
Table 3.10: Eigenvectors of principal components and explanatory variables for Perryman and
Windhausen East and West farms in 2008 ........................................................................ 89
Table 3.11: Regression analysis of cotton yield and fiber properties on principal components for
Perryman and Windhausen East and West farms in 2008 ................................................ 90
Table 3.12: Eigenvectors of principal components and explanatory variables for 2009 trials ..... 91
Table 3.13: Regression analysis of cotton yield and fiber properties on principal components for
2009 trials .......................................................................................................................... 93

ix
Table 3.14: Effect of different types and rates of nematicides on cotton lint price at Perryman and
Windhausen West and Windhausen East fields in 2008 and 2009 ................................... 94
Table 3.15: Effect of different types and rates of nematicides on adjusted revenue at Perryman
and Windhausen West and Windhausen East fields in 2008 and 2009 ............................ 95
Table 4.1: Soil sampling dates for southern M. incognita juvenile counts at Nugent farm in 2008
and at Gibbs farm in 2009 ............................................................................................... 123
Table 4.2: Effect of nematicides and cotton varieties on root damage, M. incognita reproduction,
and nematode juvenile population at Nugent farm in 2008 and Gibbs farm in 2009 ..... 124
Table 4.3: Effect of nematicides and cotton varieties on shoot height, shoot dry weight, root
weight, and height-to-node ratio at Nugent farm in 2008 and Gibbs farm in 2009 ........ 125
Table 4.4: Effect of nematicides on yield and fiber quality at Nugent farm in 2008 and Gibbs
farm in 2009 .................................................................................................................... 126
Table 4.5: Effect of cotton varieties on yield and fiber quality at Nugent farm in 2008 and Gibbs
farm in 2009 .................................................................................................................... 127
Table 4.6: Eigenvectors of principal components and explanatory variables for the Nugent 2008
trial .................................................................................................................................. 128
Table 4.7: Regression analysis of cotton yield and fiber properties on principal components for
the Nugent 2008 trial ....................................................................................................... 129
Table 4.8: Eigenvectors of principal components and explanatory variables for the Gibbs 2009
trial .................................................................................................................................. 130
Table 4.9: Regression analysis of cotton yield and fiber properties on principal components for
the Gibbs 2009 trial ......................................................................................................... 131

x
Table 4.10: Effect of different types of nematicides and seed treatment on cotton lint price and
adjusted revenue at Nugent farm in 2008 and Gibbs farm in 2009 ................................ 132

xi
LIST OF FIGURES
Page
Figure 3.1: Experimental design maps of Perryman farm and Windhausen East and Windhausen
West farm (from left to right) in 2008............................................................................... 96
Figure 3.2: Experimental design maps of Perryman farm and Windhausen East and Windhausen
West farm (from left to right) in 2009............................................................................... 97

1
CHAPTER 1
INTRODUCTION AND LITERATURE REVIEW
Cotton (Gossypium hirsutum L.), is an oilseed and fiber crop. It is grown in more than
seventy countries and is the single most important fiber crop worldwide. No crop competes with
it in the potential of value-added processing (Basra, 1999). Cotton is also one of the oldest
cultivated crops. It has been associated with human activity since before recorded history.
The U.S. is the third-largest producer of cotton in the world. Cotton production in the U.S.
has increased 66% in the past 40 years (Mitchell, 2009). In recent years, the U.S. has produced
about 20% of the world's annual supply (Mitchell, 2009).
Root knot nematodes (Meloidogyne spp.) occur worldwide and attack a diversity of crops.
They can cause considerable losses of yield and affect the quality of the products, either by
directly damaging plants (Kirkpatrick and Sasser, 1984) or by predisposing them to infection by
fungal and bacterial pathogens (Powell, 1971).
The southern root-knot nematode [Meloidogyne incognita (Kofoid & White) Chitwood]
is found in all cotton production regions in the U.S. and is the most widely distributed nematode
parasite of economic importance to the crop (Thomas and Kirkpatrick, 2001). It is considered the
major yield-limiting plant-parasitic nematode across the U.S. Cotton Belt; approximately twice
as much yield loss is attributed to southern root-knot nematodes than to all other nematode
parasites of the crop (Koenning et al., 2004). The estimated yield loss of cotton caused by M.
incognita in the U.S. was 2.4% in 2007, which was greater than for any other cotton disease.

2
This damage resulted in a loss of more than 106,000,000 kg of lint (Cotton Disease Loss
Committee, 2008). In Georgia in 2007, the southern root-knot nematode caused an estimated 6%
reduction in yield resulting in a loss of 25,000,000 kg of lint (Cotton Disease Loss Committee,
2008).
Damage caused by plant-parasitic nematodes is distinct from other plant diseases because
there are no unique symptoms on the above-ground portions of the plants. Nematodes are often
unevenly distributed in the soil; therefore the symptoms associated with damage from nematodes
may occur in irregular patches in the field (Beltwide Cotton Committee, 2003). These patches
can be either small and limited in number, or large and widely distributed. Damaged plants may
exhibit symptoms ranging from mild to severe stunting, depending on disease severity, and a
reduced rate of development. Foliage may also show symptoms of nutritional deficiency
(Kirkpatrick et al., 1995). In the most severe cases, plants may die before maturation. The
nematodes also interact with the Fusarium wilt pathogen (F. oxysporum f.sp. vasinfectum), which
leads to wilting and brown discoloration or necrosis of the vascular tissue of the lower stem
(Beltwide Cotton Committee, 2003).
Below-ground symptoms caused by M. incognitas on cotton can be much more
diagnostic than above-ground symptoms. Visible galls or “knots” often appear on cotton roots
(Bridge and Page, 1980). Swellings of the infected root tissue can be found on the cotton tap root
and the lateral roots; however, the galls on cotton may not be as easy to observe as those on
vegetables such as tomatoes. Galls are easier to detect if cotton plants are carefully dug (not
pulled) from the soil. Also, the fine lateral roots need to be carefully handled when rinsed with
water to remove soil (Beltwide Cotton Committee, 2003).

3
The tap root and its lateral roots are of vital importance to the cotton plant. A few galls on
these roots can disrupt the normal flow of water and nutrients to the leaves and developing bolls,
which can significantly reduce the cotton yield (Bird and Loveys, 1975; Kirkpatrick et al., 1991;
McClure, 1977).
It has been shown that plant growth can be reduced significantly by heavy infection with
M. incognita (Bird, 1970). Above-ground symptoms of M. incognita infection are nondescript,
but include suppressed plant growth (stunting), nutritional deficiency (chlorosis), and temporary
wilting during the heat of the day (Beltwide Cotton Committee, 2003). Most damage to the
cotton plant caused by M. incognita results from physiological changes caused by nematode
feeding on root tissues. Reduced plant growth and leaf expansion as a result of infection by M.
incognita have been documented (Kirkpatrick et al., 1995). Infection by M. incognita has also
reduced the number and size of cotton bolls and plant dry weight (Walker et al., 1998).
Anatomically, M. incognita affects cotton roots by disrupting the xylem as well as changing root
epidermis and cortical tissues in response to giant-cell development and gall formation.
Research has shown that infection by M. incognita can reduce photosynthetic rates in
different plants. Within 2 days of M. incognita infection, differences between photosynthetic
rates in control and test tomato plants occurred (Loveys and Bird, 1973). This seemed to be a
physiological response rather than a morphological one. However, after 22 days, morphological
differences had become important in determining the CO2-fixing capacity of the whole plant. It
has been suggested that during early stages of infection, the decreased photosynthesis was highly
significant when expressed on the basis of fresh weight, leaf area, or total chlorophyll content
(Loveys and Bird, 1973). This physiological response may have resulted from a reduced supply
of root-derived photosynthesis-regulating factors. For example, it was shown that both

4
cytokinins and gibberellins in tomato root tissue and xylem exudates were decreased in plants
infected with M. incognita compared with control plants (Brueske and Bergeson, 1972). During
late stages of the infection, the reduced rate of photosynthesis was at least partly due to the
smaller size of infected plants (Loveys and Bird, 1973).
It has also been discovered that M. incognita infection suppressed plant growth and
reduced yield, chlorophyll content, photosynthetic rate, and nutrient concentrations in Henbane
(Hyoscyamus niger). The greatest reduction in all characters was observed when plants were
inoculated with the highest nematode population (Haseeb et al., 1990).
Previous research has focused on the management of M. incognita to improve cotton
yield. Very little data has documented the impact of M. incognita on cotton fiber quality.
However, cotton fiber quality is a very important issue to the growers and to the textile industry.
Fiber quality is assessed using a set of measurements that describe a sample of fibers extracted
from a bale of cotton (Bradow and Davidonis, 2000). These measurements include length,
uniformity, strength, micronaire, color grade, trash, leaf grade, preparation, and extraneous
matter (USDA, 2001). They are compared with a set of standards from the U.S. Department of
Agriculture (USDA) and are used to determine price premiums and discounts.
In recent years, cotton lint quality has become increasingly important because of the
requirements by textile mills for high fiber quality, the use of high-volume instrument (HVI)
testing, the occurrence of discounts due to unfavorable fiber characteristics, and depressed cotton
markets (Silvertooth, 1999). Georgia is the third-largest cotton producer in the U.S. In the 1990s
and early 21st century, cotton produced in Georgia had fiber quality second only to that produced
in California, but now certain fiber quality parameters have not only fallen below levels found in

5
western U.S cotton, but also below the average fiber quality of other southern and southeastern
states (Bradow and Davidonis, 2000).
Cotton plants are sensitive to stress and there are many factors that could influence fiber
quality. As has been described in the literature, nutrients, moisture, insecticides and
environmental factors all have impact on one or more fiber properties because they interrupt one
or more processes of fiber physiological development (Pettigrew, 2001; Reddy et al., 2004;
Roberts et al., 2005; Shimishi and Masani, 1971; Snipes and Baskin, 1994).
There are four general phases in cotton fiber development: 1) initiation, 2) elongation, 3)
thickening, and 4) desiccation (maturation). Fiber length is determined in the elongation stage,
which occurs about 21 days after flowering. During this stage, a thin cell wall of carbohydrate
polymers is deposited allowing the fiber to elongate (DeLanghe, 1986). Water pressure inside the
developing fiber has an influence on fiber elongation by regulating the deposition of
carbohydrate polymers (Bradow and Davidonis, 2000). Therefore, if stresses occur during this
stage (which could be associated with water stress or potassium deficiency, for example), fiber
length can be reduced (Silvertooth, 1999). To some degree, fiber strength and uniformity can
also be influenced by these same stresses (Bradow and Davidonis, 2000).
The thickening process of cotton fibers may overlap with elongation to some extent.
During this stage, carbohydrates produced through photosynthesis are deposited on the interior
walls of the fiber, which increases the value of micronaire (Silvertooth, 1999). If this
development is stopped prematurely, finer fibers will occur and the micronaire value will
decrease. New bolls that are set on the plant usually have some of the greatest demand for
carbohydrates. These bolls draw carbohydrates from the older bolls, which prevents the
development of high micronaire fibers on older bolls (Silvertooth, 1999).

6
The maturation of fiber occurs after the boll has opened and the metabolically inactive
fibers dry. There is no quality measurement directly related to the maturation process. The fiber
quality within a boll is at its utmost on the day of boll opening (Bradow and Davidonis, 2000).
Therefore harvesting should be as close to physiological maturity as possible to enhance the
quality of the crop produced.
Environmental factors and management factors can significantly alter cotton fiber quality.
For example, reduced light (cloudy) conditions result in the production of weaker fibers with
reduced micronaire (Pettigrew, 2001). Early defoliation can also reduce micronaire in cotton
(Snipes and Baskin, 1994).
Biological factors such as plant-pathogenic fungi and insect pests have also been studied.
Cotton root rot, caused by the soilborne fungus Phymatotrichum omnivorum, can reduce fiber
length and fineness significantly (Mulrean, 1984). It has also been well documented that by
feeding on cotton bolls, stink bugs can decrease fiber quality as indicated by a reduction in
almost all HVI-measured variables (Roberts et al., 2005). M. incognita, a root-feeding plant
parasite, is another factor that could potentially affect fiber quality. M. incognita draws nutrients
and water from cotton plants and exacerbates moisture, nutrient, or other stresses and also fungal
infection, which could indirectly damage fiber development.
In previous studies, several fiber properties were documented to be affected by moisture
and nutrient stress, and reduced or delayed cotton growth. In other studies, it has been shown that
similar stresses could be caused by M. incognita.
Fiber length and staple can be influenced by several factors including cotton variety,
temperature, water stress, nutrient deficiencies, and ginning practices (Bradow and Davidonis,
2000). Water relationships and irrigation practices have been studied primarily in relation to

7
yield. One study conducted in the early 1980s indicated that fiber length was not impacted until
water stress was such that yields were limited to less than 706.1 kg/ha (Grimes and Yamada,
1982). The interaction between M. incognita and water stress in cotton has also been studied.
The results indicated that in susceptible cultivars, infection by M. incognita may decrease the
movement of water from roots to leaves. The decrease in root flux caused by nematodes is equal
to that induced by severe water deficit stress (Kirkpatrick et al., 1991). Other studies have
demonstrated that water stress early in the bloom period had a less negative impact on fiber
length than water stress late in the bloom period (Hearn, 1976; Marani and Amirav, 1971;
Shimishi and Masani, 1971). Sensitivity of fiber elongation to severe water stress is apparently
due to the physiological and mechanical processes of cell expansion (Hearn, 1994). As M.
incognita infection becomes increasingly severe later in the season, the resulting water stress in
the cotton plant could lead to a reduction in fiber length.
The possible impact of M. incognita on fiber strength is not as direct as the impact on
fiber length. Firstly, fiber strength has a positive relationship with canopy sunlight absorption.
There is evidence that M. incognita can reduce plant leaf area, e.g., in tomato (Loveys and Bird,
1973). Therefore by reducing cotton leaf area, M. incognita may affect fiber strength. Secondly,
studies have indicated that heat accumulation during the flowering period can also affect fiber
strength. Fiber strength was greatest in bolls that developed from flowers produced during the
first 4 to 6 weeks of flowering. Flowers that opened during the latter 2 weeks of the flowering
period produced bolls with the lowest fiber strength (Jones and Wells, 1997). Therefore, M.
incognita may reduce fiber strength by delaying cotton development and flowering.
Authors in a previous study have suggested several factors that could influence fiber
micronaire. Significant differences in micronaire among commercially available varieties have
8
been examined. A fiber thickens as cellulose is deposited inside the fiber cell, resulting in
increased micronaire values. If cotton photosynthesis is affected by M. incognita, as confirmed in
tomato plants (Loveys and Bird, 1973), the lack of carbohydrate production may lead to a lower
micronaire value. However, a micronaire value that is too high can also result in loss of profit. It
is important for cotton to produce sufficient bolls later in the season to either compete for
carbohydrates or to produce lower micronaire fiber, which can be blended with the higher
micronaire fiber to reduce overall readings (Silvertooth, 1999). Therefore, the reduced growth
and boll setting in cotton caused by M. incognita (Kirkpatrick et al., 1995; Walker et al., 1998)
may affect the blended micronaire value.
As discussed previously, water stress can be caused by M. incognita (Kirkpatrick et al.,
1991). In other studies, it has also been shown that water deficiency in cotton can affect some
cotton fiber properties. Moisture stress later in the season was found to reduce fiber length and
micronaire (Marani and Amirav, 1970). A reduction in fiber length due to water stress was also
observed in a later study. Although other characters were not consistently affected, the
distribution of bolls on cotton was consistently and significantly affected by irrigation (Pettigrew
2004).
Studies on the effect of M. incognita on nutrient concentrations in plants showed that a
change in concentration of nutrients is likely one of the first effects of the nematode on host
physiology. These changes in nutrient concentration alter host metabolism and contribute
directly or indirectly to the chlorosis and premature leaf abscission in soybean (Melakeberhan et
al., 1987). This is also true according to another study in soybean. The uptake of nitrogen,
phosphorus, and calcium was affected by M. incognita (Carneiro et al., 2002). Many nutrients
have effects on fiber quality. For example, leaf nitrogen during the boll maturation period had

9
significant positive correlations with fiber length and negative correlations with micronaire
(Reddy et al., 2004). Potassium is also a very important element in cotton and has positive
correlations with fiber length, micronaire, fiber strength, and fiber length-uniformity ratio
(Cassman et al., 1990).
Approaches to effective nematode control include crop rotation, field sanitation, cover
crops, varietal resistance, and nematicides. Nematode population densities can be reduced by
selecting rotation crops that are not hosts to M. incognita, or by planting resistant cultivars (Rich
and Kinloch, 2005). To date, no M. incognita-resistant cultivar is commercially available.
Several cotton cultivars have been reported to have some level of tolerance to the Fusarium
wilt/M. incognita disease complex. However, these cultivars do not show significant resistance
to the nematodes, although some are resistant to Fusarium wilt (Beltwide Cotton Committee,
2003). Biological approaches for nematode control have been studied but have not been
thoroughly explored in cotton production systems (Starr et al., 2007).
Chemical nematicides are widely used to control M. incognita. Three nematicide
management strategies are currently widely used in the U.S. (Koenning et al., 2004), including
the application of aldicarb at a rate of 0.8-1.2 kg/ha in the planting furrow; pre-plant soil
fumigation using either 1,3-dichloropropene or metam-sodium (Starr et al., 2007); and the
supplemental use of either aldicarb applied as a side-dress during the first third of the season or a
foliar application of the carbamate oxamyl (Lawrence and Mclean, 2000, 2002). Out of all these
strategies, at-planting application of aldicarb is perhaps the most universal nematicide strategy in
the U.S. Aldicarb is applied on 20 to 30% of the cotton hectarage each year (Koenning, et al.,
2004). In severely infested fields, nematicides can reduce the nematode population by more than
50% (Beltwide Cotton Committee, 2003). Using chemical nematicides can provide cotton with a

10
zone of protected soil in which roots can develop for 4 to 6 weeks with reduced damage from
nematodes. By protecting the crop during early development, yield losses can be reduced
substantially even though nematodes may penetrate the roots during the latter part of the season
(Beltwide Cotton Committee, 2003). Seed treatments that include nematicides have shown some
promising results in protecting emerging roots from nematode infection (Monfort et al., 2006),
but may not be sufficient in fields with high nematode population densities.
In Georgia, commonly used commercial practices are the application of the soil fumigant
Telone II (1,3 – dichloropropene) before planting and application of granular nematicides such as
Temik 15G (aldicarb). However, the cost of nematicides may cause growers to use them
sparingly in their production system (Ortiz et al., 2008). The seed treatments AVICTA Complete
Cotton [AVICTA (abamectin), Cruiser (thiomethoxam) and Dynasty CST (azoxystrobin,
fludioxonil and mefenoxam)] and AERIS Seed-Applied System (imidacloprid and thiodicarb)
were both reported to have nematicidal effects, and therefore have the potential of being
incorporated into M. incognita management strategies.
Like other soil-borne plant pathogens, M. incognita populations are present in the soil in
an aggregated pattern and the damage they cause often appears as patches in the field. This
aggregated distribution is affected primarily by the variability of soil properties. It has been
shown that out of 26 edaphic components including soil texture, acidity, pH, and others, 50% of
the variability in nematode density was related to high levels of clay, organic matter, low copper
concentration, and small changes in percent soil moisture (Noe and Barker, 1985).
To offer a more cost-effective tactic for use of nematicides on cotton, a management zone
strategy targeting areas with damaging nematode populations for treatment with nematicides has
been studied. The management zone strategy is based on the fact that M. incognita populations

11
are present in the soil in aggregated patterns due to the variability of soil texture in a field, as M.
incognita prefers coarse-textured, sandy soils. By using site-specific management (SSM) for
nematicides, higher, more expensive rates of nematicides can be applied selectively to zones that
potentially have higher nematode populations. A lower rate, or less expensive nematicides, can
be targeted for low nematode risk zones. Hopefully, the efficacy of control of nematodes can be
improved and expenses can be reduced.
In 2001, a strong correlation between Columbia lance nematode (Hoplolaimus columbus)
densities and sand content was observed from electrical conductivity data that was used to map
within-field spatial distribution of soil texture (Khalilian et al., 2001). This indicated promise for
application of SSM against Columbia lance nematodes. In recent years, SSM has also been
studied with M. incognita in cotton fields. The data indicated that edaphic features can be used as
indirect indicators of high-risk, nematode-prone areas (Ortiz et al, 2006). In 2007, it was found
that different nematicide rates had significantly different effects on cotton yields within different
risk zones (Ortiz et al., 2008). These findings supported the strategy of variable-rate nematicide
applications based on M. incognita risk management zones. The goal of using SSM in this study
was to determine whether cotton fiber quality may also respond differently to nematicide
applications in different management zones.
The objectives of the research presented in this thesis were to: (1) Determine the extent to
which M. incognita causes physiological damage in cotton, based upon levels of M. incognita
inoculum density and cotton varieties. (2) Examine the influence of M. incognita on cotton
growth, yield, and fiber quality and the effect of the SSM strategy for managing cotton yield and
fiber quality. And (3) determine the effects of M. incognita on growth, yield, fiber quality, and

12
economics of altered fiber quality as related to choice of variety. The methods and results will
be presented in three different chapters.
In Chapter 2, the stress in cotton caused by M. incognita was quantified in three
greenhouse trials. Different nematode levels were created by infesting soil with different
quantities of M. incognita eggs. Several physiological variables presumed to be related to cotton
fiber development were measured. This portion of the thesis research was conducted because of
the difficulties in measuring such characters in field studies, and because it was easier to
manipulate the nematode populations in the greenhouse.
In Chapter 3, the methods and results from three field trials in the 2008 and again in 2009
seasons are presented. For these trials, the field sites were delineated into two risk management
zones based on several soil properties, as southern M. incognita maybe present in a field in a
certain pattern with preference for coarse-textured, sandy soils (Noe and Barker, 1985; Starr et
al., 1993; Koenning et al., 2004; Monfort et al., 2007). Some soil properties have been shown to
be related to the presence or absence of M. incognita. These properties include fertility (Noe and
Barker, 1985), pH (Melakeberhan et al., 2004), and moisture (Wheeler et al., 1991). Different
nematicide and seed treatments were applied in the two risk management zones. Plant growth,
root damage, nematode populations and reproduction, cotton yield, and fiber quality were
measured throughout the growing seasons and after harvest. Differences in fiber properties
among treatments and between zones are demonstrated in this chapter, as well as the correlation
of nematode populations and disease severity with fiber properties. Principal component analysis
was used to determine the factors which contribute most to the alteration of fiber properties.
In Chapter 4, field studies from two additional field sites are presented. At these two field
sites, the site-specific management strategy was not applied. Treatments included fumigant,

13
granular in-furrow and seed treatment nematicides, and two cotton varieties with different levels
of M. incognita resistance. Cotton growth, root damage, nematode population and reproduction,
cotton yield, and fiber quality were measured in these fields. The results as related to lint yield
and fiber properties. The relationships between M. incognita population density, cotton yield,
and fiber quality are also discussed. The economic value of fiber quality with different
nematicides, different risk management zones, and different cotton varieties is analyzed and
discussed in this chapter.
1.1 References
Basra, A. S., ed. 1999. Cotton fibers: Developmental biology, quality improvement, and textile processing. Food Products Press/The Haworth Press, Binghamton, New York. Beltwide Cotton Nematode Survey and Education Committee. 2003. Cotton nematodes, your hidden enemies. National Cotton Council of America, Memphis, TN and Research Triangle Park, NC. Bird, A. F. 1970. The effect of nitrogen deficiency on the growth of Meloidogyne javanica at different population levels. Nematologica 16:13-21. Bird, A. F., and Loveys, R. R. 1975. The incorporation of photosynthates by Meloidogyne javanica. J. Nematol. 7:111-113. Bradow, J. M., and Davidonis, G. H. 2000. Quantification of fiber quality and the cotton production-processing interface: a physiologist perspective. Journal of Cotton Science 4: 34-64. Bridge, J., and Page, S. L. J. 1980. Estimation of M. incognita infestation levels on roots using a rating chart. Trop. Pest Manage. 26:296-298. Brueske, C . H., and Bergeson, G. B. 1972. Investigation of growth hormones in xylem exudate and root tissue of tomato infected with M. incognita. Journal of Experimental Botany 23:14-22. Carneiro, R. G., Mazzafera, P., Ferra, L. C. C. B., Muraoka, T., and Trivelin, P. C. O. 2002. Uptake and translocation of nitrogen, phosphorus and calcium in soybean infected with Meloidogyne incognita and M. javanica. Fitopatol. Bras. 27(2): 141-150. Cassman, K. G., Kerby, T. A., Roberts, B. A., Bryant, D. C., and Higashi, S. L. 1990. Potassium nutrition effects on lint yield and fiber quality of acala cotton. Crop Science 30:672-677.

14
Cotton Disease Loss Estimate Committee. 2008. Cotton disease loss committee report. Pages 294-297 in: Proceedings of the Beltwide Cotton Conference, Nashville, TN, 8-11 January 2008. Delanghe, E. A. L. 1986. Lint development. Cotton physiology. The Cotton Foundation, Memphis, TN. Grimes, D. W., and Yamada, H. 1982. Relation of cotton growth and yield to minimum leaf water potential. Crop Science 22:134-139. Haseeb, A., Srivastava, N. K., and Pandey, R. 1990. The influence of Meloidogyne incognita on growth, physiology, nutrient concentration and alkaloid yield of Hyoscyamus niger. Nematol. Medit. 18: 127-129. Hearn, A. B. 1976. Response of cotton to nitrogen and water in a tropical environment. III. Fiber quality. Journal of Agricultural Science 37: 826-832. Hearn, A. B., 1994. The principles of cotton water relations and their application in management. Pages 66-92 in: Challenging the future. G.A. Constable and N.W. Forrester, eds. Proc. World Cotton Conf.-1, Brisbane, Australia. Jones, M. A., and Wells, R. 1997. Field yield and quality of cotton grown at two divergent population densities. Crop Science 37: 1190-1195. Khalilian, A., Mueller, J. D., Blackville, S. C., Han, Y. J., and Wolak, F. J. 2001. Predicting cotton nematodes distribution utilizing soil electrical conductivity. Pages 146-149 in: Proc. 2001 Beltwide Cotton Conference. Memphis, TN. Kirkpatrick, T. L., and Sasser, J. N. 1984. Crop rotation and races of Meloidogyne incognita in cotton root-knot management. Journal of Nematology 16:323-328. Kirkpatrick, T. L., Oosterhuis, D. M., and Wullschleger, S. D. 1991. Interaction of Meloidogyne incognita and water stress in two cotton cultivars. Journal of Nematology 23(4): 462-467. Kirkpatrick, T. L., van Iersel, M. W., and Oosterhuis, D. M. 1995. Influence of Meloidogyne incognita on the water relations of cotton growth in microplots. J. Nematol. 27: 465-471. Koenning, S. R., Kirkpatrick, T. L., Starr, J. L., Wrather, J. A., Walker, N. R., and Mueller, J. D. 2004. Plant-parasitic nematodes attacking cotton in the United States. Plant Disease 88(2): 100-113. Lawrence, G. W., and McLean, K. S. 2000. Effect of foliar applications of oxamyl with aldicarb for the management of Rotylenchulus reniformis on cotton. Supplement to the Journal of Nematology 32:542-549. Lawrence, G. W., and McLean, K. S. 2002. Foliar applications of oxamyl with aldicarb for the management of Meloidogyne incognita on cotton. Nematropica 32:103-112.

15
Loveys, B. R., and Bird, A. F. 1973. The influence of nematodes on photosynthesis in tomato plants. Physiological Plant Pathology 3: 525-529. Marani, A., and Amirav, A. 1971. Effects of soil moisture stress on two varieties of upland cotton in Israel: I. The coastal plain region. Exp. Agric. 7: 213-224. McClure, M.A. 1977. Meloidogyne incognita: A metabolic sink. J. Nematol. 9: 88-90. Melakeberhan, H., Webster, J. M., Brooke, R. C., D'Auria, J. M., and Cackette, M. 1987. Effect of Meloidogyne incognita on plant nutrient concentration and its influence on the physiology of beans. Journal of Nematology 19(3): 324-330. Melakeberhan, H., Dey, J., Baligar, V. C., and Carter, T. E. Jr. 2004. Effect of soil pH on the pathogenesis of Heterodera glycines and Meloidogyne incognita on Glycine max genotypes. Nematology 6: 585-592. Mitchell, D. M. and Robinson, J. R. C. 2009. Structural changes in U.S. cotton supply and demand relationships. Pages 238-294 in: Proceedings of the Beltwide Cotton Conferences, San Antonio, TX, 5-8 January 2009. Monfort, W. S., Kirkpatrick, T. L., Long, D. L., and Rideout, S. 2006. Efficacy of a novel nematicidal seed treatment against Meloidogyne incognita on cotton. Journal of Nematology 38:245-249. Monfort, W. S., Kirkpatrick, T. L., Rothrock, C. S., and Mauromoustakos, A. 2007. Potential for site-specific management of Meloidogyne incognita in cotton using soil textural zones. J. Nematol. 39: 1-8. Mulrean, E. N. 1984. Effect of Phymatotrichum root rot on yield and seed and lint quality in Gossypium hirsutum and G. barbadense. Plant Disease 68(5):381-383. Noe, J. P. and Barker, K. R. 1985. Relation of within-field spatial variation of plant-parasitic nematode population densities and edaphic factors. Phytopathology 75:246-252. Ortiz, B. V., Sullivan, D. G., Perry, C., and Vellidis, G. 2006. Geospatial solutions for precision management of cotton root knot nematodes. ASABE Meeting Presentation. Paper number: 061147. Ortiz, B. V., Perry, C., Sullivan, D. G., Kemerait, B., Ziehl, A., Davis, R., Vellidis, G., and Rucker, K. 2008. Cotton yield response to variable rate nematicides according to risk zones. ASABE Meeting Presentation. Paper number: 081026. Pettigrew, W. T. 2001 Environmental effects on cotton fiber carbohydrate concentration and quality. Crop Science 41:1108-1113.

16
Pettigrew, W. T. 2004. Moisture deficit effects on cotton lint yield, yield components, and boll distribution. Agron. J. 96: 377-383. Powell, N. T. 1971. Interactions between nematodes and fungi in disease complexes. Annual Review of Phytopathology 9:253-273. Reddy, K. R., Koti, S., Davidonis, G. H., and Reddy, V. R. 2004. Interactive effects of carbon dioxide and nitrogen nutrition on cotton growth, development, yield, and fiber quality. Agron. J. 96:1148-1157 Rich, J. R., and Kinloch, R. A. 2005. Cotton nematode management. ENY-004(NG015), Florida Cooperative Extension Service, Institute of Food and Agricultural Science, University of Florida, Gainesville. Roberts, P. M., Bednarz, C., and Greene, J. 2005. Impact of boll feeding bugs on lint yield and fiber quality, Pages 1718-1724 in: Proc. 2005 Beltwide Cotton Conf., National Cotton Council, Memphis, TN. Shimishi, D., and Marani, A. 1971. Effects of soil moisture stress on two varieties of upland cotton in Israel. II. The northern Negev region. Exp. Agric. 7: 225-239. Silvertooth, J. C. 1999. Fiber quality issues and management. Univ. of Arizona Agricultural Extension Service, Tucson, AZ. Snipes, C. E., and Baskin, C. C. 1994 Influence of early defoliation on cotton yield, seed quality, and fiber properties. Field Crops Research 37:137-143. Starr, J. L., Heald, C. M., Robinson, A. F., Smith, R. G., and Krausz, J. P. 1993. Meloidogyne incognita and Rotylenchulus reniformis and associated soil textures from some cotton production areas of Texas. J. Nematol. 25: S895-899. Starr, J. L., Koenning, S. R., Kirkpatrick, T. L., Robinson, A. F., Roberts, P. A., and Nichols, R. L. 2007. The future of nematode management in cotton. Journal of Nematology 39(4):283-294. Thomas, S. H., and Kirkpatrick, T. L. 2001. Root-knot nematode. Pages 40-42 in: Compendium of Cotton Diseases, 2nd ed. T. L. Kirkpatrick and C. S. Rothrock, eds. American Phytopathological Society, St. Paul, MN. USDA. 2001. The classification of cotton. Agricultural Marketing Service, Washington, D.C. Walker, N. R., Kirkpatrick, T. L., and Rothrock, C. S. 1998. Interaction between Meloydogyne incognita and Thielaviopsis basicola on cotton (Gossypium hirsutum). J. Nematol. 30: 415-422. Wheeler, T. A., Barker, K. R., and Schneider, S. M. 1991. Yield-loss models for tobacco infected with Meloidogyne incognita as affected by soil-moisture. J. Nematol. 23: 365-371.

17
CHAPTER 2
EFFECT OF SOUTHERN ROOT KNOT NEMATODE (MELOIDOGYNE INCOGNITA)
ON COTTON GROWTH AND PHYSIOLOGY IN THE GREENHOUSE1
1 Lu, P., Kemerait, R. C., Jr., and Scherm, H. To be submitted to Journal of Nematology.

18
2.1 Abstract
To quantify the stress in cotton (Gossypium hirsutum L.) caused by southern root knot
nematode [Meloidogine incognita (Kofoid & White) Chitwood], three greenhouse trials were
conducted in 2008 and 2009. Soil planted to cotton was infested with two population densities of
eggs of M. incognita. Cotton growth and several physiological variables thought to be related to
cotton fiber development were examined. FiberMax 960BR and Stoneville 5599BR varieties
were used in all three trials; breeding lines PD94042 and 120B1R1 were used in trials 2 and 3. In
all three trials vegetative and reproductive growth, chlorophyll content, leaf expansion, plant
weight, and photosynthetic rate were significantly reduced by M. incognita infection. Stoneville
5599BR had higher levels of tolerance and resistance to M. incognita infection compared with
FiberMax 960BR, as documented by root gall ratings and nematode egg counts. Breeding line
120R1B1 had significant resistance to M. incognita in greenhouse trials.
Keywords: Cotton breeding lines, Meloidogyne incognita, Photosynthetic rate, Physiology, Southern root knot nematode

19
2.2 Introduction
Cotton is an oilseed and fiber crop. It is grown in more than seventy countries and is the
single most important fiber crop worldwide. No crop competes with it in the potential of value-
added processing (Basra, 1999). Cotton is also one of the oldest cultivated crops. It has been
associated with human activity since before recorded history.
The U.S. is the third-largest producer of cotton in the world. Cotton production in the U.S.
has increased 66% in the past 40 years. In recent years, the U.S. has produced about 20 percent
of the world's annual supply (Mitchell, 2009).
Root knot nematodes occur worldwide and attack a diversity of crops. They cause
considerable losses of yield and affect the quality of the products, either by directly damaging
plants (Kirkpatrick and Sasser, 1984), or by predisposing them to infection by fungal and
bacterial pathogens (Powell, 1971).
The southern root knot nematode [Meloidogyne incognita (Kofoid & White) Chitwood]
is found in all cotton production regions in the U.S. and is the most widely distributed nematode
parasite of economic importance to the crop (Thomas and Kirkpatrick, 2001). It is considered the
major yield-limiting plant-parasitic nematode across the U.S. Cotton Belt; approximately twice
as much yield loss is attributed to M. incognita than to all other nematode parasites of the crop
(Koenning et al., 2004). The estimated yield loss of cotton caused by M. incognita in the U.S.
was 2.4% in 2007, which was greater than for any other cotton disease. This damage resulted in a
loss of more than 106,000,000 kg of lint (Cotton Disease Loss Committee, 2008). In Georgia in
2007, M. incognita caused an estimated 6% reduction in yield resulting in a loss of 25,000,000
kg of lint (Cotton Disease Loss Committee, 2008).

20
Damage caused by plant-parasitic nematodes is distinct from other plant diseases because
there are no unique symptoms on the above-ground portions of the plants. Nematodes are often
unevenly distributed in the soil; therefore the symptoms associated with damage from nematodes
may occur in irregular patches in the field (Beltwide Cotton Committee, 2003). These patches
can be either small and limited in number, or large and widely distributed. Damaged plants may
exhibit symptoms ranging from mild to severe stunting, depending on disease severity, and a
reduced rate of development. Foliage may also show symptoms of nutrient deficiency
(Kirkpatrick et al. 1995). In the most severe cases, plants may die before maturation. The
nematodes also interact with the Fusarium wilt pathogen (Fusarium oxysporum f.sp.
vasinfectum), which leads to wilting and brown discoloration or necrosis of the vascular tissue of
the lower stem (Beltwide Cotton Committee, 2003).
Below-ground symptoms caused by M. incognita on cotton can be much more diagnostic
than above-ground symptoms. Visible galls or “knots” often appear on cotton roots (Bridge and
Page, 1980). Swellings of the infected root tissue can be found on the cotton tap root and the
lateral roots; however, the galls on cotton may not be as easy to observe as those on vegetables
such as tomatoes. Galls are easier to detect if cotton plants are carefully dug (not pulled) from the
soil. Also, the fine lateral roots need to be carefully handled when rinsed with water to remove
soil (Beltwide Cotton Committee, 2003).
The tap root and its lateral roots are of vital importance to the cotton plant. A few galls on
these roots can disrupt the normal flow of water and nutrients to the leaves and developing bolls,
which can significantly reduce cotton yield (Bird and Loveys, 1975; Kirkpatrick et al., 1991;
McClure, 1977).

21
It has been shown that plant growth can be significantly reduced by a heavy infection
with M. incognita (Bird, 1970). Above-ground symptoms of M. incognita infection are
nondescript, but include suppressed plant growth (stunting), nutritional deficiency (chlorosis),
and temporary wilting during the heat of the day (Beltwide Cotton Committee, 2003). Most
damage to the cotton plant caused by M. incognita results from physiological changes caused by
nematodes feeding on root tissues. Reduced plant growth and leaf expansion as a result of
infection by M. incognita have been documented (Kirkpatrick et al., 1995). Infection by M.
incognita has also reduced the number and size of cotton bolls and plant dry weight (Walker et
al., 1998). Anatomically, M. incognita affects cotton roots by disrupting the xylem as well as
changing root epidermis and cortical tissues in response to giant-cell development and gall
formation.
Although M. incognita-resistant cotton cultivars are not commercially available, there are
cotton varieties that have partial resistance or tolerance, such as certain Stoneville varieties.
Tolerance implies that the cultivar can yield well in the presence of the nematode, but does not
necessarily suppress the reproduction of the nematode. Partial resistance indicates some
reduction in nematode reproduction occurs on a cultivar (Wheeler et al., 2009). FiberMax
varieties, although reported to be highly susceptible to damage from root knot nematode, are
thought to produce a superior fiber quality and outrank other cultivars in fiber length and
strength. FiberMax is reported to have fewer gin discounts for quality, which can bring more
value to the growers.
Research has shown that infection by M. incognita can reduce photosynthetic rates in
different plants. Within 2 days of M. incognita infection, differences between photosynthetic
rates in control and test tomato plants occurred (Loveys and Bird, 1973). This seemed to be a

22
physiological response rather than a morphological one. However, after 22 days, morphological
differences had become important in determining the CO2-fixing capacity of the whole plant. It
has been suggested that during early stages of infection, the decreased photosynthesis was highly
significant when expressed on the basis of fresh weight, leaf area, or total chlorophyll content
(Loveys and Bird, 1973). This physiological response may have resulted from a reduced supply
of root-derived photosynthesis-regulating factors. For example, both cytokinins and gibberellins
in tomato root tissue and xylem exudates were decreased in plants infected with M. incognita
compared with control plants (Brueske and Bergeson, 1972). During late stages of the infection,
the reduced rate of photosynthesis was at least partly due to the smaller size of infected plants
(Loveys and Bird, 1973).
It has also been discovered that M. incognita infection suppressed plant growth, reduced
yield, chlorophyll content, photosynthetic rate, and nutrient concentrations in Henbane
(Hyoscyamus niger). The greatest reduction in these variables was observed when plants were
inoculated with the highest nematode population (Haseeb et al., 1990).
Studies on the effect of M. incognita on nutrient concentrations in plants documented that
a change in concentration of the nutrients in the plant is likely one of the first effects of the
nematode on host physiology. These changes in nutrient concentration alter host metabolism and
contribute directly or indirectly to the chlorosis and premature leaf abscission in soybean
(Melakeberhan et al., 1987). This is also true according to another study in soybean. The uptake
of nitrogen, phosphorus, and calcium was affected by M. incognita (Carneiro et al., 2002).
The objective of this chapter was to (1) further study damage of M. incognita in cotton to
determine the degree to which growth and physiological variables were both affected negatively

23
by nematode infection; and (2) examine whether the damage caused by M. incognita was similar
in different cotton cultivars that had different levels of resistance or tolerance.
2.3 Materials and Methods
Three greenhouse trials were conducted in Athens, GA, to document the effect of M.
incognita on cotton growth and several physiological variables thought to be related to fiber
development, including chlorophyll content, chlorophyll fluorescence, and photosynthetic rate.
The three trials were conducted in spring 2008, fall 2008, and spring 2009. Each trial lasted 75 to
80 days from planting to destructive sampling.
Two cotton cultivars were used in the first trial, including FiberMax 960 BR, which is
susceptible to M. incognita and Stoneville 5599 BR, which was developed from partially
resistant cultivar ST LA887, and is considered to have both tolerance (Barfield, 2003) and partial
resistance (Phipps and Eisenback, 2005) to M. incognita. Tolerance implies that the cultivar can
yield well in the presence of the nematode, but does not necessarily suppress the reproduction of
the nematode. Partial resistance indicates that some reduction in nematode reproduction occurs
on a cultivar (Wheeler et al., 2009). FiberMax cultivars, though reported to be highly susceptible
to damage from root knot nematodes, are thought to produce a superior fiber quality and outrank
other cultivars in fiber length and strength. FiberMax is reported to have fewer gin discounts for
quality, which can bring more value to the growers.
In trial 2 and trial 3, two cotton breeding lines were also used in addition to the two
varieties included in trial 1. The two breeding lines were from a breeding program at the
University of Georgia. One was PD94042, an upland cotton line with high yield and fiber quality
(May, 1999) but no documented resistance to M. incognita. The other one was an unregistered

24
line 120B1R1, which was a cross between PD94042 and M-120 RNR, with PD94042 as the
recurrent parent in a back-cross sequence. Breeding line M-120 RNR was derived from
germplasm line Auburn 634 RNR, which has exceptionally high resistance to M. incognita and
Fusarium wilt (Shepherd, 1982).
All cultivars were planted in clay plots with a diameter of 15.2 cm, and were placed on
the same bench in the greenhouse. The medium used for greenhouse trials was a mixed soil,
including 87.6% sand, 8.4% silt and 4% clay. At 10 days after planting, all plants were
inoculated with M. incognita eggs in three different population densities. The eggs used for
inoculation were extracted from M. incognita-infected roots of eggplants, which were cultured in
the greenhouse previously. The three nematode densities that were applied included 0, 6,000 and
20,000 eggs per pot.
The experimental design used for the greenhouse trials was a split-plot design, with egg
density being the main plot and cultivar being the sub-plot. In trials 2 and 3, the two breeding
lines were tested as a separate set from the two commercial varieties, and the data were analyzed
separately. There were 11 replications for trial 1 and 10 replications for trials 2 and 3. The plants
were watered twice a day and fertilized once a week. The fertilizer contained 20% nitrogen, 20%
phosphorus and 20% potassium. Half the normal amount of fertilizer, which was 30 mL fertilizer
mixed with 18.9 L (5 gallons) water, was applied, as symptoms caused by nematodes are best
shown in plants under stressed conditions. A final volume of 250 mL diluted fertilizer was
applied to each plant. A mixture of the insecticides Merit (imidacloprid) and Enstar (s-kinoprene)
was sprayed every week to control whiteflies. Each insecticide was applied at 0.65 mL/L (1/2
teaspoon/gallon) of water. For mite control, several materials were rotated every week, including
Avid (abamectin) at 1.3 mL/L (1 teaspoon/gal), Floramite (bifenazate) at 1.3 mL/L (1

25
teaspoon/gal), and a mix of Orthene (acephate) 1.3 mL/L (1 teaspoon/gal), Telstar (bifenthrin)
1.3 ml/L (1 teaspoon/gal), and Enstar (s-kinoprene) 0.65 mL/L (1/2 teaspoon/gal).
Several measurements were collected weekly to record plant growth, including shoot
heights, number of nodes, and height-to-node ratios. Shoot height was measured from the surface
of the soil to the terminal bud. The number of nodes was determined by counting all nodes on the
main stem except the cotyledonary nodes as long as the leaf associated with the node was bigger
than a U.S. quarter coin. Height-to-node ratio is calculated as the shoot height divided by number
of nodes. M. incognita infection could potentially reduce the elongation of plants (stunting);
therefore height-to-node ratio can be used as an indicator of the stress in cotton caused by
nematodes. Increased height-to-node ratios could indicate that lower stress occurred in plants.
The chlorophyll content was measured using a Minolta SPAD-502 chlorophyll meter (Spectrum
Technologies, Plainfield, IL), on the uppermost fully expanded leaf several times and the average
number was recorded. The chlorophyll content was measured in the uppermost fully expanded
leaves because these are usually the most active leaves on the plants. Also it is the easiest way to
identify leaves with the same age in different plants. Chlorophyll fluorescence was measured in
the evenings after the plants had been in the dark for at least 30 min. A pulse-amplitude
modulation fluorometer (Heinz Walz GmbH, Effeltrich, Germany) was used to measure
chlorophyll fluorescence on the uppermost fully expanded leaf.
All three variables, which were measured weekly, were transformed into areas under the
variable progress curves using the trapezoidal method, which is the most commonly used method
for estimating the area under the disease progress curve (AUDPC) (Madden et al., 2007). The
formula used to calculate areas under progress curve in this study was the same as the formula
for area under disease progress curves, which is ( )∑−
=
++
−
+=
1
1
11
2AUDPC
n
i
iiii
ttyy
. Here, t is

26
time in days after inoculation for each measurement, y is the reading of the variable that was
measured, and n is the number of readings. The areas under the progress curve from each
treatment were then analyzed using ANOVA and LSD tests in SAS PROC GLM (SAS Institute,
Cary, NC).
At 75 to 80 days after planting, all cotton plants were destructively sampled for further
measurements. Immediately prior to destructive sampling, photosynthetic rate was measured,
using a CIRAS-1 portable photosynthesis measuring system (PP Systems, Amesbury, MA).
Along with photosynthetic rate, stomatal conductance, leaf temperature, and sub-stomatal CO2
concentration were also measured by CIRAS-1 at the same time. This measurement was obtained
on the uppermost fully expanded leaf. After collecting the photosynthetic rate measurement, the
plant tops were cut from the soil line, and the following measurements were taken: (1) Plant
weight. The fresh weight of plant tops was measured immediately after destructive sampling.
After all other measurements for the tops were completed; shoots were packed into paper bags
and dried in an oven at 60˚C for 3 days. Thereafter, dry weight was also measured. (2) Leaf area.
Total leaf area was measured by stripping leaves from the plants and feeding them through a LI-
3100 Area Meter (LI-COR Biosciences, Lincoln, NE) (3) Number and weight of bolls. The
number of cotton squares and bolls was collected and counted together as the number of bolls
and their fresh weight and dry weight were also measured together as boll fresh weight and dry
weight. (4) Root fresh weight. Cotton roots were washed thoroughly from soil and the fresh
weight was then measured. Dry weight was not measured as this would interfere with further
analysis for nematode damage. (5) Root gall rating. The galling severity for each root system
was rated on a 0 to 5 scale for the greenhouse trials: 0 = no galling, 1 = trace infection with a few
small galls, 2 = galling evident on <25% of the roots, 3 = 25 to 50%, 4 = 50 to 75% and 5

27
= >75% of the roots galled (Kinloch, 1990). (6) Egg counts. As a final processing step, nematode
eggs produced on cotton roots were extracted with 0.625% NaOCl for 3 min (Hussey and Barker,
1973) and counted microscopically.
2.4 Results
2.4.1 Meloidogyne incognita infection and reproduction
In most cases, inoculation with M. incognita resulted in a significant increase in root gall
ratings and egg counts per gram of root compared with the untreated control. However, the
difference between mid and high nematode inoculation levels was usually not significant (Tables
2.1 and 2.2).
There was a significant variety effect on gall ratings and egg counts. FiberMax 960BR
had significantly higher gall ratings and egg counts than Stoneville 5599BR in all three trials
(Table 2.1). In most cases, FiberMax 960BR had approximately twice the gall rating and egg
counts as Stoneville 5599BR. In trial 2, there were interactions between nematode population
and variety in these measurements. The difference between plants grown in non-infested soil and
plants grown in infested soil was more significant in FiberMax 960BR than in Stoneville
5599BR. The resistant breeding line 120R1B1 had root gall ratings and root necrosis ratings that
were approximately half of the same ratings in breeding line PD94042 (Table 2.2). The egg
counts per gram of root in 120R1B1 were only 1/14 of that observed in PD94042 in trial 2 and
about 1/22 of that in PD94042 in trial 3.

28
2.4.2 Areas under the progress curves
Stunted growth is a common symptom caused by M. incognita in many crops. This also
proved to be true in the greenhouse tests in this study. The area under the height-to-node ratio
curve was significantly reduced with increased nematode populations, especially with the higher
inoculation level (Tables 2.3 and 2.4). The area under the chlorophyll content progress curve was
also reduced by M. incognita inoculation. The high level of nematode infestation typically
resulted in significantly less chlorophyll content, but not in trial 2. M. incognita infestation
generally had much less effect on the areas under the chlorophyll fluorescence progress curve.
Although there was a numerical reduction in the chlorophyll fluorescence of commercial
varieties, M. incognita infection only significantly reduced chlorophyll fluorescence in trial 3.
Comparing the two cotton varieties, Stoneville 5599BR consistently had a higher area
under the height-to-node ratio progress curve than FiberMax 960BR, but had a smaller area
under the chlorophyll content progress curve than FiberMax 960BR. The difference between
varieties in area under the chlorophyll fluorescence progress curve was usually not significant,
and was not consistent in different trials. In the two breeding lines, areas under the height-to-
node ratio, chlorophyll content, and chlorophyll fluorescence progress curves were all higher in
PD94042 in one trial, but the reverse was true in the other trial. There were no interactions
between varieties and nematode inoculation levels or between breeding lines and nematode
inoculation levels for any of these variables.
2.4.3 Cotton biomass
Cotton biomass, measured as shoot fresh weight, shoot dry weight, root weight, and total
leaf area at 75 to 80 days after inoculation, showed significant reduction with M. incognita

29
inoculation in one or more trials (Tables 2.5 and 2.6). For the two commercial varieties, the
reduction of biomass with the high level of nematode inoculation was significantly greater than
the reduction of biomass with the mid-level of nematode inoculation, with the exception of root
weight in trial 3. There were no statistical interactions between varieties and nematode
inoculation levels on any of these variables, which indicated that the damage level caused in the
two varieties by M. incognita was similar. In the two breeding lines, root weight was only
significantly reduced in PD94042 in trial 3 (Table 2.6). Dry weight was significantly reduced in
both breeding lines in both trials when comparing plants grown in inoculated with non-
inoculated soils. Leaf area was also significantly reduced except for 120R1B1 in trial 3.
Cotton reproductive growth, measured as boll number and boll dry weight, was
significantly reduced when soil was infested with nematodes. In commercial varieties (Table 2.5),
the high level of soil inoculation usually resulted in the least boll number and dry weight.
However, in the breeding lines (Table 2.6), there was no significant difference between the mid
and the high levels of nematode inoculation relative to cotton reproductive growth.
The differences between the two commercial varieties were often statistically significant,
although the difference in dry weight of the shoots was not consistent. Generally, Stoneville
5599BR had significantly higher biomass than FiberMax 960BR in terms of both vegetative and
reproductive growth (Table 2.5). There was no difference between PD94042 and 120R1B1 in
cotton biomass in trial 2 and reproductive growth in trial 3 (Table 2.6). In trial 3, 120R1B1 had a
greater vegetative growth than PD94042.

30
2.4.5 Photosynthesis
The photosynthetic rate (PN) was significantly reduced with increased nematode
inoculum level in some trials and showed a numeric reduction in the others (Tables 2.7 and 2.8).
There was no reduction in photosynthetic rate between commercial varieties in trial 3 with
increasing populations of M. incognita. An interaction between cotton breeding lines and
nematode inoculation levels occurred in trial 2. In this trial, PD94042 demonstrated a significant
reduction in photosynthetic rate with increasing populations of M. incognita; however, 120R1B1
did not. Other characteristics, to include transpiration rate, stomatal conductance, leaf
temperature, and sub-stomatal CO2 concentration, showed similar trends, although these trends
were not always significant. The transpiration rate and stomatal conductance showed trends of
reduction with increased populations of M. incgonita. An exception to this was observed for the
breeding lines in trial 2. Measurements of leaf temperature tended to increase with the exception
of breeding lines in trial 2. The trends of sub-stomatal CO2 concentrations versus population of
M. incognita were not consistent in different trials, but did significantly increase for commercial
varieties in trial 1.
There were no significant differences between FiberMax 960BR and Stoneville 5599BR
in any trials for any photosynthesis-related variables (Table 2.7). Breeding line 120R1B1 had a
significantly higher transpiration rate, stomatal conductance, and sub-stomatal CO2 concentration
than PD94042 in trial 2 (Table 2.8). However, this difference was not seen in trial 3.
2.5 Discussion
In this study, infestation of soil with eggs of M. incognita resulted in significantly higher
nematode infection levels in cotton plants, measured as higher root gall ratings and egg counts

31
compared with the non-infested check. However, the differences in plant measurements between
mid and high levels of infestation were usually not significant. This could be an indication that
infection by M. incognitas on cotton roots was saturated, or nearly saturated, at an infestation
level of 6,000 eggs/pot. The egg count data from this study offered further proof that Stoneville
5599BR has some resistance to M. incognita because nematode reproduction was suppressed at
some level. The resistant breeding line 120R1B1 had significantly higher resistance to M.
incognita than PD94042 because M. incognita reproduction was suppressed 10 to 20 times
relative to that on PD94042. The gall ratings and egg counts were not significantly different
between the two cotton varieties and between two breeding lines. In some cases, susceptible
cultivars FiberMax 960BR and PD94042 resulted in much higher nematode infection than
Stoneville 5599BR or 120R1B1 as measured by root gall ratings and egg counts. This confirmed
that in susceptible cultivars, southern root-knot nematode can cause more root damage and attain
higher levels of reproduction.
It has been suggested that the development of cotton nodes is not influenced by stress
before boll set, while plant height is highly influenced by various stresses (Albers, 1993).
Therefore the height-to-node ratio is an indicator of the amount of stress that a cotton plant has
encountered. Higher height-to-node ratios can indicate that lower stress has occurred in the
plants. In all greenhouse trials, M. incognita caused a significant amount of stress in cotton plants,
reflected as significant reductions in height-to-node ratios. This stress increased significantly as
nematode population increased.
In all trials, Stoneville 5599BR was less stressed by M. incognita than FiberMax 960BR,
because it had significantly better growth than FiberMax 960BR, which proved that Stoneville
5599BR had a better tolerance to M. incognita than FiberMax 960BR. Breeding line 120R1B1

32
appeared to be more stressed by M. incognita infection than PD94042 in trial 2 and trial 3
because it usually had a significantly lower height-to-node ratio. However, because 120R1B1
had much less nematode infection than PD94042, the difference in height-to-node ratio is likely
due to their genetic difference rather than the influence of M. incognita.
The measurement of leaf chlorophyll content provides a measure of photosynthetic
capacity related to the nitrogen concentration in the plants (Evans, 1989). As discussed
previously, M. incognita can stress plants by interfering with water and nutrient transportation
(Kirkpatrick et al., 1991; Melakeberhan et al., 1987; Carneiro et al., 2002). Therefore, because
chlorophyll content is affected by nitrogen concentration, it was both an indicator of the damage
caused by M. incognita and an indication of such on photosynthetic activity in the cotton plant.
The results from this study showed that infection by M. incognita was associated with reduced
chlorophyll content in cotton leaves. There was little change in chlorophyll content in plants
based upon the mid- and higher infestation levels of M. incognita.
Chlorophyll fluorescence is a measure of the excess energy of plants re-emitted as light.
It reflects the efficiency of photochemistry and heat dissipation (Maxwell and Johnson, 2000).
Therefore the chlorophyll fluorescence signal can be used as an intrinsic probe of photosynthetic
function. In this study, chlorophyll fluorescence was only reduced in some trials and the
reductions were not always statistically significant. Therefore, the photosynthetic function in
cotton may not be affected consistently by M. incognita.
Both chlorophyll content and chlorophyll fluoresce responded similarly to levels M.
incognita inoculation in different varieties and breeding lines. This indicates that M. incognita
had a similar effect on FiberMax 960BR and Stoneville 5599BR, and on breeding lines PD94042
and 120R1B1. The higher chlorophyll content in FiberMax 960BR may be due to genetic

33
differences rather than the effect of M. incognita, because in previous results, nematode infection
reduced chlorophyll content in cotton. Also, Stoneville 5599BR was supposed to have a better
tolerance to M. incognita than FiberMax 960BR. Chlorophyll content did not differ significantly
between the two cotton breeding lines, further confirming that this character was genetic because
PD94042 was the recurrent parent of 120R1B1 in a back-cross sequence. These two breeding
lines should have similar genetic characters.
Cotton biomass at approximately 65 days after inoculation was significantly reduced
when M. incognita infected cotton roots in both varieties and both breeding lines. This indicated
that M. incognita may have interfered with the cotton photosynthetic process, and caused
damage in plant growth which led to less biomass. In many cases, root weight was not as
significantly reduced as other characters.
Previous literature has shown that M. incognita infection can reduce cotton yield (Ortiz et
al., 2008). In this study, it was confirmed that M. incognita infection reduced cotton boll set and
boll weight in all tested varieties and breeding lines. This may lead to reduced cotton yield.
Stoneville 5599BR generally had a greater reproductive growth than FiberMax 960BR. These
two cultivars usually responded the same to nematode populations. The reproductive growth of
breeding line 120R1B1 was less affected by M. incognita compared with PD94042, indicating a
high resistance in 120R1B1, which may lead to a better yield.
Photosynthetic rate was generally reduced by M. incognita infection at around 65 days
after inoculation, although the reduction in some trials was not significant. This reduction was
often accompanied by an increased leaf temperature, sub-stomatal CO2 concentration, decreased
transpiration rate and stomatal conductance. This symptom was similar to symptoms of drought
stress, as drought stress may also lead to increased stomatal closure, leaf temperature and internal

34
CO2 content. The drought effect was observed in another study regarding the influence of M.
incognita on the water relations of cotton in microplots (Kirkpatrick et al., 1995).
In this study, there was no difference between FiberMax 960BR and Stoneville 5599BR
in their photosynthetic rates across all nematode inoculation levels. All photosynthetic variables
also responded the same in two varieties, indicating the level of resistance did not affect the
photosynthetic process of cotton. Breeding line 120R1B1 generally had a higher photosynthetic
rate, transpiration rate, stomatal conductance, and lower leaf temperature than breeding line
PD94042. These differences were not always statistically significant. But it may indicate that
with a higher resistance to M. incognita, there was less drought symptom and thus the
photosynthetic process was less affected.
Results from this study showed that M. incognita infection not only inhibited plant
growth, but also damaged plants at a physiological level. Fiber length, which is determined in the
elongation stage, requires the deposition of carbohydrate polymers (DeLanghe, 1986). Water
pressure inside the developing fiber also has an influence on fiber elongation by regulating the
deposition of carbohydrate polymers (Bradow and davidonis, 2000). Therefore, by reducing the
production of carbohydrate polymers, which was likely through reducing chlorophyll content and
photosynthesis, M. incognita could potentially reduce fiber length. To some degree, fiber
strength and uniformity can also be influenced by these same stresses (Bradow and davidonis,
2000). Fiber micronaire is determined by a series of carbohydrates produced through
photosynthesis that are deposited on the interior walls of the fiber, which increases the value of
micronaire (Silvertooth, 1999). Therefore, reduced photosynthesis caused by M. incognita
infection could lead to reduced fiber micronaire. By reducing the number of cotton bolls, the

35
competition among bolls for nutrients can be reduced, which could lead to a high micronaire that
is not desired.
2.6 Summary and Conclusions
The results of greenhouse trials showed that in response to infesting soil with eggs of M.
incognita, the height-to-node ratio and chlorophyll content in affected cotton plants
approximately 65 days after inoculation was reduced significantly. There was no consistent
reduction in chlorophyll fluorescence in plants infected by M. incognita. However, a reduced
chlorophyll content could lead to the reduced photosynthetic rate that was observed in this study.
Photosynthetic rates in three trials at around 65 days after inoculation were negatively affected
where infection by M. incognita occurred. This reduction was usually accompanied by reduced
transpiration rates, reduced stomatal conductance, increased leaf temperatures and sub-stomatal
CO2 concentrations. These effects resembled drought stress in plants.
Cotton biomass as measured in terms of shoot fresh weight and dry weight, root weight
and total leaf area were all significantly decreased in plants infected by M. incognita. Cotton
reproductive growth, measured as number of bolls, and boll fresh and dry weight, was also
reduced when the potting soil was infested with M. incognita and infection occurred. The
differences in growth responses between plants grown in soil with mid-level and high-level
nematode populations were usually not significant. This may be an indication that infection and
reproduction of M. incognita on the cotton roots was saturated or close to saturation at the mid-
level nematode population.
There were significant differences between varieties FiberMax 960BR and Stoneville
5599BR regarding their responses to infection by M. incognita. Stoneville 5599BR has a higher

36
level of resistance to M. incognita infection than FiberMax 960BR, and this affected cotton
growth. Resistance to M. incognita in Stoneville 5599BR could also be related to greater
suppression of nematode reproductions on roots as compared with susceptible FiberMax 960BR.
Breeding line 120R1B1 had a promising resistance to M. incognita infection, especially in terms
of suppressing nematode reproduction on roots.
Reduced plant growth and physiological characters caused by M. incognita could be
indicators of suppressed fiber development, because fiber development requires supply of
photosynthetic products, and also a normal water pressure and cotton boll numbers for some
fiber properties. Resistant cultivars may result in higher fiber quality, because less damage can
be caused in these cultivars by M. incognita.
2.7 References
Albers, D. W. 1993. Cotton plant development and plant mapping. G4268, University of Missouri Extension, Columbia, MO. Basra, A. S., ed. 1999. Cotton fibers: Developmental biology, quality improvement, and textile processing. Food Products Press/The Haworth Press, Binghamton, New York. Barfield, M. 2003. ST 5599BR and ST 5303R: Two new transgenic varieties from Stoneville pedigreed seed company; Page 52 in: Proc. Beltwide Cotton Conf., Nashville, TN. 6-10 Jan. 2003. Natl. Cotton Council Am., Memphis, TN. Beltwide Cotton Nematode Survey and Education Committee. 2003. Cotton nematodes, your hidden enemies. National Cotton Council of America, Memphis, TN and Research Triangle Park, NC. Bird, A. F. 1970. The effect of nitrogen deficiency on the growth of Meloidogyne javanica at different population levels. Nematologica 16:13-21. Bird, A. F., and Loveys, R. R. 1975. The incorporation of photosynthates by Meloidogyne javanica. J. Nematol. 7:111-113. Bridge, J., and Page, S. L. J. 1980. Estimation of M. incognita infestation levels on roots using a rating chart. Trop. Pest Manage. 26:296-298.

37
Brueske, C . H., and Bergeson, G. B. 1972. Investigation of growth hormones in xylem exudate and root tissue of tomato infected with M. incognita. Journal of Experimental Botany 23:14-22. Evans, J. R. 1989. Photosynthesis and nitrogen relationships in leaves of C3 plants. Oecologia 78(1):9-19. Haseeb, A., Srivastava, N. K., and Pandey, R. 1990. The influence of Meloidogyne incognita on growth, physiology, nutrient concentration and alkaloid yield of Hyoscyamus niger. Nematol. Medit. 18: 127-129. Hussey R.S., and Barker, K. R. 1973. A comparison of methods of collecting inocula for Meloidogyne spp., including a new technique. Plant Disease Rep. 57:1025-1028. Kinloch, R. A. 1990. Screening for resistance to M. incognita. Pages 16-23 in: Methods for evaluating plant species for resistance to plant-parasitic nematodes. J. L. Starr, ed. Society of Nematologists, Hyattsville, MD., Kirkpatrick, T. L., van Iersel, M. W., and Oosterhuis, D. M. 1995. Influence of Meloidogyne incognita on the water relations of cotton growth in microplots. J. Nematol. 27: 465-471. Kirkpatrick, T. L., and Sasser, J. N. 1984. Crop rotation and races of Meloidogyne incognita in cotton root-knot management. Journal of Nematology 16:323-328. Kirkpatrick, T. L., Oosterhuis, D. M., and Wullschleger, S. D. 1991. Interaction of Meloidogyne incognita and water stress in two cotton cultivars. Journal of Nematology 23(4): 462-467. Koenning, S. R., Kirkpatrick, T. L., Starr, J. L., Wrather, J. A., Walker, N. R., and Mueller, J. D. 2004. Plant-parasitic nematodes attacking cotton in the United States. Plant Disease 88(2): 100-113. Loveys, B. R., and Bird, A. F. 1973. The influence of nematodes on photosynthesis in tomato plants. Physiological Plant Pathology 3: 525-529. Madden, LV. 2008. Plant disease epidemics and crop yield. (Abstr.) Phytopathology 98 (Suppl.):S188. Maxwell, K., and Johnson, G. N. 2000. Chlorophyll fluorescence – a practical guide. Journal of Experimental Botany 51(345):659-668. May, O. L. 1999. Registration of PD 94042 germplasm line of upland cotton with high yield and fiber maturity. Crop Science 39:597-598. McClure, M.A. 1977. Meloidogyne incognita: A metabolic sink. J. Nematol. 9: 88-90.

38
Mitchell, D. M. and Robinson, J. R. C. 2009. Structural changes in U.S. cotton supply and demand relationships. Pages 238-294 in: Proceedings of the Beltwide Cotton Conferences, San Antonio, TX, 5-8 January 2009. Ortiz, B. V., Perry, C., Sullivan, D. G., Kemerait, B., Ziehl, A., Davis, R., Vellidis, G., and Rucker, K. 2008. Cotton yield response to variable rate nematicides according to risk zones. ASABE Meeting Presentation. Paper number: 081026. Phipps, P. M. and J. D. Eisenback. 2005. Response of cotton varieties to in-furrow applications of Temik 15G in fields infested with southern root-knot nematode in Virginia. Page 247 in: Proc. Beltwide Cotton Conf., New Orleans, LA. 4-7 Jan. 2005. Natl. Cotton Council Am., Memphis, TN. Powell, N. T. 1971. Interactions between nematodes and fungi in disease complexes. Annual Review of Phytopathology 9:253-273. Shepherd, R. L. 1982. Registration of three germplasm lines of cotton. Crop Science 22:692. Thomas, S. H., and Kirkpatrick, T. L. 2001. Root-knot nematode. Pages 40-42 in: Compendium of Cotton Diseases, 2nd ed. T. L. Kirkpatrick and C. S. Rothrock, eds. American Phytopathological Society, St. Paul, MN. Walker, N. R., Kirkpatrick, T. L., and Rothrock, C. S. 1998. Interaction between Meloydogyne incognita and Thielaviopsis basicola on cotton (Gossypium hirsutum). J. Nematol. 30: 415-422. Wheeler, T. A., Keeling, J. W., Bordovsky, J. P., Everitt, J., Bronson, K. F., Boman, R. K., and Mullinix, B. G., Jr. 2009. Effect of irrigation rates on three cotton (Gossypium hirsutum L.) cultivars in a root-knot nematode (Meloidogyne incognita) infested field. Journal of Cotton Science 13:56-66.

39
Table 2.1. Effect of different nematode inoculation levels and cotton varieties on gall rating and egg counts.
Trial Nem levela Gall ratingb Egg counts /g root Pooled datac Pooled data None 0.00 bd 0.00 b
1 Medium 4.24 a 2100.02 a high 4.09 a 3004.42 a P value <.0001 <.0001 FMe ST FM ST
2
None 0.00 b 0.00 b 0.00 b 0.00 Medium 4.00 a 2.41 a 8544.71 a 4018.85
High 4.41 a 2.36 a 14840.77 a 5363.08 P value <.0001 <.0001 0.0007 0.1148
Pooled data Pooled data
3
None 0.00 c 0.00 b Medium 2.85 b 5056.02 a
High 3.30 a 6330.29 a P value <.0001 <.0001
Variety effect FM ST FM ST
Average 3.03 2.53 2259.68 1202.72 Trial 1 P value 0.0414 0.0415
Trial 2 Average 2.80 1.59 7795.16 3127.31 P value <.0001 0.0717
Trial 3 Average 2.50 1.60 4798.53 2792.34 P value <.0001 0.0025
a Nematode inoculation level, none = 0 egg/pot, medium = 6,000 eggs/pot, high = 20,000 eggs/pot. b Gall rating was based on a 0-5 index, 0 = no galling, 1 = trace infection with a few small galls, 2 = galling evident on <25% of the roots, 3 = 25-50%, 4 = 50-75% and 5 = >75% of the roots galled. c Data for two varieties was pooled when no significant interaction occurred. d Fisher's Protected LSD(0.05) comparisons among nematode inoculation levels within a trial. Means in a column followed by the same letter are not significantly different. e Cotton variety FM = FiberMax 960BR, ST = Stoneville 5599BR.

40
Table 2.2. Effect of different nematode inoculation levels and cotton breeding lines on gall rating and egg counts.
Trial Nem levela Gall ratingb Egg counts /g root PDc 120 Pooled data
2
None 0 cd 0 b 0.00 b Medium 3.14 b 1.5 a 1650.68 a
High 3.91 a 1.73 a 2955.85 a P value <.0001 <.0001 0.0003
PD 120 PD 120
3
None 0.00 b 0.00 b 0.00 b 0.00 b Medium 4.25 a 2.20 a 6341.59 a 293.36 a
High 4.05 a 1.88 a 6878.11 a 272.67 a P value <.0001 <.0001 <.0001 0.1089
Variety effect PD 120 PD 120
Trial 2 Average 2.35 1.08 2818.65 208.67 P value <.0001 <.0001
Trial 3 Average 2.77 1.36 4406.57 188.68 P value <.0001 <.0001
a Nematode inoculation level, none = 0 egg/pot, medium = 6,000 eggs/pot, high = 20,000 eggs/pot. b Gall rating was based on a 0-5 index, 0 = no galling, 1 = trace infection with a few small galls, 2 = galling evident on <25% of the roots, 3 = 25-50%, 4 = 50-75% and 5 = >75% of the roots galled. c Data for each breeding line was shown separately when significant interaction occurred; breeding line PD = PD94042, 120 = 120R1B1. d Fisher's Protected LSD(0.05) comparisons among nematode inoculation levels within a trial. Means in a column followed by the same letter are not significantly different.

41
Table 2.3. Effect of different nematode inoculation levels and cotton varieties on the areas under the height-to-node ratio, chlorophyll content, and chlorophyll fluorescence progress curve .
Trial Nem levela
AUHNRPCb (cm·day) AUCCPC (day) AUCFPC (day)
None 243.3c 1979.2 ad 4035.8
1 Medium 232.2 1880.5 b 4001.5 High 223.0 1774.4 c 2995.3 P value 0.1889 <.0001 0.0531
2
None 156.0 a 1623.7 a 3386.2 Medium 154.4 a 1530.7 b 3385.7
High 142.4 b 1484.9 b 3381.7 P value 0.0048 0.0001 0.9085
3
None 165.4 a 1703.7 a 4009.7 a Medium 153.0 b 1570.2 b 3957.2 b
High 141.1 c 1473.6 c 3975.1 b P value <.0001 <.0001 0.0216
Variety effect FMe ST FM ST FM ST
Trial 1 Average 220.3 246.6 1944.76 1803.65 4021.82 3999.89 P value 0.0003 <.0001 0.1354
Trial 2 Average 135.1 167.2 1594.2 1498.7 3382.6 3386.4 P value <.0001 <.0001 0.6949
Trial 3 Average 134.3 172.0 1639.0 1526.0 3994.7 3966.6 P value <.0001 <.0001 0.0452
a Nematode inoculation level, none = 0 egg/pot, medium = 6,000 eggs/pot, high = 20,000 eggs/pot. b AUHNRPC = area under height-to-node ratio progress curve; AUCCPC = area under chlorophyll content progress curve; AUCFPC = area under chlorophyll fluorescence progress curve. c Data for two varieties was pooled when no significant interaction occurred. d LSD(0.05) comparisons among nematode inoculation levels within a trial. Means in a column followed by the same letter are not significantly different. e Cotton variety FM = FiberMax 960BR, ST = Stoneville 5599BR.

42
Table 2.4. Effect of different nematode inoculation levels and cotton breeding lines on the areas under the height-to-node ratio, chlorophyll content, and chlorophyll fluorescence progress curve.
Trial Nem levela
AUHNRPCb (cm·day) AUCCPC (day) AUCFPC (day)
2
None 146.11 ac 1615.87 a 3396.77 Medium 135.29 b 1504.93 b 3396.80
High 130.68 b 1441.48 b 3397.98 P value 0.0055 <.0001 0.9886
3
None 157.61 a 1665.85 a 4015.26 Medium 144.95 b 1540.11 b 3984.85
High 134.01 c 1489.70 c 4019.37 P value 0.0002 <.0001 0.0808
Variety effect PDd 120 PD 120 PD 120
Trial 2 Average 143.89 130.33 1513.44 1528.08 3410.51 3383.85 P value 0.0037 0.6342 0.0053
Trial 3 Average 147.77 143.28 1550.41 1580.03 4001.34 4011.64 P value 0.1827 0.0474 0.4970
a Nematode inoculation level, none = 0 egg/pot, medium = 6,000 eggs/pot, high = 20,000 eggs/pot. b AUHNRPC = area under height-to-node ratio progress curve; AUCCPC = area under chlorophyll content progress curve; AUCFPC = area under chlorophyll fluorescence progress curve. c LSD(0.05) comparisons among nematode inoculation levels within a trial. Means in a column followed by the same letter are not significantly different. Data for two breeding lines was pooled when no significant interaction occurred. d Breeding line PD = PD94042, 120 = 120R1B1.
43
Table 2.5. Effect of different nematode inoculation levels and cotton varieties on plant dry weight, root weight, leaf area, boll number, and boll dry weight.
Trial Nem levela Dry weightb Root weight Leaf area Boll number Boll dry weight
g g cm2 g Pooled datac Pooled data Pooled data Pooled data Pooled data
1
None 21.53 ad 47.68 b 1496.20 a 6.55 a 8.77 a Medium 17.89 b 59.54 a 1485.70 a 4.67 b 7.71 ab
High 14.64 c 51.23 b 1320.08 b 3.35 b 2.53 b P value <.0001 0.0307 0.0201 <.0001 0.0017
Pooled data Pooled data Pooled data Pooled data FM ST
2
None 15.74 a 29.36 a 1654.03 a 5.77 a 0.50 a 1.41 a Medium 11.61 b 26.73 a 1481.85 a 4.00 b 0.17 b 0.70 b
High 8.72 c 18.41 b 1231.09 b 1.91 c 0.03 b 0.30 c P value <.0001 <.0001 0.0002 <.0001 0.0001 <.0001
Pooled data Pooled data Pooled data Pooled data Pooled data None 17.20 a 50.79 a 1034.66 a 3.70 a 3.19 a
3 Medium 14.19 b 40.22 b 926.64 b 1.85 b 1.62 b High 9.88 c 37.21 b 770.16 c 0.90 c 0.52 c P value <.0001 <.0001 <.0001 <.0001 <.0001
Variety effect FMe ST FM ST FM ST FM ST FM ST
Trial 1 Average 18.23 17.72 51.43 53.87 1357.02 1501.56 4.16 5.47 4.53 7.88 P value <.0001 0.3099 0.0127 0.0006 0.0198
Trial 2 Average 10.42 13.63 21.02 28.65 1251.55 1659.76 2.39 5.39 0.23 0.80 P value 0.0008 0.0011 0.0007 <.0001 <.0001
Trial 3 Average 13.60 13.80 39.68 49.80 855.16 969.54 1.77 2.53 0.55 3.00 P value 0.2521 0.0086 0.0026 0.0338 <.0001
a Nematode inoculation level, none = 0 egg/pot, medium = 6,000 eggs/pot, high = 20,000 eggs/pot. b Dry weight of the above-ground part of plants. c Data for two varieties was pooled when no significant interaction occurred. d LSD(0.05) comparisons among nematode inoculation levels within a trial. Means in a column followed by the same letter are not significantly different. e Cotton variety FM = FiberMax 960BR, ST = Stoneville 5599BR.

44
Table 2.6. Effect of different nematode inoculation levels and cotton breeding lines on plant dry weight, root weight, leaf area, boll number, and boll dry weight.
Trial Nem levela Dry weightb Root weight Leaf area Boll number Boll dry weight
g g cm2 g Pooled datab Pooled data Pooled data Pooled data Pooled data
2
None 15.74 ac 34.67 1949.36 a 4.95 a 0.56 a Medium 13.18 b 36.59 1782.31 ab 3.00 b 0.26 b
High 11.22 c 30.62 1680.03 b 2.27 b 0.11 b P value <.0001 0.1693 0.0135 0.0001 <.0001
PDd 120 PD 120 PD 120 Pooled data PD 120
3
None 19.6 a 20.9 a 66.6 a 70.1 1218.6 a 1339.1 3.3 a 3.6 a 1.6 a Medium 12.7 b 18.4 b 41.7 b 78.6 949.8 b 1315.6 1.2 b 0.8 b 0.5 b
High 11.3 b 15.60 c 50.2 b 69.9 931.8 b 1216.9 0.7 b 0.0 b 0.1 b P value <.0001 0.0002 <.0001 0.1653 0.0007 0.0750 <.0001 0.0010 0.0257
Variety effect PD 120 PD 120 PD 120 PD 120 PD 120
Trial 2 Average 13.74 13.02 34.33 33.60 1825.8 1782.0 0.28 0.34 3.24 3.58 P value 0.3067 0.5025 0.5052 0.5557 0.5005
Trial 3 Average 14.51 18.39 52.84 72.86 1033.4 1292.3 1.60 1.87 1.47 0.75 P value 0.001 <.0001 0.0002 0.4575 0.1145
a Nematode inoculation level, none = 0 egg/pot, medium = 6,000 eggs/pot, high = 20,000 eggs/pot. b Dry weight of the above ground part of cotton plants. c Data for two breeding lines was pooled when no significant interaction occurred. d LSD(0.05) comparisons among nematode inoculation levels within a trial. Means in a column followed by the same letter are not significantly different. e Breeding line PD = PD94042, 120 = 120R1B1.

45
Table 2.7. Effect of different nematode inoculation levels and cotton varieties on photosynthesis. Trial Nema Evapb GS TL PN Ci
mol m-2s-1 mol m-2s-1 ºC µmol m-2 s-1 ppm
1
None 3.42c 173.41 24.63 14.91 a 212.82 b Medium 3.28 166.48 24.74 12.16 b 241.24 a
High 3.09 147.96 25.57 9.97 b 254.87 a P value 0.1819 0.5005 0.1582 0.0047 0.0021
2
None 3.73 ad 519.45 21.70 10.20 a 341.32 Medium 3.22 b 420.32 21.78 8.46 b 340.32
High 3.30 b 427.41 22.13 8.71 b 336.18 P value 0.0451 0.1311 0.4888 0.0016 0.3738
3
None 4.56 459.65 25.99 11.47 318.75 Medium 4.32 417.30 26.10 12.04 310.35
High 4.21 409.35 26.28 11.57 316.85 P value 0.4275 0.3464 0.0839 0.8151 0.4869
Variety effect FMe ST FM ST FM ST FM ST FM ST
Trial 1 Average 3.49 3.05 177.28 148.26 25.28 24.72 12.78 11.87 240.47 232.79 P value 0.9919 0.1989 0.1586 0.4951 0.3240
Trial 2 Average 3.56 3.27 466.45 445.00 22.15 21.59 9.07 9.18 339.70 338.85 P value 0.1551 0.6449 0.1463 0.7239 0.8302
Trial 3 Average 4.52 4.21 445.37 412.17 26.13 26.11 12.35 11.03 314.03 316.60 P value 0.3012 0.5558 0.8123 0.2021 0.5653
a Nematode inoculation level, none = 0 egg/pot, medium = 6,000 eggs/pot, high = 20,000 eggs/pot. b Evap = transpiration rate; GS = stomatal conductance; TL = leaf temperature; PN = photosynthetic rate; Ci = sub-stomatal CO2 concentration. c Data for two varieties was pooled when no significant interaction occurred. d LSD(0.05) comparisons among nematode inoculation levels within a trial. Means in a column followed by the same letter are not significantly different. e Cotton variety FM = FiberMax 960BR, ST = Stoneville 5599BR.

46
Table 2.8. Effect of different nematode inoculation levels and cotton breeding lines on photosynthesis. Trial Nema Evapb GS TL PN Ci
mol m-2s-1 mol m-2s-1 ºC µmol CO2 m-2 s-1 ppm
Pooled datac Pooled data Pooled data Pooled data Pooled data
2
None 3.76 440.18 22.84 10.30 329.95 Medium 3.83 458.32 23.03 10.17 331.64
High 3.80 455.05 22.95 9.50 334.23 P value 0.9323 0.9004 0.8714 0.0849 0.5129
Pooled data Pooled data Pooled data PDe 120 PD 120
3
None 3.47 ad 1709.9 24.97 15.13 a 16.06 311.5 318.7 Medium 2.92 b 1992.3 24.72 16.74 a 14.29 301.7 317.3
High 3.03 b 1142.4 25.28 9.99 b 14.56 326.9 306.5 P value 0.0286 0.5985 0.5334 0.0040 0.7032 0.1034 0.4904
Variety effect PD 120 PD 120 PD 120 PD 120 PD 120
Trial 2 Average 3.62 3.97 390.82 511.55 23.14 22.74 9.92 10.06 327.03 336.85 P value 0.0643 0.0126 0.0758 0.6577 0.0076
Trial 3 Average 3.20 3.08 1510.3 1719.4 25.26 24.71 13.95 14.97 313.37 314.17 P value 0.4696 0.6732 0.0586 0.4505 0.8791
a Nematode inoculation level, none = 0 egg/pot, medium = 6,000 eggs/pot, high = 20,000 eggs/pot. b Evap = transpiration rate; GS = stomatal conductance; TL = leaf temperature; PN = photosynthetic rate; Ci = sub-stomatal CO2 concentration. c Data for two breeding lines was pooled when no significant interaction occurred. d LSD(0.05) comparisons among nematode inoculation levels within a trial. Means in a column followed by the same letter are not significantly different. e Breeding line PD = PD94042, 120 = 120R1B1.

47
CHAPTER 3
THE EFFECT OF SOUTHERN ROOT KNOT NEMATODE (MELOIDOGYNE
INCOGNITA) ON COTTON GROWTH, YIELD, AND FIBER QUALITY IN THREE
FIELDS WITH SITE-SPECIFIC MANAGEMENT1
1 Lu, P., Kemerait, R. C., Jr., Davis, R. F., and Perry, C. To be submitted to Journal of Nematology.

48
3.1 Abstract:
Southern root knot nematode [Meloidogine incognita (Kofoid & White) Chitwood] is a
major parasite on cotton (Gossypium hirsutum L.), causing considerable yield loss. At three field
sites, different types and rates of nematicides were applied in an effort to create different
populations of M. incognita in 2008 and 2009. Each field was delineated into two site-specific
management zones. In all three fields in both years, Telone II significantly reduced soil
populations of M. incognita, root gall ratings, and nematode reproduction on the roots and
significantly improved plant growth and yield as compared with Temik 15G and seed treatments.
Differences between variable rates of the same nematicides or different nematicide seed
treatments were not statistically significant. Most measurements of fiber quality were not
significantly or consistently affected by treatments across trials and years. The effects of
management zones were usually not significant but differed from field to field.
Keywords: Fiber quality, Management zones, Meloidogyne incognita, Southern root-knot nematode, Precision agriculture, Yield

49
3.2 Introduction
Cotton (Gossypium hirsutum L.) is an oilseed and fiber crop. It is grown in more than
seventy countries and is the single most important fiber crop worldwide. No crop competes with
it in the potential of value-added processing (Basra, 1999). Cotton is also one of the oldest
cultivated crops. It has been associated with human activity since before recorded history.
The U.S. is the third-largest producer of cotton in the world. Cotton production in the U.S.
has increased 66% in the past 40 years (Mitchell, 2009). In recent years, the U.S. has produced
about 20 percent of the world's annual supply (Mitchell, 2009).
Root knot nematodes occur worldwide and attack a diversity of crops. They cause
considerable yield losses and affect the quality of the product, either by directly damaging plants
(Kirkpatrick and Sasser, 1984) or by predisposing them to infection by fungal and bacterial
pathogens (Powell, 1971).
The southern root knot nematode [Meloidogyne incognita (Kofoid & White) Chitwood]
is found in all cotton production regions in the U.S. and is the most widely distributed nematode
parasite of economic importance of the crop (Thomas and Kirkpatrick, 2001). It is considered the
major yield-limiting plant-parasitic nematode across the U.S. Cotton Belt; approximately twice
as much yield loss is attributed to M. incognita as to all other nematode parasites of the crop
(Koenning et al., 2004). The estimated yield loss of cotton caused by M. incognita in the U.S.
was 2.4% in 2007, which was greater than for any other cotton disease. This damage resulted in a
loss of more than 106,000,000 kg of lint (Cotton Disease Loss Committee, 2008). In Georgia in
2007, M. incognita caused an estimated 6% reduction in yield resulting in a loss of 25,000,000
kg of lint (Cotton Disease Loss Committee, 2008).

50
Damage caused by plant-parasitic nematodes is distinct from other plant diseases because
there are no unique symptoms on the above-ground portions of the plants. Nematodes are often
unevenly distributed in the soil; therefore the symptoms associated with damage from nematodes
may occur in irregular patches in the field (Beltwide Cotton Committee, 2003). These patches
can be either small and limited in number, or large and widely distributed. Damaged plants may
exhibit symptoms ranging from mild to severe stunting depending on the level of infestation and
a reduced rate of development. Foliage may also show symptoms of nutritional deficiency
(Kirkpatrick et al. 1995). In the most severe cases, plants may die before maturation. The
nematodes also interact with the Fusarium wilt pathogen (Fusarium oxysporum f.sp.
vasinfectum), which leads to wilting and brown discoloration or necrosis of the vascular tissue of
the lower stem (Beltwide Cotton Committee, 2003).
Below-ground symptoms caused by M. incognita on cotton can be much more diagnostic
than above-ground symptoms. Visible galls or “knots” often appear on cotton roots (Bridge and
Page, 1980). Swellings of the infected root tissue can be found on the cotton tap root and the
lateral roots: however, the galls on cotton may not be as easy to observe as those on vegetables
such as tomatoes. Galls are easier to detect if cotton plants are carefully dug (not pulled) from the
soil. Also, the fine lateral roots need to be handled carefully when rinsed with water to remove
soil (Beltwide Cotton Committee, 2003).
The tap root and its lateral roots are of vital importance to the cotton plant. A few galls on
these roots can disrupt the normal flow of water and nutrients to the leaves and developing bolls,
which can significantly reduce the yield of cotton (Bird and Loveys, 1975; Kirkpatrick et al.,
1991; McClure, 1977).

51
Previous research has focused on the management of M. incognita to improve cotton
yield. Very little data has documented the impact of M. incognita on cotton fiber quality.
However, cotton fiber quality is a very important issue to the growers and to the textile industry.
Fiber quality is a set of measurements that describe a sample of fibers extracted from a bale of
cotton (Bradow and Davidonis, 2000). These measurements include length, uniformity, strength,
micronaire, color grade, trash, leaf grade, preparation, and extraneous matter (USDA, 2001).
They are compared with a set of standards from the U.S. Department of Agriculture (USDA) and
are used to determine price premiums and discounts.
In recent years, cotton lint quality has become increasingly important because of the
requirements from textile mills for fiber quality, the use of high-volume instrument (HVI) testing,
the occurrence of discounts due to unfavorable fiber characteristics, and depressed cotton
markets (Silvertooth, 1999). Georgia is the third-largest cotton producer in the U.S. In the 1990s
and early 21st century, Georgia produced cotton had the fiber quality second only to that
produced in California, but now certain fiber quality parameters have not only fallen below
levels found in western U.S cotton, but also below the average fiber quality of other southern and
southeastern states (Bradow and Davidonis, 2000).
There are four general phases in cotton fiber development: 1) initiation, 2) elongation, 3)
thickening, and 4) desiccation (maturation). Fiber length is determined in the elongation stage,
which occurs about 21 days after flowering. During this stage, a thin cell wall of carbohydrate
polymers is deposited allowing the fiber to elongate (DeLanghe, 1986). Water pressure inside the
developing fiber has an influence on fiber elongation through regulating the deposition of
carbohydrate polymers (Bradow and Davidonis, 2000). Therefore, if stresses occur during this
stage (which are mainly associated with water stress or potassium deficiency), fiber length can

52
be reduced (Silvertooth, 1999). To some degree, fiber strength and uniformity can also be
influenced by these same stresses (Bradow and Davidonis, 2000).
The thickening process of cotton fibers may overlap with elongation to some extent.
During this stage, a series of carbohydrates produced through photosynthesis are deposited on
the interior walls of the fiber, which increases the value of micronaire (Silvertooth, 1999). If this
development is stopped prematurely, the micronaire value will decrease and finer fibers will
occur. New bolls that are set on the plant usually have some of the greatest demand for
carbohydrates. These bolls draw carbohydrates from the older bolls, which prevents the
development of high-micronaire fibers on older bolls (Silvertooth, 1999).
The maturation of fiber occurs after the boll has opened and the metabolically inactive
fibers dry. There is no quality measurement directly related to the maturation process. The fiber
quality within a boll is at its utmost on the day of boll opening (Bradow and Davidonis, 2000).
Therefore harvesting should be as close to physiological maturity as possible to enhance the
quality of the crop produced.
Environmental factors and management factors can significantly alter cotton fiber quality.
For example, reduced light (cloudy) conditions result in the production of weaker fibers with
reduced micronaire (Pettigrew, 2001). Early defoliation can also reduce micronaire in cotton
(Snipes and Baskin, 1994).
Biological factors such as plant-pathogenic fungi and pests have also been studied.
Cotton root rot, caused by the soilborne fungus Phymatotrichum omnivorum, can reduce fiber
length and fineness significantly (Mulrean, 1984). It has also been well documented that by
feeding on cotton bolls, stink bugs can decrease fiber quality as indicated by a reduction in
almost all HVI-measured variables (Roberts et al., 2005). Meloidogyne incognita, a root-feeding

53
plant parasite, is another factor that could potentially affect fiber quality. M. incognita draws
nutrients and water from cotton plants and exacerbates moisture, nutrient, and other kind of
stresses and also fungal infection, thus having the potential to indirectly cause damage to fiber
development.
In previous studies, several fiber properties were documented to be affected by moisture
and nutrient stress, reduced or delayed cotton growth, which in other studies, were associated
with infection by M. incognita.
Fiber length and staple can be influenced by several factors including variety,
temperature, water stress, nutrient deficiencies, and ginning practices (Bradow and Davidonis,
2000). Water relationships and irrigation practices have been studied primarily in relation to
yield. One study conducted in the early 1980s indicated that fiber length was not impacted until
water stress was such that yields were limited to less than 706.1 kg/ha (Grimes and Yamada,
1982). The interaction between M. incognita and water stress in cotton has also been studied.
The results indicated that in susceptible cultivars, infection by M. incognita may decrease the
movement of water from roots to leaves. The decrease in root flux caused by nematodes is equal
to that induced by severe water deficit stress (Kirkpatrick et al., 1991). Other studies have
demonstrated that water stress early in the bloom period had a less negative impact on fiber
length than water stress late in the bloom period (Hearn, 1976; Marani and Amirav, 1971;
Shimishi and Masani, 1971;). Sensitivity of fiber elongation to severe water stress is apparently
due to the physiological and mechanical processes of cell expansion (Hearn, 1994). As M.
incognita infection gets more and more severe later in the season, the resulting water stress in the
cotton plant may lead to a reduction in fiber length.

54
The possible impact of M. incognita on fiber strength is not as direct as the impact on
fiber length. Firstly, fiber strength has a positive relationship with canopy sunlight absorption.
There is evidence that M. incognita can reduce plant leaf area, e.g., in tomato (Loveys and Bird,
1973). Therefore by reducing cotton leaf area, M. incognita may affect fiber strength. Secondly,
studies have indicated that heat accumulation during the flowering period can also affect fiber
strength. Fiber strength was greatest in bolls that developed from flowers produced during the
first 4 to 6 weeks of flowering. Flowers that opened during the latter 2 weeks of the flowering
period produced bolls with the lowest fiber strength (Jones and Wells, 1997). Therefore, M.
incognita may reduce fiber strength by delaying cotton development and flowering.
Authors in previous study have suggested several factors that could influence fiber
micronaire. Significant differences in micronaire among commercially available varieties have
been examined. A fiber thickens as cellulose is deposited inside the fiber cell. If photosynthesis
of cotton is affected by M. incognita, as confirmed in tomato plants (Loveys and Bird, 1973), the
lack of carbohydrate production may lead to a lower micronaire value. However, micronaire
values that are too high can also result in loss of profit. It is important for cotton to produce
sufficient bolls later in the season to either compete for carbohydrates or to produce sufficiently
lower micronaire fiber. This fiber can be blended with the higher micronaire fiber to reduce
overall readings (Silvertooth, 1999). Therefore, the reduced growth and boll setting in cotton
caused by M. incognita (Kirkpatrick et al., 1995; Walker et al., 1998) may affect the blended
micronaire value.
As discussed previously, water stress can be caused by M. incognita (Kirkpatrick et al.,
1991). In other studies, it has also been shown that water deficiency in cotton can affect some
properties of cotton fiber. Moisture stress later in the season was found to reduce fiber length and

55
micronaire (Marani and Amirav, 1971). The reduction in fiber length due to water stress was also
observed in a later study. Although other characters were not consistently affected, the
distribution of bolls was consistently and significantly affected by irrigation (Pettigrew, 2004).
Studies on the effect of M. incognita on nutrient concentration in plants show that a
change in concentration of the nutrients in the plant is likely one of the first effects of the
nematode on host physiology. These changes in nutrient concentration alter host metabolism and
contribute directly or indirectly to the chlorosis and premature leaf abscission in soybean
(Melakeberhan et al., 1987). This is also true according to another study in soybean. The uptake
of nitrogen, phosphorus, and calcium was affected by M. incognita (Carneiro et al., 2002). Many
nutrients have also been reported to have effects on fiber quality. For example, leaf nitrogen
during the boll maturation period had significant positive correlations with fiber length and
negative correlations with micronaire (Reddy et al., 2004). Potassium is also a very important
element for cotton and has positive correlations with fiber length, micronaire index, fiber
strength, and fiber length uniformity ratio (Cassman et al., 1990).
Results of greenhouse studies from Chapter 2 showed that M. incognita infection
significantly reduces cotton plant growth, and some physiological characters including
chlorophyll content and photosynthesis. This reduction during plant growth could lead to
interrupted fiber development, because it requires sufficient photosynthetic products and normal
water pressure.
Approaches to effective nematode control include crop rotation, field sanitation, cover
crops, varietal resistance and nematicides. Nematode population densities can be reduced by
selecting rotation crops that are not hosts to M. incognita, or by planting resistant cultivars (Rich
and Kinloch, 2005). To date, no M. incognita-resistant cotton cultivar is commercially available.

56
Several cotton cultivars have been reported to have some level of tolerance to the Fusarium
wilt/M. incognita disease complex. However, these cultivars do not show significant resistance
to the nematodes, although some are resistant to Fusarium wilt (Beltwide Cotton Committee,
2003). Biological approaches for nematode control have been studied but have not been
thoroughly explored in cotton production systems (Starr et al., 2007).
Chemical nematicides are widely used to control M. incognita. Three nematicide
management strategies are currently widely used in the U.S. (Koenning et al., 2004), including
the application of aldicarb at rate of 0.8-1.2 kg/ha in the planting furrow; preplant soil fumigation
using either 1,3-dichloropropene or metam-sodium (Starr et al., 2007); and the supplemental use
of either aldicarb applied as a side-dress during the first third of the season or a foliar application
of the carbamate oxamyl (Lawrence and Mclean, 2000, 2002). Out of all these strategies, at-
planting application of aldicarb is perhaps the most universal nematicide strategy in the U.S.
Aldicarb is applied on 20 to 30% of the cotton hectarage each year (Koenning, et al., 2004). In
severely infested fields, nematicides can reduce the nematode population by more than 50%
(Beltwide Cotton Committee, 2003). Using chemical nematicides can provide cotton with a zone
of protected soil in which roots can develop for 4 to 6 weeks with reduced damage from
nematodes. By protecting the crop during early development, yield losses can be reduced
substantially even though nematodes may penetrate the roots during the latter part of the season
(Beltwide Cotton Committee, 2003). Seed treatments have shown some promising results in
protecting emerging roots from nematode infection (Monfort et al., 2006), but may not be
sufficient in fields with high nematode population densities.
In Georgia, commonly used practices for cotton growers are the application of the soil
fumigant Telone II (1,3-dichloropropene) before planting and application of granular

57
nematicides such as Temik 15G (aldicarb). However, the cost of nematicides may cause growers
to use them sparingly in their production system (Ortiz et al., 2008).
Like other soil-borne plant pathogens, M. incognita is present in the soil in an aggregated
pattern and the damage it causes often appears as patches in the field. This aggregated
distribution is affected primarily by the variability of soil properties. It has been shown that out
of 26 edaphic components including soil texture, acidity, pH, and others, 50% of the variability
in nematode density was related to high levels of clay, organic matter, low copper concentration,
and small changes in percent soil moisture (Noe and Barker, 1985).
To offer a more cost-effective tactic for use of nematicides on cotton, a management zone
strategy targeting areas with damaging nematode populations for treatment with nematicides has
been studied. The management zone strategy is based on the fact that M. incognita is present in
the soil in aggregated patterns due to the variability of soil texture in a field, as M. incognita
prefers coarse-textured, sandy soils. By using site-specific management (SSM), high-rate
nematicides will only be aimed at zones that potentially have higher nematode populations. A
lower rate or less expensive nematicide will be applied in low nematode risk zones. Hopefully,
the efficacy of control of nematodes can be improved and expenses can be reduced.
In 2001, a strong correlation between Columbia lance nematode densities and sand
content was observed from electrical conductivity data that was used to map within-field spatial
distribution of soil texture (Khalilian et al., 2001). This indicated promise to application of SSM
to Columbia lance nematodes. In recent years, SSM has also been studied for M. incognita in
cotton fields. The data indicated that edaphic features can be used as indirect indicators of high-
risk, nematode-prone areas (Ortiz et al, 2006). In 2007, it was found that different nematicide
rates had significantly different effects on cotton yields within different risk zones (Ortiz et al.,

58
2008). These findings support the strategy of variable-rate nematicide applications based on root
knot nematode risk management zones. The goal of using SSM in this study was to determine
whether cotton fiber quality may also respond differently to nematicide application in different
management zones.
The objective of this chapter was to (1) examine the effect of M. incognita infection on
cotton growth, lint yield, and fiber quality under field condition; and (2) determine whether these
effects are influenced by different risk management zones.
3.3 Materials and Method
The experiments were conducted at three commercial fields 2008 and again in 2009. The
three field sites included a field at the Perryman farm in Colquitt County and two fields (“east”
and “west”) at the Windhausen Farm in Mitchell County. These three fields had been in cotton
for a long time, were non-irrigated, and had histories of significant yield losses to M. incognita.
The tillage method used at the Perryman farm was conventional where the land was ripped and
bedded prior to planting. Conservation/strip tillage was practiced on the Windhausen farm
where the fields were planted to a rye cover crop during the winter months. Delta and Pineland
555BR was the only cotton variety planted in these three fields over the course of this study.
This variety has no known resistance to the southern root-knot nematodes. The planting date for
Perryman farm was 11 May 2008 and 14 May 2009. For Windhausen farms, the planting date
was 24 May 2008 and 13 May 2009.
Six treatments were applied at Perryman farm in order to assess the efficacy of the
commercially available nematicides and to attempt to create different nematode population levels
in the soil with which to challenge the cotton plants. The treatments included : (T1) Temik 15G

59
(aldicarb 3.36 kg/ha); (T2) Temik 15G (aldicarb 6.72 kg/ha); (T3) Telone II (1,3-
dichloropropene 28.1 L/ha) + Temik 15G (aldicarb 3.36 kg/ha); (T4) Telone II (1,3-
dichloropropene 56.12 L/ha) + Temik 15G (aldicarb 3.36 kg/ha); (T5) AVICTA Complete
Cotton and (T6) AERIS Seed-Applied System + Trilex. Temik 15G at 3.36 kg/ha is the standard
rate of this product used for early-season management of thrips. At this rate, Temik 15G is
thought to have only minimal nematicidal activity. Fumigation with Telone II offers the best
protection for the developing cotton plant from plant-parasitic nematodes but requires additional
equipment and cost. The addition of 3.36 kg/ha Temik 15G to the two Telone treatments was for
thrips control. Seed treatment AVICTA Complete Cotton is a combination of three separately
registered products, including AVICTA (abamectin), Cruiser (thiomethoxam), and Dynasty CST
(azoxystrobin, fludioxonil and mefenoxam). AERIS Seed-Applied System + Trilex is a
combination of the insecticide imidacloprid at 0.375 mg a.i./seed and nematicide thiodicarb at
0.375 mg a.i./seed with an optional fungicide package of Trilex Advanced (trifloxystrobin,
triadimenol, and metalaxyl). AVICTA Complete Cotton and AERIS Seed-Applied System were
not included in trials at the Windhausen farm. Therefore, there were only four treatments
included in these two fields.
At each site, treatments were applied in strips across the entire length of the field. At the
Perryman farm, the treatment strips were four rows wide. On the Windhausen farm treatment
strips were eight rows wide. Each of the three fields was delineated into two management zones
based upon fuzzy clustering of various surrogate data for soil texture. The high-risk zones in
each field tended to have sandier soil which is preferred by M. incognita, and are therefore
expected to have higher M. incognita populations. Soil in the low-risk zones has a lower
percentage of sand and is believed to have lower nematode populations. The methodology for

60
management zone delineation was developed using data collected in 2005 and 2006 from 11
cotton fields (Ortiz et al., 2007). The surrogate data for soil texture used in management zone
delineation included terrain elevation and slope, normalized difference vegetation index (NDVI)
calculated from bare-soil spectral reflectance, and apparent soil electrical conductivity (ECa).
These data was collected in the previous year after harvest. EC values were measured using
VERIS 3100 implement (Veris Technologies, Salina, KS), and elevation data was collected with
a Trimble AgGPS 214 real-time kinematic GPS receiver (Trimble, Sunnyvale, CA) mounted on
the tractor pulling the VERIS 3100 implement.
Within each field an experiment was established with a completely randomized design in
2008 and a randomized complete block design in 2009. In 2008, treatments strips and subplots
were randomly arranged within the entire field. In 2009 the treatment strips and subplots were
randomly assigned within complete blocks. For each field, there were six treatment blocks across
the field. In 2008, five sampling plots were randomly assigned for each treatment within each
management zone in the area where a certain treatment was applied (Figure 3.1). In 2009, the
sampling plots were assigned in blocks, where all the treatments for one replication were
gathered in one block. There were three replicated blocks in each management zone in 2009
(Figure 3.2). The width of each sampling plot was four rows at Perryman farm and eight rows at
the Windhausen farm. The length of sampling plots was 15.2 m in 2008 and 30.5 m in 2009.
Populations of southern root-knot nematodes were determined by collecting soil samples
from the center two rows of each subplot using soil probes. The soil samples were then sent to
the University of Georgia’s Nematology Lab in Athens for processing. Nematodes were
extracted from 100 cm3 soil using centrifugal-flotation method (Jenkins, 1964) and Meloidogyne

61
juveniles were counted using a dissecting microscope. Soil samples were taken three to four
times in each field per season on a monthly basis (Table 3.1)..
Cotton shoot heights were measured approximately every 2 weeks during the first half of
growing season and until the cotton plants reached the “cut-out” developmental stage. For each
sampling plot, five plants were randomly selected and measured. At approximately 4 and 8
weeks after planting, plant samples were taken from each field for further measurements. Five
random plants from the center two rows of the sampling plots were dug carefully from the soil,
separated into shoots and roots, and then stored in plastic sampling bags.
The measurements taken at first destructive sampling included:
(1) Height-to-node ratio: This was calculated by dividing shoot height by the number of
nodes. The number of nodes was recorded by counting the number of leaves that are bigger than
a U.S. quarter coin above the cotyledons on the main stem;
(2) Shoot dry weight: The five plant shoots from each sampling plot were packed into
one paper bag and dried in oven at 60˚C for 2 days before dry weight was measured;
(3) Root gall rating: This was based on a 0-5 index, 0 = no galling, 1 = trace infection
with a few small galls, 2 = galling evident on <25% of the roots, 3 = 25-50%, 4 = 50-75% and 5
= >75% of the roots galled (Kinloch, 1990).
(4) Egg counts: Meloidogyne eggs were extracted with 0.625% NaOCl from cotton roots
by shaking for 3 min (Hussey and Barker, 1973) and were counted microscopically.
For the second destructive sampling, only cotton roots (n = 5) were sampled because the
tops were too large to handle. Therefore, root weight, gall rating, and egg counts were measured
at the second destructive sampling.

62
Data for variables that were measured repeatedly were transformed into "areas under the
variable progress curves" using the trapezoidal method. The formula used to calculate the areas
was the same as the formula for the area under disease progress curves, which is
( )∑−
=
++
−
+1
1
11
2
n
i
iiii
ttyy
, where t is the time (in days) after planting at each measurement, y is the
value of the variable that was being measured, and n is the number of measurements over time.
The areas under the progress curves from each treatment were than analyzed using ANOVA and
LSD tests using the PROC GLM procedure in SAS (SAS Institute, Cary, NC). The data for
Windhausen East and West farms were combined for analysis. The ANOVA and LSD tests for
the combined data were conducted using PROC MIXED procedure in SAS.
During the 2009 growing season, cotton leaves from the fifth node on the main stem were
collected and sent for nutrient concentration analysis. Soil was collected mid-season for nutrient
analysis on 4 September 2008 for Perryman farm and on 11 September 2008 for Windhausen
West and East farms. In 2009, soil was collected for nutrient analysis on 15 September for all
three fields.
Toward the end of the season, the location of all sampling plots at each of the three fields
was mapped using GPS in order to monitor cotton yields accurately at harvest from sampling
plots. At harvest the spatial variability of cotton lint yield was recorded using an Ag Leader
cotton yield monitor system (AgLeader Technology, Ames, IA) installed on a Model 9965 four-
row John Deere picker. Within each subplot, samples were caught from the picker using a
fishing net and later processed with a table gin. For larger plots, samples were taken from the
cotton picker and ginned at the University of Georgia microgin in Tifton. Cotton lint was then
sent to the USDA cotton classifying office in Macon, GA, for quality testing.
63
To evaluate the economic impact of M. incognita on cotton production with respect to
fiber quality, the lint price per pound was calculated using the Southeast base price from the spot
cash market (averaged December 2008 and 2009 data) plus the premiums and/or minus the
discounts for quality. The average base price equaled $0.6549/lb. In 2008 the price included a
loan deficiency payment because it was below the loan rate of $0.52/lb. In addition to lint price,
the adjusted revenue was also evaluated. The adjusted revenue took many important economical
influencers into account, including nematicide application, variety, tillage, labor, yield, fiber
quality, etc. Both lint price and adjusted revenue were analyzed with ANOVA and LSD tests
using PROC GLM in SAS.
The effects of treatments were examined. Principal component analysis was also
conducted in SAS using PROC PRINCOMP to analyze the relation between response variables
(yield and fiber quality variables) and explanatory variables (plant growth, nematode population
and reproduction, soil nutrient contents, etc.). The biological interpretation of each principal
component was determined by finding the explanatory variables that had the highest absolute
values of eigenvectors, usually above 0.25 to 0.30. Regression analysis of the most important
principal components, which together explain over 70% of the total variation, was conducted
against the response variables of interest.
3.4 Results
3.4.1 Meloidogyne. incognita populations, disease severity, and reproduction
Meloidogyne incognita populations at the Perryman farm over 2 years showed similar
differences among treatments and between zones (Table 3.2). Where either rate of Telone
treatment was applied, M. incognita juvenile counts were significantly lower than in other

64
treatments. However in 2009, the lower rate of Telone was not statistically different from the
higher rate of Temik 15G. There was generally no significant difference among seed treatments
and Temik treatments with regard to soil nematode populations. Typically the differences
between soil nematode populations in the high and low rates of Telone were not significant in
either year. Differences between plots planted to seed treatments and plots planted to Temik
treatments were more obvious in terms of root gall ratings and egg counts per gram of roots,
where use of seed treatments resulted in greater gall ratings and egg counts than in other
treatments. Roots from plots fumigated with Telone II had the lowest gall ratings and egg counts.
The differences of soil nematode populations, root gall ratings and egg counts were mainly
among nematicide types rather than between different rates of the same nematicide. Differences
between Temik and seed treatments were not as obvious, especially with the lower rate of Temik;
most of the time it was not statistically separated from seed treatments.
At the Windhausen farm (Table 3.3), soil M. incognita populations were also
significantly lower with Telone treatments and higher with Temik treatments. This difference
was numerical but not statistically significant in 2008. The gall ratings and egg counts were also
significantly greater with Temik treatments than Telone treatments. The difference between
different rates of nematicides was not significant for any variable in either year, which was
consistent with the results from the Perryman farm.
3.4.2 Cotton growth
The plant vegetative growth measured as higher shoot height, height-to-node ratio, and
shoot dry weight at Perryman farm in both 2008 and 2009 (Table 3.4) was consistently the best
with Telone treatments. Although root weight was numerically higher with Telone treatments,
the difference was not statistically significant in either year. The differences between plants

65
from plots treated with Temik and plots with seed treatments were not significant in shoot height
measurements. However, the height-to-node ratios and dry weights were significantly higher
with Temik treatments than with seed treatments. There was no difference in plant growth
measurements between rates of a specific nematicide.
At the Windhausen farm fewer differences were found in cotton growth among plants
measured from plots treated with nematicides (Table 3.5). Shoot height measured in 2009 was
the only character that differed significantly. Plant heights from plots fumigated with Telone II
were significantly higher than were plants from plots receiving Temik treatments.
3.4.3 Cotton yield
At the Perryman farm, cotton lint yield was significantly greater where the higher rate of
Telone II was applied than where other treatments were applied in 2009 (Table 3.6). Yield
collected from plots fumigated with the lower rate of Telone II was not statistically different
from yields of Temik and seed treatment plots. There was no difference between Temik and seed
treatments in lint yield. In both years at Perryman farm, fumigation with the higher rate of
Telone resulted in the highest lint yield; use of seed treatments resulted in the lowest yield across
all sampling plots, although in 2008 this was not statistically significant. Across the entire field,
Telone treatments resulted in significantly greater yield in both years (Table 3.8). The difference
between Temik and seed treatments was not significant in either year.
At the Windhausen farm, the results of lint yield from 2008 and 2009 were seemingly
opposite to each other (Table 3.7). In 2008, the lint yield was the greatest in plots fumigated with
the higher rate Telone II. The two Telone treatments also resulted in the highest yield across the
entire fields (Table 3.9). However in 2009, the high rate of Telone resulted in a significantly

66
lower lint yield than any other treatments. Across the entire fields, cotton lint yield was not
significantly affected by nematicide treatments.
3.4.4 Fiber quality
In both 2008 and 2009 there was no apparent interaction between fiber quality and risk
management zone at the Perryman farm (Table 3.6). Therefore, for most of the fiber properties,
data from the two management zones was pooled together for analysis. The only fiber properties
that potentially had interactions between nematicides and management zones were trash content
in 2008 and fiber yellowness in 2009. Trash content in 2008 was significantly higher in plots
treated with AVICTA Complete Cotton in the low-risk zone. Trash content was lowest in plots
treated with the high rate of Temik. Fiber yellowness in 2009 was the lowest in lint from plots
with AVICTA Complete Cotton. None of these trends at Perryman farm were consistent.
Fiber quality data from fields at the Windhausen farm was pooled together for analysis as
there appeared to be no interaction between fields and treatments or management zones. In the
2008 trials (Table 3.8), none of the fiber properties appeared to have interactions between
treatments and management zones. Fiber reflectance and trash content differed significantly with
different nematicide treatments. Use of the low rate of Temik 15G resulted in the highest fiber
reflectance and use of the high rate of Telone resulted in the highest trash content. In the 2009
trials, color grade, micronaire, strength, and fiber yellowness all seemed respond differently to
nematicide treatments in different management zones. Micronaire was higher with Telone
treatments only in the high-risk zone, and fiber yellowness was higher with Temik treatments
only in the high-risk zone. Fiber strength was lower with the low rate of Telone than any other
treatments in the low-risk zone.

67
Cotton fiber quality from across the entire Perryman farm did not differ significantly
among nematicide treatments in terms of any fiber properties in either year (Table 3.8). At the
Windhausen farm (Table 3.9), fiber yellowness was significantly higher where the high rate of
Telone was applied and was significantly lower with the high rate of Temik in 2008. In 2009,
fiber reflectance was significantly lower with the low rate of Telone. Other fiber properties were
all not significantly different with different nematicide treatments.
3.4.5 Principal component analysis
The eigenvectors for the combined 2008 trials from the Perryman field and the
Windhausen West and East fields (Table 3.10) showed that plant growth variables (shoot height,
dry weight, number of nodes, etc.) contributed the most to principal component 1. Therefore,
principal component 1 was considered a plant growth component. Four nematode variables and
two soil variables contributed the most to principal component 2; therefore principal component
2 was mainly a nematode component. Principal component 2 also included some soil and
nematode combined effects. Principal component 3 was mainly a soil component. Plant growth
variables and nematode and soil variables had a combined effect on principal component 4.
Principal component 5 was again mainly a nematode component. These five principal
components together explained 71.7% of the total variation.
According to the results of regression analysis of yield and fiber quality against the first
five principal components (Table 3.11), plant growth had significant positive effect on cotton
yield and several cotton fiber properties to include staple, strength, length and uniformity, but
had a negative effect on micronaire. Principal component 2 had significant positive effect on
yield, fiber staple, and length, but had a negative effect on micronaire. The other nematode
68
component, principal component 5, had a negative effect on yield, fiber staple and length, and
many other fiber properties, although the effects were all not significant. Principal component 3
and 4 were both plant growth and soil combined components and they had significant effects on
yield and many of the fiber properties. However, the effect between component 3 and 4 were
opposed to each other.
The principal component analysis for trials conducted in 2009 (Table 3.12) showed that
plant growth variables contributed significantly to principal component 1. Therefore, principal
component 1 was considered a plant growth component. Principal component 2 was a plant
growth and leaf nutrient combined component. Principal component 3 was a soil component.
Contributions to principal component 4 came mainly from plant growth and leaf nutrient
variables, but also one nematode variable. Principal component 5 was again a leaf nutrient
component. Principal component 6 was a nematode component and principal component 7 was a
nematode plus leaf and soil nutrient component. These seven components together explained
70.3% of the total variation.
Principal components 1, 2 and 3 had significant effect on yield (Table 3.13). In 2009 the
plant growth component and soil component had a significant negative effect on cotton lint yield.
Many of the fiber properties were positively affected by the first or second component. These
were plant growth and plant growth plus leaf nutrient components. The nematode component had
no significant effect on either cotton yield or fiber quality in 2009.
3.4.6 Economic impact
The results of lint price at Perryman as well as Windhausen West and East fields in 2008
and 2009 (Table 3.14) showed that in all three fields, in both management zones, and in both

69
years, the price of lint per pound did not differ with different treatments. The adjusted revenue
for Perryman, Windhausen West and East fields in 2008 and 2009 (Table 3.15) showed that at
Windhausen West and East fields, the adjusted revenue was usually significantly higher with
Temik treatments than Telone treatments in 2009. However in 2008, although only numerically,
the low rate of Temik usually resulted in the highest adjusted revenue, but most of the
differences were not significant. At Perryman farm in both years, no significant change in
adjusted revenue was found due to different nematicide treatments.
3.5 Discussion
At the Perryman, Windhausen West and Windhausen East fields, different levels of M.
incognita populations were successfully created. The effects of nematicides were significantly
different in terms of area under nematode counts, gall rating, and egg count progress curves.
However, different rates of the same nematicide or different seed treatments were not
significantly different. Generally speaking, areas under nematode counts, cotton root gall rating,
and egg counts progress curves in both years were the lowest from plots fumigated with Telone
II and were the highest where seed treatments were used. Therefore, a higher M. incognita
population in soil resulted in higher levels of infection and nematode reproduction on cotton
roots. Telone treatments significantly suppressed nematode infection and reproduction, and this
result was achieved with even the low rate of Telone. The high rate of Telone did not
significantly increase this suppression.
It has been suggested that the development of cotton nodes is not influenced by stress
before boll set, whereas plant height is highly influenced by various stresses (Albers, 1993).
Therefore the height-to-node ratio is an indicator of the amount of stress that a cotton plant has

70
encountered. Higher height-to-node ratios can indicate that lower stress has occurred in the
plants. The results from measurement of height-to-node ratios showed that Telone treatments
significantly reduced the stress in cotton plants that was caused by M. incognita as compared
with Temik 15G and seed treatments. This appears to be true as use of Telone II resulted in the
highest height-to-node ratios.
With a better M. incognita control throughout the growing season, the higher rate of
Telone II significantly increased cotton lint yield except at the Windhausen farm in 2009. In
2009, fumigation with the high rate of Telone resulted in a significantly lower lint yield than for
any other treatments at both Windhausen farms. One possible explanation for this might be that
these two fields were both non-irrigated. In 2009, there was considerably more rainfall
throughout the growing season than in 2008. According to observations in the two management
zones at Perryman farm, cotton grows better in soil that has higher moisture. Therefore, the
excessive rainfall in 2009 may have provided the cotton plants with improved growing condition
and thus reduced the damage M. incognita was able to cause, because M. incognita causes
damage in plants only through magnifying the stress that the host plants encounter. When this
stress is alleviated, the damage from M. incognita is also reduced. The lint yield in 2009 at both
Windhausen farms was generally about 300 kg/ha more than that of 2008, which indicated the
plants had better growth in 2009. Although plant vegetative growth was affected by nematicide
treatments in 2009, cotton lint yield may be a less sensitive character to M. incognita infection.
The reason we did not see the same results from Perryman farm in 2009 may because the soil at
Windhausen farms had a better sustainability of moisture.
The fiber quality results showed no consistent and very little significant differences
among treatments. Therefore, fiber quality may be less sensitive to M. incognita infection than

71
lint yield and more affected by other factors. For example, differences in fiber quality were not
seen in 2008, although lint yield was significantly different among nematicide treatments. In the
early stage of cotton growth, carbohydrates produced by leaves are mainly transported through
the phloem to the roots, which act as the main carbohydrate sinks during this phase. In the boll
development phase, the developing bolls become much stronger carbohydrate sinks than roots
and shoots. Therefore at this stage, boll development dominates plant growth. This source to sink
relationship in cotton also applies to inorganic nutrients and water (Ritchie et al., 2007). The
mechanism of M. incognita parasitism is through manipulations of plant gene expression, instead
of a direct interruption of plant cell formation of lesions on the roots (Williamson and Gleason,
2003). Therefore the defense reaction from plants is suppressed and the plants recognize M.
incognita as strong metabolic sinks (McClure, 1977). The plants automatically transport
nutrients to the nematodes’ feeding sites. It is not clear whether M. incognita or the developing
boll is a stronger nutrient sink during the boll development phase. If the developing bolls are
stronger sinks, the nutrients will be transported preferentially to the developing bolls, the
remainder of the nutrients being transported to nematode feeding sites. In this way, fiber
development and fiber quality will not be affected. Another possibility is that M. incognita might
be a stronger nutrient sink than developing bolls, or both are of equal priority for nutrient
transport. In this situation, when sufficient nutrients exist, both developing bolls and M.
incognita can still get sufficient nutrients, and fiber quality may not be affected either.
It is also possible that if M. incognita is not able to compete with the developing bolls for
nutrients, they may, by manipulating plant genes, cause a reduction in the number of bolls
allowing more nutrients to flow into their feeding sites. A reduced boll number by M. incognita
72
infection was documented in the greenhouse results from Chapter 2, and reduced yield by M.
incognita infection was documented in the field trials.
From the results of the principal component analysis, M. incognita had negative effects
on some fiber properties to include micronaire, staple, strength, fiber reflectance, fiber
yellowness, length and uniformity. However, only the effect on micronaire was significant, and
the findings were not consistent in the 2009 trial. Many of the fiber properties were also
positively affected by nematodes. Therefore, it was not clear whether factors associated with M.
incognita generally had positive or negative effect on overall cotton fiber quality, In the 2009
trials, the nematode effect was not as strong as in 2008 as only the sixth component contained
information related to nematodes and the seventh component involved some nematode effect.
Out of the 70.3% variation these seven principal components explained, these two components
together only explained 8.21% of the total variation. This may be because in 2009 leaf nutrient
contents were tested and incorporated into the principal component analysis. The leaf content
may have provided more explanation for the variation. Also in 2009, excessive rainfall and
excellent growing conditions may be a reason why the effect of nematodes was less obvious.
Because the plants had better growing conditions, fiber development may have been less
sensitive to M. incognita infection.
The values of fiber properties usually change in a very small range. However, a small
change could bring the fiber quality below the USDA standard and leave the growers with
penalties when selling their products. Therefore, although the difference in fiber properties
among treatments was not statistically significant, it is still necessary to evaluate the actual price
of cotton lint due to the changes in fiber quality associated with M. incognita infection. By
evaluating the adjusted revenue, which is the total income deducted by the investment of crop

73
management and nematicide application, one can compare the economical profits that different
treatments generated, which take into account both lint yield and fiber quality.
Different nematicide treatments did not alter the lint price significantly by affecting fiber
quality. The average price of cotton fiber for 2008 and 2009 was $0.65/lb. The price of cotton
fiber at Perryman and Windhausen farms was overall below the average price. None of the
treatments improved the price to reach the average. Because of that, the adjusted revenue was
usually significantly higher with a less expensive nematicide at Windhausen farms. At Perryman
farm, the adjusted revenue was not affected by Telone treatments. The different results from
Perryman and Windhausen fields might be due to their different growing conditions. In fields
with better growing conditions, M. incognita is less likely to cause severe damage in cotton.
Therefore with optimum cotton growing condition, the lowest investment for nematode control
can result in the highest revenue. From the results of lint yield in 2009, which was presented in
earlier in this chapter, we suspected that Windhausen West and Windhausen East fields may
have better water sustainability than Perryman farm. If this was the case, then it supports the
speculation that the reason adjusted revenue was the highest on the Windhausen farm with the
least expensive nematicide control option was because cotton growing conditions were better
there.
3.6 Summary and Conclusions
At three fields in both years, variable M. incognita population levels were successfully
created with use different nematicide types. Fumigation with Telone II produced the lowest M.
incognita population and use of seed treatments produced the highest nematode populations at
the Perryman farm. Correspondingly, M. incognita infection assessed as gall ratings and

74
nematode reproduction (egg counts per gram of root) were both significantly lower with Telone
II treatments and were the highest with seed treatments. Plant vegetative growth assessed as area
under shoot height and root weight progress curves, height-to-node ratio, and shoot dry weight
was usually the greatest where plots were fumigated with Telone II and reduced where seed
treatments were used. Temik 15G provided better control of M. incognita than did seed
treatments and therefore resulted in a better plant growth. Although sometimes the higher rate of
a nematicide provided better numerical control, the differences between low and high rates of a
specific nematicide were not significant in most cases.
Cotton lint yield in 2008 was significantly improved with use of Telone treatments in
most cases, as a result of improved plant growth, although at Perryman farm, the improvement
was not statistically significant. In 2009, fumigation with Telone II consistently resulted in
greater yield at the Perryman farm, but appeared to result in a reduced yield in the two
Windhausen fields. This may be because the excessive rainfall in 2009 provided a better growing
condition for cotton, therefore, with less stress in plants, M. incognita damage was also
suppressed. The fact that plant growth was affected by different nematicide treatments in 2009
suggested that cotton lint yield was less sensitive to M. incognita infection than plant growth, or
perhaps was affect significantly by other factors as well.
The fiber quality results from all three fields in two growing seasons showed that in most
cases, fiber quality was not consistently or significantly affected by nematicide treatments.
Although in certain trials a few fiber properties differed significantly among treatments, these
differences were not consistent across multiple trials. Principal component analysis provided a
more direct relationship between fiber quality and M. incognita and other variables. These results
showed that the effect of M. incognita on fiber quality was not significant in most cases and also

75
not consistent in different years. It was not clear from this whether the effect of nematodes on
overall fiber quality was positive or negative. Fiber quality is likely less sensitive to M. incognita
infection than lint yield. This may be because in the boll development phases of cotton growth,
the developing bolls are nutrient sinks, as are M. incognita juveniles that are feeding in root
tissues. If developing bolls are stronger sinks or if sufficient nutrient can be provided to the bolls
despite the presence of M. incognita, fiber development and fiber quality will not be affected.
In most cases, there appeared to be no interactions between treatments and management
zones. Nematode populations, plant growth, yield and fiber quality all responded the same to
treatments within high- and low-risk management zones.
The risk management zone strategy has been implemented successfully in other fields to
manage M. incognita in cotton (Ortiz, 2008). According to the risk management zone concept,
growers can apply different types or rates of nematicides in order to obtain maximum revenue. In
this study, management zone effects were not obvious at any field site in either year. Therefore,
the risk management zone strategy may not be suitable for every field to control M. incognitas.
The results of the economical analyses from Perryman and Windhausen farms showed
that cotton lint price was not affected by different treatments. The adjusted revenue was
significantly higher in plots treated with Temik 15G than with Telone II in fields with better
growing conditions or lower nematode populations.
3.7 References
Basra, A. S., ed. 1999. Cotton fibers: Developmental biology, quality improvement, and textile processing. Food Products Press/The Haworth Press, Binghamton, New York. Beltwide Cotton Nematode Survey and Education Committee. 2003. Cotton nematodes, your hidden enemies. National Cotton Council of America, Memphis, TN and Research Triangle Park, NC.

76
Bradow, J. M., and Davidonis, G. H. 2000. Quantification of fiber quality and the cotton production-processing interface: A physiologist perspective. Journal of Cotton Science 4: 34-64. Bridge, J., and Page, S. L. J. 1980. Estimation of southern root-knot nematode infestation levels on roots using a rating chart. Trop. Pest Manage. 26:296-298. Carneiro, R. G., Mazzafera, P., Ferra, L. C. C. B., Muraoka, T., and Trivelin, P. C. O. 2002. Uptake and translocation of nitrogen, phosphorus and calcium in soybean infected with Meloidogyne incognita and M. javanica. Fitopatol. Bras. 27(2): 141-150. Cassman, K. G., Kerby, T. A., Roberts, B. A., Bryant, D. C., and Higashi, S. L. 1990. Potassium nutrition effects on lint yield and fiber quality of acala cotton. Crop Science 30:672-677. Cotton Disease Loss Estimate Committee. 2008. Cotton disease loss committee report. Pages 294-297 in: Proceedings of the Beltwide Cotton Conference, Nashville, TN, 8-11 January, 2008. Delanghe, E. A. L. 1986. Lint development. Cotton physiology. The Cotton Foundation, Memphis, TN. Grimes, D. W., and Yamada, H. 1982. Relation of cotton growth and yield to minimum leaf water potential. Crop Science 22:134-139. Hearn, A. B. 1976. Response of cotton to nitrogen and water in a tropical environment. III. Fiber quality. Journal of Agricultural Science 37: 826-832. Hearn, A. B., 1994. The principles of cotton water relations and their application in management. Pages 66-92 in: Challenging the Future. G.A. Constable and N.W. Forrester, eds, Proc. World Cotton Conf.-1, Brisbane, Australia. Hussey R.S., and Barker, K. R. 1973. A comparison of methods of collecting inocula for Meloidogyne spp., including a new technique. Plant Disease Rep. 57:1025-1028. Jones, M. A., and Wells, R. 1997. Field yield and quality of cotton grown at two divergent population densities. Crop Science 37: 1190-1195. Kinloch, R. A. 1990. Screening for resistance to southern root-knot nematode. Pages 16-23 in: Methods for evaluating plant species for resistance to plant-parasitic nematodes. J. L. Starr, ed. Society of Nematologists, Hyattsville. MD, Khalilian, A., Mueller, J. D., Blackville, S. C., Han, Y. J., and Wolak, F. J. 2001. Predicting cotton nematodes distribution utilizing soil electrical conductivity. Pages 146-149 in: Proc. 2001 Beltwide Cotton Conference. National Cotton Council, Memphis, TN. Kirkpatrick, T. L., and Sasser, J. N. 1984. Crop rotation and races of Meloidogyne incognita in cotton root-knot management. Journal of Nematology 16:323-328.

77
Kirkpatrick, T. L., Oosterhuis, D. M., and Wullschleger, S. D. 1991. Interaction of Meloidogyne incognita and water stress in two cotton cultivars. Journal of Nematology 23(4): 462-467. Kirkpatrick, T. L., van Iersel, M. W., and Oosterhuis, D. M. 1995. Influence of Meloidogyne incognita on the water relations of cotton grown in microplots. J. Nematol. 27: 465-471. Koenning, S. R., Kirkpatrick, T. L., Starr, J. L., Wrather, J. A., Walker, N. R., and Mueller, J. D. 2004. Plant-parasitic nematodes attacking cotton in the United States. Plant Disease 88(2): 100-113. Lawrence, G. W., and McLean, K. S. 2000. Effect of foliar applications of oxamyl with aldicarb for the management of Rotylenchulus reniformis on cotton. Supplement to the Journal of Nematology 32:542-549. Lawrence, G. W., and McLean, K. S. 2002. Foliar applications of oxamyl with aldicarb for the management of Meloidogyne incognita on cotton. Nematropica 32:103-112. Loveys, B. R., and Bird, A. F. 1973. The influence of nematodes on photosynthesis in tomato plants. Physiological Plant Pathology 3: 525-529. Marani, A., and Amirav, A. 1971. Effects of soil moisture stress on two varieties of upland cotton in Israel: I. The coastal plain region. Exp. Agric. 7: 213-224. Melakeberhan, H., Webster, J. M., Brooke, R. C., D'Auria, J. M., and Cackette, M. 1987. Effect of Meloidogyne incognita on plant nutrient concentration and its influence on the physiology of beans. Journal of Nematology 19(3): 324-330. McClure, M.A. 1977. Meloidogyne incognita: A metabolic sink. J. Nematol. 9: 88-90. Mitchell, D. M., and Robinson, J. R. C. 2009 Structural changes in U.S. cotton supply and demand relationships. Pages 238-294 in: Proceedings of the Beltwide Cotton Conferences, San Antonio, TX, 5-8 January 2009. Monfort, W. S., Kirkpatrick, T. L., Long, D. L., and Rideout, S. 2006. Efficacy of a novel nematicidal seed treatment against Meloidogyne incognita on cotton. Journal of Nematology 38:245-249. Mulrean, E. N. 1984 Effect of Phymatotrichum root rot on yield and seed and lint quality in Gossypium hirsutum and G. barbadense. Plant Disease 68(5):381-383. Noe, J. P. and Barker, K. R. 1985. Relation of within-field spatial variation of plant-parasitic nematode population densities and edaphic factors. Phytopathology 75:246-252.

78
Ortiz, B. V., Sullivan, D. G., Perry, C., and Vellidis, G. 2006. Geospatial solutions for precision management of cotton root knot nematodes. ASABE Meeting Presentation. Paper number: 061147. Ortiz, B. V., Sullivan, D. G., Perry, C., Vellidis, G., Seymour, L., and Rucker, K. 2007. Delineation of management zones for site specific management of parasitic nematodes using geostatistical analysis of measured field characteristics. In: Proc. Sixth European Conference of Precision Agriculture (6ECPA). Stafford, J., and Werner, A., eds. Skiathos. Greece. Ortiz, B. V., Perry, C., Sullivan, D. G., Kemerait, B., Ziehl, A., Davis, R., Vellidis, G., and Rucker, K. 2008. Cotton yield response to variable rate nematicides according to risk zones. ASABE Meeting Presentation. Paper number: 081026. Pettigrew, W. T. 2001 Environmental effects on cotton fiber carbohydrate concentration and quality. Crop Science 41:1108-1113. Pettigrew, W. T. 2004. Moisture deficit effects on cotton lint yield, yield components, and boll distribution. Agron. J. 96: 377-383. Powell, N. T. 1971. Interactions between nematodes and fungi in disease complexes. Annual Review of Phytopathology 9:253-273. Reddy, K. R., Koti, S., Davidonis, G. H., and Reddy, V. R. 2004. Interactive effects of carbon dioxide and nitrogen nutrition on cotton growth, development, yield, and fiber quality. Agron. J. 96:1148-1157. Rich, J. R., and Kinloch, R. A. 2005. Cotton nematode management. ENY-004(NG015), Florida Cooperative Extension Service, Institute of Food and Agricultural Science, University of Florida, Gainesville. Ritchie, G. L., Bednarz, C. W., and Jost, P. H. 2007. Cotton growth and development. Bulletin 1253, Cooperative Extension Service, University of Georgia College of Agricultural and Environmental Sciences, Athens. Roberts, P. M., Bednarz, C., and Greene, J. 2005. Impact of boll feeding bugs on lint yield and fiber quality, Pages 1718-1724 in: Proc. 2005 Beltwide Cotton Conf. National Cotton Council, Memphis, TN. Shimishi, D., and Marani, A. 1971. Effects of soil moisture stress on two varieties of upland cotton in Israel. II. The northern Negev region. Exp. Agric 7: 225-239. Silvertooth, J. C. 1999. Fiber quality issues and management. Univ. of Arizona Agricultural Extension Service, Tucson, AZ. Snipes, C. E., and Baskin, C. C. 1994 Influence of early defoliation on cotton yield, seed quality, and fiber properties. Field Crops Research 37:137-143.

79
Starr, J. L., Heald, C. M., Robinson, A. F., Smith, R. G., and Krausz, J. P. 1993. Meloidogyne incognita and Rotylenchulus reniformis and associated soil textures from some cotton production areas of Texas. J. Nematol. 25: S895-899. Shimishi, D., and Marani, A. 1971. Effects of soil moisture stress on two varieties of upland cotton in Israel. II. The northern Negev region. Exp. Agric 7: 225-239. Thomas, S. H., and Kirkpatrick, T. L. 2001. Root-knot nematode. Pages 40-42 in: Compendium of Cotton Diseases, 2nd ed. T. L. Kirkpatrick and C. S. Rothrock, eds. American Phytopathological Society, St. Paul, MN. USDA. 2001. The classification of cotton. Agricultural Marketing Service, Washington, D.C. Walker, N. R., Kirkpatrick, T. L., and Rothrock, C. S. 1998. Interaction between Meloydogyne incognita and Thielaviopsis basicola on cotton (Gossypium hirsutum). J. Nematol. 30: 415-422. Williamson, V. M., and Gleason, C. A. 2003. Plant-nematode interactions. Current Opinion in Plant Biology 6:327-333.

80
Table 3.1. Soil sampling dates for southern M. incognita juvenile counts at Perryman, Windhausen West and Windhausen East farms in 2008 and 2009.
Year Field Sampling date
First Second Third Fourth
2008 Perryman 6/4/08 7/22/08 9/4/08 11/4/08
Windhausen West 5/21/08 7/30/08 9/11/08 10/23/08 Windhausen East 5/21/08 7/30/08 9/11/08 10/23/08
2009 Perryman 6/23/09 7/21/09 9/15/09 10/28/09
Windhausen West 6/19/09 7/21/09 9/15/09 11/12/09 Windhausen East 6/19/09 7/21/09 9/15/09 11/12/09

81
Table 3.2. Effect of nematicides on cotton root damage, M. incognita reproduction, and nematode juvenile population at Perryman farm in 2008 and 2009.
Year Treatment AUNPCa (day/100 cm3) AUGPCb (day) AUEPCc (day/g)
2008
AERIS 39,643 ad 79.732 a 41,439 b AVICTA 38,365 a 89.889 a 75,406 a
Lowe Temik 40,913 a 57.596 b 30,355 bc High Temik 36,351 a 42.720 c 14,442 cd Low Telone 8,757 b 7.622 d 814 d High Telone 5,902 b 3.246 d 458 d P value <.0001 <.0001 <.0001
2009
AERIS 31,972 ab 74.34 a 62,678 a AVICTA 38,400 a 60.70 a 38,930 ab
Low Temik 30,030 ab 22.05 b 3,024 c High Temik 23,521 bc 28.14 b 6,018 bc Low Telone 13,063 cd 3.18 b 265 c High Telone 4,591 d 9.85 b 7,565 bc P value 0.0001 <.0001 0.0077
a Area under the nematode count progress curve. M. incognita juveniles were collected four times throughout the cotton growing season and were counted per 100 cm3 soil. b Area under the gall rating progress curve. Gall rating was based on a 0-5 index, 0 = no galling, 1 = trace infection with a few small galls, 2 = galling evident on <25% of the roots, 3 = 25-50%, 4 = 50-75% and 5 = >75% of the roots galled. c Area under the egg count progress curve. Egg counts were Meloidogyne egg counts per gram of root. d LSD(0.05) comparisons among treatments within a trial. Means in a column followed by the same letter are not significantly different. Data for two management zones was pooled when no significant interaction occurred. e Low Temik = 3.36 kg/ha; High Temik = 6.72 kg/ha; Low Telone = 28.10 L/ha; High Telone = 56.12 L/ha.

82
Table 3.3. Effect of nematicides on cotton root damage, M. incognita reproduction, and nematode juvenile population at Windhausen farms in 2008 and 2009.
Year Treatment AUNPCa (day/100 cm3) AUGPCb (day) AUEPCc (day/g)
2008
Lowe Temik 21,534 34.497 ad 26,947 High Temik 21,574 40.339 a 39,194 Low Telone 17,732 7.339 b 9,750 High Telone 10,646 1.872 b 1,480 P value 0.0826 <.0001 <.0001
2009
Low Temik 60,867 a 58.806 a 25,865 High Temik 60,752 a 46.571 a 11,194 Low Telone 44,005 ab 6.838 b 2,856 High Telone 30,944 b 17.963 b 22,926 P value 0.0029 <.0001 0.2623
a Area under the nematode count progress curve. M. incognita juveniles were collected four times throughout the cotton growing season, and were counted per 100 cm3 soil. b Area under the gall rating progress curve. Gall rating was based on a 0-5 index, 0 = no galling, 1 = trace infection with a few small galls, 2 = galling evident on <25% of the roots, 3 = 25-50%, 4 = 50-75% and 5 = >75% of the roots galled. c Area under the egg count progress curve. Egg counts were Meloidogyne egg counts per gram of root. d LSD(0.05) comparisons among treatments within a trial. Means in a column followed by the same letter are not significantly different. Data for two management zones was pooled when no significant interaction occurred. e Low Temik = 3.36 kg/ha; High Temik = 6.72 kg/ha; Low Telone = 28.10 L/ha; High Telone = 56.12 L/ha.
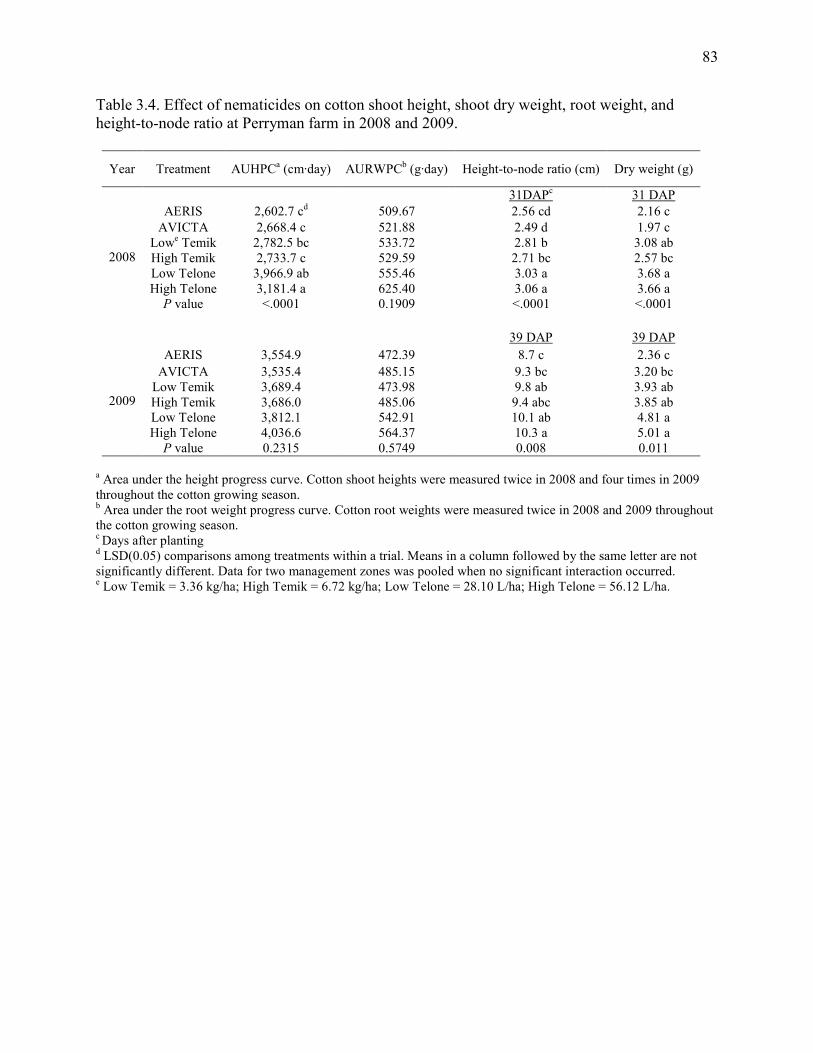
83
Table 3.4. Effect of nematicides on cotton shoot height, shoot dry weight, root weight, and height-to-node ratio at Perryman farm in 2008 and 2009.
Year Treatment AUHPCa (cm·day) AURWPCb (g·day) Height-to-node ratio (cm) Dry weight (g)
31DAPc 31 DAP
2008
AERIS 2,602.7 cd 509.67 2.56 cd 2.16 c AVICTA 2,668.4 c 521.88 2.49 d 1.97 c
Lowe Temik 2,782.5 bc 533.72 2.81 b 3.08 ab High Temik 2,733.7 c 529.59 2.71 bc 2.57 bc Low Telone 3,966.9 ab 555.46 3.03 a 3.68 a High Telone 3,181.4 a 625.40 3.06 a 3.66 a P value <.0001 0.1909 <.0001 <.0001
39 DAP 39 DAP
2009
AERIS 3,554.9 472.39 8.7 c 2.36 c AVICTA 3,535.4 485.15 9.3 bc 3.20 bc
Low Temik 3,689.4 473.98 9.8 ab 3.93 ab High Temik 3,686.0 485.06 9.4 abc 3.85 ab Low Telone 3,812.1 542.91 10.1 ab 4.81 a High Telone 4,036.6 564.37 10.3 a 5.01 a P value 0.2315 0.5749 0.008 0.011
a Area under the height progress curve. Cotton shoot heights were measured twice in 2008 and four times in 2009 throughout the cotton growing season. b Area under the root weight progress curve. Cotton root weights were measured twice in 2008 and 2009 throughout the cotton growing season. c Days after planting d LSD(0.05) comparisons among treatments within a trial. Means in a column followed by the same letter are not significantly different. Data for two management zones was pooled when no significant interaction occurred. e Low Temik = 3.36 kg/ha; High Temik = 6.72 kg/ha; Low Telone = 28.10 L/ha; High Telone = 56.12 L/ha.

84
Table 3.5. Effect of nematicides on cotton shoot height, shoot dry weight, root weight, and height-to-node ratio at Windhausen farms in 2008 and 2009.
Year Treatment AUHPCa (cm·day) Height-to-node ratio (cm) AURWPCb (g·day) Dry weight (g)
43 DAPc 43 DAP
2008
Lowe Temik 2,548.12 2.87 594.23 8.53 High Temik 2,554.28 2.82 543.23 7.98 Low Telone 2,583.17 2.89 558.00 7.89 High Telone 3,696.62 2.86 573.61 8.29 P value 0.1527 0.8841 0.2799 0.8580
46 DAP 37 DAP
2009
Low Temik 2,719.30 bd 3.69 491.20 2.38 b High Temik 2,745.61 b 3.87 476.53 2.46 b Low Telone 2,927.33 a 3.86 530.74 2.85 a High Telone 2,995.04 a 3.86 537.43 2.68 ab P value <.0001 0.4418 0.3548 0.0567
a Area under the height progress curve. Cotton shoot heights were measured twice in 2008 and four times in 2009 throughout the cotton growing season. b Area under the root weight progress curve. Cotton root weights were measured twice in 2008 and 2009 throughout the cotton growing season. c Days after planting d LSD(0.05) comparisons among treatments within a trial. Means in a column followed by the same letter are not significantly different. Data for two management zones was pooled when no significant interaction occurred. e Low Temik = 3.36 kg/ha; High Temik = 6.72 kg/ha; Low Telone = 28.10 L/ha; High Telone = 56.12 L/ha.

85
Tab
le 3
.6. E
ffec
t of n
emat
icid
es o
n co
tton
yiel
d an
d fi
ber q
ualit
y at
Per
rym
an fa
rm a
cros
s al
l sam
plin
g pl
ots
in 2
008
and
2009
. Y
ear
Tre
atm
ent
Col
or
grad
ea St
aple
(3
2nds
)b M
icro
nair
e St
reng
th
(g/te
x)
Lea
f gr
ade
Ref
lect
ance
Y
ello
wne
ss
Tra
sh (%
)c L
engt
h (c
m)
Uni
form
ity
(%)
Lin
t yi
eld
(kg/
ha)
----
----
----
Poo
led
data
d ----
----
----
Z
one
1e Z
one
2 --
----
----
-- P
oole
d da
ta --
----
----
--
2008
AE
RIS
45
33
.3
5.04
28
.56
7 74
.46
63.4
6 1.
92
abf
1.77
2.
64
81.4
8 57
8.4
AV
ICT
A
49
33.8
5.
04
28.4
9 7.
42
73.8
5 63
.79
2.06
a
1.89
2.
64
80.9
52
4.5
Low
g T
emik
45
.44
33.1
1 5.
04
28.0
8 5.
75
74.4
3 63
.13
1.58
bc
1.
51
2.67
80
.73
643.
8
Hig
h T
emik
46
.56
33.5
6 4.
89
28.2
8 6.
75
74.7
8 63
.33
1.43
c
1.63
2.
69
81.1
8 72
5.5
Low
T
elon
e 46
32
.9
5.15
28
.41
6.58
74
.97
64.4
2 1.
88
ab
1.71
2.
62
81.2
4 70
4.1
Hig
h T
elon
e 47
33
.5
5.03
28
.93
7.25
73
.47
63.1
7 1.
58
bc
1.83
2.
64
81.2
3 77
0.7
P v
alue
0.
5324
0.
3502
0.
5250
0.
8265
0.
2208
0.
4032
0.
6094
0.
0389
0.
4002
0.
4351
0.
6434
0.
1365
--
----
----
-- P
oole
d da
ta --
----
----
--
Zon
e 1
Zon
e 2
----
----
----
Poo
led
data
----
----
----
2009
AE
RIS
46
37
4.
65
30.7
5 6
73.9
63
.67
67.3
3 a
1.25
2.
92
abc
83.9
10
04.8
4 b
AV
ICT
A
44.3
3 36
.67
4.52
29
.95
6 73
.8
67
62 b
1.
1833
2.
98 a
82
.87
991.
02
b L
ow
Tem
ik
46
36.6
7 4.
48
29.6
3 6.
17
74.4
7 64
.67
67.3
3 ab
1.
2167
2.
91
bc
83.7
3 10
22.0
3 b
Hig
h T
emik
42
.67
37
4.63
30
.47
6.17
74
.52
65
68 a
1.
1667
2.
94
ab
83.2
99
1.02
b
Low
T
elon
e 42
.67
36.6
7 4.
67
29.9
3 5.
33
74.5
5 66
68
.33
a 1.
15
2.87
c
83.0
5 11
02.1
7 ab
H
igh
Tel
one
41
37.3
3 4.
53
30.5
2 6.
5 74
.88
65.6
7 67
.67
a 1.
1667
2.
92
abc
83.3
2 11
68.8
6 a
P v
alue
0.
3637
0.
6200
0.
4430
0.
2428
0.
5408
0.
7340
0.
3804
0.
0442
0.
9918
0.
0371
0.
5687
0.
0179
a C
otto
n fi
ber q
ualit
y pr
oper
ties.
b St
aple
leng
th (3
2nds
of a
n in
ch).
c The
per
cent
of t
he s
ampl
e su
rfac
e co
vere
d by
tras
h pa
rtic
les
as d
eter
min
ed b
y im
age
anal
ysis
d D
ata
for t
wo
man
agem
ent z
ones
was
poo
led
whe
n no
sig
nifi
cant
inte
ract
ion
occu
rred
. e Z
one
1 =
low
-ris
k zo
ne; Z
one
2 =
high
-ris
k zo
ne.
f LSD
(0.0
5) c
ompa
riso
ns a
mon
g tr
eatm
ents
with
in a
tria
l. M
eans
in a
col
umn
follo
wed
by
the
sam
e le
tter a
re n
ot s
igni
fica
ntly
dif
fere
nt.
g Low
Tem
ik =
3.3
6 kg
/ha;
Hig
h T
emik
= 6
.72
kg/h
a; L
ow T
elon
e =
28.1
0 L
/ha;
Hig
h T
elon
e =
56.1
2 L
/ha.

86
Tab
le 3
.7. E
ffec
t of n
emat
icid
es o
n co
tton
yiel
d an
d fi
ber q
ualit
y at
Win
dhau
sen
farm
s ac
ross
all
sam
plin
g pl
ots
in 2
008
and
2009
. Y
ear
Tre
atm
ent
Col
or g
rade
a St
aple
(3
2nds
)b M
icro
nair
e St
reng
th
(g/te
x)
Lea
f gr
ade
Ref
lect
ance
Y
ello
wne
ss
Tra
sh
(%)c
Len
gth
(cm
) U
nifo
rmity
(%
)
Lin
t yi
eld
(kg/
ha)
----
----
----
----
----
----
----
- Po
oled
dat
ad ---
----
----
----
----
----
----
---
2008
Low
g T
emik
44
.68
35.9
5 4.
37
30.1
3 6.
95
75.2
2 ae
63.5
8 1.
50
b 2.
83
82.0
7 11
19.6
b
Hig
h T
emik
45
.00
35.7
5 4.
33
29.8
7 6.
90
74.6
8 ab
64
.15
1.60
ab
2.
82
81.7
6 10
94.7
b
Low
T
elon
e 45
.00
36.0
5 4.
35
30.5
6 6.
85
74.5
3 ab
64
.70
1.71
ab
2.
85
82.2
1 11
01.5
b
Hig
h T
elon
e 46
.56
35.8
9 4.
39
29.7
0 7.
22
74.0
7 b
64.6
7 1.
81
a 2.
83
81.7
8 12
07.1
a
P v
alue
0.
673
0.71
9 0.
890
0.07
3 0.
184
0.03
5 0.
419
0.03
6 0.
327
0.22
6 0.
047
Zon
e 1f
Zon
e 2
Pool
ed
data
Z
one
1 Z
one
2 Z
one
1 Z
one
2 Po
oled
dat
a Z
one
1 Z
one
2 --
----
Poo
led
data
----
--
2009
Low
T
emik
47
.67
42.6
7 36
.92
4.55
4.
17
b 29
.62
a 29
.28
6.83
75
.04
60.1
7 64
.17
a 1.
38
2.92
83
.06
1391
.5
a H
igh
Tem
ik
42.6
7 44
.33
36.6
7 4.
32
4.33
ab
29
.80
a 28
.65
6.83
75
.03
63.1
7 62
.17
a 1.
42
2.91
83
.00
1372
.3
a L
ow
Tel
one
44.3
3 44
.33
36.4
2 4.
30
4.52
a
28.3
7 b
28.9
3 6.
67
75.1
6 63
.33
61.3
3 ab
1.
36
2.89
82
.02
1335
.7
a H
igh
Tel
one
41.0
0 47
.67
37.0
8 4.
28
4.58
a
29.2
8 a
29.7
8 6.
42
75.0
3 65
.33
59.1
7 b
1.18
2.
94
82.6
6 12
65.4
b
P v
alue
0.
078
0.30
3 0.
081
0.07
6 0.
017
0.00
6 0.
063
0.47
6 0.
895
0.05
8 0.
023
0.05
3 0.
063
0.06
0 0.
002
a Cot
ton
fibe
r qua
lity
prop
ertie
s.
b St
aple
leng
th (3
2nds
of a
n in
ch).
c The
per
cent
of t
he s
ampl
e su
rfac
e co
vere
d by
tras
h pa
rtic
les
as d
eter
min
ed b
y im
age
anal
ysis
d D
ata
for t
wo
man
agem
ent z
ones
was
poo
led
whe
n no
sig
nifi
cant
inte
ract
ion
occu
rred
. e L
SD(0
.05)
com
pari
sons
am
ong
trea
tmen
ts w
ithin
a tr
ial.
Mea
ns in
a c
olum
n fo
llow
ed b
y th
e sa
me
lette
r are
not
sig
nifi
cant
ly d
iffe
rent
. f Z
one
1 =
low
-ris
k zo
ne; Z
one
2 =
high
-ris
k zo
ne.
g Low
Tem
ik =
3.3
6 kg
/ha;
Hig
h T
emik
= 6
.72
kg/h
a; L
ow T
elon
e =
28.1
0 L
/ha;
Hig
h T
elon
e =
56.1
2 L
/ha.

87
Tab
le 3
.8. E
ffec
t of n
emat
icid
es o
n co
tton
yiel
d an
d fi
ber q
ualit
y ac
ross
the
entir
e fi
eld
at P
erry
man
farm
in 2
008
and
2009
. Y
ear
Tre
atm
ent
Col
or
grad
ea St
aple
(3
2nds
)b M
icro
nair
e St
reng
th
(g/te
x)
Lea
f gr
ade
Ref
lect
ance
Y
ello
wne
ss
Tra
sh
(%)c
Len
gth
(cm
) U
nifo
rmity
(%
)
Lin
t yi
eld
(kg/
ha)
2008
AE
RIS
29
.333
32
.833
3 5.
2333
28
.516
7 2.
8333
81
.016
7 73
.666
7 0.
1666
7 2.
616
80.9
333
505.
6 bd
AV
ICT
A
29.3
33
33
5.2
29.2
333
3 80
.633
3 73
.666
7 0.
2 2.
625
81.1
53
9.77
b
Low
e T
emik
28
.143
32
.857
1 5.
1286
28
.528
6 3
81.1
73
.714
3 0.
2142
9 2.
609
80.6
857
632.
4 ab
Hig
h T
emik
31
32
.857
1 5.
1571
28
.914
3 2.
8571
80
.8
73
0.17
143
2.61
6 80
.814
3 62
8.02
ab
L
ow
Tel
one
28.1
43
33.1
429
5.22
86
28.8
286
2.85
71
80.8
143
73
0.2
2.62
3 80
.971
4 69
2.28
a
Hig
h T
elon
e 28
.143
32
.857
1 5.
2429
28
.514
3 3
80.7
714
72.2
857
0.17
143
2.60
9 81
.000
0 75
1.75
a
P v
alue
0.
77
0.98
0.
89
0.79
0.
89
0.90
0.
35
0.43
0.
9909
0.
74
0.00
63
2009
AE
RIS
41
a
36.8
4.
58
30.1
0 ab
2.
8 77
.02
b 72
.6
0.32
2.
885
82.3
96
5.2
b A
VIC
TA
31
c
36.4
4.
58
30.3
4 a
2.8
78.1
8 a
75.6
0.
36
2.88
5 82
.2
958.
8 b
Low
Tem
ik
33 b
c 36
.8
4.52
30
.86
a 3
77.6
0 ab
76
0.
32
2.91
1 82
.34
981.
3 b
Hig
h T
emik
33
bc
36.6
4.
64
30.5
0 a
3 77
.48
ab
76.4
0.
4 2.
891
82.1
8 97
6.0
b
Low
T
elon
e 35
bc
36.8
4.
66
29.8
8 ab
2.
8 77
.62
ab
75
0.3
2.88
0 81
.96
1105
.8 a
Hig
h T
elon
e 37
ab
36
4.78
28
.98
b 2.
8 77
.42
b 73
.6
0.32
2.
850
81.7
2 11
27.7
a
P v
alue
0.
0107
0.
1486
0.
1344
0.
0788
0.
8439
0.
0983
0.
1536
0.
8063
0.
3041
0.
3556
0.
0081
a C
otto
n fi
ber q
ualit
y pr
oper
ties.
b St
aple
leng
th (3
2nds
of a
n in
ch).
c The
per
cent
of t
he s
ampl
e su
rfac
e co
vere
d by
tras
h pa
rtic
les
as d
eter
min
ed b
y im
age
anal
ysis
d L
SD(0
.05)
com
pari
sons
am
ong
trea
tmen
ts w
ithin
a tr
ial.
Mea
ns in
a c
olum
n fo
llow
ed b
y th
e sa
me
lette
r are
not
sig
nifi
cant
ly d
iffe
rent
. e L
ow T
emik
= 3
.36
kg/h
a; H
igh
Tem
ik =
6.7
2 kg
/ha;
Low
Tel
one
= 28
.10
L/h
a; H
igh
Tel
one
= 56
.12
L/h
a.

88
Tab
le 3
.9. E
ffec
t of n
emat
icid
es o
n co
tton
yiel
d an
d fi
ber q
ualit
y ac
ross
ent
ire
fiel
ds a
t Win
dhau
sen
farm
s in
200
8 an
d 20
09.
Yea
r T
reat
men
t C
olor
gr
adea
Stap
le
(32n
ds)b
Mic
rona
ire
Stre
ngth
(g
/tex)
L
eaf
grad
e R
efle
ctan
ce
Yel
low
ness
T
rash
(%
)c L
engt
h (c
m)
Uni
form
ity
(%)
Lin
t yie
ld
(kg/
ha)
2008
Low
e T
emik
27
.84
35.3
7 4.
46
29.9
4 3.
00
81.1
7 74
.32
abd
0.22
2.
80
81.6
7 97
8.65
b
Hig
h T
emik
29
.00
35.3
5 4.
49
30.3
8 2.
95
80.9
2 74
.00
b 0.
23
2.79
81
.47
991.
63 b
Low
T
elon
e 28
.14
35.2
9 4.
51
30.3
4 2.
95
80.9
5 74
.95
ab
0.21
2.
79
81.4
8 10
68.8
6 a
Hig
h T
elon
e 27
.50
35.5
0 4.
50
30.2
5 3.
00
80.8
3 75
.60
a 0.
25
2.81
81
.71
1075
.77
a
P v
alue
0.
7675
0.
7381
0.
6251
0.
2525
0.
7233
0.
1937
0.
0100
0.
5937
0.
7851
0.
6141
<.
0001
2009
Low
T
emik
33
.5
36.2
5 4.
45
29.0
5 3.
00
78.8
0 a
71.7
5 0.
25
2.87
81
.03
1196
.46
Hig
h T
emik
31
.0
36.0
0 4.
45
29.6
5 2.
75
78.9
8 a
72.2
5 0.
38
2.87
80
.93
1175
.99
Low
T
elon
e 36
.0
35.8
3 4.
50
28.6
5 3.
00
77.5
7 b
73.8
3 0.
40
2.84
81
.17
1196
.46
Hig
h T
elon
e 38
,5
35.5
0 4.
68
28.3
8 3.
00
78.5
1 a
69.7
5 0.
30
2.82
81
.40
1188
.53
P v
alue
0.
2531
0.
3742
0.
5523
0.
0992
0.
7930
0.
0226
0.
2889
0.
3695
0.
7237
0.
3748
0.
1988
a C
otto
n fi
ber q
ualit
y pr
oper
ties.
b St
aple
leng
th (3
2nds
of a
n in
ch).
c The
per
cent
of t
he s
ampl
e su
rfac
e co
vere
d by
tras
h pa
rtic
les
as d
eter
min
ed b
y im
age
anal
ysis
d L
SD(0
.05)
com
pari
sons
am
ong
trea
tmen
ts w
ithin
a tr
ial.
Mea
ns in
a c
olum
n fo
llow
ed b
y th
e sa
me
lette
r are
not
sig
nifi
cant
ly d
iffe
rent
. e L
ow T
emik
= 3
.36
kg/h
a; H
igh
Tem
ik =
6.7
2 kg
/ha;
Low
Tel
one
= 28
.10
L/h
a; H
igh
Tel
one
= 56
.12
L/h
a.

89
Table 3.10. Eigenvectors of principal components and explanatory variables for Perryman and Windhausen East and West farms in 2008.
Explanatory variable Prin1 Prin2 Prin3 Prin4 Prin5 Shoot height 1st 0.347a 0.078 0.183 0.076 0.069 Shoot height 2nd 0.13 0.058 -0.185 0.615 -0.051 Number of nodes 0.31 0.122 0.255 -0.182 0.108 Height-to-node ratio 0.238 -0.045 -0.046 0.431 -0.034 Fresh weight 0.345 0.087 0.148 0.041 0.05 Dry weight 0.337 0.088 0.189 0.028 0.036 Root weight 1st 0.335 0.074 0.179 -0.089 0.159 Root weight 2nd 0.142 0.13 0.051 0.173 0.14 Root gall rating 1st -0.263 0.295 0.174 0.083 0.202 Root gall rating 2nd -0.237 0.297 0.175 0.128 0.185 Egg counts 1st -0.208 0.267 0.221 -0.145 0.108 Egg counts 2nd -0.228 0.236 0.103 0.162 0.173 Nematode counts 1st 0.058 0.099 0.382 -0.158 -0.367 Nematode counts 2nd -0.109 0.311 0.166 0.323 0.062 Nematode counts 3rd -0.179 0.244 0.09 0.009 -0.309 Nematode counts 4th 0.026 0.172 0.175 -0.094 -0.538 Soil pH 0.018 0.25 -0.392 -0.142 -0.096 Soil Ca 0.155 0.4 -0.348 -0.072 -0.066 Soil K 0.022 0.247 -0.287 0.037 -0.222 Soil P 0.041 0.115 -0.179 -0.301 0.478 Soil Mg 0.222 0.377 -0.227 -0.172 -0.011
a Eigenvectors with an absolute value >0.25 are bold-faced.
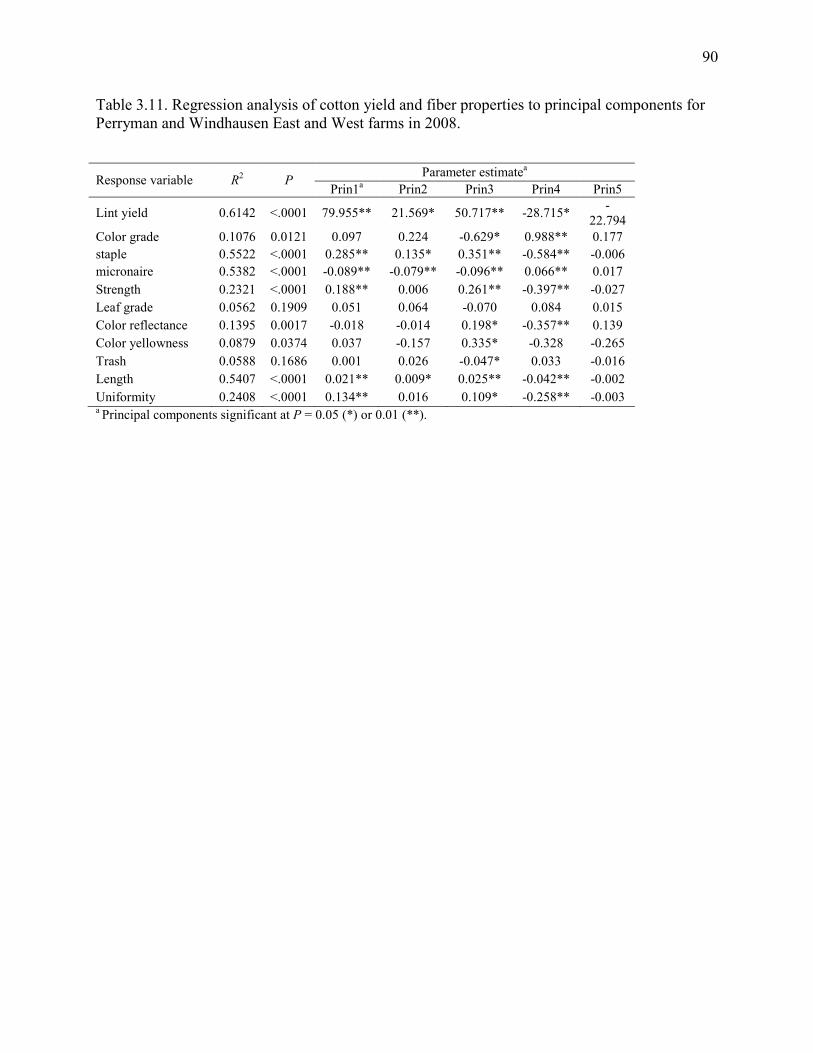
90
Table 3.11. Regression analysis of cotton yield and fiber properties to principal components for Perryman and Windhausen East and West farms in 2008.
Response variable R2 P Parameter estimatea
Prin1a Prin2 Prin3 Prin4 Prin5
Lint yield 0.6142 <.0001 79.955** 21.569* 50.717** -28.715* -22.794
Color grade 0.1076 0.0121 0.097 0.224 -0.629* 0.988** 0.177 staple 0.5522 <.0001 0.285** 0.135* 0.351** -0.584** -0.006 micronaire 0.5382 <.0001 -0.089** -0.079** -0.096** 0.066** 0.017 Strength 0.2321 <.0001 0.188** 0.006 0.261** -0.397** -0.027 Leaf grade 0.0562 0.1909 0.051 0.064 -0.070 0.084 0.015 Color reflectance 0.1395 0.0017 -0.018 -0.014 0.198* -0.357** 0.139 Color yellowness 0.0879 0.0374 0.037 -0.157 0.335* -0.328 -0.265 Trash 0.0588 0.1686 0.001 0.026 -0.047* 0.033 -0.016 Length 0.5407 <.0001 0.021** 0.009* 0.025** -0.042** -0.002 Uniformity 0.2408 <.0001 0.134** 0.016 0.109* -0.258** -0.003 a Principal components significant at P = 0.05 (*) or 0.01 (**).

91
Table 3.12. Eigenvectors of principal components and explanatory variables for Perryman and Windhausen East and West farms in 2008.
Explanatory variable Prin1 Prin2 Prin3 Prin4 Prin5 Prin6 Prin7
Shoot height 1st 0.270 0.105 -0.107 0.028 0.120 0.193 0.034
Shoot height 2nd 0.195 0.094 -0.163 0.269 0.047 0.019 0.016
Shoot height 3rd 0.151 0.141 -0.137 0.288 0.058 -0.060 0.110
Number of nodes 1st 0.198 0.190 -0.147 -0.029 0.107 0.135 0.001
Number of nodes 2nd -0.040 0.261 -0.156 0.243 -0.080 -0.169 0.003
Height-to-node 1st 0.121 0.204 0.097 -0.022 -0.002 -0.070 0.003
Height-to-node 2nd 0.193 -0.205 0.046 -0.064 0.128 0.189 -0.015
Fresh weight 0.254 0.141 -0.144 0.004 0.115 0.153 -0.035
Dry weight 0.270 0.117 -0.119 0.009 0.114 0.138 0.027
Root weight 1st 0.283 0.079 -0.105 -0.047 0.094 0.138 0.040
Root weight 2nd 0.059 0.036 -0.125 -0.006 0.120 0.041 -0.028
Nodes above white flower 1st -0.037 0.211 -0.029 0.255 -0.094 -0.129 -0.219
Nodes above white flower 2nd -0.206 0.152 -0.069 -0.086 0.000 -0.037 -0.146
Root gall rating 1st -0.067 -0.150 0.249 0.036 0.128 0.059 0.187
Root gall rating 2nd -0.151 -0.108 0.201 0.167 0.243 0.169 0.202
Egg counts 1st -0.070 -0.126 0.133 0.088 0.214 -0.105 0.393
Egg counts 2nd -0.130 0.012 0.166 0.198 0.050 0.232 0.050
Nematode counts 1st -0.116 -0.082 -0.139 0.065 0.102 0.281 0.119
Nematode counts 2nd -0.090 -0.035 0.015 0.212 -0.068 0.300 -0.245
Nematode counts 3rd -0.156 0.030 0.101 0.199 0.006 0.244 -0.271
Nematode counts 4th -0.090 0.034 0.053 0.286 0.057 0.225 -0.171
Leaf Ca -0.046 0.118 0.245 0.023 0.118 -0.234 -0.008
Leaf K 0.051 0.148 0.103 0.102 0.191 -0.099 0.181
Leaf Mg -0.094 -0.064 0.141 0.251 -0.135 -0.034 -0.110
Leaf N -0.259 0.145 -0.085 -0.109 0.073 -0.032 -0.058
Leaf P -0.180 0.122 -0.150 -0.187 -0.035 0.046 0.115
Leaf S -0.111 -0.022 -0.017 -0.022 0.289 0.084 0.030
Leaf Al 0.097 -0.077 0.111 -0.012 0.408 -0.238 -0.354
Leaf B 0.226 -0.180 0.160 -0.071 0.051 -0.055 -0.041
Leaf Cu -0.237 0.189 -0.139 -0.017 0.023 -0.073 0.012
Leaf Fe -0.036 -0.051 0.037 -0.137 0.477 -0.198 -0.375
Leaf Mn -0.223 -0.012 -0.223 0.023 0.187 -0.012 0.132
Leaf Na 0.117 -0.153 0.136 0.269 -0.192 -0.121 0.036
Leaf Zn -0.104 0.089 -0.153 -0.322 -0.076 0.034 -0.021
Soill bc 0.056 0.204 0.036 0.231 0.086 -0.202 -0.005
Soil pH 0.018 0.184 0.285 -0.169 -0.068 0.238 -0.042
Water pH 0.018 0.184 0.285 -0.169 -0.068 0.238 -0.042

92
Soil Ca -0.030 0.288 0.220 -0.052 -0.003 0.015 0.026
Soil K -0.014 0.248 0.140 -0.049 0.198 0.157 0.033
Soil Mg -0.086 0.297 0.179 -0.024 0.003 0.062 -0.078
Soil Mn -0.214 0.096 -0.141 0.077 0.220 0.047 0.262
Soil P 0.166 0.125 0.237 -0.115 -0.082 -0.073 0.148
Soil Zn 0.053 0.231 0.167 0.001 -0.029 -0.167 0.227 a Eigenvectors with an absolute value >0.20 are bold-faced.

93
Table 3.13. Regression analysis of cotton yield and fiber properties to principal components for Perryman and Windhausen East and West farms in 2009. Response variable R2 P
Parameter estimatesa Prin1a Prin2 Prin3 Prin4 Prin5 Prin6 Prin7
Lint yield 0.6480 <.0001 -36.078** 27.621** -22.212** -2.084 13.001 15.802 3.538 Color grade 0.0484 0.8091 -0.047 0.237 -0.039 0.245 -0.339 -0.172 0.322 staple 0.1182 0.2195 0.007 -0.066* 0.019 0.052 0.064 -0.005 0.071 micronaire 0.2211 0.0087 0.025** -0.021* 0.017 -0.029 -0.027 0.016 -0.022 Strength 0.2639 0.0016 0.115** -0.105** 0.063 0.090 -0.030 0.040 0.104 Leaf grade 0.2642 0.0016 -0.096** 0.045 -0.063 0.138** -0.040 0.109 0.062 Color reflectance 0.1690 0.0518 -0.120* -0.026 -0.018 -0.167* 0.128 0.081 -0.148 Color yellowness 0.3370 <.0001 0.561** -0.045 0.306* 0.161 -0.089 -0.329 0.520 Trash 0.1816 0.0345 -0.018 0.029** 0.006 0.032 -0.009 -0.010 0.024 Length 0.1073 0.2858 0.000 -0.004 0.003 0.006 0.001 0.001 0.005 Uniformity 0.1839 0.0320 0.077* -0.085* 0.076 0.023 0.136 -0.062 0.108 a. Principal components significant at P = 0.05 (*) or 0.01 (**).

94
Tab
le 3
.14.
Eff
ect o
f dif
fere
nt ty
pes
and
rate
s of
nem
atic
ides
on
cotto
n lin
t pri
ce ($
/lb) a
t Per
rym
an a
nd W
indh
ause
n W
est a
nd
Win
dhau
sen
Eas
t fie
lds
in 2
008
and
2009
.
Tre
atm
ent (
acre
-1)
PMa 0
8
PM 0
9
WW
08
W
W 0
9
WE
08
W
E 0
9 Z
one1
b Z
one2
Zon
e1
Zon
e2
Z
one1
Z
one2
Zon
e1
Zon
e2
Z
one1
Z
one2
Zon
e1
Zon
e2
AE
RIS
0.
56
0.56
0.61
0.
61
-
-
- -
-
-
- -
AV
ICT
A
0.55
0.
55
0.
63
0.60
- -
-
-
- -
-
- L
ow T
emik
0.
58
0.56
0.63
0.
61
0.
60
0.59
0.58
0.
61
0.
59
0.60
0.58
0.
61
Hig
h T
emik
0.
59
0.56
0.62
0.
62
0.
57
0.60
0.59
0.
59
0.
58
0.57
0.60
0.
59
Low
Tel
one
0.56
0.
56
0.
62
0.59
0.59
0.
60
0.
61
0.57
0.59
0.
60
0.
58
0.60
H
igh
Tel
one
0.57
0.
55
0.
61
0.63
0.59
0.
59
0.
59
0.60
0.58
0.
58
0.
62
0.61
P
val
ue
0.28
0.
94
0.
98
0.53
0.54
0.
90
0.
12
0.63
0.75
0.
28
0.
22
0.43
a PM
= P
erry
man
; WW
= W
indh
ause
n W
est;
WE
= W
indh
ause
n E
ast.
b Zon
e 1
= lo
w-r
isk
zone
; Zon
e 2
= hi
gh-r
isk
zone
.

95
Tab
le 3
.15.
Eff
ect o
f dif
fere
nt ty
pes
and
rate
s of
nem
atic
ides
on
adju
sted
reve
nue
at P
erry
man
and
Win
dhau
sen
Wes
t and
Eas
t fie
lds
in 2
008
and
2009
. T
reat
men
t (ac
re-1
) PM
a 08
PM 0
9
WW
08
W
W09
WE
08
W
E09
Z
one1
b Z
one2
Z
one1
Z
one2
Zon
e1
Zon
e2
Z
one1
Z
one2
Zon
e1
Zon
e2
Z
one1
Z
one2
A
ER
IS
227.
3 14
9.5
42
1.6
451.
0
- -
-
-
- -
-
- A
VIC
TA
12
7.7
182.
2
400.
6 45
2.3
-
-
- -
-
-
- -
Low
Tem
ik
300.
3 18
3.8
46
4.9
456.
4
510.
3 51
1.8
5
85.5
ac
666.
8 a
46
8.6
461.
7
600.
0 a
645.
6 a
Hig
h T
emik
29
7.0
231.
2
405.
6 46
3.4
44
4.9
444.
0
579.
4 a
624.
8 a
48
2.2
426.
4
601.
2 a
588
.2 a
b L
ow T
elon
e 24
6.8
164.
1
421.
6 45
3.1
48
3.7
406.
6
540
.3 a
b 50
9.6
b
491.
4 34
8.6
55
4.9
a 55
5.6
b H
igh
Tel
one
236.
7 16
5.9
46
0.9
435.
0
441.
6 42
9.5
48
2.5
b 45
7.0
b
417.
3 41
8.1
46
8.8
b 50
7.5
b P
val
ue
0.10
29
0.95
02
0.
7243
0.
9951
0.41
05
0.12
52
0.
0412
0.
0025
0.14
99
0.07
86
0.
0078
0.
0405
a PM
= P
erry
man
; WW
= W
indh
ause
n W
est;
WE
= W
indh
ause
n E
ast.
b Zon
e 1
= lo
w-r
isk
zone
; Zon
e 2
= hi
gh-r
isk
zone
. c L
SD(0
.05)
com
pari
sons
am
ong
trea
tmen
ts w
ithin
a tr
ial.
Mea
ns in
a c
olum
n fo
llow
ed b
y th
e sa
me
lette
r are
not
sig
nifi
cant
ly d
iffe
rent
.

96
Figu
re 3
.1 E
xper
imen
tal d
esig
n m
aps
of P
erry
man
farm
, Win
dhau
sen
Eas
t far
m a
nd W
indh
ause
n W
est f
arm
(fro
m le
ft to
righ
t) in
20
08. L
ow- a
nd h
igh-
risk
zon
es a
re in
dica
ted
by g
reen
and
red
colo
ring
, res
pect
ivel
y. S
ampl
ing
plot
s ar
e re
pres
ente
d by
3-d
igit
num
bers
, with
the
firs
t dig
it co
rres
pond
ing
to z
one,
the
seco
nd d
igit
corr
espo
ndin
g to
trea
tmen
t, an
d th
e th
ird
num
ber c
orre
spon
ding
to
repl
icat
ion.
All
sam
plin
g pl
ots
wer
e co
mpl
etel
y ra
ndom
ized
with
in e
ach
man
agem
ent z
one,
and
trea
tmen
ts w
ere
appl
ied
in s
trip
s ac
ross
the
entir
e fi
eld.
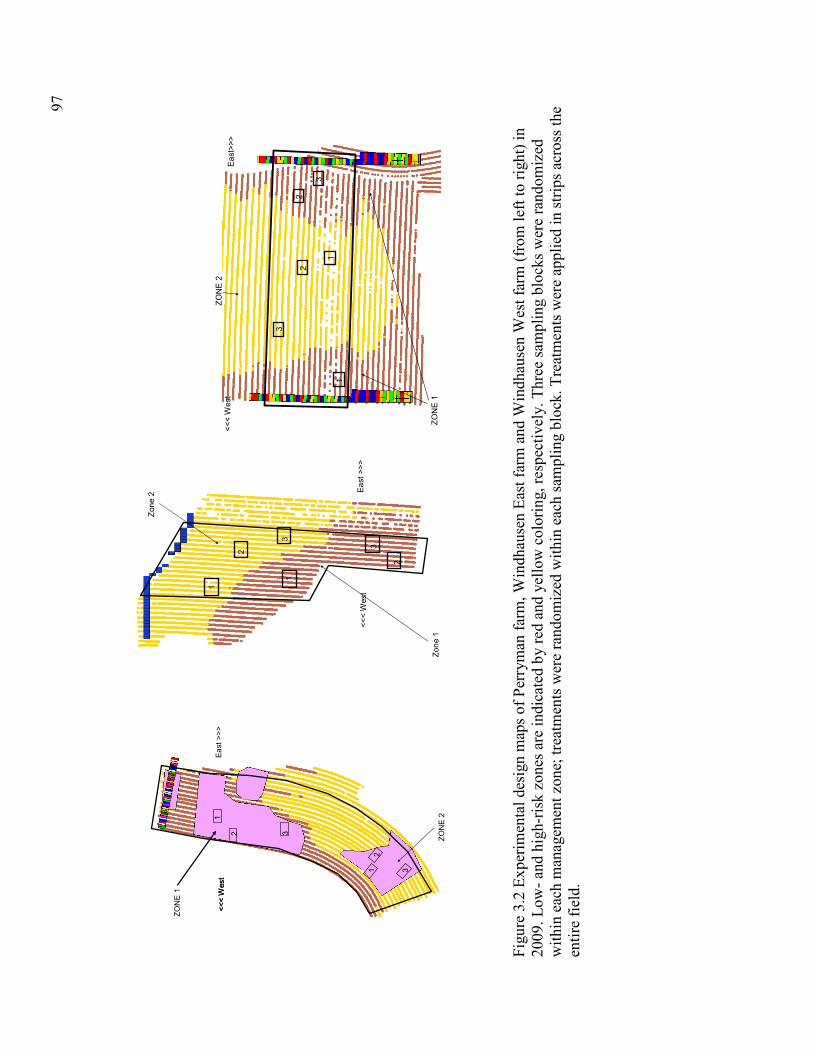
97
<<< West
2
1
3
12
3
ZONE 1
ZONE 2
<<< West
East >>>
<<< West
East >>>
1
2
31
2
3
Zone 2
Zone 1
<<< West
East>>>
ZONE 1
ZONE 2
1
2
31
2
3
Figu
re 3
.2 E
xper
imen
tal d
esig
n m
aps
of P
erry
man
farm
, Win
dhau
sen
Eas
t far
m a
nd W
indh
ause
n W
est f
arm
(fro
m le
ft to
righ
t) in
20
09. L
ow- a
nd h
igh-
risk
zon
es a
re in
dica
ted
by re
d an
d ye
llow
col
orin
g, re
spec
tivel
y. T
hree
sam
plin
g bl
ocks
wer
e ra
ndom
ized
w
ithin
eac
h m
anag
emen
t zon
e; tr
eatm
ents
wer
e ra
ndom
ized
with
in e
ach
sam
plin
g bl
ock.
Tre
atm
ents
wer
e ap
plie
d in
str
ips
acro
ss th
e en
tire
fiel
d.

98
CHAPTER 4
EFFECT OF SOUTHERN ROOT KNOT NEMATODE (MELOIDOGYNE INCOGNITA)
ON COTTON GROWTH, YIELD, AND FIBER QUALITY WITH DIFFERENT
VARIETIES AND THE ECONOMIC IMPACT OF M. INCOGNITA ON COTTON
PRODUCTION1
1 Lu, P., Kemerait, R. C., Jr., Davis, R. F., and Perry, C. To be submitted to Journal of Nematology.

99
4.1 Abstract:
On two farms in southern Georgia, nematicides and cotton varieties were evaluated to
further assess the impact of Meloidogyne incognita on cotton growth, yield, and fiber quality.
The three chemical treatments used included Gaucho Grande seed treatment, Temik 15G and
Telone II. The two varieties were FiberMax 9063 B2F and Stoneville 4554 B2RF. In both fields,
populations of M. incognita were significantly reduced and plant growth was significantly
improved in plots fumigated with Telone II. Cotton lint yield was increased in plots fumigated
with Telone II at the Gibbs farm but not at the Nugent farm. Yields in plots treated with Temik
15G were usually not statistically different from yields obtained in plots where Gaucho Grande
seed treatment was used. Most fiber quality properties were not significantly or consistently
affected by nematicide treatments. Many fiber properties were significantly better in FiberMax
9063B2F than in Stoneville 4554 B2RF for both fields. The results of economical analysis
showed that fumigation with Telone II can be more profitable in fields with higher M. incognita
populations and an environment that is less than optimal for plant growth.
Keywords: Cotton, Economic impact, Fiber quality, Meloidogyne incognita, Southern root- knot nematode, Yield

100
4.2 Introduction
Cotton (Gossypium hirsutum L.), is an oilseed and fiber crop. It is grown in more than 70
countries and is the single most important fiber crop worldwide. No crop competes with it in the
potential of value-added processing (Basra, 1999). Cotton is also one of the oldest cultivated
crops. It has been associated with human activity since before recorded history.
The U.S. is the third-largest producer of cotton in the world. Cotton production in the U.S.
has increased 66% in the past 40 years (Mitchell, 2009). In recent years, the U.S. has produced
about 20% of the world's annual supply (Mitchell, 2009).
Root knot nematodes occur worldwide and attack a diversity of crops. They cause
considerable losses of yield and affect the quality of the product, either by directly damaging
plants (Kirkpatrick and Sasser, 1984), or by predisposing them to infection by fungal and
bacterial pathogens (Powell, 1971).
The southern root knot nematode [Meloidogyne incognita (Kofoid & White) Chitwood]
is found in all cotton production regions in the U.S. and is the most widely distributed nematode
parasite of economic importance of the crop (Thomas and Kirkpatrick, 2001). It is considered the
major yield-limiting plant-parasitic nematode across the U.S. Cotton Belt; approximately twice
as much yield loss is attributed to M. incognita than to all other nematode parasites of the crop
(Koenning et al., 2004). The estimated yield loss of cotton caused by M. incognita in the U.S.
was 2.4% in 2007, which was greater than for any other cotton disease. This damage resulted in a
loss of more than 106,000,000 kg of lint (Cotton Disease Loss Committee, 2008). In Georgia in
2007, M. incognita caused an estimated 6% reduction in yield resulting in a loss of 25,000,000
kg of lint (Cotton Disease Loss Committee, 2008).

101
Damage caused by plant-parasitic nematodes is distinct from other plant diseases because
there are no unique symptoms on the above-ground portions of the plants. Nematodes are often
unevenly distributed in the soil; therefore the symptoms associated with damage from nematodes
may occur in irregular patches in the field (Beltwide Cotton Committee, 2003). These patches
can be either small and limited in number, or large and widely distributed. Damaged plants may
exhibit symptoms ranging from mild to severe stunting depending on the level of infestation, and
a reduced rate of development. Foliage may also show symptoms of nutritional deficiency
(Kirkpatrick et al. 1995). In the most severe cases, plants may die before maturation. The
nematodes also interact with the Fusarium wilt pathogen (Fusarium oxysporum f.sp.
vasinfectum), which leads to wilting and brown discoloration or necrosis of the vascular tissue of
the lower stem (Beltwide Cotton Committee, 2003).
Below-ground symptoms caused by M. incognita on cotton can be much more diagnostic
than above-ground symptoms. Visible galls or “knots” often appear on cotton roots (Bridge and
Page, 1980). Swellings of the infected root tissue can be found on the cotton tap root and the
lateral roots; however, the galls on cotton may not be as easy to observe as those on vegetable
crops such as tomatoes. Galls are easier to detect if cotton plants are carefully dug (not pulled)
from the soil. Also, the fine lateral roots need to be handled carefully when rinsed with water to
remove soil (Beltwide Cotton Committee, 2003).
The tap root and its lateral roots are of vital importance to the cotton plant. A few galls on
these roots can disrupt the normal flow of water and nutrients to the leaves and developing bolls,
which can significantly reduce the yield of cotton (Bird and Loveys, 1975; Kirkpatrick et al.,
1991; McClure, 1977).
102
Previous research has focused on the management of M. incognita to improve cotton
yield. Very little data has documented the impact of M. incognita on cotton fiber quality.
However, cotton fiber quality is a very important issue to the growers and to the textile industry.
Fiber quality is a set of measurements that describe a sample of fibers extracted from a bale of
cotton (Bradow and Davidonis, 2000). These measurements include length, uniformity, strength,
micronaire, color grade, trash, leaf grade, preparation, and extraneous matter (USDA, 2001).
They are compared with a set of standards from the U.S. Department of Agriculture (USDA) and
are used to determine price premiums and discounts.
In recent years, cotton lint quality has become increasingly important because of the
requirements from textile mills for fiber quality, the use of high-volume instrument (HVI) testing,
the occurrence of discounts due to unfavorable fiber characteristics, and depressed cotton
markets (Silvertooth, 1999). Georgia is the third-largest cotton producer in the U.S. In the 1990s
and early 21st century, Georgia-produced cotton had the fiber quality second only to that
produced in California, but now certain fiber quality parameters have not only fallen below
levels found in western U.S cotton, but also below the average fiber quality of other southern and
southeastern states (Bradow and Davidonis, 2000).
There are four general phases in cotton fiber development: 1) initiation, 2) elongation, 3)
thickening, and 4) desiccation (maturation). Fiber length is determined in the elongation stage,
which occurs about 21 days after flowering. During this stage, a thin cell wall of carbohydrate
polymers is deposited allowing the fiber to elongate (DeLanghe, 1986). Water pressure inside the
developing fiber has an influence on fiber elongation through regulating the deposition of
carbohydrate polymers (Bradow and Davidonis, 2000). Therefore, if stresses occur during this
stage (which would be typically associated with water stress or potassium deficiency), fiber

103
length can be reduced (Silvertooth, 1999). To some degree, fiber strength and uniformity can
also be influenced by these same stresses (Bradow and Davidonis, 2000).
The thickening process of cotton fibers may overlap with elongation to some extent.
During this stage, a series of carbohydrates produced through photosynthesis are deposited on
the interior walls of the fiber, which increases the value of micronaire (Silvertooth, 1999). If this
development is stopped prematurely, the micronaire value will decrease and finer fibers will
occur. New bolls that are set on the plant usually have some of the greatest demand for
carbohydrates. These bolls draw carbohydrates from the older bolls, which prevents the
development of high-micronaire fibers on older bolls (Silvertooth, 1999).
The maturation of fiber occurs after the boll has opened and the metabolically inactive
fibers dry. There is no quality measurement directly related to the maturation process. The fiber
quality within a boll is at its utmost on the day of boll opening (Bradow and Davidonis, 2000).
Therefore, harvesting should be as close to physiological maturity as possible to enhance the
quality of the crop produced.
Environmental and management factors can significantly alter cotton fiber quality. For
example, reduced light (cloudy) conditions result in the production of weaker fiber with reduced
micronaire (Pettigrew, 2001). Early defoliation can also reduce micronaire in cotton (Snipes and
Baskin, 1994).
Biological factors such as plant-pathogenic fungi and pests have also been studied.
Cotton root rot, caused by the soilborne fungus Phymatotrichum omnivorum, can reduce fiber
length and fineness significantly (Mulrean, 1984). It has also been well documented that by
feeding on cotton bolls, stink bugs can decrease fiber quality as indicated by a reduction in
almost all HVI-measured variables (Roberts et al., 2005). Meloidogyne incognita, a root-feeding

104
plant parasite, is another factor that could potentially affect fiber quality. M. incognita draws
nutrients and water from cotton plants and exacerbates moisture, nutrient, or other kind of
stresses and also fungal infection, thus indirectly causing damage to fiber development.
In previous studies, several fiber properties were documented to be affected by moisture
and nutrient stress, reduced or delayed cotton growth, which in other studies, were associated
with infection by M. incognita.
Fiber length and staple can be influenced by several factors including variety,
temperature, water stress, nutrient deficiencies, and ginning practices (Bradow and Davidonis,
2000). Water relationships and irrigation practices have been studied primarily in relation to
yield. One study conducted in the early 1980s indicated that fiber length was not impacted until
water stress was such that yields were limited to less than 706.1 kg/ha (Grimes and Yamada,
1982). The interaction between M. incognita and water stress in cotton has also been studied.
The results indicated that in susceptible cultivars, infection by M. incognita may decrease the
movement of water from roots to leaves. The decrease in root flux caused by nematodes is equal
to that induced by severe water deficit stress (Kirkpatrick et al., 1991). Other studies have
demonstrated that water stress early in the bloom period had a less negative impact on fiber
length than water stress late in the bloom period (Hearn, 1976; Marani and Amirav, 1971;
Shimishi and Masani, 1971). Sensitivity of fiber elongation to severe water stress is apparently
due to the physiological and mechanical processes of cell expansion (Hearn, 1994). As M.
incognita infection gets more and more severe later in the season, the resulting water stress in the
cotton plant may lead to a reduction in fiber length.
The possible impact of M. incognita on fiber strength is not as direct as the impact on
fiber length. Firstly, fiber strength has a positive relationship with canopy sunlight absorption.

105
There is evidence that M. incognita can reduce plant leaf area, e.g., in tomato (Loveys and Bird,
1973). Therefore by reducing cotton leaf area, M. incognita may affect fiber strength. Secondly,
studies have indicated that heat accumulation during the flowering period can also affect fiber
strength. Fiber strength was greatest in bolls that developed from flowers produced during the
first 4 to 6 weeks of flowering. Flowers that opened during the latter 2 weeks of the flowering
period produced bolls with the lowest fiber strength (Jones and Wells, 1997). Therefore, M.
incognita may reduce fiber strength by delaying cotton development and flowering.
Authors in previous studies have suggested several factors that could influence fiber
micronaire. Significant differences in micronaire among commercially available varieties have
been examined. A fiber thickens as cellulose is deposited inside the fiber cell. Cellulose is
derived from photosynthetic carbon fixation. As fiber is thickened, the micronaire value
increases. If photosynthesis of cotton is affected by M. incognita, as confirmed in tomato plants
(Loveys and Bird, 1973), the lack of carbohydrate production may lead to a lower micronaire
value. However, a micronaire value that is too high can also result in loss of profit. It is
important for cotton to produce sufficient bolls later in the season to either compete for
carbohydrates or to produce sufficiently lower micronaire fiber. This fiber can be blended with
the higher micronaire fiber to reduce overall readings (Silvertooth, 1999). Therefore, the reduced
growth and boll setting in cotton caused by M. incognita (Kirkpatrick et al., 1995; Walker et al.,
1998) may affect the blended micronaire value.
As discussed before, water stress can be caused by M. incognita (Kirkpatrick et al., 1991).
In other studies, it has also been shown that water deficiency can affect some properties of cotton
fiber. Moisture stress later in the season was found to reduce fiber length and micronaire (Marani
and Amirav, 1971). A reduction in fiber length due to water stress was also observed in a

106
subsequent study. Although other characters were not consistently affected, the distribution of
bolls on the cotton plant was consistently and significantly affected by irrigation (Pettigrew,
2004).
Studies on the effect of M. incognita on nutrient concentrations in plants show that a
change in concentration of the nutrients is likely one of the first effects of the nematode on host
physiology. These changes in nutrient concentration alter host metabolism and contribute
directly or indirectly to the chlorosis and premature leaf abscission on soybean plants
(Melakeberhan et al., 1987). This is also true according to another study in soybean. The uptake
of nitrogen, phosphorus, and calcium was affected by M. incognita (Carneiro et al., 2002). Many
nutrients also have effects on fiber quality. For example, leaf nitrogen during the boll maturation
period had significant positive correlations with fiber length and negative correlations with
micronaire (Reddy et al., 2004). Potassium is also a very important element to cotton and has
positive correlations with fiber length, micronaire index, fiber strength, and fiber length
uniformity ratio (Cassman et al., 1990).
Approaches to effective nematode control include crop rotation, field sanitation, cover
crops, varietal resistance, and nematicides. Nematode population densities can be reduced by
selecting rotation crops that are not hosts to M. incognita, or by planting resistant cultivars (Rich
and Kinloch, 2005). To date, no M. incognita-resistant cultivar is commercially available.
Several cotton cultivars have been reported to have some level of tolerance to the Fusarium
wilt/M. incognita disease complex. However, these cultivars do not show significant resistance
to the nematodes, although some are resistant to Fusarium wilt (Beltwide Cotton Committee,
2003). Biological approaches for nematode control have been studied but have not been
thoroughly explored in cotton production systems (Starr et al., 2007).

107
Chemical nematicides are used widely to control M. incognita. Three nematicide
management strategies are currently applied widely in the U.S. (Koenning et al., 2004), including
the application of aldicarb at rate of 0.8-1.2 kg/ha in the planting furrow; preplant soil fumigation
using either 1,3-dichloropropene or metam-sodium (Starr et al., 2007); and the supplemental use
of either aldicarb applied as a side-dress during the first third of the season or a foliar application
of the carbamate oxamyl (Lawrence and Mclean, 2000, 2002). Out of all these strategies, at-
planting application of aldicarb is perhaps the most universal nematicide strategy in the U.S.
Aldicarb is applied on 20 to 30% of the cotton hectarage each year (Koenning, et al., 2004). In
severely infested fields, nematicides can reduce the nematode population by more than 50%
(Beltwide Cotton Committee, 2003). Using chemical nematicides can provide cotton with a zone
of protected soil in which roots can develop for 4 to 6 weeks with reduced damage from
nematodes. By protecting the crop during early development, yield losses can be reduced
substantially even though nematodes may penetrate the roots during the latter part of the season
(Beltwide Cotton Committee, 2003). Seed treatments have shown some promising results in
protecting emerging roots from nematode infection (Monfort et al., 2006), but may not be
sufficient in fields with high nematode population densities.
Greenhouse and field tests from previous chapters showed that M. incognita infection
significantly reduced cotton growth, certain physiological characters, and cotton lint yield. Fiber
quality was not significantly affected by M. incognita infection. Risk management zones did not
have significant effects or had significant interactions with nematicide treatments, which had
successfully created different levels of M. incognita infection with different types of nematicides.
However, in the study in Chapter 3, all fields were planted with one variety, PD 555. This variety
has no reported M. incognita resistance. In greenhouse test, however, resistant varieties had

108
better vegetative and reproductive growth, and resulted in significantly lower M. incognita
infection and reproduction on cotton roots. Therefore, it is valuable to quantify whether
resistance to M. incognita in cotton can lead to higher lint yield and fiber quality.
The objective of this chapter was to determine whether the effects of M. incognita
infection on cotton growth, yield, and fiber quality are different in two cotton cultivars that have
different levels of resistance to the pathogen.
4.3 Materials and Methods
The experiments were conducted at the Nugent farm in Coffee County, GA in 2008 and
at the Gibbs farm in Tift County, GA in 2009. These two fields were both under irrigation and
had histories of losses to M. incognita. The tillage method used at Nugent farm was conservation
tillage (strip-tillage into a killed rye cover crop), whereas conventional tillage (ripped and bedded)
was used at the Gibbs farm.
Two different varieties of cotton were planted, FiberMax 9063B2F and Stoneville
4554B2RF. FiberMax is highly susceptible to M. incognita infection, whereas Stoneville has
some level of tolerance to the M. incognita/ Fusarium wilt complex (Barfield, 2003; Phipps and
Eisenback, 2005). Three treatments were assessed to include: (T1) Gaucho Grande seed-applied
insecticide (1-[(6-Chloro-3-pyridinyl)methyl]-N-nitro-2-imidazolidinimine at 0.375 mg ai/ seed);
(T2) Temik 15G (aldicarb 6.72 kg/ha); and (T3) Telone II (1,3-dichloropropene 56.12 L/ha) +
Temik 15G (aldicarb 3.36 kg/ha). The 3lb/a Temik treatment in T3 was used along with Telone
II to provide thrips control. The decision to use these three treatments was based on the need to
establish different populations of nematodes in the field. Gaucho Grande would not affect the
nematode populations; Temik 15G at 6.72 kg/ha would offer some control; Telone II at 56.12

109
L/ha is too expensive for use in commercial cotton fields but should nearly eliminate nematodes
from a plot. All treatments were applied in strips across the testing fields.
The experiment was conducted implementing a split-plot design at both field sites, with
the main plot factor being cotton varieties and the sub-plot factor being nematicide treatments.
There were four replications at the Nugent farm in 2008 and six replications at the Gibbs farm in
2009. The sampling plots were four rows by 15.2 meters in both fields, Telone II was applied
prior to planting and Temik 15G was applied at planting along with herbicide.
M. incognita populations were determined by collecting soil samples from the center two
rows of the sampling plots using soil probes. The soil samples were then sent to the University of
Georgia’s Nematology Lab in Athens for processing. Nematodes were extracted from 100 cm3
soil using centrifugal-flotation (Jenkins, 1964) and Meloidogyne juveniles were counted under a
dissecting microscope. Soil samples were taken three to four times during the season on a
monthly basis (Table 4.1).
Cotton shoot height was recorded approximately every 2 weeks during the first half of the
season and until the cotton plants reached “cut-out”. From each sampling plot, five plants were
randomly selected and measured. At approximately 4 and 8 weeks after planting, plant samples
were taken from each field for further measurements. Five random plants from the center two
rows of the sampling plots were carefully dug from the soil. The plants were divided into shoots
and roots and these were stored in plastic sampling bags.
The measurements taken at first destructive sampling included the following: (1) Height-
to-node ratio: Height-to-node ratio was calculated by dividing shoot height by the number of
nodes. The number of nodes was recorded by counting the number of leaves that are bigger than
a U.S. quarter coin above the cotyledons on the main stem. (2) Shoot dry weight: The five plant

110
tops from each sampling plot were packed into one paper bag and dried in an oven at about 60˚C
for 2 days before dry weight was measured. (3) Root gall rating: Based on a 0-5 index, 0 = no
galling, 1 = trace infection with a few small galls, 2 = galling evident on <25% of the roots, 3 =
25-50%, 4 = 50-75% and 5 = >75% of the roots galled (Kinloch, 1990). (4) Egg counts: Eggs of
M. incognita were extracted with 0.625% NaOCl from cotton roots by shaking for 3 min.
(Hussey and Barker, 1973) and counted microscopically.
For the second destructive sampling, only the cotton roots (n = 5) were sampled, because
the tops were too large to handle. Therefore, root weight, gall rating and egg counts were
measured at the second destructive sampling.
Data for variables that were measured repeatedly were transformed into areas under the
variable progress curves using the trapezoidal method. The formula used to calculate the areas
was the same as the formula for area under disease progress curve (AUDPC), which is
( )∑−
=
++
−
+=
1
1
11
2AUDPC
n
i
iiii
ttyy
. Here, t is the time in days after planting at each measurement,
y is the reading of the variable that was being measured, and n is the number of readings. The
areas under the progress curve from each treatment were than analyzed using ANOVA and LSD
tests in SAS (SAS Institute, Cary, NC) using the PROC GLM procedure.
At the Gibbs farm in the 2009 growing season, cotton leaves from the fifth node on the
main stem were collected and sent for nutrient analysis to the University of Georgia’s Soil
Testing Lab in Athens. At harvest in 2008, the spatial variability of cotton yield (seed cotton)
was recorded using an Ag Leader cotton yield monitor system (Ag Leader Technology, Ames,
IA) installed on a Model 9965 four-row John Deere picker (John Deere, Moline, IL). In the 2008
study at the Nugent farm, yield was collected from the entire treatment strips. Cotton samples
were also collected from across the entire treatment strips for fiber quality analysis. At the Gibbs

111
farm in 2009, cotton yield was determined by weighing the cotton sample collected by the picker
from two rows of each sampling plot. These samples were also used for fiber quality tests. For
both of these two fields, the cotton samples were ginned at the University of Georgia microgin.
Cotton lint was then sent to the USDA cotton classifying office in Macon, GA for quality tests.
Results were analyzed with PROC GLM in SAS using ANOVA and LSD tests. The
interaction between variety and Nematicide treatments was also analyzed. Principal component
analysis was conducted in SAS using PROC PRINCOMP to elucidate the relation between
response variables (yield and fiber quality) and explanatory variables (plant growth, nematode
population and reproduction, soil nutrient contents, etc.). The principal components were
interpreted by finding the explanatory variables with the highest absolute values of eigenvectors,
usually above 0.25 to 0.30. Regression analysis of the most important principal components,
which together explain over 70% of the total variation, was conducted against the response
variables.
To evaluate the economic impact of M. incognita on cotton production relative to fiber
quality, the lint price per pound was calculated using the Southeast base price from the spot cash
market (averaged December 2008 and 2009 data) plus the premiums and/or minus the discounts
for quality. The average base price equaled $0.6549/lb. In 2008 the price included a loan
deficiency payment because it was below the loan rate of $0.52/lb. In addition to lint price, the
adjusted revenue was also evaluated. The adjusted revenue took many important economical
influencers into account, including nematicide application, variety, tillage, labor, yield, fiber
quality. Both lint price and adjusted revenue were analyzed with SAS GLM using ANOVA and
LSD tests.

112
4.4 Results
4.4.1 Plant growth, yield, and fiber quality
On the Nugent farm in 2008, three treatments were applied including Gaucho Grande
seed treatment, 6.72 kg/ha Temik, and 56.12 L/ha Telone. M. incognita juvenile counts were the
lowest where plots were fumigated with Telone II and he highest where plots were planted with
seed treated with Gaucho Grande (Table 4.2). The difference between plots planted with seed
treated with Gaucho Grande and plots treated with Temik 15G was not significant. At the Gibbs
farm there was a statistical interaction between cotton varieties and nematicide treatments.
Nematode counts were significantly higher in plots planted with variety FiberMax 9630B2F than
in plots planted with Stoneville 4554B2RF, and there was a greater reduction in nematode counts
with Telone treatment in FiberMax 9630B2F. However, the nematicide treatment effect was not
statistically significant in either variety in this trial. In both trials, gall ratings and egg counts
were the lowest with Telone treatment, but gall ratings were only significantly different among
treatments in the Gibbs 2009 trial, and egg counts were only statistically separated between
Gaucho and Telone in the Nugent 2008 trial. In most cases, plots planted to FiberMax 9630B2F
resulted in higher nematode counts, higher gall ratings and higher egg counts than those planted
to Stoneville 4554 B2RF, but only nematode counts in the Gibbs 2009 trial differed significantly.
In both trials, cotton shoot height and root weight were significantly higher in plots
fumigated with Telone II. Height-to-node ratio and shoot dry weight were statistically greater in
plots fumigated with Telone in the Gibbs 2009 trial. There was no interaction between varieties
and nematicide treatments relative to cotton growth. The variety effect was only significant for
shoot dry weight in the Nugent 2008 trial, where FiberMax 9630B2RF had a significantly higher
shoot dry weight. However, it was reverse in the Gibbs 2009 trial.

113
Cotton lint yield was the greatest in plots fumigated with Telone II in both trials (Table
4.4), but the yield was only significantly higher in the Gibbs 2009 trial. There was no significant
difference between Gaucho Grande and Temik treatments in yield in either trial. The variety
effect on lint yield was not significant in either trial (Table 4.5), and there was no interaction
between varieties and nematicide treatments.
Most of the fiber quality properties did not differ significantly among treatments (Table
4.4). In the Nugent 2008 trial, the nematicide treatment effect was only significant on color grade,
fiber reflectance and trash content. The highest color grade, fiber reflectance and trash content
were obtained in lint from plots treated with Temik, Telone, and Temik respectively, and the
lowest were from Telone, Temik, and Gaucho, respectively. There was no statistical interaction
between variety and nematicide treatment for any of the fiber properties in the Nugent 2008 trial.
In the Gibbs 2009 trial, the only fiber property significantly affected by nematicide
treatment was trash content. Plots planted to seed treated with Gaucho Grande resulted in
significantly higher trash content than the other two treatments. There was a statistical interaction
relative to micronaire between varieties and treatments. In FiberMax 9630B2F, micronaire
values were greatest in lint from plots planted to seed treated with Gaucho Grande, whereas in
Stoneville 4554B2RF, micronaire values were greatest in plots fumigated with Telone II.
However, the treatment effect was not significant in either variety,
The difference between varieties relative to fiber quality was significant in many cases
(Table 4.5). In both trials, staple, strength, fiber reflectance and fiber length were significantly
higher in FiberMax 9630B2F. Fiber yellowness was significantly lower and uniformity was
significantly higher in FiberMax 9630B2F only in the Gibbs 2009 trial.
114
4.4.2 Principal component analysis
In the Nugent trial conducted in 2008 (Table 4.6), the variables that gave the greatest
contribution to principal component 1 were all plant growth variables. Therefore, principal
component 1 was considered a plant growth variable. For principal component 2, the variables
that contributed the most were all related to nematode factors, such as gall rating and nematode
juvenile counts. Therefore, principal component 2 was considered a nematode component.
Principal component 3 had both plant growth and nematode contributors and principal
component 4 was again a nematode component. These four principal components together
explained 75% of the variation.
In the regression analysis of cotton yield and fiber properties to the first four principal
components (Table 4.7), the nematode component had a negative effect on yield, although the
effect was not statistically significant. Principal components 1, 3, and 4 all had significant
positive effect on cotton lint yield. Fiber strength, leaf grade, reflectance, yellowness, trash,
length and uniformity all had a negative relationship with either principal component 2 or
component 4, which were both nematode components. However, none of these relations were
significant. Most fiber properties were mainly positively affected by plant growth.
Based on the eigenvectors from the principal component analysis for the Gibbs 2009 trial
(Table 4.8), principal component 1 was a plant growth component, principal component 2, 3 and
5 were all nematode and leaf nutrient components, and principal component 4 was a leaf nutrient
component. These first five principal components together explained 72% of the total variation.
Regression of yield and fiber quality to principal components (Table 4.9) showed that the plant
growth component significantly affected yield and fiber yellowness. Principal component 2 and
3, which were nematode plus leaf nutrient components, both had negative effects on yield and

115
almost all fiber properties. These two nematode plus leaf nutrient components explained 24% of
the variation. However, only the effect of principal component 2 on lint yield and trash content
was significant. Many of the fiber properties were also significantly affected by principal
component 4, which was a leaf nutrient component.
4.4.3 Economic impact
In the two trials conducted here (Table 4.10), only the lint price of Stoneville 4554B2RF
from the Gibbs 2009 trial significantly differed among treatments. Cotton harvested from plots
treated with Temik and Telone had significantly improved lint prices compared with cotton from
plots planted to the Gaucho Grande seed treatment. This was due to a higher efficiency of
nematode control. For the Nugent 2008 trial, the adjusted revenue was the highest with seed
treatment and the lowest with Telone treatment for FiberMax 9063B2F. In 2008, the Nugent
field had the lowest nematode populations out of all five field sites assessed in this thesis.
However, in the Gibbs 2009 trial, the adjusted revenue was the highest for cotton yields obtained
from plots fumigated with Telone for both varieties.
4.5 Discussion
The results from the Nugent farm 2008 trial and the Gibbs farm 2009 trial showed that
with different types of nematicides, different levels of nematode populations, infection, and
reproduction were created successfully. Nematode pressure was higher in the Gibbs farm trial
than in the Nugent farm trial. The greatest nematode populations, disease severity, and
reproduction were found in plots planted to seed with Gaucho Grande seed treatment, and the
lowest was from plots fumigated with Telone II.

116
Both trials showed that cotton plants were less stunted with better M. incognita control,
as shoot height was greater in plots fumigated with Telone II. There was also a better root growth
with more aggressive nematode control in both trials. However, comparing these two trials, the
difference among treatments in plant growth was more obvious in the Gibbs 2009 trial. This trial
showed that with better nematode control, cotton plants were less stressed as assessed by the
higher height-to-node ratios.
The difference in shoot dry weight between the two cotton varieties in the Nugent 2008
trial may be due to their inherent genetic potential rather than different susceptibility to M.
incognita, because no significant differences in M. incognita populations and disease severity
were found between the two varieties. This variety effect was similar to the greenhouse results in
Chapter 2.
Better plant growth and less stress have resulted in a higher lint yield in both trials,
although for one of the trials the difference in yield was not significant. M. incognita not only
stunted cotton plant growth, but also reduced cotton lint yield. Since there was no difference in
nematode-associated disease severity between the two varieties, cotton lint yield also did not
differ between varieties.
In both trials, most of the fiber properties were not significantly different with different
treatments, except for one or two fiber properties.H However, the way these fiber quality
properties differ among treatments did not follow the pattern of nematode populations, disease
severity, or reproduction level. Therefore, these differences may be due to factors other than M.
incognita infection. Also, none of the treatment effects on these fiber properties was consistent in
any of the other trials (Chapter 3). In both of the current trials, many of the fiber properties were
significantly different between FiberMax 9063B2F and Stoneville 4554B2RF. Many fiber

117
properties including staple length, strength, reflectance, trash content, and uniformity were all
significantly higher with FiberMax 9063B2F than Stoneville 4554B2RF. From the results of the
greenhouse trials in Chapter 2, Stoneville had a better tolerance of M. incognita than FiberMax,
and none of the field test results showed M. incognita has affected fiber quality. Therefore the
difference in fiber properties between these two varieties may be mainly due to their genetic
differences.
The principal component analyses for these two trials showed that plant growth had a
major impact on cotton yield and fiber quality. In the Nugent 2008 trial, many fiber properties
were negatively affected by M. incognita, although the effect was not significant. In the Gibbs
2009 trial, the effect of M. incognita was confounded with leaf nutrient contents. This combined
effect was usually not significant. However, the effect of leaf nutrients alone was usually
significant. This may indicate that nematode variables and leaf nutrients were negatively
correlated.
The values of fiber properties usually change in a very small range. However, even a
small change in values could have brought the fiber quality below the USDA standard and leave
the growers with penalties when selling their products. Therefore, although the difference of
fiber properties among treatments was not statistically significant, it is still necessary to evaluate
the actual price of cotton lint due to the changes in fiber quality associated with M. incognita
infection. By evaluating the adjusted revenue, which is the total income reduced by the cost of
crop management and nematicide application, we can compare the economic profits for the
different treatments, which take into account both lint yield and fiber quality.
Nematode control at the Nugent farm did not significantly increase economic return,
because nematode populations and disease severity were relatively low in this field. A greater

118
investment resulted in lower revenue. However in the Gibbs trial, the adjusted revenue was the
highest with Telone treatment for both varieties. In this trial, both Temik and Telone treatments
increased the lint price by 0.01$/lb compared with Gaucho seed treatment. From previous results,
the Gibbs field had a high M. incognita pressure and also growing conditions that were not
optimum for cotton growth, which presumably allowed M. incognita to cause more severe
damage. That might be the reason why Telone was more beneficial in this trial than any other
trial.
4.6 Summary and Conclusions
In both the Nugent farm 2008 trial and the Gibbs farm 2009 trial, different populations
of M. incognita were created using three chemical treatments. With more aggressive nematode
control, plant growth was significantly improved in terms of greater shoot height, height-to-node
ratio, dry weight, and root weight. Significant differences were found mainly between Telone II
and the other two treatments. Gaucho Grande and Temik treatments did not differ except for root
gall rating. Better plant growth with Telone was reflected in a greater lint yield in this treatment.
Although higher populations of M. incognita were associated with FiberMax 9630B2F, this was
not found to affect plant growth or yield, indicating genetic characters played a greater role in
plant growth.
Fiber quality was not affected by nematicide treatments significantly or consistently.
Although few differences were observed in nematode populations, plant growth or yield between
the two varieties, most fiber properties were significantly higher in the FiberMax variety in both
the Nugent 2008 and Gibbs 2009 trials, This may be due to genetic characteristics rather than M.
incognita infection, as Stoneville has a better tolerance of M. incognita infection than FiberMax

119
according to greenhouse results, and none of the field test results showed M. incognita affected
fiber quality.
Since there were very few interactions between cotton varieties and nematicide
treatments, we can conclude that the growth, yield, and fiber quality of the two varieties with
different levels of resistance to M. incognita responded similarly to M. incognita infection.
Different types of nematicides had the same effect on FiberMax 9630B2F and Stoneville
4554B2RF.
The principal component analysis for the Nugent 2008 trial showed that plant growth had
a positive effect on most fiber properties while M. incognita had some level of negative effect on
fiber quality, which was consistent with other trials in 2008. The results of principal component
analysis for the Gibbs 2009 trial showed that the nematode effect may have been obscured by
leaf nutrient factors because they may have been negatively correlated with each other.
The results of economic analysis of these two trials showed that cotton lint price was not
affected by the different treatments. The adjusted revenue was significantly higher with Temik
than with Telone in the field with better growing conditions or less nematode population. Telone
application was much more profitable in the field with higher M. incognita pressure and an
environment that was not optimum for plant growth.
4.7 References
Barfield, M. 2003. ST 5599BR and ST 5303R: Two new transgenic varieties from Stoneville pedigreed seed company; Page 52 in: Proc. Beltwide Cotton Conf., Nashville, TN. 6-10 Jan. 2003. Natl. Cotton Council Am., Memphis, TN. Basra, A. S., ed. 1999. Cotton fibers: Developmental biology, quality improvement, and textile processing. Food Products Press/The Haworth Press, Binghamton, New York.

120
Beltwide Cotton Nematode Survey and Education Committee. 2003. Cotton nematodes, your hidden enemies. National Cotton Council of America, Memphis, TN and Research Triangle Park, NC. Bradow, J. M., and Davidonis, G. H. 2000. Quantification of fiber quality and the cotton production-processing interface: A physiologist perspective. Journal of Cotton Science 4: 34-64. Bridge, J., and Page, S. L. J. 1980. Estimation of M. incognita infestation levels on roots using a rating chart. Trop. Pest Manage. 26:296-298. Cassman, K. G., Kerby, T. A., Roberts, B. A., Bryant, D. C., and Higashi, S. L. 1990. Potassium nutrition effects on lint yield and fiber quality of acala cotton. Crop Science 30:672-677. Carneiro, R. G., Mazzafera, P., Ferra, L. C. C. B., Muraoka, T., and Trivelin, P. C. O. 2002. Uptake and translocation of nitrogen, phosphorus and calcium in soybean infected with Meloidogyne incognita and M. javanica. Fitopatol. Bras. 27(2): 141-150. Cotton Disease Loss Estimate Committee. 2008. Cotton disease loss committee report. Pages 294-297 in: Proceedings of the Beltwide Cotton Conferences, Nashville, TN, 8-11 January 2008. Delanghe, E. A. L. 1986. Lint development. Cotton physiology. The Cotton Foundation, Memphis, TN. Grimes, D. W., and Yamada, H. 1982. Relation of cotton growth and yield to minimum leaf water potential. Crop Science 22:134-139. Hearn, A. B. 1976. Response of cotton to nitrogen and water in a tropical environment. III. Fiber quality. Journal of Agricultural Science 37: 826-832. Hearn, A. B., 1994. The principles of cotton water relations and their application in management. Pages 66-92 in: Challenging the Future. G.A. Constable and N.W. Forrester, eds. Proc. World Cotton Conf.-1, Brisbane, Australia. Hussey R.S., and Barker, K. R. 1973. A comparison of methods of collecting inocula for Meloidogyne spp., including a new technique. Plant Disease Rep. 57:1025-1028. Jones, M. A., and Wells, R. 1997. Field yield and quality of cotton grown at two divergent population densities. Crop Science 37: 1190-1195. Kinloch, R. A. 1990. Screening for resistance to root-knot nematode. Pages 16-23 in: Methods for evaluating plant species for resistance to plant-parasitic nematodes. J. L. Starr, ed. Society of Nematologists, Hyattsville, MD, Kirkpatrick, T. L., Oosterhuis, D. M., and Wullschleger, S. D. 1991. Interaction of Meloidogyne incognita and water stress in two cotton cultivars. Journal of Nematology 23(4): 462-467.

121
Kirkpatrick, T. L., van Iersel, M. W., and Oosterhuis, D. M. 1995. Influence of Meloidogyne incognita on the water relations of cotton grown in microplots. J. Nematol. 27: 465-471. Kirkpatrick, T. L., and Sasser, J. N. 1984. Crop rotation and races of Meloidogyne incognita in cotton root-knot management. Journal of Nematology 16:323-328. Koenning, S. R., Kirkpatrick, T. L., Starr, J. L., Wrather, J. A., Walker, N. R., and Mueller, J. D. 2004. Plant-parasitic nematodes attacking cotton in the United States. Plant Disease 88(2): 100-113. Lawrence, G. W., and McLean, K. S. 2000. Effect of foliar applications of oxamyl with aldicarb for the management of Rotylenchulus reniformis on cotton. Supplement to the Journal of Nematology 32:542-549. Lawrence, G. W., and McLean, K. S. 2002. Foliar applications of oxamyl with aldicarb for the management of Meloidogyne incognita on cotton. Nematropica 32:103-112. Loveys, B. R., and Bird, A. F. 1973. The influence of nematodes on photosynthesis in tomato plants. Physiological Plant Pathology 3: 525-529. Marani, A., and Amirav, A. 1971. Effects of soil moisture stress on two varieties of upland cotton in Israel: I. The coastal plain region. Exp. Agric. 7: 213-224. Melakeberhan, H., Webster, J. M., Brooke, R. C., D'Auria, J. M., and Cackette, M. 1987. Effect of Meloidogyne incognita on plant nutrient concentration and its influence on the physiology of beans. Journal of Nematology 19(3): 324-330. Mitchell, D. M. and Robinson, J. R. C. 2009. Structural changes in U.S. cotton supply and demand relationships. Pages 238-294 in: Proceedings of the Beltwide cotton conferences, San Antonio, TX, 5-8 January, 2009. Monfort, W. S., Kirkpatrick, T. L., Long, D. L., and Rideout, S. 2006. Efficacy of a novel nematicidal seed treatment against Meloidogyne incognita on cotton. Journal of Nematology 38:245-249. Mulrean, E. N. 1984 Effect of Phymatotrichum root rot on yield and seed and lint quality in Gossypium hirsutum and G. barbadense. Plant Disease 68(5):381-383. Pettigrew, W. T. 2001. Environmental effects on cotton fiber carbohydrate concentration and quality. Crop Science 41:1108-1113. Pettigrew, W. T. 2004. Moisture deficit effects on cotton lint yield, yield components, and boll distribution. Agron. J. 96: 377-383. Phipps, P. M. and J. D. Eisenback. 2005. Response of cotton varieties to in-furrow applications of Temik 15G in fields infested with southern root-knot nematode in Virginia. Page 247 in: Proc.

122
Beltwide Cotton Conf., New Orleans, LA. 4-7 Jan. 2005. Natl. Cotton Council Am., Memphis, TN. Powell, N. T. 1971. Interactions between nematodes and fungi in disease complexes. Annual Review of Phytopathology 9:253-273. Reddy, K. R., Koti, S., Davidonis, G. H., and Reddy, V. R. 2004. Interactive effects of carbon dioxide and nitrogen nutrition on cotton growth, development, yield, and fiber quality. Agron. J. 96:1148-1157. Rich, J. R., and Kinloch, R. A. 2005. Cotton nematode management. ENY-004(NG015), Florida Cooperative Extension Service, Institute of Food and Agricultural Science, University of Florida, Gainesville. Roberts, P. M., Bednarz, C., and Greene, J. 2005. Impact of boll feeding bugs on lint yield and fiber quality, Pages 1718-1724 in: Proc. 2005 Beltwide Cotton Conf., National Cotton Council, Memphis, TN. Shimishi, D., and Marani, A. 1971. Effects of soil moisture stress on two varieties of upland cotton in Israel. II. The northern Negev region. Exp. Agric. 7: 225-239. Silvertooth, J. C. 1999. Fiber quality issues and management. Univ. of Arizona Agricultural Extension Service, Tucson, AZ. Snipes, C. E., and Baskin, C. C. 1994 Influence of early defoliation on cotton yield, seed quality, and fiber properties. Field Crops Research 37:137-143. Starr, J. L., Heald, C. M., Robinson, A. F., Smith, R. G., and Krausz, J. P. 1993. Meloidogyne incognita and Rotylenchulus reniformis and associated soil textures from some cotton production areas of Texas. J. Nematol. 25: S895-899. Thomas, S. H., and Kirkpatrick, T. L. 2001. Root-knot nematode. Pages 40-42 in: Compendium of Cotton Diseases, 2nd ed. T. L. Kirkpatrick and C. S. Rothrock, eds. American Phytopathological Society, St. Paul, MN. USDA. 2001. The classification of cotton. Agricultural Marketing Service, Washington, D.C. Walker, N. R., Kirkpatrick, T. L., and Rothrock, C. S. 1998. Interaction between Meloydogyne incognita and Thielaviopsis basicola on cotton (Gossypium hirsutum). J. Nematol. 30: 415-422.

123
Table 4.1. Soil sampling dates for southern M. incognita juvenile counts at Nugent farm in 2008 and at Gibbs farm in 2009.
Trial Sampling date
First Second Third
Nugent 2008 6/12/08 8/12/08 11/10/08
Gibbs 2009 7/24/09 9/17/09 12/7/09
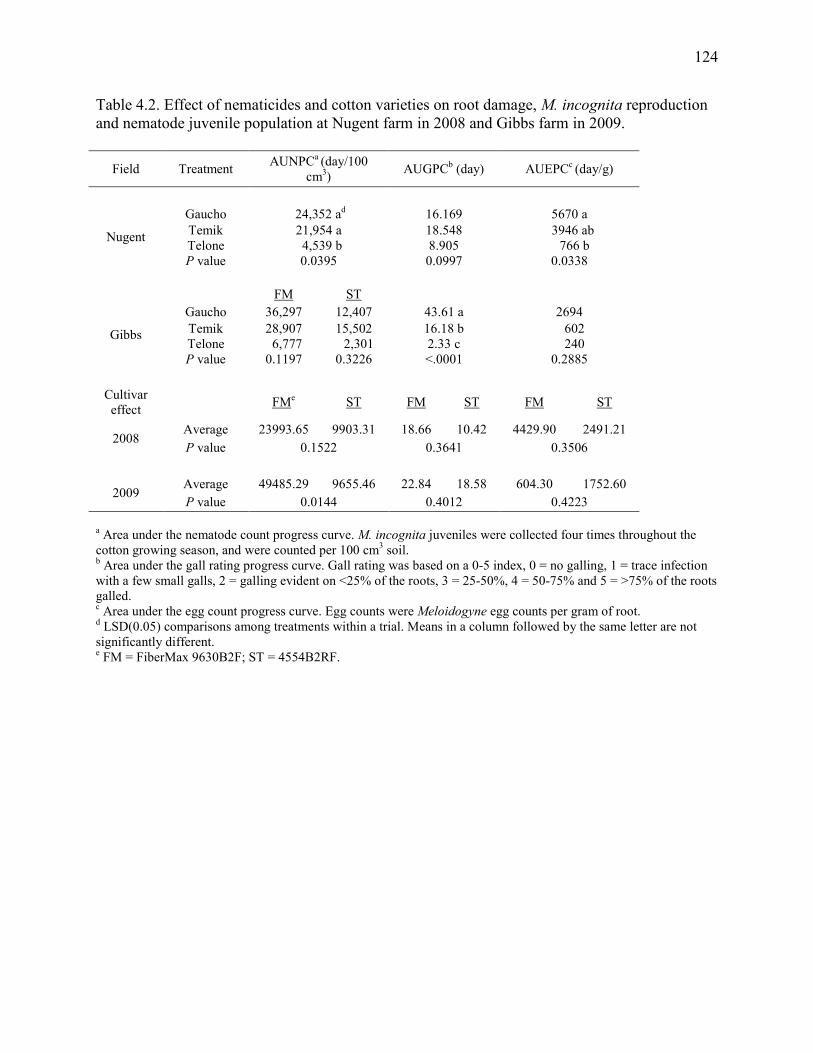
124
Table 4.2. Effect of nematicides and cotton varieties on root damage, M. incognita reproduction and nematode juvenile population at Nugent farm in 2008 and Gibbs farm in 2009.
Field Treatment AUNPCa (day/100 cm3) AUGPCb (day) AUEPCc (day/g)
Nugent
Gaucho 24,352 ad 16.169 5670 a Temik 21,954 a 18.548 3946 ab Telone 4,539 b 8.905 766 b P value 0.0395 0.0997 0.0338
FM ST
Gibbs
Gaucho 36,297 12,407 43.61 a 2694 Temik 28,907 15,502 16.18 b 602 Telone 6,777 2,301 2.33 c 240 P value 0.1197 0.3226 <.0001 0.2885
Cultivar effect FMe ST FM ST FM ST
2008 Average 23993.65 9903.31 18.66 10.42 4429.90 2491.21 P value 0.1522 0.3641 0.3506
2009 Average 49485.29 9655.46 22.84 18.58 604.30 1752.60 P value 0.0144 0.4012 0.4223
a Area under the nematode count progress curve. M. incognita juveniles were collected four times throughout the cotton growing season, and were counted per 100 cm3 soil. b Area under the gall rating progress curve. Gall rating was based on a 0-5 index, 0 = no galling, 1 = trace infection with a few small galls, 2 = galling evident on <25% of the roots, 3 = 25-50%, 4 = 50-75% and 5 = >75% of the roots galled. c Area under the egg count progress curve. Egg counts were Meloidogyne egg counts per gram of root. d LSD(0.05) comparisons among treatments within a trial. Means in a column followed by the same letter are not significantly different. e FM = FiberMax 9630B2F; ST = 4554B2RF.

125
Tab
le 4
.3. E
ffec
t of n
emat
icid
es a
nd c
otto
n va
riet
ies
on s
hoot
hei
ght,
shoo
t dry
wei
ght,
root
wei
ght a
nd h
eigh
t-to
-nod
e ra
tio a
t Nug
ent
farm
in 2
008
and
Gib
bs fa
rm in
200
9.
Fiel
d T
reat
men
t A
UH
PCa (c
m·d
ay)
Hei
ght-
to-n
ode
ratio
(cm
) D
ry w
eigh
t (g)
A
UR
WPC
b (g·d
ay)
37
DA
PC
37 D
AP
Nug
ent
Gau
cho
1514
.88
bd 3.
07
3.66
8
70.5
7 b
Tem
ik
1524
.43
b 3.
09
3.50
10
42.8
1 a
Tel
one
1626
.77
a 3.
16
3.67
10
65.0
0 a
P v
alue
0.
0073
0.
2067
0.
7569
0.
0324
35 D
AP
35 D
AP
Gib
bs
Gau
cho
2704
.71
b 2.
37 b
4.
06 b
64
8.21
b
Tem
ik
2872
.05
b 2.
67 a
4.
76 b
6
75.0
9 ab
T
elon
e 31
97.3
9 a
2.77
a
6.02
a
749.
83 a
P
val
ue
0.00
01
0.00
36
0.00
08
0.04
66
Cul
tivar
ef
fect
FMe
ST
FM
ST
FM
ST
FM
ST
2008
A
vera
ge
1582
.00
1528
.72
3.15
3.
07
4.08
3.
14
917.
24
1068
.35
P v
alue
0.
4439
0.
4999
0.
0308
0.
0698
2009
A
vera
ge
2828
.64
3020
.80
2.55
2.
65
4.88
5.
01
718.
15
663.
93
P v
alue
0.
3275
0.
2795
0.
7799
0.
2860
a A
rea
unde
r the
hei
ght p
rogr
ess
curv
e. C
otto
n sh
oot h
eigh
ts w
ere
mea
sure
d tw
ice
at N
ugen
t far
m a
nd th
ree
times
at G
ibbs
farm
thro
ugho
ut th
e co
tton
grow
ing
seas
on.
b Are
a un
der t
he ro
ot w
eigh
t pro
gres
s cu
rve.
Cot
ton
root
wei
ghts
wer
e m
easu
red
twic
e in
bot
h 20
08 a
nd 2
009
thro
ugho
ut th
e co
tton
grow
ing
seas
on.
c D
ays
afte
r pla
ntin
g.
d LSD
(0.0
5) c
ompa
riso
ns a
mon
g tr
eatm
ents
with
in a
tria
l. M
eans
in a
col
umn
follo
wed
by
the
sam
e le
tter a
re n
ot s
igni
fica
ntly
dif
fere
nt.
e FM
= F
iber
Max
963
0B2F
; ST
= 4
554B
2RF.

126
Tab
le 4
.4. E
ffec
t of n
emat
icid
es o
n co
tton
yiel
d an
d fi
ber q
ualit
y at
Nug
ent f
arm
in 2
008
and
Gib
bs fa
rm in
200
9.
Fiel
d C
ultiv
ar
Col
or
grad
ea St
aple
(3
2nds
)b M
icro
nair
e St
reng
th
(g/te
x)
Lea
f gr
ade
Ref
lect
ance
Y
ello
wne
ss
Tra
sh
(%)c
Len
gth
(cm
) U
nifo
rmity
(%
)
Lin
t yi
eld
(kg/
ha)
kg h
a-1
Nug
ent
Gau
cho
31.1
3 ad
36.1
3 3.
86
30.3
5 4.
00
76
.84
ab
87.2
5 0.
38 b
2.
88
81.9
1 96
7.43
T
emik
31
.25
a 36
.13
3.80
30
.68
4.13
76
.28
b 76
.63
0.50
a
2.86
82
.03
933.
33
Tel
one
27.5
0 b
36.1
3 3.
78
30.8
8 4.
00
77.3
3 a
89.2
5 0
.39
ab
2.88
81
.99
1007
.54
P v
alue
0.
0572
1.
0000
0.
3227
0.
2955
0.
3966
0.
0072
0.
4148
0.
0708
0.
5405
0.
8991
0.
2549
FMe
ST
kg
plo
t-1
Gib
bs
Gau
cho
41.0
0 36
.11
3.9
3.67
5 29
.50
3.22
77
.66
66.7
8 0.
42 a
2.
87
81.7
6 2.
35 b
T
emik
41
.00
36.5
0 3.
84
3.72
29
.94
3.00
77
.27
66.8
0 0.
34 b
2.
88
82.0
2 2.
56 b
T
elon
e 40
.00
36.5
0 3.
74
3.9
29.4
1 3.
10
77.7
0 66
.60
0.31
b
2.89
81
.70
2.93
a
P v
alue
0.
3759
0.
1681
0.
2187
0.
1550
0.
2599
0.
2196
0.
6068
0.
6884
0.
0321
0.
3355
0.
5885
0.
0013
a C
otto
n fi
ber q
ualit
y pr
oper
ties.
b St
aple
leng
th (3
2nds
of a
n in
ch).
c The
per
cent
of t
he s
ampl
e su
rfac
e co
vere
d by
tras
h pa
rtic
les
as d
eter
min
ed b
y im
age
anal
ysis
d L
SD(0
.05)
com
pari
sons
am
ong
trea
tmen
ts w
ithin
a tr
ial.
Mea
ns in
a c
olum
n fo
llow
ed b
y th
e sa
me
lette
r are
not
sig
nifi
cant
ly d
iffe
rent
. e F
M =
Fib
erM
ax 9
630B
2F; S
T =
455
4B2R
F.

127
Tab
le 4
.5. E
ffec
t of c
otto
n va
riet
ies
on y
ield
and
fibe
r qua
lity
at N
ugen
t far
m in
200
8 an
d G
ibbs
farm
in 2
009.
Fiel
d C
ultiv
ar
Col
or
grad
ea St
aple
(3
2nds
)b M
icro
nair
e St
reng
th
(g/te
x)
Lea
f gr
ade
Ref
lect
ance
Y
ello
wne
ss
Tra
sh
(%)c
Len
gth
(cm
) U
nifo
rmity
(%
)
Lin
t yi
eld
(kg/
ha)
Nug
ent
FMb
29.3
3 37
.08
3.81
31
.35
4.00
77
.96
83.9
2 0.
41
2.95
82
.02
982.
95
ST
30.5
8 35
.17
3.82
29
.92
4.08
75
.67
84.8
3 0.
43
2.79
81
.93
955.
92
P v
alue
0.
3248
<.
0001
0.
9063
0.
0050
0.
3559
<.
0001
0.
9051
0.
6748
<.
0001
0.
8087
0.
8546
kg p
lot-
1
Gib
bs
FM
41.0
0 37
.67
3.83
30
.93
3.13
78
.37
63.1
3 0.
40
2.99
82
.16
2.79
ST
40
.29
35.0
0 3.
77
28.2
2 3.
07
76.6
4 70
.57
0.31
2.
76
81.4
7 2.
43
P v
alue
0.
4275
<.
0001
0.
4368
<.
0001
0.
7517
0.
0011
0.
0034
0.
0774
<.
0001
0.
0122
0.
3683
a C
otto
n fi
ber q
ualit
y pr
oper
ties.
b St
aple
leng
th (3
2nds
of a
n in
ch).
c The
per
cent
of t
he s
ampl
e su
rfac
e co
vere
d by
tras
h pa
rtic
les
as d
eter
min
ed b
y im
age
anal
ysis
d F
M =
Fib
erM
ax 9
630B
2F; S
T =
455
4B2R
F.

128
Table 4.6. Eigenvectors of principal components and explanatory variables for the Nugent 2008 trial.
Explanatory variable Prin1a Prin2 Prin3 Prin4 Shoot height 1st 0.406b -0.115 0.071 -0.001 Shoot height 2nd 0.136 -0.208 0.430 0.058 Number of nodes 0.377 -0.044 -0.123 -0.119 Height-to-node ratio 0.295 -0.135 0.232 0.113 Fresh weight 0.328 -0.179 -0.172 -0.216 Dry weight 0.374 -0.057 -0.152 -0.188 Root weight 1st 0.321 -0.216 -0.059 -0.113 Root weight 2nd -0.093 -0.002 0.496 0.066 Square mass 0.323 0.049 0.232 0.224 Root gall rating 1st 0.117 0.514 0.015 0.159 Root gall rating 2nd 0.096 0.029 -0.229 0.629 Egg counts 1st 0.155 0.474 0.114 -0.036 Egg counts 2nd 0.122 -0.033 -0.386 0.510 Nematode counts 1st 0.138 0.349 0.074 0.005 Nematode counts 2nd 0.203 0.451 0.064 -0.180 Nematode counts 3rd -0.050 0.153 -0.401 -0.326
a Principal components. b Eigenvectors with absolute values >0.30 are bold-faced.

129
Table 4.7. Regression analysis of cotton yield and fiber properties against principal components for the Nugent 2008 trial.
Response variable R2 P Parameter estimates Prin1a Prin2 Prin3 Prin4
Lint yield 0.613 0.031 33.056* -1.701 40.123* 99.106** Color grade 0.169 0.592 0.618 0.579 -0.162 0.678 staple 0.509 0.145 0.008** 0.047 -0.257* 0.022 micronaire 0.371 0.302 -0.027 0.004 -0.003 0.060** Strength 0.483 0.194 0.003** 0.034 -0.029 -0.124 Leaf grade 0.323 0.180 0.118* 0.013 -0.040 -0.037 Reflectance 0.546 0.021 -0.262** -0.110 -0.327* -0.006 Yellowness 0.261 0.689 -0.057 -1.351 5.291 2.434 Trash 0.207 0.016 0.049 -0.002 -0.016 -0.004 Length 0.514 0.042 0.024** 0.001 -0.019 -0.005 Uniformity 0.371 0.953 0.008* -0.016 0.158* -0.072
a Principal components significant at 0.05 (*), and 0.01 (**).

130
Table 4.8. Eigenvectors of principal components and explanatory variables for the Gibbs 2009 trial.
Explanatory variables Prin1a Prin2 Prin3 Prin4 Prin5 Shoot height 1st 0.267b 0.086 -0.029 -0.217 0.082 Shoot height 2nd 0.279 -0.018 0.066 0.060 0.105 Shoot height 3rd 0.283 -0.028 0.037 0.105 0.045 Number of nodes 0.245 -0.087 0.026 -0.155 0.007 Height-to-node ratio 0.206 0.178 -0.042 -0.202 0.150 Fresh weight 0.275 0.102 -0.017 -0.179 0.003 Dry weight 0.246 0.135 -0.012 -0.280 -0.047 Root weight 1st 0.228 0.190 -0.051 -0.207 -0.037 Root weight 2nd 0.152 -0.159 0.246 -0.073 -0.059 Nodes above white flower 1st 0.183 -0.179 0.083 0.042 0.043 Nodes above white flower 2nd 0.138 -0.200 -0.147 0.159 -0.115 Root gall rating 1st -0.096 -0.265 0.241 -0.095 -0.095 Root gall rating 2nd -0.198 -0.127 0.287 0.029 0.220 Egg counts 1st -0.152 -0.036 -0.110 0.230 -0.411 Egg counts 2nd -0.211 -0.056 0.060 -0.010 0.118 Nematode counts 1st -0.073 0.051 0.371 0.100 0.315 Nematode counts 2nd -0.087 -0.348 0.055 -0.174 0.265 Nematode counts 3rd -0.071 -0.343 0.061 -0.188 0.331 Leaf Ca 0.180 0.041 0.287 0.169 -0.118 Leaf K 0.196 -0.214 -0.093 0.240 -0.023 Leaf Mg -0.176 0.272 0.219 -0.136 0.018 Leaf N 0.114 -0.009 0.152 0.032 -0.129 Leaf P -0.147 0.319 0.099 -0.091 0.008 Leaf S 0.129 0.041 0.099 0.438 0.023 Leaf Al 0.007 0.218 -0.288 0.215 0.339 Leaf B -0.054 0.295 0.272 0.255 -0.008 Leaf Cu -0.019 -0.160 -0.399 0.064 0.139 Leaf Fe 0.057 0.215 -0.071 0.153 0.451 Leaf Mn -0.223 0.162 -0.132 -0.118 -0.045 Leaf Na 0.172 -0.028 0.018 0.301 0.181 Leaf Zn -0.180 -0.009 -0.280 0.006 0.109
a Principal components. b Eigenvectors with absolute values >0.25 are bold-faced.

131
Table 4.9. Regression analysis of cotton yield and fiber properties to principal components for the Gibbs 2009 trial
Response variable R2 P Parameter estimate
Prin1a Prin2 Prin3 Prin4 Prin5 Lint yield 0.771 0.024 11.498** -0.087* 0.004 -0.040 0.177** Color grade 0.161 0.663 -0.188 -0.098 -0.128 0.169 0.293 staple 0.298 0.259 -0.033 -0.080 -0.154 -0.395 0.372 micronaire 0.295 0.267 0.005 -0.009 -0.036 -0.014 0.060 Strength 0.242 0.405 -0.125 -0.118 -0.208 -0.203 0.293 Leaf grade 0.193 0.556 0.012 -0.060 -0.036 -0.022 -0.008 Reflectance 0.417 0.078 0.055 -0.101 0.210 -0.416* 0.167 Yellowness 0.507 0.023 0.730* -0.293 -0.166 1.667* -0.833 Trash 0.406 0.088 -0.005 -0.025** 0.013 0.004 0.004 Length 0.367 0.135 -0.004 -0.010 -0.013 -0.037* 0.032 Uniformity 0.275 0.313 -0.018 -0.064 -0.020 -0.225* 0.069
a Principal components significant at 0.05 (*), and 0.01 (**).

132
Table 4.10. Effect of different types of nematicides and seed treatment on cotton lint price and adjusted revenue at Nugent farm in 2008 and Gibbs farm in 2009.
Treatment
Lint Price Adjusted revenue
Nugent 08 Gibbs 09 Nugent 08 Gibbs 09
FMb ST FM ST FM ST FM ST
Gaucho 0.67 0.66 0.66 0.66 ba 487.1 a 444.2 472.7 356.8
Temik 0.67 0.65 0.67 0.67 a 468.3 a 400.0 466.7 400.5
Telone 0.68 0.66 0.67 0.67 a 382.6 b 414.6 496.5 460.4
P value 0.1517 0.4059 0.7083 0.0194 0.0051 0.6335 0.6720 0.0615
a LSD(0.10) comparisons among treatments within a trial. Means in a column followed by the same letter are not significantly different. b FM = FiberMax 9630B2F; ST = 4554B2RF.

133
CHAPTER 5
SUMMARY AND CONCLUSIONS
Meloidogyne incognita is a major parasite on cotton. The management of M. incognita is
a crucial part of cotton production. With appropriate nematode management strategies, cotton
yield can be improved. However, very little data has documented the effect of M. incognita on
fiber quality. Fiber quality has become an increasingly important issue as it affects the value of
cotton lint. Some mills only accept cotton with specific standards of fiber quality. Therefore,
fiber quality is extremely important to cotton economics, in addition to cotton yield.
In greenhouse trials, the effects of M. incognita on key physiological processes along
with cotton growth characters were examined. Three nematode infection levels were created by
infesting soil planted to cotton with different numbers of eggs of M. incognita. Two commercial
cotton varieties and two cotton breeding lines were used in greenhouse trials to compare their
responses to M. incognita infection.
The results from greenhouse trials showed that with infection by M. incognita, cotton
vegetative growth, in terms of height-to-node ratio, shoot dry weight, leaf expansion; as well as
cotton reproductive growth, in terms of number of bolls and boll weight, were all significantly
reduced. This may have resulted from reduced photosynthetic products, reduced root uptake and
delayed plant development. The reduction in photosynthetic rate caused by M. incognita
infection was usually accompanied by reduced transpiration rate, reduced stomatal conductance,
as well as increased leaf temperature and sub-stomatal CO2 concentration, which indicated that

134
the damage caused by M. incognita resembles drought stress. These results indicated that fiber
development, which requires sufficient organic and inorganic nutrients, may be interrupted by M.
incognita infection. Of the varieties and breeding lines tested, 120B1R1 showed a very
promising resistance to M. incognita, especially in terms of suppressing nematode reproduction
in root tissues.
Field experiments were conducted at five different field sites over two growing seasons.
Cotton yield and fiber quality, as well as plant growth, root damage and nematode populations
were assessed. Different-sized populations of M. incognita were created by applying different
nematicides at different rates to respective plots. In addition to the nematicide treatments, site-
specific management zones, with proven effect on cotton yield, were also used at three out of the
five field sites. At these three fields with management zones, two rates of Temik and two rates of
Telone were applied in both zones. Seed treatments AVICTA Complete Cotton and AERIS Seed
Applied System + Trilex were applied only at Perryman farm.
Results from these field trials showed that with different nematicide types, rather than
different nematicide rates, significantly different levels of nematode population, nematode
infection, and reproduction were created successfully. The greatest nematode population
occurred with seed treatments, and the lowest nematode population was achieved with Telone
treatments. The difference between low and high rates of nematicides was not significant. As a
result, plant vegetative growth was significantly improved in plots fumigated with Telone. Plots
treated with Temik resulted in better plant growth than seed treatments, but the results were not
as good as in plots where Telone was applied.
Cotton yield was improved where Telone was applied as compared with other treatments
in most cases. However, in 2009 at two Windhausen farms, cotton yield was reduced by Telone

135
treatments, especially the high rate of Telone. Since the damage in cotton caused by M. incognita
was shown to resemble drought stress in greenhouse trials, with the excessive rainfall in 2009,
plant growing conditions were improved; therefore less damage was caused by M. incognita.
Also, cotton yield might be less sensitive to M. incognita infection than plant growth. Therefore,
cotton yield was not affected, while plant growth was. Cotton fiber quality was not consistently
or significantly affected by different treatments in these field trials. A few fiber properties were
affected in some trials, but they did not differ according to nematode-associated disease severity
levels. Therefore, they may have been affected by other factors rather than root-knot nematodes.
These effects were also not consistent in other trials. Therefore, cotton fiber quality may be less
sensitive to M. incognita infection than yield.
The management zone effect was usually not significant at these three field sites. The
most obvious zone difference was seen in the Perryman trials. In these trials, plant growth and
nematode population were both significantly higher in the high-risk zone. This indicated that the
zone difference may be due to some environmental factors other than nematodes, because M.
incognita has been shown in both greenhouse and field trials to reduce plant growth. Cotton
growth, yield, and fiber quality all responded the same to nematicide in different management
zones.
At both the Nugent and the Gibbs farm, two varieties of cotton were planted to plots
treated with three chemical treatments, including Gaucho Grande seed treatment, Temik 15G and
Telone II. In these trials, plots fumigated with Telone had significantly improved plant growth,
but only increased yield in the Gibbs 2009 trial. This may have occurred because at the Nugent
farm there was generally a lower nematode population than in other fields. Also, irrigated
conditions may have provided the cotton with an optimum growing environment. plus cotton

136
yield seems less affected by M. incognita than cotton growth. In the Gibbs 2009 trial, the most
significant difference among treatments was shown in plant growth, nematode population, root
damage, and nematode reproduction than any other trial. Yield was significantly improved by
Telone in both fields. However, none of these trials showed an effect of treatments on fiber
quality. The reason fiber quality was not affected by M. incognita infection might be because the
developing bolls are nutrient sinks and compete with M. incognita for nutrient transport. If
developing bolls are stronger nutrient sinks, or if M. incognita are stronger nutrient sinks but
sufficient nutrients exist, fiber development and quality may not be affected.
There was a significant difference in fiber quality between the two cotton varieties used
at the Nugent and Gibbs farms. Many of the fiber properties were significantly higher in lint
from the FiberMax variety, which was considered the susceptible variety in this study. Although
not significant, plots planted to the FiberMax variety had a higher nematode population and
disease severity than plots planted to Stoneville seed in both trials. Since none of the other trials
showed an increased fiber quality with higher level of M. incognita infection, this difference in
fiber quality between varieties may only be due to their genetic differences.
The principal component analysis was conducted to analyze the direct relationship of
response variables (yield and fiber properties) with all the explanatory variables (plant growth,
nematode population, soil nutrients, etc.). The results showed that the effect of M. incognita on
fiber quality was not significant in most cases and also not consistent in different years. It was
not clear whether the effect of nematode on overall fiber quality was positive or negative.
The values of fiber properties changed over a relatively small range. However, with a
small change, the value of the fiber could drop under the USDA standard and cause an economic
penalty to the growers. Therefore, lint price based on market average and fiber quality, and
137
adjusted revenue based on expenditure, yield, and fiber quality were analyzed for all trials. The
lint price from all five fields and two growing seasons showed no significant difference with
different nematicide treatments. The average fiber price for the 2 years was $0.65/lb. The overall
fiber price for Perryman and Windhausen farms was below the average, and the price for Nugent
and Gibbs farms was above the average. None of the treatments changed this situation on a
numerical level. Adjusted revenue was significantly lower with Telone treatments in fields with
lower nematode pressure or better environmental conditions, e.g., higher soil moisture. Therefore,
Telone application may be more profitable in fields with high nematode pressure and more
environmental stress.