Embed Size (px)
Citation preview
EFFECT OF SOME INTENSE SWEETENERS ON RHEOLOGICAL,
TEXTURAL AND SENSORY PROPERTIES OF CHOCOLATE
A THESIS SUBMITTED TO
THE GRADUATE SCHOOL OF NATURAL AND APPLIED SCIENCES
OF
MIDDLE EAST TECHNICAL UNIVERSITY
BY
MUTLU YÜCEKUTLU
IN PARTIAL FULFILLMENT OF THE REQUIREMENTS
FOR
THE DEGREE OF MASTER OF SCIENCE
IN
FOOD ENGINEERING
DECEMBER 2015

Approval of the thesis:
EFFECT OF SOME INTENSE SWEETENERS ON RHEOLOGICAL,
TEXTURAL AND SENSORY PROPERTIES OF CHOCOLATE
Submitted by MUTLU YÜCEKUTLU in partial fulfillment of the requirements
for the degree of Master of Science in Food Engineering Department, Middle
East Technical University by,
Prof. Dr. Gülbin Dural Ünver
Dean, Graduate School of Natural and Applied Sciences
Prof. Dr. Alev Bayındırlı
Head of Department, Food Engineering
Asst. Prof. Dr. Mecit Öztop
Advisor,Food Engineering Dept., METU
Prof. Dr. Behiç Mert
Co-Supervisor, Food Engineering Dept., METU
Examining Committee Members:
Prof. Dr. Gülüm Şumnu
Food Engineering Dept., METU
Asst. Prof. Dr. Mecit Öztop
Food Engineering Dept., METU
Prof. Dr. Behiç Mert
Co-Supervisor, Food Engineering Dept., METU
Assoc. Prof. Dr. İlkay Şensoy
Food Engineering Dept., METU
Asst. Prof. Dr. Elif Turabi Yolaçener
Food Engineering Dept., Hacettepe University
Date: 23.12.2015
iv
I hereby declare that all information in this document has been obtained and
presented in accordance with academic rules and ethical conduct. I also
declare that, as required by these rules and conduct, I have fully cited and
referenced all material and results that are not original to this work.
Name, Last Name: Mutlu Yücekutlu
Signature:
v
ABSTRACT
EFFECT OF SOME INTENSE SWEETENERS ON RHEOLOGICAL,
TEXTURAL AND SENSORY PROPERTIES OF CHOCOLATE
Yücekutlu, Mutlu
M.S., Department of Food Engineering
Supervisor: Assist. Prof. Mecit Öztop
Co-Supervisor: Prof. Behiç Mert
December 2015, 58 pages
Development of a high-quality low-calorie chocolate needs the use of the most
appropriate ingredients that could substitute sugar without negatively affecting
several product properties. Although it is possible to formulate sugar-free or
sugar-reduced chocolates with an acceptable sweetness level, these chocolates
often show poorer sensory properties, especially undesirable mouthfeel, which
could limit their consumption. In this study, low-sucrose chocolates sweetened
with sucralose and stevia by using bulking agents were investigated in relation
to their rheological, textural and sensory attributes. Bitter, milk and white
chocolates with different amounts of sweeteners were formulated. The Casson
model best fitted to the rheological data for all formulations. In dark
chocolates, partial substitution of sucrose with stevia (BCSSt) gave similar
plastic viscosity and yield stress values with control samples (BCS) (p > 0.05).
Hardness measurements also supported these results. BCSSt sample was again
found to be very similar to control in tested sensory attributes when assessed
by a consumer panel. The data indicated that it was possible to manufacture a
vi
chocolate by partial replacement of sucrose with stevia without adversely
affecting its important rheological, textural properties and sensory acceptance.
Keywords: bitter chocolate, low calorie chocolate, stevia, Casson model
vii
ÖZ
BAZI YOĞUN TATLANDIRICILARIN ÇİKOLATANIN REOLOJİK,
DOKUSAL VE DUYUSAL ÖZELLİKLERİNE ETKİSİ
Yücekutlu, Mutlu
Yüksek Lisans, Gıda Mühendisliği Bölümü
Tez Yöneticisi: Assist. Prof. Mecit Öztop
Ortak Tez Yöneticisi: Prof. Behiç Mert
Aralık 2015, 58 sayfa
Yüksek kaliteliye sahip düşük kalorili çikolata üretmek için, kullanılması gereken
şeker ikamesi ürünlerinin son ürünü olumsuz yönde etkilemeyecek, şekilde
seçilmesi gerekmektedir. Tatlılık seviyesi kabul edilebilir olan şekeri azaltılmış ya
da şekersiz çikolata reçeteleri üretmek mümkün olsa da genellikle bu çikolatalar
zayıf duyusal özelliklere sahip olmaktadır. Bu çalışmada, sırasıyla sükraloz ve
stevia ile tatlandırılmış, şekeri azaltılmış olarak tasarlanan çikolataların reolojileri,
yapısal ve duyusal özellikleri incelenmiştir. Farklı tatlandırıcı miktarlarına sahip
bitter, sütlü ve beyaz çikolata reçeteleri geliştirilmiştir. Reolojik açıdan
incelendiğinde, çikolataların en iyi Casson modeline sahip olduğu
gözlemlenmiştir. Kısmi olarak stevia ile tatlandırılan ve sükroz içeren bitter
çikolatanın, sadece sükroz içeren bitter çikolata ile aynı plastik viskoziteye sahip
olduğu gözlemlenmiştir (p ≤ 0.05). Sertlik ölçümleri ile de bu gözlem
desteklenmiştir. Panel testi ile yapılan duyusal analizlerde de kısmi olarak stevia
ile tatlandırılan ve sükroz içeren bitter çikolatanın sadece sükroz içeren bitter
çikolata ile yakın puanlar aldığı gözlemlenmiştir. Çalışmanın sonucunda, kısmi
olarak stevia ile tatlandırılan ve sükroz içeren bitter çikolatanın, reolojik, yapısal
viii
ve duyusal özellikleri olumsuz yönde etkilenmeden endüstriyel olarak
üretilmesinin mümkün olduğu çıkarılabilir.
Anahtar Kelimeler: Çikolata, stevia, düşük kalorili çikolata, Casson Model, reoloji
ix
To My Beloved Family
x
ACKNOWLEDGEMENT
I would like to thank my advisor Assist. Prof. Mecit Öztop for his endless support,
knowledge, trust and encouragement throughout this study. He always tried to
help me and it would be very hard to complete my study without his support and
knowledge. I am also grateful to my co-advisor Prof. Behiç Mert for his valuable
advices and laboratory support throughout this study.
I would like to thank members of my thesis committee, Prof. Dr. Gülüm Şumnu,
Assoc. Prof. İlkay Şensoy and Assist. Prof. Elif Turabi Yolaçaner for their valuable
comments. I would like to express my gratitude to my laboratory group members,
especially İrem Alaçık, Ezgi Ayaz, Umut Erkılıç, Selen Güner, Helin Karaçam,
Pelin Poçan and Kübra Ünal for their support and friendships.
I would also like to thank ETİ Food Company for supplying raw materials for my
experiments during the study.
I would like to extend my thanks to the Research Assistants at our department,
Sevil Çıkrıkçı, and Emrah Kırtıl for their help and friendships. Especially, the
valuable support of Sevil helped a lot to finalize this study.
I would like to express my sincere to Hilal Berberoğlu, one of my close friends. It
would be difficult to complete this study without her endless support,
encouragement and motivation in my stressful days. It is my lucky to have such a
friend in my life.
Finally, my deepest gratitude goes to my family, my mother Emine Yücekutlu,
my father Ufuk Yücekutlu and my brother Utku Yücekutlu for their endless love,
support and patience. They always trust and encourage me during my education
life. Any word can exactly express my love and appreciation to them. I dedicate
this work to my beloved family.
xi
TABLE OF CONTENTS
ABSTRACT ............................................................................................................................... v
ÖZ ............................................................................................................................................ vii
ACKNOWLEDGEMENT ......................................................................................................... x
TABLE OF CONTENTS .......................................................................................................... xi
LIST OF TABLES ................................................................................................................... xv
LIST OF FIGURES ................................................................................................................ xvi
LIST OF ABBREVIATIONS ................................................................................................ xvii
CHAPTER 1 .............................................................................................................................. 1
1. INTRODUCTION.................................................................................................................. 1
1.1 Chocolate ............................................................................................................................. 1
1.2 Ingredients Used in Chocolate Industry ............................................................................... 3
1.2.1 Cocoa ................................................................................................................................ 4
1.2.2 Sweeteners ........................................................................................................................ 4
1.2.2.1 Sugar .............................................................................................................................. 4
1.2.2.2 Sucralose ........................................................................................................................ 4
1.2.2.3 Stevia .............................................................................................................................. 5
1.2.3 Milk ................................................................................................................................... 6
1.2.3.1 Whole milk powder or full cream milk powder ............................................................. 6
1.2.3.2 Skimmed milk powder ................................................................................................... 7
1.2.3.3 Milk fat or butter oil ....................................................................................................... 7
1.2.4 Emulsifiers ........................................................................................................................ 7
1.2.4.1 Lecithin E322 ................................................................................................................. 7
1.2.4.2 PGPR E476 .................................................................................................................... 8
1.2.5 Inulin ................................................................................................................................. 8
1.2.6 Maltodextrin ...................................................................................................................... 8
xii
1.3 Compositional Effects on Rheology ..................................................................................... 9
1.3.1 The Effect of Fats .............................................................................................................. 9
1.3.2 The Effect of Sweeteners ................................................................................................... 9
1.3.3 The Effect of Milk and Products ..................................................................................... 10
1.3.4 The Effect of Emulsifiers ................................................................................................ 10
1.4 Quality of Chocolate ........................................................................................................... 12
1.4.1 Rheological Measurements ............................................................................................. 12
1.4.2 Sensory Evaluation of Chocolate .................................................................................... 13
1.5 Objective of the Study ........................................................................................................ 13
CHAPTER 2 ............................................................................................................................. 15
MATERIALS AND METHOD ............................................................................................... 15
2.1. Materials ............................................................................................................................ 15
2.2 Methods .............................................................................................................................. 15
2.2.1 Chocolate Preparation ..................................................................................................... 15
2.2.1.1 Mixing of raw materials ............................................................................................... 15
2.2.1.2 Refining and conching of chocolate mixture ................................................................ 16
2.2.1.3 Tempering of chocolate ................................................................................................ 16
2.2.1.1.4 Molding of chocolate ................................................................................................. 16
2.2.3 Sensory Evaluation of Chocolate Samples ...................................................................... 16
2.2.4 Rheological Characterization of Chocolate ..................................................................... 17
2.2.5 Physical Analyses of Chocolate ...................................................................................... 17
2.2.5.1 Color ............................................................................................................................. 18
2.2.5.2 Texture Profile Analysis ............................................................................................... 19
2.2.5.3 Moisture Content Measurements .................................................................................. 19
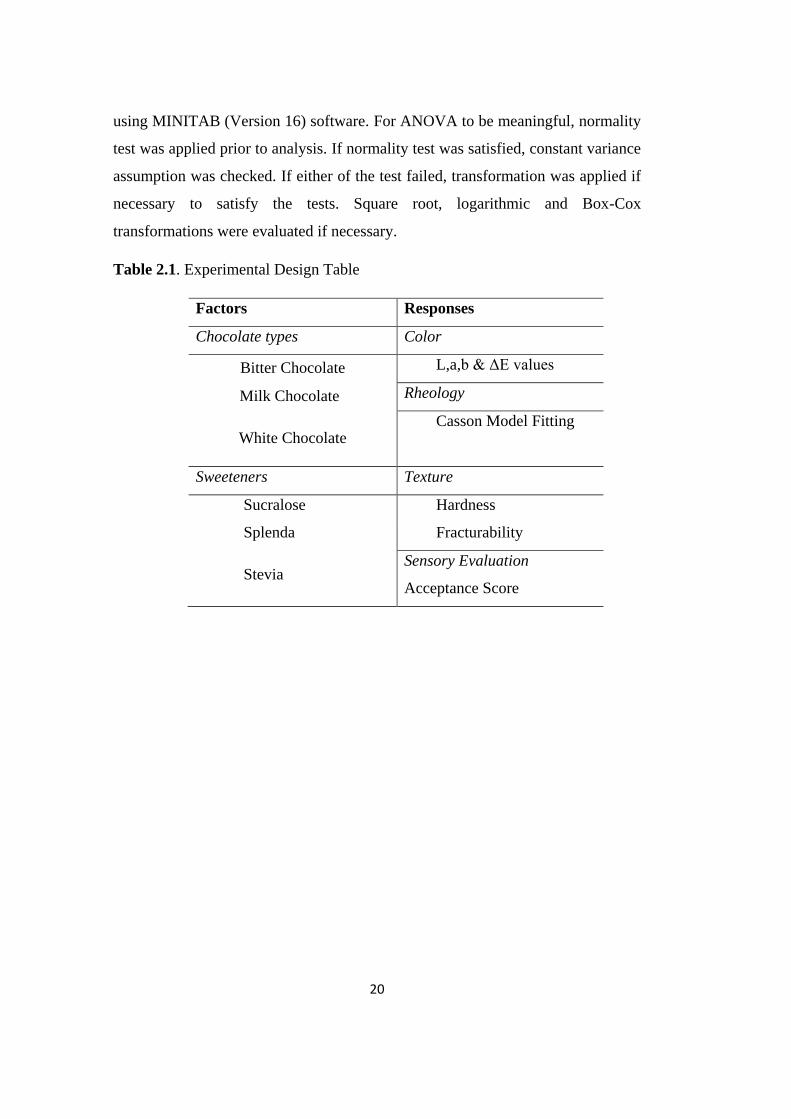
2.2.6 Experimental Design and Statistical Analysis ................................................................. 19
CHAPTER 3 ............................................................................................................................. 23
RESULTS AND DISCUSSIONS ............................................................................................ 23
3.1 Effects of Sweeteners on Sensory Properties of Different Chocolate
Formulation .............................................................................................................................. 23
xiii
3.2. Effects of Sweeteners on Rheological Properties of Different Chocolate
Formulations ............................................................................................................................ 26
3.2 Effects of different sweeteners on texture properties of bitter chocolate ........................... 31
3.3 Effects of Different Sweeteners on Color of Chocolates ................................................... 34
CHAPTER 4 ............................................................................................................................ 39
CONCLUSION AND RECOMMENDATIONS ..................................................................... 39
REFERENCES ......................................................................................................................... 41
Appendix A .............................................................................................................................. 47
ANOVA Tables ........................................................................................................................ 47
Appendix B .............................................................................................................................. 58

xiv
xv
LIST OF TABLES
TABLES
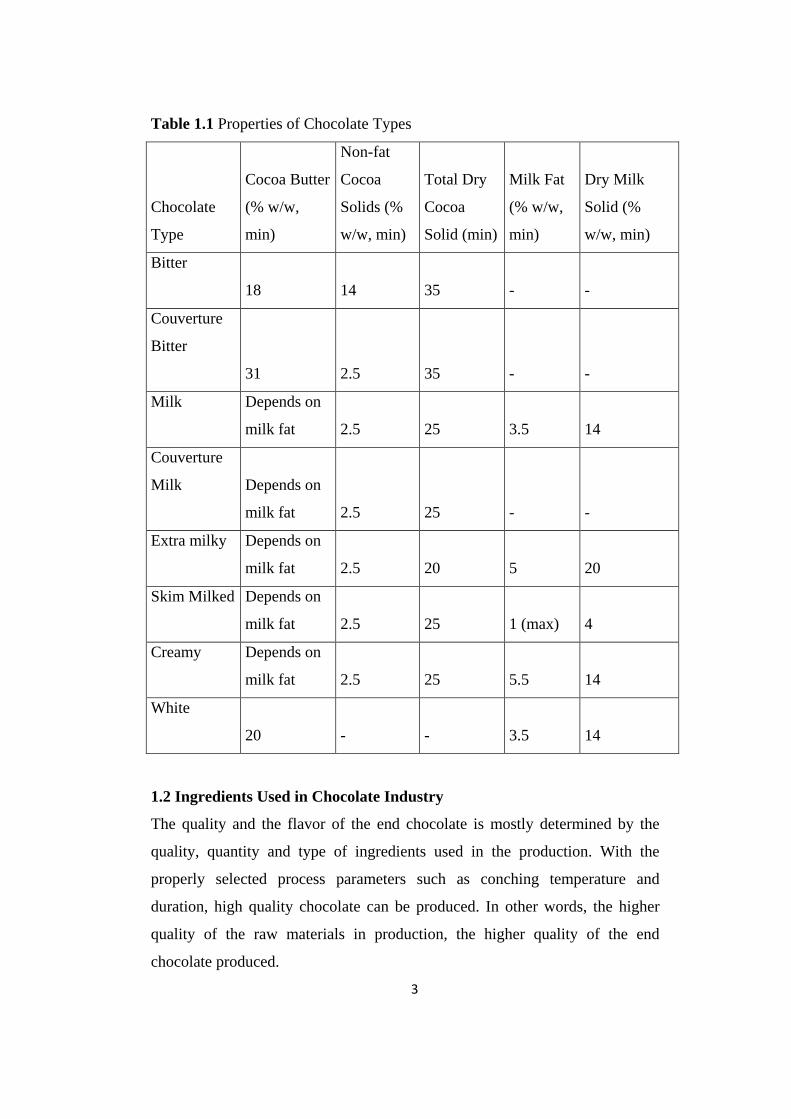
Table 1.1 Properties of Chocolate Types…………………………………………3
Table 2.1 Experimental Design Table …………………......................................20
Table 2.2 Composition of Chocolate Formulations……………………………..21
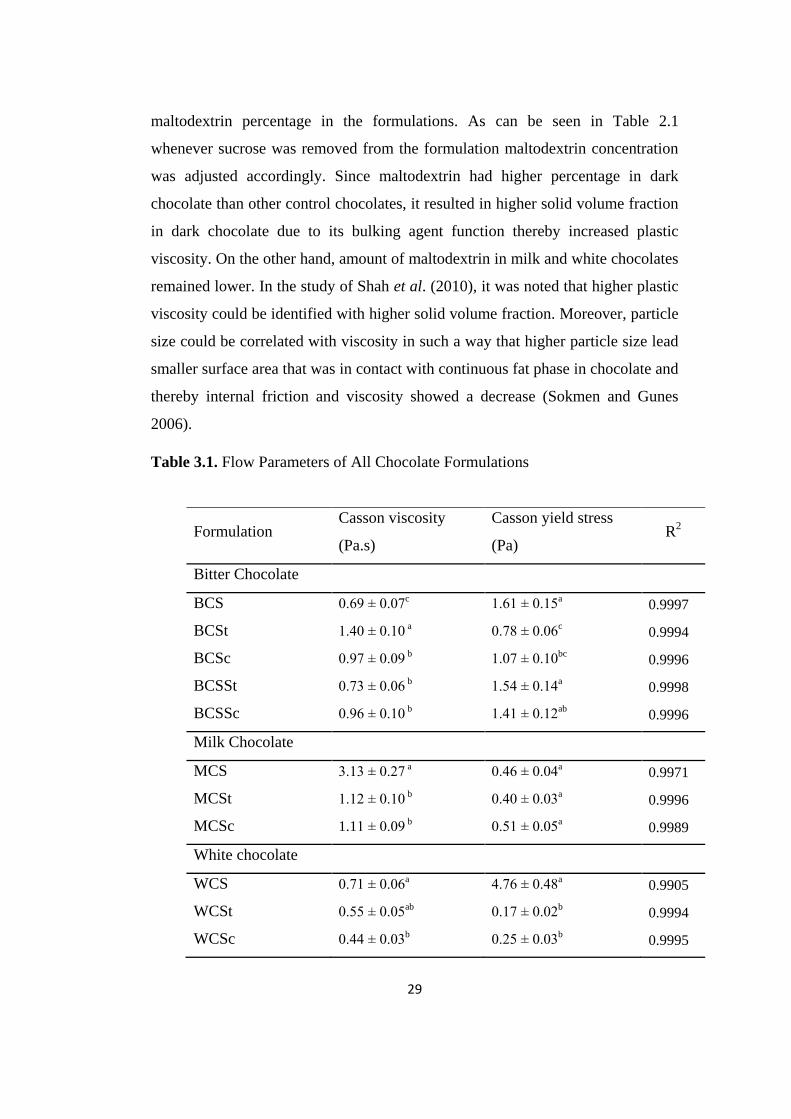
Table 3.1 Flow Parameters of All Chocolate Formulations……………………..29
Table 3. 2 Color Analysis Results of Chocolate Formulations………………….35
Table 3.3 Color Analysis Results of Milk and White Chocolate (2 Way ANOVA
results)…………………………………………………………………………...36
Table A.1 One Way ANOVA for hardness and fracturability and moisture
contents of bitter chocolates containing different sweeteners………………..….47
Table A.2 One Way ANOVA for L and a,b and E values of bitter chocolates
containing different sweeteners………………………………………………….49
Table A.3 One Way ANOVA for L and a,b and E values of milk chocolates
containing different sweeteners………………………………………………….50
Table A.4 2-Way ANOVA for L and a,b and E values of milk chocolates
containing different sweeteners………………………………………………….53
Table A.5 ANOVA for L and b and E values of white chocolates containing
different sweetener………….……………………………………………………56
Table B.1 Sensory Evaluation Sheet……………………………………….……58
xvi
LIST OF FIGURES
FIGURES
Figure 1. Chemical structure of sucralose………………………………………...5
Figure 2. Chemical structure of stevia …………………………………………...6
Figure 3.1 Preference of bitter chocolate with composition of sucrose-sucralose24
Figure 3.2 Preference of bitter chocolate with composition of sucrose-Stevia…24
Figure 3.3 Preference of bitter chocolate with different sweeteners…………….26
Figure 3.4. Flow Curves for BCS, BCSSt, BCSc, BCSSt and DCSSc ………....27
Figure 3.5 Moisture contents bitter chocolate with different sweeteners……….31
Figure 3.6 Hardness of bitter chocolate with different sweeteners……………...33
Figure 3.7 Fracturability of bitter chocolate with different sweeteners…………33
xvii
LIST OF ABBREVIATIONS
BCS Bitter Chocolate with Sucrose
BCSp Bitter Chocolate with Sucralose
BCSt Bitter Chocolate with Stevia
BCSSp Bitter Chocolate with Sucrose and Sucralose
BCSSt Bitter Chocolate with Sucrose and Stevia
MCS Milk Chocolate with Sucrose
MCSp Milk Chocolate with Sucralose
MCSt Milk Chocolate with Stevia
WCS White Chocolate with Sucrose
WCSp White Chocolate with Sucralose
WCSt White Chocolate with Stevia
BCP 10:0.5 Bitter Chocolate with 10 g sucrose and 0.5 g Sucralose
BCP 12:0.5 Bitter Chocolate with 12 g sucrose and 0.5 g Sucralose
BCP 14:0.5 Bitter Chocolate with 14 g sucrose and 0.5 g Sucralose
BCP 15:0.5 Bitter Chocolate with 15 g sucrose and 0.5 g Sucralose
BCT 10:0.5 Bitter Chocolate with 10 g sucrose and 0.5 g stevia
BCT 12:0.5 Bitter Chocolate with 12 g sucrose and 0.5 g stevia
BCT 14:0.5 Bitter Chocolate with 14 g sucrose and 0.5 g stevia
BCT 15:0.5 Bitter Chocolate with 15 g sucrose and 0.5 g stevia

1
CHAPTER 1
INTRODUCTION
1.1 Chocolate
Even most people describe chocolate as a food that elevates mood and gives
positive emotions and pleasure (Macht, Dettmer, 2006), the scientific definition of
chocolate is semi-solid suspensions of non-fat particles of sweeteners, cocoa
solids and milk solids in a continuous fat phase of cocoa butter (Afoakwa, 2010,
p.1).
Cocoa solid which is the main ingredient of chocolate is derived from cocoa beans
obtained from Theobroma cocoa tree and the use of cocoa beans has more than
1000 years history. Cocoa is known as one of the major blocks of Mayan
agriculture and religion. Also, cocoa was presented like valuable gift to deceased
dignitaries at their funeral ceremonies.
In 1500s, the evidences showed that chocolate was treated as a medicine when
brought to Europe. Chocolate mixed with various species like vanilla, Roses of
Alexandria, cinnamon was advised to the patients according to their complaints
until 1600s. The first sweet chocolate recipe was prepared with the addition of
honey, cinnamon and cane sugar in Oaxaca, Mexico by monks. After the
discovery of this sweet taste, chocolate industry started to grow and develop.
When the dates showed 1900s, all inventions that made chocolate as modern as
today was completed (www.callebaut.com. Last visited: October, 2015). New
technologies are being developed day by day to produce high quality chocolates.
2
The consumption and the preference of the chocolate change depending on the
country, gender and age. A person consumes about 100 gr of chocolate per year in
Asia, whereas England is the top of the consumption list with 11 kg chocolate per
year (www.callebaut.com. Last visited: October, 2015).
There are three common types of chocolate that are produced in the industry;
bitter, milk and white chocolate. Bitter chocolate or dark chocolate mainly
consists of cocoa mass, cocoa butter and sugar. Cocoa powder is also added to the
chocolate dough to increase the total cocoa solids without changing the overall fat
percentage and to increase intense of the cocoa flavor. According to the Institute
of Turkish Standards (ITS), there are two types of bitter chocolate; bitter
chocolate and couverture bitter chocolate. Milk chocolate contains also cocoa
mass, cocoa butter and sugar, in addition with milk solids and milk fats replacing
some of the cocoa butter. Five different types of milk chocolate are present on ITS
which differs by dry cocoa solid, milk fat and dry milk solid contents . The
chocolate types and their compositions are shown in Table 1. White chocolate on
the other hand does not contain cocoa solids. There are only milk powder, sugar
and cocoa butter as ingredients. Usually deodorized cocoa butter is preferred to
prevent the off taste of pressed cocoa butter. Chocolate should contain 20% of
cocoa butter, 3.5% milk fat and 14% dry milk solids to be named as white
chocolate as reported in ITS.
3
Table 1.1 Properties of Chocolate Types
Chocolate
Type
Cocoa Butter
(% w/w,
min)
Non-fat
Cocoa
Solids (%
w/w, min)
Total Dry
Cocoa
Solid (min)
Milk Fat
(% w/w,
min)
Dry Milk
Solid (%
w/w, min)
Bitter
18 14 35 - -
Couverture
Bitter
31 2.5 35 - -
Milk
Depends on
milk fat 2.5 25 3.5 14
Couverture
Milk
Depends on
milk fat 2.5 25 - -
Extra milky
Depends on
milk fat 2.5 20 5 20
Skim Milked
Depends on
milk fat 2.5 25 1 (max) 4
Creamy
Depends on
milk fat 2.5 25 5.5 14
White
20 - - 3.5 14
1.2 Ingredients Used in Chocolate Industry
The quality and the flavor of the end chocolate is mostly determined by the
quality, quantity and type of ingredients used in the production. With the
properly selected process parameters such as conching temperature and
duration, high quality chocolate can be produced. In other words, the higher
quality of the raw materials in production, the higher quality of the end
chocolate produced.
4
1.2.1 Cocoa
Cocoa is the most important and most used ingredient in the production of
chocolate. Besides cocoa, cocoa mass and cocoa butter are also obtained from
cocoa and cocoa beans. The type of cocoa, the climate and the soil conditions
of cocoa beans cultivated naturally effect the cocoa flavor, and also cocoa mass
and butter. In further steps of the production, the majority flavor of the
chocolate is developed by the roasting and conching steps.
To produce cocoa mass also known as cocoa liquor, firstly fermented and dried
cocoa beans are selected and roasted, then by using winnowing, the shell is
removed the roasted nibs are ground using pin mills and ball mills. Cocoa
butter is produced by pressing of the cocoa mass.
1.2.2 Sweeteners
1.2.2.1 Sugar
Sucrose, which is extracted from either sugar cane, or sugar beet, is used for
chocolate processing in its crystalline form as the main sugar source. Providing
sweetness is the main function of sugar in chocolate. Normally industrial
granulated sugar is used and depending on the particle size of the sugar its
addition sequence to the processing differs. If a single stage refining process is
used, sugar is milled before adding to the mixer and further reduction occurs in
the process. If a two-stage refining process is used, granulated sugar is added
directly to the chocolate mixer, and reduction in particle size is achieved through
this two-staged process, which consists of pre-finer followed by a second stage
five-roll refiner. Particle size distribution is an important attribute of final
product's rheology, since the amount of very small particles plays important role.
This distribution affects not only rheology, but also the yield value of the
chocolate samples particularly (Afoakwa, 2010).
1.2.2.2 Sucralose
Sucralose is a non-digestible artificial sweetener that has no nutritive value. The
main property of sucralose is that when it is taken to the body, it cannot be broken
5
down (Merck, 2006). This is why it is called as non-caloric sweetener
(www.foodinsight.org, last visited: May, 2015). The sweetness of sucralose is
almost 600 times higher than sucrose (Grotz & Munro, 2009). Also, sucralose can
remain unchanged under heat treatments. Therefore, it can be used in processes
that require high temperatures (Food Sanitation Council Notice, No.5, 1999).
Sucralose is obtained by substitution of three hydroxyl groups with chlorine
groups. Primary alcohol group is selected and chlorination is partially applied to
acetylated sugar with excess chlorinating agent. Then, acetyl groups are removed
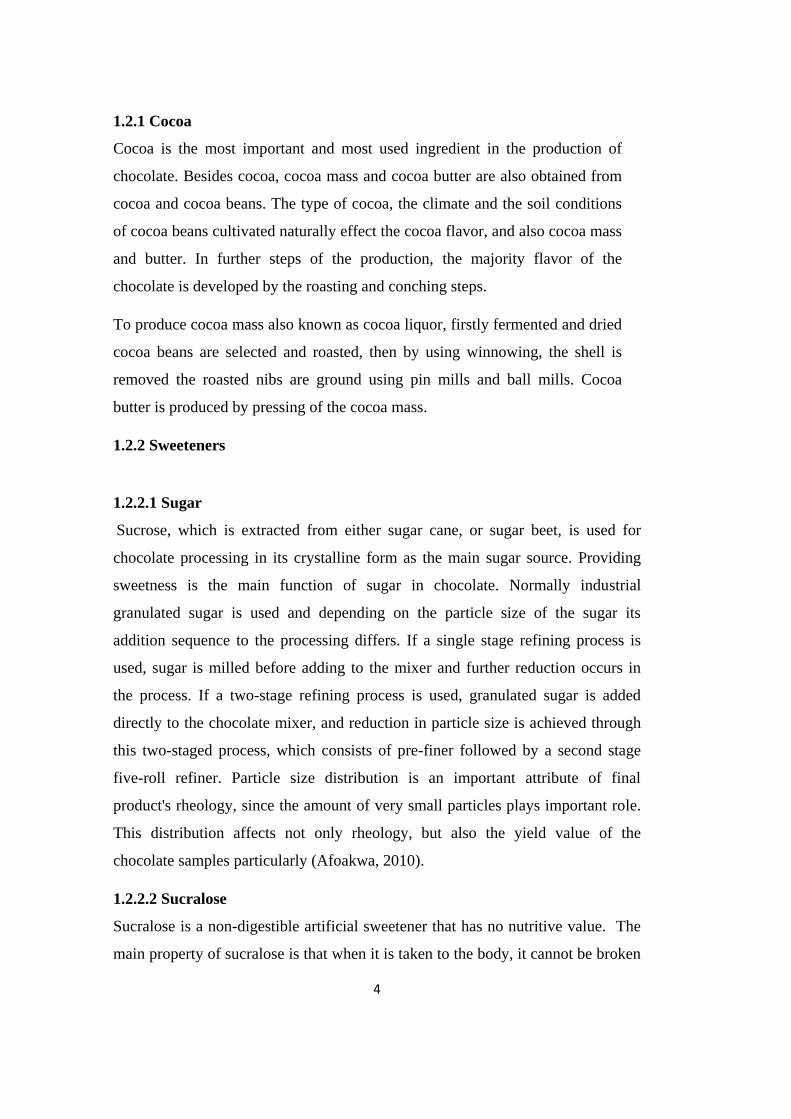
from molecules to get desired the product (Bert Fraser-Reid, 2012). Chemical
structure of sucralose is sown in Figure 1
(http://pubchem.ncbi.nlm.nih.gov/compound/Sucralose, last visited: October,
2015). As seen, sucralose is a disaccharide consisting of a galactose and fructose
residue where 3 OH groups are chlorinated. Currently the commercial brand name
of sucralose is Splenda (www.splenda.com, last visited: May, 2015)
Figure 1. Chemical structure of sucralose
McNeil Nutritionals, LLC (McNeil), a Johnson & Johnson company, markets the
sweetener as Splenda® which contains the non-nutritive sweetener sucralose, and
maltodextrin that adds texture and volume (Grotz & Munro, 2009).
1.2.2.3 Stevia
Stevia is a natural sweetener that is extracted from the leaves of the Stevia
rebaudiana (http://www.intheraw.com/products/stevia-in-the-raw. Last visited:
October, 2015). Steviol glycosides are the main structure that makes stevia 300
times sweeter than sucrose (Geuns, 2003) and it is also non-digestible (Goyal,
Samsher, & Goyal, 2010). Stevia in the Raw® sweetener includes mixture of
stevia and bulking agents (dextrose or maltodextrin)
(http://www.intheraw.com/products/stevia-in-the-raw. Last visited: October,
6
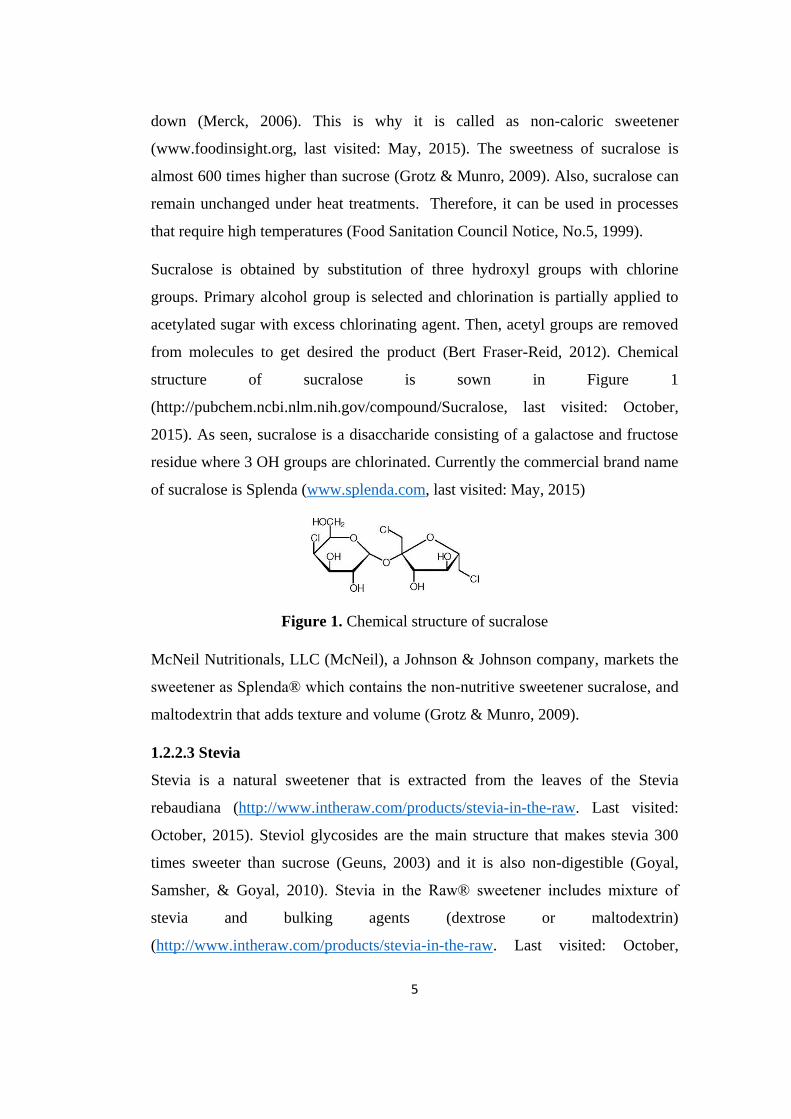
2015). Chemical structure of sucralose is sown in Figure 2
(http://www.inchem.org/. last visited: October, 2015)
When taken to the body, it is metabolized to steviosides, then broken down to
glucose and steviol. This emerged glucose is used by the bacteria located on the
colon and cannot be absorbed into the bloodstream. Also, steviol cannot be
digested further, and finally it is excreted (Koyama, E., et al., 2003).
Figure 2. Chemical structure of stevia
1.2.3 Milk
In order to produce milk chocolate and white chocolate, different forms of milk
are used in combination with cocoa and sugar. When developing a formulation
for a milk and white chocolate, it is crucial to understand the characteristic and
composition of each milk products so as to meet the legal requirements.
1.2.3.1 Whole milk powder or full cream milk powder
Spray drying and roller drying are the common ways of producing milk
powder, which is also known as dehydrated whole milk. The main principle of
the process is evaporating water in the milk by using either heated air in a
spray tower, or on heated rolls. Both processes results in powder but even the
compositions are same; flavor characteristics and process performance differ.
The composition is 26-27% milk fat, 70% non-fat milk solids and 3.5% water
approximately (Afoakwa, 2010, p.52). For maintaining creamy and milky
notes, whole milk powder is preferred due to its flavor influence. Roller dried
powder has minor caramelization due to heated rollers in its process, and
7
makes it more preferable. In addition to this, as compared to spray dried
powder, roller drying powder has higher levels of free fat content. In spray
dried powder, milk fat bounds to powder particles. The free fat content is
important because it dominates the mixing and refining stages of chocolate
processing, and eventually rheology of chocolate is affected. The moisture
content of the powders also controls process parameters and rheology (Beckett,
2010).
Spray drying is a trending process due to its less investment as compared to
roller drying. In the light of information above, it is important to choose wisely
which milk powder is used in production, considering flavor, fat contribution
to rheology at the same fat content, and cost (Beckett, 2010).
1.2.3.2 Skimmed milk powder
Before drying process, nearly all-fat content is removed from the liquid form of
the milk, and this results in very low fat content powder, which is less than 1%.
Skimmed milk introduces milky flavor to the formulation. When formulating
new recipes, it can be used to increase milk solid levels while not affecting the
overall fat content. In addition, combining with milk fat instead of whole milk
powder gives a softer final product (Afoakwa, 2010).
1.2.3.3 Milk fat or butter oil
This is the natural fat in milk, which is nearly liquid at room temperature; and
its solid fat content is about 11% (Afoakwa, 2010). Manufactured form of milk
fat is either butter or cream. Milk fat in combination with cocoa butter is used
to give softer texture to the final product. Milk fat addition is also used for
avoiding bloom formation.
1.2.4 Emulsifiers
1.2.4.1 Lecithin E322
Soya lecithin is a common emulsifier used in chocolate. Even small amounts
have powerful effect on the rheology on chocolate. Lecithin addition results in
8
reduction in both viscosity and the yield value. It means that less cocoa butter
is needed so it is cost-saving (Afoakwa, 2010).
As particle size (fineness) of chocolate decreases, the amount of required
lecithin increases to improve rheology. As the fat content of chocolate
increases, the ability of lecithin to rule rheology decreases. Last not but least,
feature of the lecithin is its effect on the yield value (Afoakwa, 2010). Above
certain concentrations, the impact on yield value is reversed. For every
formulation, there is an optimum level with respect to the fat, moisture content
and particle size distribution (www.solae.com. Last visited October, 2015).
1.2.4.2 PGPR E476
PGPR (polyglycerol polyricinoleate) is mainly used as emulsifiers in chocolate
processing. It is not used as sole emulsifier; it is used as combination with lecithin
or ammonium phosphatide. The effect of PGPR on viscosity is insignificant;
however it has compelling effect on yield value (Schantz and Rohm, 2005).
1.2.5 Inulin
Inulin is a kind of polysaccharide that occurs naturally in most plants that is used
to store the energy in roots or rhizomes (Roberfroid M., 2005). Inulin is a sub-
group of dietary fibers known as fructans and has heterogeneous collection of
fructose polymers. Glucosyl and fructosyl components are linked by β (2,1) bonds
that make inulin non-digestible by enzymes present in the human alimentary
system (Kalyani Nair et al, 2010). Moreover, inulin has no taste and has little
impact on sensory characteristic of the products in which added. When considered
the nutritional benefits, inulin is a source of soluble fibers and can be classified as
prebiotics. With these properties, inulin can be used to replace sugar or fat in the
reduced calorie products and the products suitable for diabetics.
1.2.6 Maltodextrin
Maltodextrin is a polysaccharide that is produced from starch by partial
hydrolysis. Maltodextrin is an easily digestible and absorbable food additive. D-
9
glucose units connected by chains of variable length with range from three to
seventeen glucose units long are the structure of the maltodextrin (Kennedy et al,
1995). Maltodextrin is classified by using dextrose equivalent (DE) number from
3 to 20. The DE is the measurement of the amount of reducing sugar present in a
product. The higher the DE value, the shorter the glucose chains; the higher the
sweetness, the higher the solubility and the lower heat resistance (Hashizume and
Okuma, 2009). In addition maltodextrin has no flavor, it improves the mouthfeel
of the products added in. By taking this advantage, maltodextrin is used as a filler
in sugar-substituted products.
1.3 Compositional Effects on Rheology
1.3.1 The Effect of Fats
The main fat source of chocolate comes from cocoa butter, which makes
chocolate a unique food. The actual fat content depends on the type and the
application. For instance, the ice cream coating chocolate has higher amount of
fat than tablet chocolate. It can be considered that a high quality chocolate
means high fat content with lower particle size (Afoakwa, 2010).
Plastic viscosity is proportionally more affected than yield value when there is
a change in fat content. According to Beckett (2010), this phenomenon is
explained due to extra fat combining with only free moving fat whose function
is to help particles while flowing past each other. The higher free fat content,
the less energy required to keep moving once motion. Ultimately, plastic
viscosity decreases dramatically as the fat content increases.
1.3.2 The Effect of Sweeteners
Sugar is used in chocolate as it gives sweetness. Changes up to 2% of sugar
affect cost; on the other hand, changes below 5% result in large flavor
alterations (Beckett, 2010).
In the industry, fine crystalline sucrose is usually preferred as sweetener. The
reason why monosaccharides as glucose and fructose are rarely used is to have
10
difficulties to dry them. Additional moisture increases the interaction between
sugar particles which causes increase in viscosity.
Moreover, there is an increasing trend in reduced-calorie and sugar-free
chocolates for the people who are cautious on their diets (Parpinello et al.
2001). Chocolates that contain sugar alcohols are suitable for diabetics (Zumbe
& Grosso, 1993; Olinger, 1994; Olinger &Pepper, 2001; Sokmen & Gunes,
2006). The most common sugar alcohols used in chocolate industry are
sorbitol, mannitol, xylitol and lactitol. Replacement of sugar with its substitutes
brings rheological and textural changes that affect the quality of end product.
According to the research of Sokmen and Gunes (2006), maltitol containing
chocolate as sweetener had similar rheological properties of chocolate
contained sucralose.
The point, however, that should be considered when planned to produce
chocolate containing sugar alcohols is the EU legislation that limits the
consumption of sugar alcohols to maximum 20 g per day due to its laxative
effects (Krüger, 1999).
1.3.3 The Effect of Milk and Products
Milk contains about 5% lactose, 5% milk fat, 3.5% protein and 0.7% minerals.
Milk fat is liquid at room temperature and used in chocolate to soften the
texture, yet, milk fat has risk to be oxidized due to its chemistry and effects the
sensory attributes and shelf life of the end products.
Milk proteins, 80% caseins and 20% whey proteins, are used to give chocolate
a creaminess taste. Besides, caseins create fraction like surfactants and reduce
the viscosity of chocolate, while whey proteins have opposite effects by
increasing the viscosity (Haylock & Dodds, 1999).
1.3.4 The Effect of Emulsifiers
Chocolate consists of continuous fat phase with sugar that makes it have both
hydrophilic and lipophilic structures and never being dissolved naturally each
11
other. It is the reason to use surface-active agents to be coat surfaces with fat. It
also helps to reduce fat amount in the production. Lecithin, gums, soluble
polysaccharides are generally preferred as natural surfactants in the chocolate
industry by considering the desired end product specifications (Schantz &
Rohm, 2005).
Lecithin is the byproduct of soya oil production and a mixture of
phosphoglycerides. Lecithin enables the lubrication between sugar, cocoa
particles and fat crystals that facilities the flow of the chocolate mass more
liquid. The phenomena behind is that all hydrophilic particles, sugar and cocoa
particles are covered with a lecithin mono molecular layer that gives
lubrication with hydrophobic fats (www.solae.com). Last visited October,
2015). 0.1% to 0.3% addition of the lecithin decreases the viscosity of the
chocolate. Yield values starts to increase more than 0.5% by addition of
lecithin while plastic viscosity continues to fall (Chevalley, 1999; 2000;
Schantz & Rohm, 2005). The limit for addition of the lecithin is up to 1%
maximum.
Polyglycerol polyricinoleate, PGPR is used to adjust the yield value of the
chocolate. Even 0.2% addition of PGPR can reduce the yield value by 50% and
makes the chocolate behave like Newtonian liquid (Rector, 2000; Schantz &
Rohm, 2005). The same rheological property can be obtained by adding more
cocoa butter. However, the more cocoa butter addition, the higher the cost.
Instead, PGPR is usually preferred due to its economics. The EU legislation
limits the addition of PGPR in cocoa based confectionary at 0.5% maximum
level (Rector, 2000).
Usually in chocolate industry, the combination of PGPR and lecithin is used to
adjust the rheological properties of chocolate. Yield value decreases and
viscosity slightly increases by adding PGPR with 0.5% of lecithin (Rector,
2000).
12
1.4 Quality of Chocolate
1.4.1 Rheological Measurements
Rheology describes the relationship between the force and the deformation as a
function of time. The word rheology comes from rheo, from the Greek word for
flow, and –ology, meaning study of. Chocolate has a complex structure since it
contains solid particles that are sugar, non-fat cocoa solids and milk solids in a fat
continuous phase of cocoa butter. The flow of chocolate is non-Newtonian liquid
exhibiting non-ideal plastic behavior; the mean is that when the yield value has
been overcome first, shear-thinning exists. While shear rate increases, three
dimensional structure of material aligns in the stream lines which is formerly
collapsed and became asymmetric particles. This incident causes a decrease in
viscosity, and at certain point, it is independent of shear rate at high shear stress
(Afoakwa, 2010).
In case of chocolate rheology has two major aspects; plastic viscosity and yield
value. The plastic velocity is the energy required to keep the motion of the
chocolate after start to flow. It is the measure of the internal friction of a fluid.
Yield value is the force needed to start the flow, it is shear stress at which not only
deformation occurs but stationary flow begins (Beckett, 2010). The rheological
properties of the chocolate are important to determine the process parameters such
as pumping or for the quality of the final products and exact weight control during
molding, enrobing or dipping applications (Afoakwa, 2010).
Even the Herschel–Bulkley model and the Casson model are used to describe the
non-ideal plastic behaviors, the Casson model is accepted by International
Confectionery Association (IOCCC) for chocolate rheology with recommendation
of that yield values be measured at low shear rates and viscosities at high shear
rates because only a single equation using a small set of parameters is not enough
to describe chocolate flow sufficiently. Rotational viscometers with concentric
cylinders (bob and cup geometry) is suggested with using the parameters of the
stress and viscosity at shear rates between 2 and 50 s−1 using up and down
curves, preceded by a pre-shear at 5 s−1 of more than 5 minutes (Servais et al.,
2004).
13
1.4.2 Sensory Evaluation of Chocolate
When it is of chocolate, it is inevitable to talk about sensory evaluation. The
evaluation is applied for appearance, taste, mouth feel, flavor and aftertaste either
subjectively or objectively. If the taster just says his opinions whether likes or
dislikes, it becomes subjective evaluation. It can be considered as objective
measurements when there are scoring systems determined by the trained panelists
or instrumental analyses such as rheology or textural studies. The main point is
that there should be consistency of instrumental data and sensory attributes.
Sensory analyses can be done in three ways; analytical and affective methods. The
aim is to rate the differences or similarities between the products for sensory
attributes usually applied with 10-20 assessors in analytical methods. If the large
number of panelists selected based on the target group of the products are
involved to investigate the preference or acceptance of the products, then it is
called the affective method. In descriptive method, some special techniques as
Flavour Profile®, Quantitative Descriptive Analysis®, Texture Profile Analysis®
and Sensory Spectrum® and words that describe the products are used together
(Lawless and Heymann, 1998).
1.5 Objective of the Study
Development of a high-quality low-calorie chocolate needs the use of the most
appropriate ingredients that could substitute sugar without negatively affecting
several product properties. The developed chocolate should be feasible for
manufacturing and meet the sensorial expectations for consumers. Therefore, the
main objective was to investigate the effect of some intense sweeteners on
rheological, textural and sensory properties of chocolate to develop high-quality
low-calorie chocolate.
Sucralose and stevia were chosen as sweeteners in this study. Formulations with
sucrose as control were also investigated. The reason was to observe the effect
both artificial and natural sweeteners to properties of developed chocolate.

14
15
CHAPTER 2
MATERIALS AND METHOD
2.1. Materials
For chocolate production, raw materials which are cocoa liquor, cocoa butter and
whole milk powder were supplied from ETİ Food Industry and Co. Inc.
(Eskişehir, Turkey). Icing sugar (Bağdat Baharat, Ankara, Turkey) was bought
from local markets. As sweeteners, sucralose (Splenda®
, USA, having 5%
sucralose) and stevia extract (Stevia in The Raw®
, USA, having 5% stevia extract)
were used. Lecithin (Cargill) was used as emulsifying agent. Inulin (Smart Kimya
Ltd., Cigili, Turkey) was used to develop taste and texture of chocolate containing
sweeteners. Maltodextrin (Sunar Co. Inc., Adana, Turkey) was used as a filler to
stretch the taste of sweetness of chocolate containing sweeteners and as bulking
agent to replace sugar.
2.2 Methods
2.2.1 Chocolate Preparation
2.2.1.1 Mixing of raw materials
Firstly cocoa butter was melted in a double boiler (Fondue Maker, Tchibo Inc,
Germany) and then cocoa liquor was added. After melting of both, sucrose,
sucralose or stevia was added to the mixture. Lastly, lecithin was added and the
mixture was stirred. For milk chocolate, whole milk powder was added at this
stage. For white chocolate, only cocoa butter was melted in the double boiler.
Whole milk powder was also added at this stage.
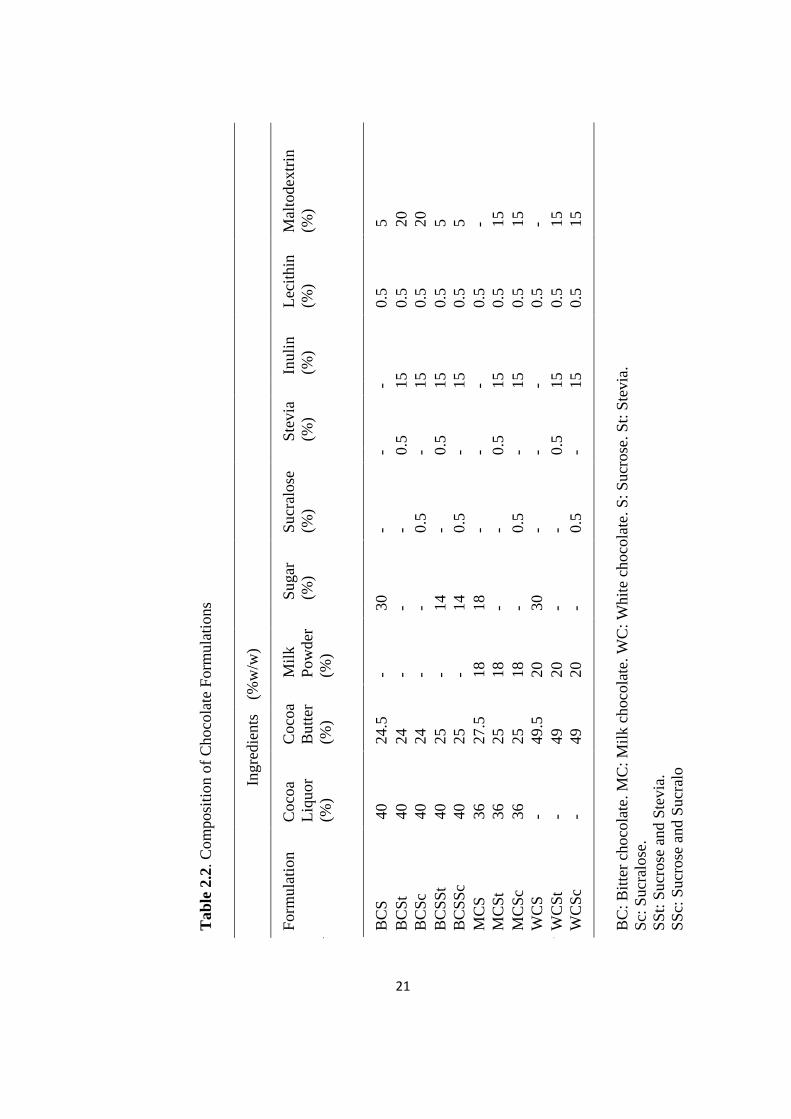
Factors and the corresponding levels studied and the chocolate formulations are
given in Table 2.1 and Table 2.2 respectively at the end of the chapter.
16
2.2.1.2 Refining and conching of chocolate mixture
The mixture was transferred to ball mill vessel for refining and conching steps
simultaneously. The ball mill (Retsch, PM 100, Germany) was adjusted to manual
settings with 250 rpm for 60 minutes.
2.2.1.3 Tempering of chocolate
Performing tempering on a marble is usually considered an old and classical way.
It is a common convention that is conducted at R & D laboratories of chocolate
manufacturing companies when special tempering equipment is not available. In
this study, tempering was conducted using a marble. Following conching and
refining, the chocolate mixture was heated to 45±2 °C using the double boiler and
afterwards 2/3 portion of the chocolate was cooled gradually to 27±1 °C on to the
marble surface. Finally, remained portion of the chocolate in the boiler that was at
45±2 °C was added to the one on the surface and temperature was increased to
30±1 °C while continuously spreading the chocolate on the marble surface.
2.2.1.1.4 Molding of chocolate
Chocolates were molded for texture analysis. Tempered chocolate was poured to
rectangular molding materials with dimensions of 75 mm length, 25 width and 10
mm height.
2.2.3 Sensory Evaluation of Chocolate Samples
Sweetener levels that were used on chocolate formulations were based on
literature and the standards that are used worldwide. Stevia and sucralose
concentrations on the formulations were kept at 0.5% by considering the
studies of Abhishek et. al (2010) and Medeiros de Melo et. al (2009)
respectively. These were also the levels that are determined by Turkish Food
Codex for artificial sweeteners on confectionery products.
In the literature, sucrose-sweetener combination formulations have also been
studied. To decide the concentrations for the combinations of sucrose and
sweeteners, sensory analysis was conducted on 30 untrained panelists.
Acceptance test was used to determine the combination concentrations to see
which sample was the most accepted as near as control chocolate prepared with
17
sucrose. All sensory experiments was conducted on bitter chocolate
formulations to exclude the effect of other ingredients (i.e. milk powder).
For these tests, chocolates with sucrose-sucralose ratios of 10:0.5 (10 g
sucrose/0.5 g Sucralose), 12:0.5. 14:0.5 and 15:0.5 in 100 g weight basis were
prepared and tasted by the panelists. The highest score resulted in the bitter
chocolate with sucrose-sucralose ratio of 14:0.5. Therefore, this sweetener ratio
was used for the rest of the study as the ‘combination’ concentration (Table
2b). Similarly, same procedure was repeated for bitter chocolates prepared with
same sucrose and stevia ratios. The most preferred one was again the dark
chocolate with sucrose-stevia ratio of 14:0.5.
Following the selection of the most appropriate ratio, to decide on the most
acceptable chocolate formulation that are given on Table 2.2, another
acceptance test was conducted.
Panelists have filled in the form that is given on Appendix B. The results were
analysed by analysis of variance (ANOVA).
2.2.4 Rheological Characterization of Chocolate
Rheological properties of the molten chocolates were studied using a rheometer
(Anton Paar, MCR51 model, Austria) with concentric cylinder system (cup and
bob). All measurements were done at 40oC. Samples were pre-sheared at 5 s-1
at
40 °C before starting the measurement cycle. Shear stress was measured as a
function of increasing shear rate from 4 s-1
to 350 s-1
. The data were fitted to both
Casson and Herschel-Bulkey models. Throughout the experiments, shear rate
versus shear stress data were collected for measurements of linear viscosity,
Casson and Herschel-Bulkey model parameters of the replicates. Since Casson
model gave better results than Herschel-Bulkey, only parameters of Casson model
were displayed and discussed in the results.
2.2.5 Physical Analyses of Chocolate
18
2.2.5.1 Color
Colour of the chocolate bars was measured with a colorimeter (Colorflex,
Broomfield, Colorado, USA). Colour was expressed in terms of the CIELAB
system L*, a* and b*: L*, luminance ranging from 0 (black) to 100 (white); and
a* (green to red) and b* (blue to yellow). After measuring the L*, a* and b*
values, total colour difference (ΔE*) was calculated based on equation given
below:
√
(2.1)
where L*ref, a*ref, b*ref indicated the L*, a* and b* values of the control chocolate
samples (sucrose containing) for bitter, milk and white chocolates respectively.
Mean values from 3 replicate measurements and standard errors were reported on
the results.
19
2.2.5.2 Texture Profile Analysis
Hardness and fracturability measurements of chocolates were done by using a
Texture Analyser (Stable Micro Systems TA HD plus, Surrey, UK) with a load
cell of 20 N. Hardness was reported as the maximum penetrating force (g)
required for the needle to penetrate through a sample (80 x 10 mm, depth 10mm).
One point bend probe was used by setting instrument to compression force mode
with trigger force 5.0 g, pre-test speed of 1.0 mm/s, test speed of 2.0 mm/s, post-
test speed of 10.0 mm/s and rupture distance of 10 mm. Mean values from 3
replicate measurements and standard errors were calculated.
The fracturability is the maximum load (g) necessary to fracture a bar (80 × 10 ×
10 mm) of tempered chocolate. The probe descended at 10 mm/min until the
chocolate bar was broken. For every chocolate, 3 bars were subjected to the one
point bend test. Mean values from 3 replicate measurements and standard errors
were calculated. Texture analysis experiments were conducted for bitter chocolate
samples only.
2.2.5.3 Moisture Content Measurements
To better interpret the texture results, moisture content of bitter chocolate samples
were measured using a Time Domain NMR instrument (Bruker Inc,
Germany). Free induction decay sequence with an echo time of 3ms was used for
the measurements. Mean values from 3 replicate measurements and standard
errors were calculated.
2.2.6 Experimental Design and Statistical Analysis
The overview of this study can be summarized in Table 2.1 and 2.2. The factors
are chocolate types which are bitter, milk and white chocolates and sweetener
types which are sucrose, sucralose and stevia. By combination of these factors, the
responses of color, rheology, texture and sensory scores were evaluated. The
complete set of formulations are also explicitly given in Table 2.2.
Analysis of variance (ANOVA) was performed to determine whether there was a
significant difference on the quality attributes between chocolate formulations. If
significant difference was obtained, means were compared by the Tukey test
20
using MINITAB (Version 16) software. For ANOVA to be meaningful, normality
test was applied prior to analysis. If normality test was satisfied, constant variance
assumption was checked. If either of the test failed, transformation was applied if
necessary to satisfy the tests. Square root, logarithmic and Box-Cox
transformations were evaluated if necessary.
Table 2.1. Experimental Design Table
Factors Responses
Chocolate types Color
Bitter Chocolate L,a,b & ΔE values
Milk Chocolate Rheology
White Chocolate Casson Model Fitting
Sweeteners Texture
Sucralose Hardness
Splenda Fracturability
Stevia Sensory Evaluation
Acceptance Score
21
Tab
le 2
.2. C
om
posi
tion o
f C
hoco
late
Form
ula
tions
In
gre
die
nts
(%
w/w
)
Form
ula
tion
C
oco
a
Liq
uor
(%)
Coco
a
Butt
er
(%)
Mil
k
Pow
der
(%)
Sugar
(%)
Sucr
alose
(%)
Ste
via
(%)
Inuli
n
(%)
Lec
ithin
(%)
Mal
todex
trin
(%)
BC
S
40
24.5
-
30
- -
- 0.5
5
BC
St
40
24
- -
- 0.5
15
0.5
20
BC
Sc
40
24
- -
0.5
-
15
0.5
20
BC
SS
t 40
25
- 14
- 0.5
15
0.5
5
BC
SS
c 40
25
- 14
0.5
-
15
0.5
5
MC
S
36
27.5
18
18
- -
- 0.5
-
MC
St
36
25
18
- -
0.5
15
0.5
15
MC
Sc
36
25
18
- 0.5
-
15
0.5
15
WC
S
- 49.5
20
30
- -
- 0.5
-
WC
St
- 49
20
- -
0.5
15
0.5
15
WC
Sc
- 49
20
- 0.5
-
15
0.5
15
BC
: B
itte
r ch
oco
late
. M
C:
Mil
k c
hoco
late
. W
C:
Whit
e ch
oco
late
. S
: S
ucr
ose
. S
t: S
tevia
.
Sc:
Sucr
alose
.
SS
t: S
ucr
ose
and S
tevia
.
SS
c: S
ucr
ose
and S
ucr
alo

22
23
CHAPTER 3
RESULTS AND DISCUSSIONS
3.1 Effects of Sweeteners on Sensory Properties of Different Chocolate
Formulation
As explained in Chapter 2, sensory evaluation was conducted by untrained
panelists in two steps. The aim of the first step was to determine the
concentration for partial replacement of sucrose with two selected sweeteners;
sucralose and stevia, separately. Firstly, bitter chocolates with sucrose-
sucralose ratios of 10:0.5 (10 g sucrose/0.5 g Sucralose), 12:0.5, 14:0.5 and
15:0.5 were prepared and tasted by the panelists. The highest score resulted in
the bitter chocolate with sucrose-sucralose ratio of 14:0.5 (p<0.5) (Figure 3.1).
Therefore, this sweetener ratio was used for overall sensory evaluation.
Similarly, same procedure was repeated for bitter chocolates prepared with
same sucrose-stevia ratios. The most preferred one was again the bitter
chocolate with sucrose-stevia ratio of 14:0.5 (p<0.5) (Figure 3.2).
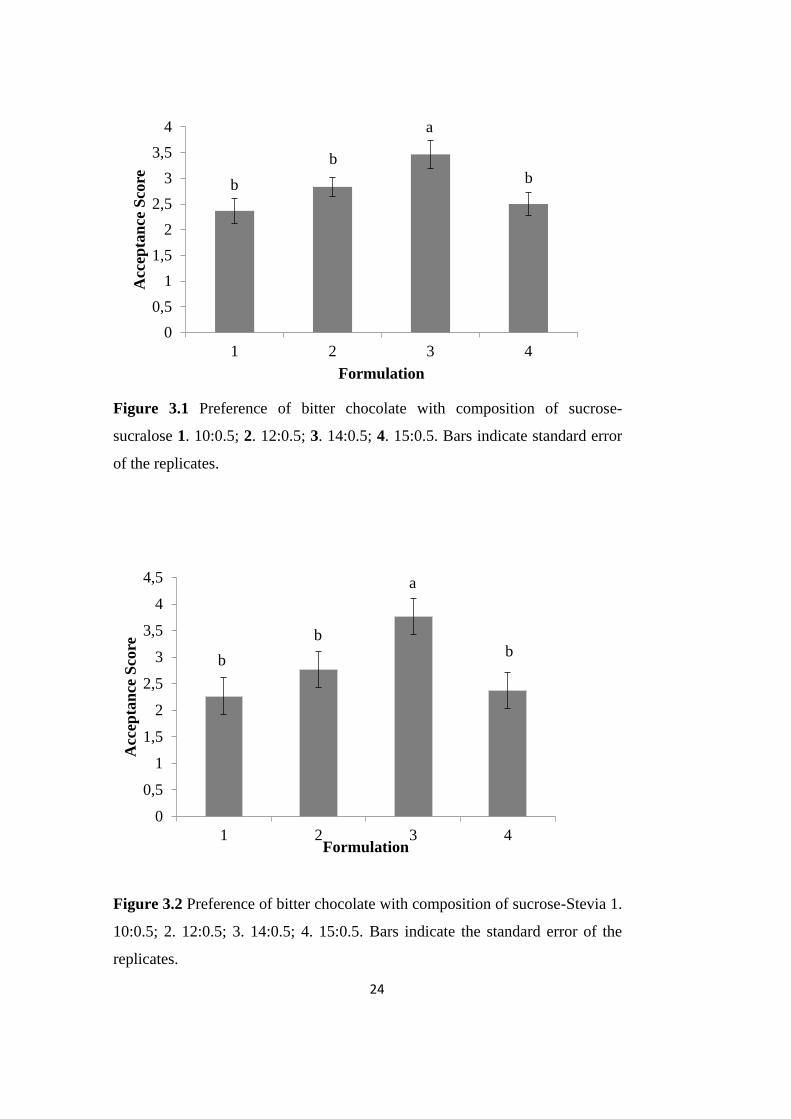
24
Figure 3.1 Preference of bitter chocolate with composition of sucrose-
sucralose 1. 10:0.5; 2. 12:0.5; 3. 14:0.5; 4. 15:0.5. Bars indicate standard error
of the replicates.
Figure 3.2 Preference of bitter chocolate with composition of sucrose-Stevia 1.
10:0.5; 2. 12:0.5; 3. 14:0.5; 4. 15:0.5. Bars indicate the standard error of the
replicates.
0
0,5
1
1,5
2
2,5
3
3,5
4
1 2 3 4
Acc
epta
nce
Sco
re
Formulation
b
b
a
b
0
0,5
1
1,5
2
2,5
3
3,5
4
4,5
1 2 3 4
Acc
epta
nce
Sco
re
Formulation
b
b
a
b
25
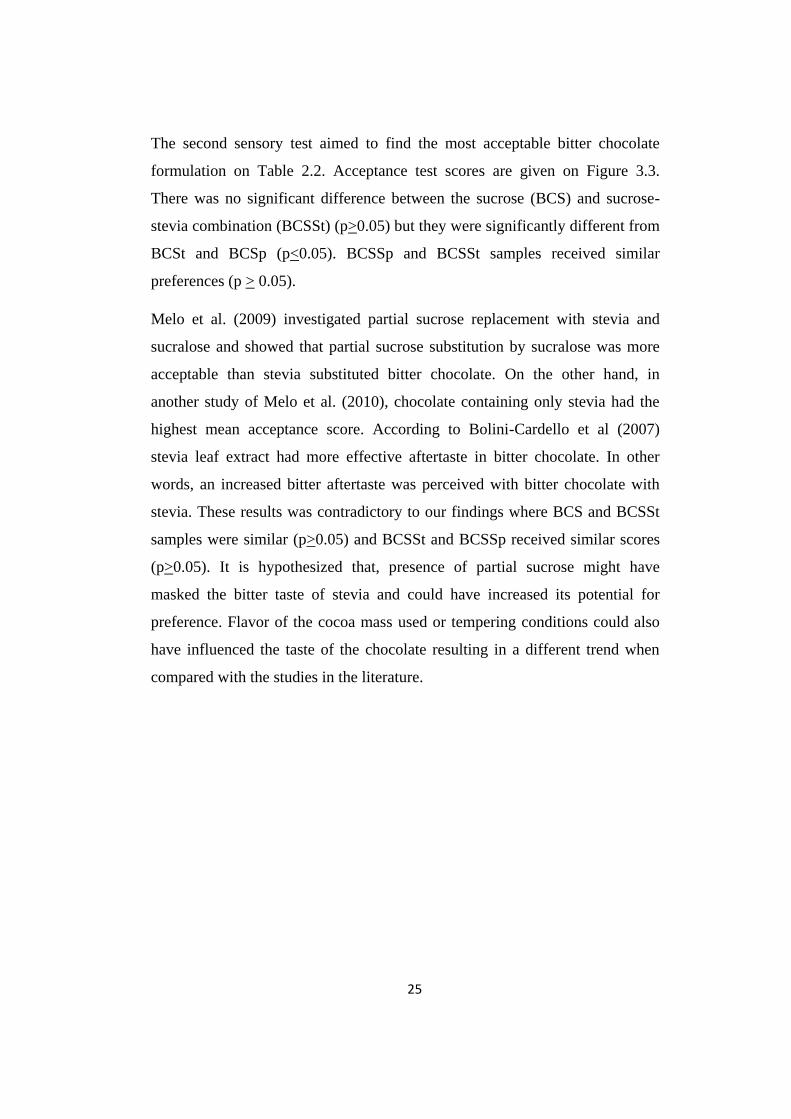
The second sensory test aimed to find the most acceptable bitter chocolate
formulation on Table 2.2. Acceptance test scores are given on Figure 3.3.
There was no significant difference between the sucrose (BCS) and sucrose-
stevia combination (BCSSt) (p>0.05) but they were significantly different from
BCSt and BCSp (p<0.05). BCSSp and BCSSt samples received similar
preferences (p > 0.05).
Melo et al. (2009) investigated partial sucrose replacement with stevia and
sucralose and showed that partial sucrose substitution by sucralose was more
acceptable than stevia substituted bitter chocolate. On the other hand, in
another study of Melo et al. (2010), chocolate containing only stevia had the
highest mean acceptance score. According to Bolini-Cardello et al (2007)
stevia leaf extract had more effective aftertaste in bitter chocolate. In other
words, an increased bitter aftertaste was perceived with bitter chocolate with
stevia. These results was contradictory to our findings where BCS and BCSSt
samples were similar (p>0.05) and BCSSt and BCSSp received similar scores
(p>0.05). It is hypothesized that, presence of partial sucrose might have
masked the bitter taste of stevia and could have increased its potential for
preference. Flavor of the cocoa mass used or tempering conditions could also
have influenced the taste of the chocolate resulting in a different trend when
compared with the studies in the literature.
26
Figure 3.3 Preference of bitter chocolate with different sweeteners 1. BCS; 2.
BCSp; 3. BCSt; 4. BCSSp; 5. BCSSt. Bars indicate standard error of the
replicates.
3.2. Effects of Sweeteners on Rheological Properties of Different Chocolate
Formulations
Rheological properties of molten chocolate are important in manufacturing and
product quality (Afoakwa et al., 2007a, 2007b; Aidoo et al., 2014; Taylor et al.,
2008). For chocolate, Casson and Herschel – Bulkley models are among the
widely used rheological models (Afoakwa, 2010; Aidoo, et al., 2014; Briggs &
Wang, 2004; Farzanmehr & Abbasi, 2009; Keogh et al., 2003; Sokmen & Gunes,
2006). Casson model is mainly accepted by International Confectionery
Association (IOCCC) for quantifying chocolate rheology (Bouzas & Brown,
1995; Sokmen & Gunes, 2006).
0
0,5
1
1,5
2
2,5
3
3,5
4
4,5
5
1 2 3 4 5
Acc
epta
nce
Sco
re
Formulation
a
c c
b
ab
27
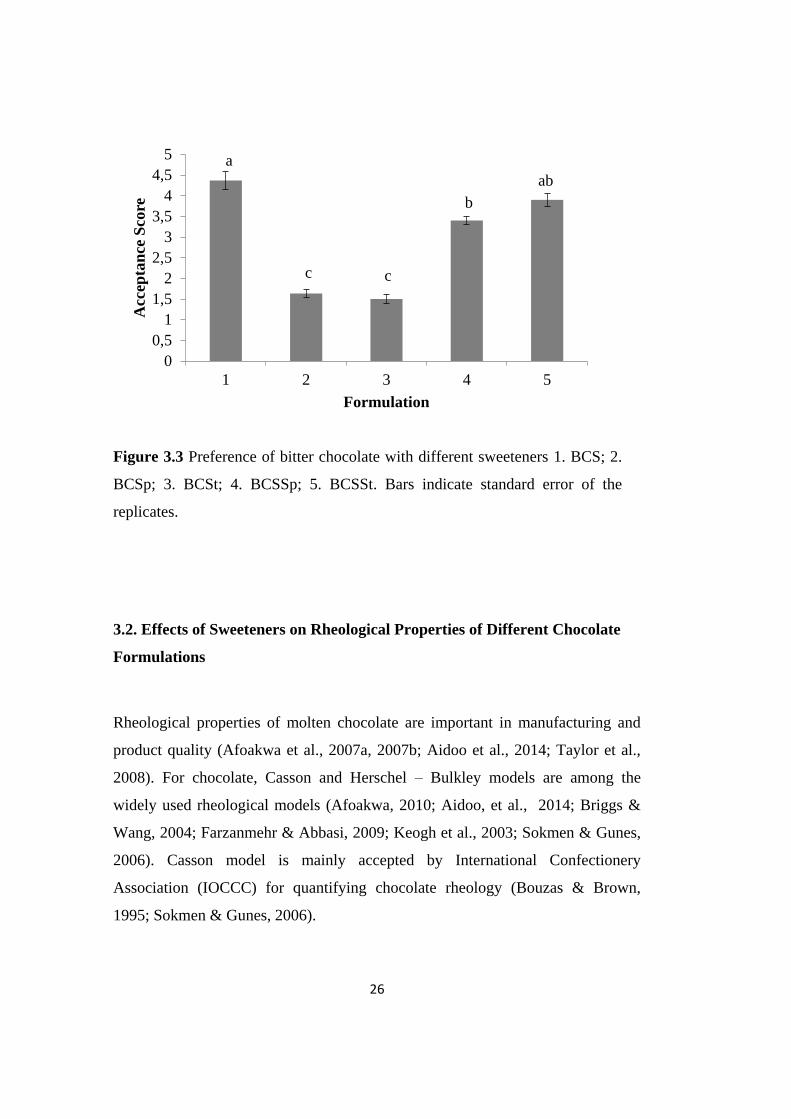
Molten chocolate is known to exhibit an apparent non-Newtonian flow behavior
(Shah et al. 2010) and same behavior was observed in this study.
In this study, the rheological properties of the molten chocolate samples were
characterized using the Casson model as shown in Equation (3.1):
(3.1)
where τ denotes shear stress, τ0 is yield stress, ηpl is plastic viscosity and γ is shear
rate. A typical chocolate flow curve showing the measurement of shear stress as a
function of increasing shear rate was given in Figure 3.4 which also showed that
BCSSt samples exhibited very similar flow to control sample (BCS). Statistical
results showed that the Casson model was providing a perfect fit to describe the
flow behavior of chocolate with R2 ≥ 0.99 regardless of the sweetener type used.
Casson viscosity and yield stress values of all samples were displayed in Table
3.1.
Figure 3.4. Flow Curves for BCS (Gray Circle), BCSSt (Light Gray Circle),
BCSc
(Triangle), BCSSt (Empty Circle) and DCSSc (Black Circle)
0
50
100
150
200
250
300
350
0 50 100 150 200 250 300 350 400
Shea
r S
tres
s (P
a)
Shear rate (s-1)
28
Plastic viscosity is the amount of energy required to keep a non-Newtonian liquid
moving once motion has been initiated (Afoakwa et al. 2007b). It is associated
with filling of rough surfaces, pumping characteristics, coating properties and
sensory properties (Aidoo et al. 2015). Among all the samples, the highest plastic
viscosity was obtained in MCS sample as 3.13 Pa.s. Control samples of white
(WCS) and bitter chocolates (BCS) exhibited similar values in Casson viscosity.
As shown in Table 2.2, sucrose content of MCS was different than WCS and
BCS. The difference in sucrose content between MCS and the other chocolate
types could be considerable factor on the plastic viscosity due to its influence on
particle-particle interactions. It was also obvious that the presence of milk powder
affected the particle-particle interactions and thus the viscosity values. WCSt and
WCSc samples gave the lowest plastic viscosity results between 0.44 and 0.55
Pa.s and it was explained with their less aggregate packing network structure.
Since white chocolate had higher fat content, most probably due to interaction
with sweeteners, bulking agents, milk fat and cocoa butter and resulting
lubricating action, particle–particle interactions reduced, increasing mobility
resulting in a decrease on the viscosity (Glicerina et al. 2013; Vernier 1998).
It was observed that effect of sweetener type was not significant on Casson
viscosity except for bitter chocolate formulations (p ≤ 0.05). In dark chocolates,
BCSt gave significantly higher plastic viscosity results than BCSc samples. It was
stated in the study of Shah et al. (2010), Beckett (2000) and Afoakwa et al.
(2007a,b) that high viscosity in chocolate had a persisting pasty mouth-feel and
thereby related to composition, particle size distribution and processing strategy.
Presence of milk powder in milk chocolate samples; presence of higher amount of
cocoa butter in white chocolate samples might have isolated the effect of
sweetener type.
While control samples of milk and white chocolates containing only sucrose
(MCS and WCS, respectively) had the highest viscosity results among their
formulations, Casson viscosity of other control sample (BCS) was the lowest
among all dark chocolate formulations (p≤0.05). This was explained with the
29
maltodextrin percentage in the formulations. As can be seen in Table 2.1
whenever sucrose was removed from the formulation maltodextrin concentration
was adjusted accordingly. Since maltodextrin had higher percentage in dark
chocolate than other control chocolates, it resulted in higher solid volume fraction
in dark chocolate due to its bulking agent function thereby increased plastic
viscosity. On the other hand, amount of maltodextrin in milk and white chocolates
remained lower. In the study of Shah et al. (2010), it was noted that higher plastic
viscosity could be identified with higher solid volume fraction. Moreover, particle
size could be correlated with viscosity in such a way that higher particle size lead
smaller surface area that was in contact with continuous fat phase in chocolate and
thereby internal friction and viscosity showed a decrease (Sokmen and Gunes
2006).
Table 3.1. Flow Parameters of All Chocolate Formulations
Formulation Casson viscosity
(Pa.s)
Casson yield stress
(Pa) R
2
Bitter Chocolate
BCS 0.69 ± 0.07c 1.61 ± 0.15a 0.9997
BCSt 1.40 ± 0.10 a 0.78 ± 0.06c 0.9994
BCSc 0.97 ± 0.09 b 1.07 ± 0.10bc 0.9996
BCSSt 0.73 ± 0.06 b 1.54 ± 0.14a 0.9998
BCSSc 0.96 ± 0.10 b 1.41 ± 0.12ab 0.9996
Milk Chocolate
MCS 3.13 ± 0.27 a 0.46 ± 0.04a 0.9971
MCSt 1.12 ± 0.10 b 0.40 ± 0.03a 0.9996
MCSc 1.11 ± 0.09 b 0.51 ± 0.05a 0.9989
White chocolate
WCS 0.71 ± 0.06a 4.76 ± 0.48a 0.9905
WCSt 0.55 ± 0.05ab 0.17 ± 0.02b 0.9994
WCSc 0.44 ± 0.03b 0.25 ± 0.03b 0.9995
30
*Lettering was conducted based on 5% significant level.
**Each chocolate type was treated on its own while conducting ANOVA. So
lettering
should be considered for each chocolate.
Yield stress is a material property which characterizes the minimum shear stress
required to induce the flow (Shah et al. 2010). It expresses the low shear rate
properties of chocolate and is influenced by the specific surface area, fraction of
the particles, emulsifiers, and moisture, particle-particle interactions (Afoakwa et
al. 2007a; Aidoo et al. 2014; Aidoo et al. 2015). The Casson yield stress value
was higher for WCS which was one of the control samples made with sucrose
(4.76 Pa). This showed that amount of energy required to start flow was the
highest in WCS samples. Among milk chocolate samples, no significant
difference were observed on the yield stress for MCS, MCSSc or MCSSt.
Moreover, sweetener type (Sucralose and Stevia) was not significantly different
for yield stress among the same chocolate types (p ≤ 0.05).
Generally, white chocolate samples showed lower results in terms of viscosity and
yield stress than all other samples except for WCS. Likely, Glicerina, et al. (2015
a,b, 2016) found that white chocolate having the highest amount of fat had the
smallest sized particles and the lowest yield stress, viscosity values than bitter and
milk chocolates while milk chocolate gave intermediate results. Moreover, in the
same study, it was mentioned that the presence of crystalline lactose in milk and
white chocolates should be considered as a factor that could have an impact on
their lower viscosity values, promoting the release of entrapped milk-fat. In
rheological characteristics, particle-particle interactions are influenced by
composition, thus stronger interaction could lead to higher rheological properties
(Afoakwa et al. 2009; Glicerina et al. 2013; Glicerina et al. 2016).
Attaining similar flow properties in chocolates prepared with sugar substitutes as
that of conventional chocolates is key for final product quality. In bitter
chocolates, BCSSt became the most similar one to control sample BCS with
regard to rheological properties.
31
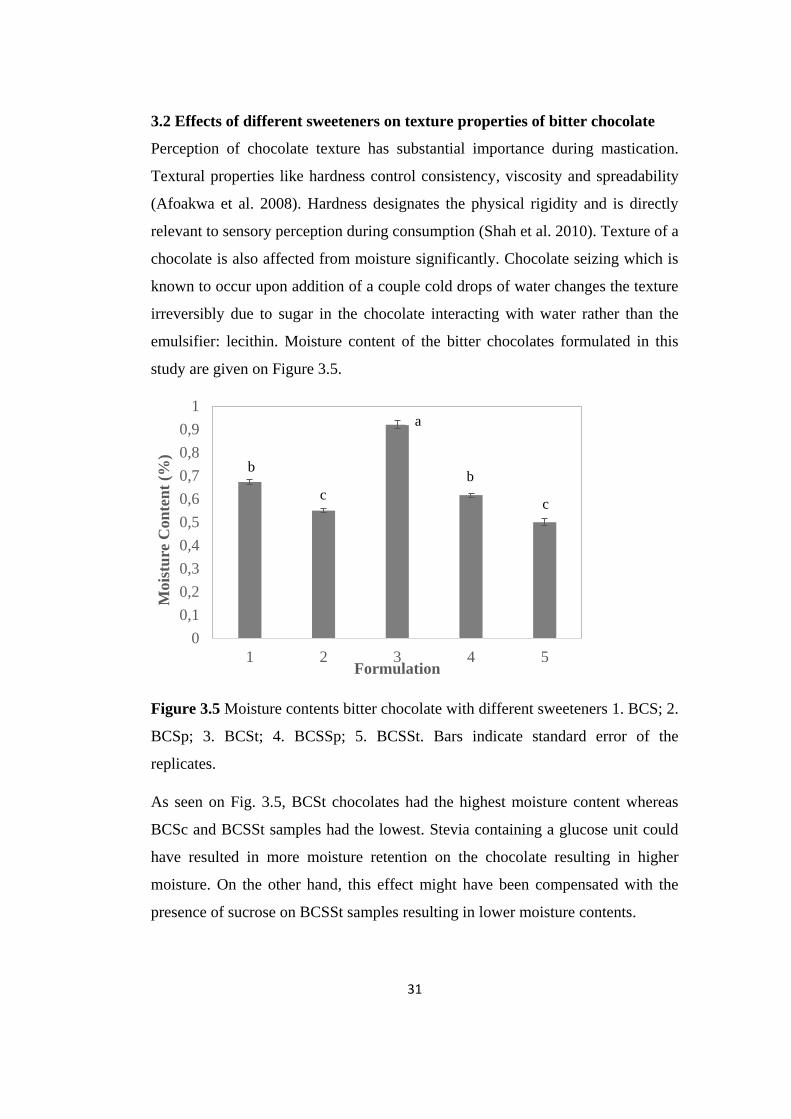
3.2 Effects of different sweeteners on texture properties of bitter chocolate
Perception of chocolate texture has substantial importance during mastication.
Textural properties like hardness control consistency, viscosity and spreadability
(Afoakwa et al. 2008). Hardness designates the physical rigidity and is directly
relevant to sensory perception during consumption (Shah et al. 2010). Texture of a
chocolate is also affected from moisture significantly. Chocolate seizing which is
known to occur upon addition of a couple cold drops of water changes the texture
irreversibly due to sugar in the chocolate interacting with water rather than the
emulsifier: lecithin. Moisture content of the bitter chocolates formulated in this
study are given on Figure 3.5.
Figure 3.5 Moisture contents bitter chocolate with different sweeteners 1. BCS; 2.
BCSp; 3. BCSt; 4. BCSSp; 5. BCSSt. Bars indicate standard error of the
replicates.
As seen on Fig. 3.5, BCSt chocolates had the highest moisture content whereas
BCSc and BCSSt samples had the lowest. Stevia containing a glucose unit could
have resulted in more moisture retention on the chocolate resulting in higher
moisture. On the other hand, this effect might have been compensated with the
presence of sucrose on BCSSt samples resulting in lower moisture contents.
0
0,1
0,2
0,3
0,4
0,5
0,6
0,7
0,8
0,9
1
1 2 3 4 5
Mois
ture
Con
ten
t (%
)
Formulation
b
c c
a
b
32
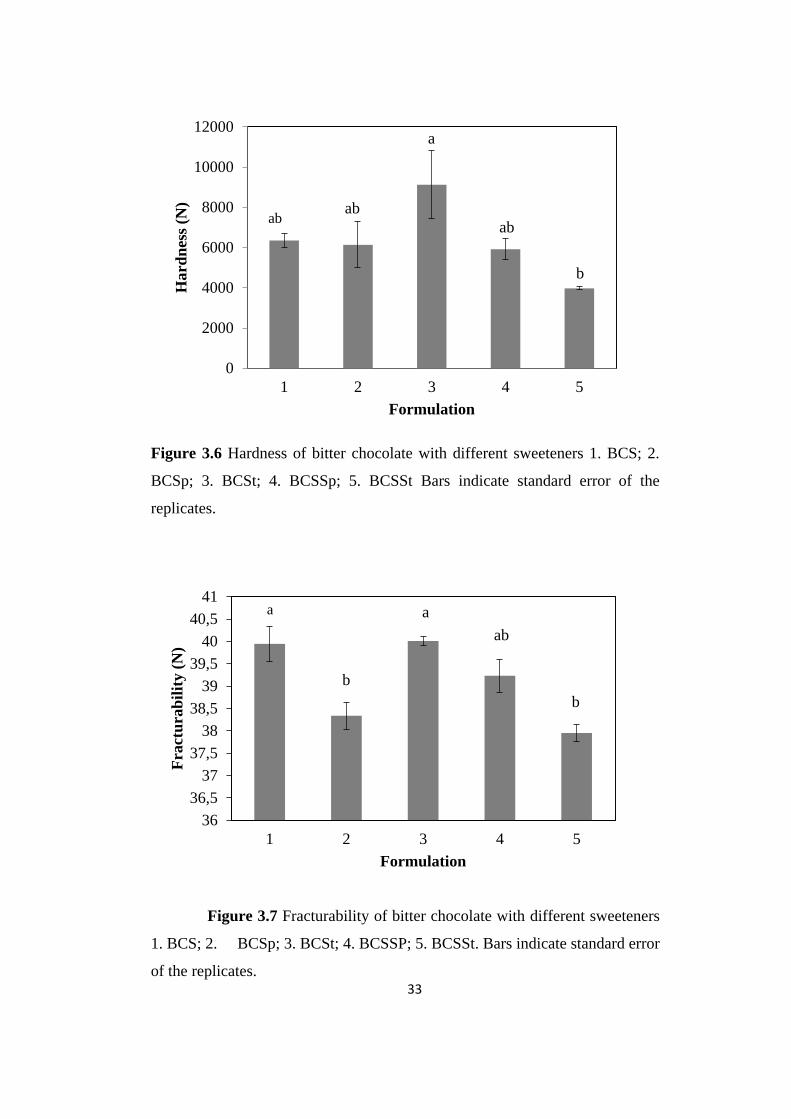
Fig. 3.6 illustrated the effects of different sweeteners on the hardness of the bitter
chocolates. Results showed that partial replacement of sucrose with stevia
(BCSSt) had significant effect on chocolate hardness when compared with only
stevia containing samples (BCSSt) (p ≤ 0.05). According to the Figure 3.6.,
BCSSt samples showed lower hardness compared to BCSt. A similar trend was
also shown in moisture contents between BCSt and BCSSt samples.
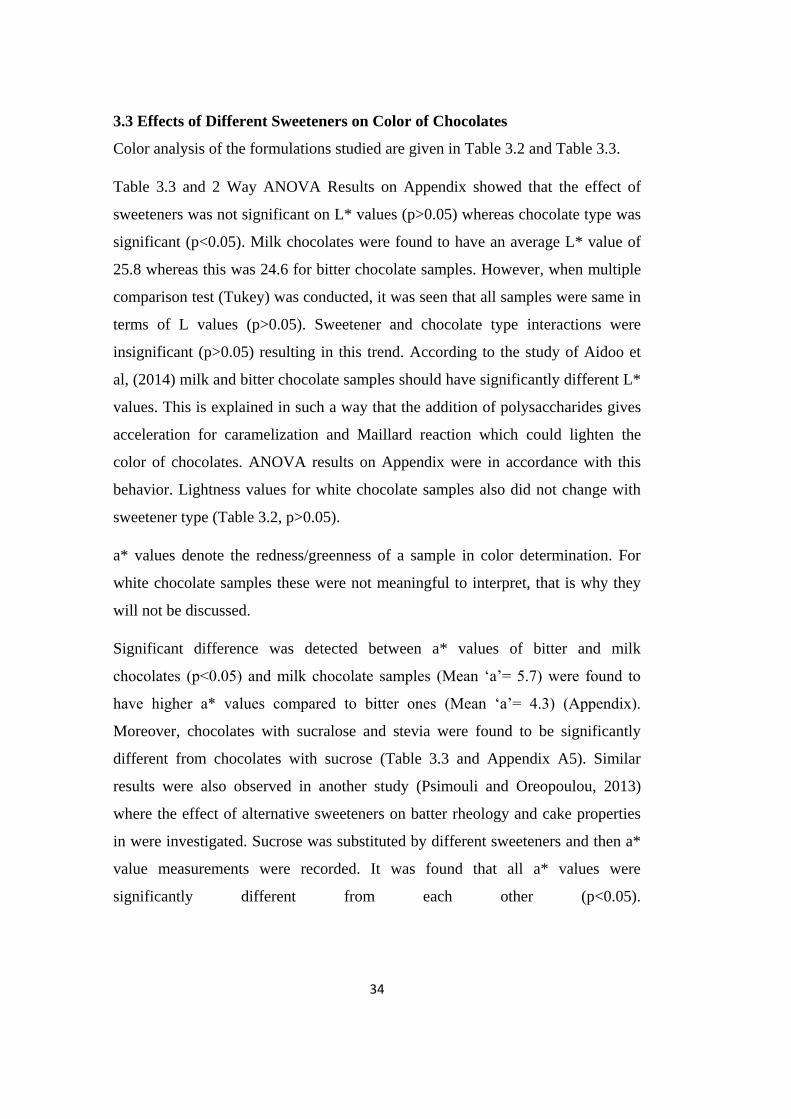
Fracturability or the maximum load to fracture a bar of chocolate was
displayed in Fig. 3.7. The fracturability is the consequence of a high degree of
hardness and a low degree of cohesiveness. Hence it leads to combination of
the force needed to compress a substance between molar teeth and the degree
to which a substance is compressed between the teeth before it breaks (De
Clercq et al. 2012; Szczesniak 2002). Fracturability was similar to hardness. In
order to understand the correlation between hardness and fracturability,
Pearson correlation was conducted between hardness, fracturability and
moisture content and a significant positive correlation (p<0.05) was obtained
with a coefficient of greater than 0.69. 70% correlation could be considered a
satisfactory correlation for chocolate quality parameters since during chocolate
making many uncontrollable factors could have contributed and
standardization could be challenging.
33
Figure 3.6 Hardness of bitter chocolate with different sweeteners 1. BCS; 2.
BCSp; 3. BCSt; 4. BCSSp; 5. BCSSt Bars indicate standard error of the
replicates.
Figure 3.7 Fracturability of bitter chocolate with different sweeteners
1. BCS; 2. BCSp; 3. BCSt; 4. BCSSP; 5. BCSSt. Bars indicate standard error
of the replicates.
0
2000
4000
6000
8000
10000
12000
1 2 3 4 5
Hard
nes
s (N
)
Formulation
ab
a
ab
b
ab
36
36,5
37
37,5
38
38,5
39
39,5
40
40,5
41
1 2 3 4 5
Fra
ctu
rab
ilit
y (
N)
Formulation
b
a
ab
b
a
34
3.3 Effects of Different Sweeteners on Color of Chocolates
Color analysis of the formulations studied are given in Table 3.2 and Table 3.3.
Table 3.3 and 2 Way ANOVA Results on Appendix showed that the effect of
sweeteners was not significant on L* values (p>0.05) whereas chocolate type was
significant (p<0.05). Milk chocolates were found to have an average L* value of
25.8 whereas this was 24.6 for bitter chocolate samples. However, when multiple
comparison test (Tukey) was conducted, it was seen that all samples were same in
terms of L values (p>0.05). Sweetener and chocolate type interactions were
insignificant (p>0.05) resulting in this trend. According to the study of Aidoo et
al, (2014) milk and bitter chocolate samples should have significantly different L*
values. This is explained in such a way that the addition of polysaccharides gives
acceleration for caramelization and Maillard reaction which could lighten the
color of chocolates. ANOVA results on Appendix were in accordance with this
behavior. Lightness values for white chocolate samples also did not change with
sweetener type (Table 3.2, p>0.05).
a* values denote the redness/greenness of a sample in color determination. For
white chocolate samples these were not meaningful to interpret, that is why they
will not be discussed.
Significant difference was detected between a* values of bitter and milk
chocolates (p<0.05) and milk chocolate samples (Mean ‘a’= 5.7) were found to
have higher a* values compared to bitter ones (Mean ‘a’= 4.3) (Appendix).
Moreover, chocolates with sucralose and stevia were found to be significantly
different from chocolates with sucrose (Table 3.3 and Appendix A5). Similar
results were also observed in another study (Psimouli and Oreopoulou, 2013)
where the effect of alternative sweeteners on batter rheology and cake properties
in were investigated. Sucrose was substituted by different sweeteners and then a*
value measurements were recorded. It was found that all a* values were
significantly different from each other (p<0.05).
35
Let
teri
ng w
as c
onduct
ed b
ased
on 5
% s
ignif
ican
t le
vel
.
Eac
h c
hoco
late
type
was
tre
ated
on i
ts o
wn w
hil
e co
nduct
ing
AN
OV
A. S
o l
ette
ring s
hould
be
consi
der
ed f
or
each
choco
late
.
Ref
eren
ce v
alues
for
E c
alcu
lati
ons
wer
e use
d a
s th
e ch
oco
late
conta
inin
g s
ucr
ose
on i
ts o
wn t
ype.
Norm
alit
y a
ssum
pti
on f
or
the
dat
a se
t w
as c
hec
ked
and i
t w
as f
ound o
ut
that
‘b’
val
ues
for
bit
ter
choco
late
did
not
foll
ow
a
norm
ally
dis
trib
ute
d p
atte
rn.
Sin
ce b
val
ue
was
ass
oci
ated
wit
h y
ello
wnes
s an
d y
ello
wnes
s co
uld
not
be
an a
ttri
bute
of
bit
ter
choco
late
it
was
found a
ppro
pri
ate
not
to c
onduct
AN
OV
A f
or
that
dat
a. S
imil
arly
red
nes
s fo
r w
hit
e ch
oco
late
gav
e ‘-
‘res
ult
s fo
r so
me
sam
ple
s an
d
AN
OV
A w
as n
ot
conduct
ed f
or
that
dat
a.
Form
ula
tion
L
a
b
E
BC
S
24.7
0a
±
0.7
0
5.2
0a
±
0.1
5
4.1
0
±
0.0
6
**
**
BC
St
24.2
7a
±
0.5
8
3.7
3b
±
0.2
7
3.2
3
±
0.1
2
24.3
3a
±
0.1
5
BC
Sc
24.8
7a
±
0.1
3
3.9
7ab
±
0.1
2
3.3
3
±
0.0
3
24.2
0a
±
0.0
4
BC
SS
t 24.5
0a
±
0.2
6
4.4
7ab
±
0.1
8
4.0
3
±
0.1
2
23.4
8b
±
0.1
2
BC
SS
c 24.5
3a
±
0.2
0
3.2
3b
±
0.5
8
3.1
3
±
0.0
7
24.4
6a
±
0.1
2
MC
S
25.7
0a
±
0.6
0
6.7
0a
±
0.2
3
5.8
0a
±
0.2
6
**
**
MC
St
26.3
3a
±
0.1
2
5.6
7ab
±
0.0
3
4.6
3b
±
0.0
3
21.0
0a
±
0.1
2
MC
Sc
25.2
3a
±
0.6
6
4.8
7b
±
0.5
0
4.0
0b
±
0.3
5
20.0
1b
±
0.6
0
WC
S
79.8
3a
±
0.2
4
0.3
67
±
0.0
9
27.5
a ±
0.1
5
**
**
WC
St
80.4
7a
±
0.7
2
-0.4
3
±
0.1
3
22.8
b
±
0.7
0
4.9
3a
±
0.5
2
WC
Sc
78.6
7a
±
0.1
7
-0.2
7
±
0.0
9
26.5
a ±
0.1
2
1.6
8b
±
0.1
4
Tab
le 3
. 2 C
olo
r A
naly
sis
Res
ult
s o
f C
ho
cola
te F
orm
ula
tio
ns
36
Tab
le 3
. 3 C
olo
r A
naly
sis
Res
ult
s of
Mil
k a
nd
Wh
ite
Ch
oco
late
( 2
Way A
NO
VA
Res
ult
s)
Let
teri
ng w
as c
onduct
ed b
ased
on 5
% s
ignif
ican
t le
vel
.
Choco
late
type
and s
wee
tener
type
wer
e co
nsi
der
ed a
s dif
fere
nt
fact
ors
. C
om
bin
atio
ns
of
sucr
ose
and s
tevia
are
not
incl
uded
sin
ce
thes
e co
mbin
atio
ns
wer
e not
test
ed o
n m
ilk c
hoco
late
s.
Norm
alit
y a
ssum
pti
on f
or
the
dat
a se
t w
as c
hec
ked
and i
t w
as c
onfi
rmed
for
all
dat
a se
t.
Form
ula
tion
L
a
b
BC
S
24.7
0a
±
0.7
0
5.2
0b
c ±
0.1
5
4.1
0b
c ±
0.0
6
BC
St
24.2
7a
±
0.5
8
3.7
3d
±
0.2
7
3.2
3c
±
0.1
2
BC
Sc
24.8
7a
±
0.1
3
3.9
7cd
±
0.1
2
3.3
3c
±
0.0
3
MC
S
25.7
0a
±
0.6
0
6.7
0a
±
0.2
3
5.8
0a
±
0.2
6
MC
St
26.3
3a
±
0.1
2
5.6
7ab
±
0.0
3
4.6
3b
±
0.0
3
MC
Sc
25.2
3a
±
0.6
6
4.8
7b
cd
±
0.5
0
4.0
0b
c ±
0.3
5
37
For bitter chocolates among themselves (Table 3.2) BCSt and BCS samples
differed significantly, BCSt ones showing lower a* values (p<0.05). For milk
chocolate samples, MCS and sweetener containing ones; MCSt and MCSc
differed significantly showing lower a* values (p<0.05) and when bitter and milk
chocolate ones were compared (Table 3.3), it was seen that MCS and BCS were
significantly different (p<0.05). Moreover, BCSt and MCSt were also different;
MCSt ones having higher a* values due to milk powder as expected. Sucralose
did not show a significant effect on color in contrast to stevia.
It is obvious that the presence of sweeteners would affect the a* values of
chocolates. Sucrose is a non-reducing sugar whereas sucralose and stevia
containing formulations included maltodextrin which were capable of involving in
browning reactions. So it can be concluded that without noticing the food type use
of different sweeteners substituting the sucrose makes difference in redness.
b* values show the blueness/yellowness of the sample in color. b* values for
bitter chocolate samples did not follow a normally distributed pattern even with
transformation (square root, logarithmic , Box-Cox) that’s why they were not
lettered by ANOVA on Table 3.2. Moreover, it was decided that just for bitter
chocolate samples it might not be meaningful to check the yellowness. And also,
white chocolate samples were treated among themselves. For bitter and milk
chocolate data set, comparison of b* values was conducted since the overall data
satisfied ANOVA’s assumptions in contrast to bitter only samples as stated above
(constant variance and normal distribution) (Table 3.3). Effect of sweetener and
chocolate type on b* values were similar to a* values for milk and white
chocolates and they were significant (p<0.05. Appendix A.5). Interaction of
sweetener and chocolate type was also significant according to 2-way ANOVA
results (Appendix). It was clearly observed that with the presence of milk powder
in the recipe, b* values increased. MCS samples showed the highest b* values.
Total color difference E was calculated by using the color values of different
chocolate samples and the corresponding control samples (sucrose containing
ones) as the reference. As seen on Table 3.2, the effect of sweetener was
38
significant on white and milk chocolate formulations (p<0.05) and sucralose
containing samples both (MCSc, WCSc) had lower values in both chocolate
types. For bitter chocolates the presence of sweeteners did not show a significant
effect except BCSSt samples (p>0.05). Partial substitution of sucrose with stevia
decreased the color difference slightly.
39
CHAPTER 4
CONCLUSION AND RECOMMENDATIONS
The development of a high-quality low-calorie chocolate has to consider several
points. The first one sensorial properties. Sugar substitution with high-intensity
sweeteners should not affect color, flavor, texture, aftertaste, mouthfeel and
overall acceptances negatively. Secondly process parameters should be evaluated
for feasibility. To decide the processability of the chocolate, rheological
characterization should be conducted. Rheological properties give an idea to
arrange the parameters such as temperatures, pumping requirements, motor power
etc.
In this study, it was found that all chocolate types with different sweeteners follow
the Casson-model for rheology.
Only stevia containing chocolates (BCSt) had higher moisture contents and were
comparably harder with respect to formulations containing sucrose and stevia
(BCSSt). Moreover, BCSSt samples got same acceptance score with the control
samples in the sensory experiments.
Color analysis showed that L*, a* and b* and E values were affected from
chocolate and sweetener type significantly (p<0.5). Presence of bulking agents
due to sweeteners and milk powder increased the* values of the chocolates.
The study showed that using intense sweeteners it is possible to formulate, low
calorie chocolates having similar rheological, sensorial and physical (texture,
color) properties as does sucrose containing ones. The study could be extended by
formulating chocolate with higher sweeteners concentrations and changing
bulking agent concentrations to see the effect of different ingredients. Moreover,

40
effect of those ingredients could also be studied on chocolate blooming which is
an important quality problem on chocolate industry.
41
REFERENCES
Afoakwa, E. O. (2010). Chocolate Science and Technology. Chocolate Science
and Technology. doi:10.1002/9781444319880.
Afoakwa, E. O., Paterson, A., & Fowler, M. (2007a). Effects of particle size
distribution and composition on rheological properties of dark chocolate.
European Food Research and Technology, 226, 1259–1268. doi:10.1007/s00217-
007-0652-6.
Afoakwa, E. O., Paterson, A., & Fowler, M. (2007b). Factors influencing
rheological and textural qualities in chocolate – a review. Trends in Food Science
& Technology, 18(6), 290–298. doi:10.1016/j.tifs.2007.02.002.
Afoakwa, E. O., Paterson, A., Fowler, M., & Vieira, J. (2008). Relationship
between rheological, textural and melting properties of dark chocolate as
influenced by particle size distribution and composition. European Food Research
and Technology, 227, 1215–1223. doi:10.1007/s00217-008-0839-5.
Afoakwa, E. O., Paterson, A., Fowler, M., & Vieira, J. (2009). Microstructure and
mechanical properties related to particle size distribution and composition in dark
chocolate. International Journal of Food Science and Technology, 44(2007), 111–
119. doi:10.1111/j.1365-2621.2007.01677.x.
Aidoo, R. P., Afoakwa, E. O., & Dewettinck, K. (2014). Optimization of inulin
and polydextrose mixtures as sucrose replacers during sugar-free chocolate
manufacture - Rheological, microstructure and physical quality characteristics.
Journal of Food Engineering, 126, 35–42. doi:10.1016/j.jfoodeng.2013.10.036.
Aidoo, R. P., Afoakwa, E. O., & Dewettinck, K. (2015). Rheological properties,
melting behaviours and physical quality characteristics of sugar-free chocolates
processed using inulin/polydextrose bulking mixtures sweetened with stevia and
thaumatin extracts. LWT - Food Science and Technology, 62(1), 592–597.
doi:10.1016/j.lwt.2014.08.043.
Barry Callebaut , from www.callebaut.com. last visited: October, 2015.
Beckett, S. T. (2010). The Science of chocolate.(3rd ed.). UK: RSC Publishing.
Boileau, A., Fry, J. C., & Murray, R. (2012). A new calorie-free sugar substitute
from the leaf of the stevia plant arrives in the UK. Nutrition Bulletin.
doi:10.1111/j.1467-3010.2011.01945.x.
42
Bouzas, J., & Brown, B. D. (1995). Interactions affecting microstructure, texture,
and rheology of chocolate confectionery products. In A. G. Goankar (Ed.),
Ingredient interactions: Effects on food quality (pp. 451–527). New York: Mercel
Dekker.
Briggs, J. L., & Wang, T. (2004). Influence of shearing and time on the
rheological properties of milk chocolate during tempering. Journal of the
American Oil Chemists’ Society, 81, 117–121. doi:10.1007/s11746-004-0868-9.
Chemical Safety Information from Intergovernmental Organizations, from
http://www.inchem.org/. last visited: October, 2015
Chevalley, J. (1975). Rheology of chocolate. Journal of Texture Studies, 6, 177-
195.
Danisco, from www.solae.com. Last visited October, 2015
De Clercq, N., Moens, K., Depypere, F., Vila Ayala, J., Calliauw, G., De Greyt,
W., & Dewettinck, K. (2012). Influence of cocoa butter refining on the quality of
milk chocolate. Journal of Food Engineering, 111(2), 412–419.
doi:10.1016/j.jfoodeng.2012.01.033.
De Melo, L. L. M. M., Bolini, H. M. A., & Efraim, P. (2007). Equisweet milk
chocolates with intense sweeteners using time-intensity method. Journal of Food
Quality, 30(2007), 1056–1067. doi:10.1111/j.1745-4557.2007.00177.x.
Farzanmehr, H. &Abbasi, S. (2009). Effects of inulin and bulking agents on some
physico-chemical, textural and sensory porperties of milk chocolate. Journel of
Texture Studies 40.536-553.
Food Sanitation Council Notice, from http://www.mhlw.go.jp/, last visited:
October, 2015.
Geuns, J. (2003). Stevioside. Phytochemistry. doi:10.1016/S0031-9422(03)00426-
6.
Glicerina, V., Balestra, F., Dalla Rosa, M., & Romani, S. (2013). Rheological,
textural and calorimetric modifications of dark chocolate during process. Journal
of Food Engineering, 119(1), 173–179. doi:10.1016/j.jfoodeng.2013.05.012.
Glicerina, V., Balestra, F., Dalla Rosa, M., & Romani, S., 2015a. Effect of
manufacturing process on the microstructural and rheological properties of milk
chocolate. Journal of Food Engineering, 145, 45-50.
Glicerina, V., Balestra, F., Dalla Rosa, M., & Romani, S., 2015b. Microstructural
and rheological properties of white chocolate during processing. Food Bioprocess
Technology, 8, 770-776.
43
Glicerina, V., Balestra, F., Dall Rosa, M., & Romani, S. (2016). Microstructural
and rheological characteristics of dark, milk and white chocolate: a comparative
study. Journal of Food Engineering, 169, 165–171.
doi:10.1016/j.jfoodeng.2015.08.011.
Golob, T., Micovic, E., Bertoncelj, J.&Jamnik, M. (2004). Sensory acceptability
of chocolate with inulin. Acta Agriculturae slovenica, 83-2, november, 2004.
Goyal, S. K., Samsher, & Goyal, R. K. (2010). Stevia (Stevia rebaudiana) a bio-
sweetener: a review. International Journal of Food Sciences and Nutrition, 61, 1–
10.
Grotz, V. L., & Munro, I. C. (2009). An overview of the safety of sucralose.
Regulatory Toxicology and Pharmacology, 55(1), 1–5.
Hashizume, C. and Okuma, K. (2009). Comprehensive measurement of total
nondigestible carbohydrates in foods by enzymatic-gravimetric method and liquid
chromatography. J Agric Food Chem. 2009 Sep 9;57(17):7659-65. doi:
10.1021/jf9010565.
International Food Information Council Foundation, from www.foodinsight.org,
last visited: May, 2015
Institute of Turkish Standards, from www.tse.org.tr, last visited October, 2015.
Kalyani Nair, K., Kharb, S., Thompkinson, D.K. Inulin dietary fiber with
functional and health attributes: A review. Food Rev. Int. 2010;26:189–203.
Kennedy, J.F., Knill, C.J., Taylor, D.W. (1995). Handbook of starch hydrolysis
products and their derivatives. Chapman and Hall, 1995.
Keogh, M. K., Murray, C. A., & O’Kennedy, B. T. (2003). Effects of selected
properties of ultrafiltered spray-dried milk powders on some properties of
chocolate. International Dairy Journal, 13, 719–726. doi:10.1016/S0958-
6946(03)00124-9.
Koyama, E., Kitazawa, K., Ohori, Y.,Izawa, O., Kakegawa, K., Fujino, A., Ui, M.
(2003). In vitro metabolism of the glycosidic sweeteners, stevia mixture and
enzymatically modified stevia in human intestinal microflora. Elsevier, v.41, I.3,
pp.359-374, 2003.
Krüger, C. (1999). Sugar and bulk sweetener. In S. T. Beckett (Ed.), Industrial
chocolate manufacture and use (3rd ed., pp. 36–56). Oxford: Blackwell Science
Haylock & Dodds, 1999.
Lawless, H. and Heymann, H. Sensory evaluation of food. Springer-Verlag New
York, 1998. Doi 10.1007/978-1-4419-6488-5
44
Macht, M., & Dettmer, D. (2006). Everyday mood and emotions after eating a
chocolate bar or an apple. Appetite, 46, 332–336.
Marcel B. Roberfroid (2005). Introducing inulin-type fructans. British Journal of
Nutrition, 93, pp S13-S25. doi:10.1079/BJN20041350.
Merck, (2006). Sucralose. In: M. J. O’Neal (Ed.), The Merck Index, Merck & Co.,
Whitehouse Station, NJ, p. 1523.
Melo, L.L.M.M., Bolini, H.M.A. and Efraim, P. 2009. Sensory profile,
acceptability and their relationship for diabetic/reduced calorie chocolates. Food
Quality Pref., v.20, p.138-143, 2009.
Melo, L., Childs, J.L., Drake, M., Bolini, H.M.A. and Efraim, P. (2010).
Expectations and acceptability of diabetic and reduced-calorie milk chocolate
among nondiabetics and diabetics in the USA. Journal of Sensory Studies, v.25,
p.133-152, 2010.
Olinger, P. M. (1994). New options for sucrose-free chocolate. The
Manufacturing Confectioner, 74(5), 77–84.
Olinger, P. M., & Pepper, T. (2001). Xylitol. In O. L. Nabors (Ed.). Alternative
sweeteners (pp. 335–365). New York: Mercel Dekker.
Open Chemistry Database, from
http://pubchem.ncbi.nlm.nih.gov/compound/Sucralose , last visited: October,
2015.
Palazzo, A. B., Carvalho, M. A. R., Efraim, P., & Bolini, H. M. A. (2011).
Determination of isosweetness concentration of sucralose, rebaudioside and
neotame as sucrose substitutes in new diet chocolate formulations using the time-
intensity analysis. Journal of Sensory Studies, 26, 291-297Aidoo et al. 2013.
Parpinello, G. P., Versari, A., Castellari, M., & Galassi, S. (2001). Stevioside as
areplacement of sucrose in peach juice: Sensory evaluation. Journal of
SensoryStudies, 16(5), 471–484.
Psimouli, V. and Oreopoulou, V. (2013). The effect of fat replacers on batter and
cake properties. Journel of Food Science, volume 78, Issue 10, p.1495- 1502,
2013.
Rector, D. (2000). Chocolate-controlling the flow. Benefits of polyglycerol
polyricinoleic acid. The Manufacturing Confectioner, 80(5), 63-70.
Schantz, B. and Rohm, H. Influence of lecithin–PGPR blends on the rheological
properties of chocolate. Lebensmittel Wissenschaft und Technologie, v. 38, p. 41-
45, 2005.
45
Shah, A. B., Jones, G. P., & Vasiljevic, T. (2010). Sucrose-free chocolate
sweetened with Stevia rebaudiana extract and containing different bulking agents
- effects on physicochemical and sensory properties. International Journal of Food
Science and Technology, 45, 1426–1435. doi:10.1111/j.1365-2621.2010.02283.x.
Shourideh, M., Taslimi, A., Azizi, M. H., & Mohammadifar, M. A. (2012).
Effects of D-tagatose and inulin of some physicochemical, rheological and
sensory properties of dark chocolate. International Journal of Bioscience,
Biochemistry and Bioinformatics, 2(5), 314–319.
Sokmen, A., & Gunes, G. (2006). Influence of some bulk sweeteners on
rheological properties of chocolate. LWT - Food Science and Technology, 39,
1053–1058. doi:10.1016/j.lwt.2006.03.002.
Splenda™, from www.splenda.com, Last visited: May, 2015.
Stevia in The Raw®, from http://www.intheraw.com/products/stevia-in-the-raw
last visited: October, 2015.Szczesniak, A. S. (2002). Texture is a sensory
property. Food Quality and Preference, 13, 215–225. doi:10.1016/S0950-
3293(01)00039-8.
Taylor, T. P., Fasino, O., & Bell, L. N. (2008). Physical properties and consumer
liking of cookies prepared by replacing sucrose with tagatose. Journal of Food
Science, 73, 145-155.
Vernier, F., (1998). Influence of emulsifier on the rheology of chocolate and
suspension of cocoa and sugar particles in oil. Doctoral Thesis – Department of
Chemistry, University of Reading.
Zumbe, A. & Grosso, C. (1993). Product and Process for Producing Milk
Chocolate. US Patent 5238698/EP Patent 0575070 A2.

46
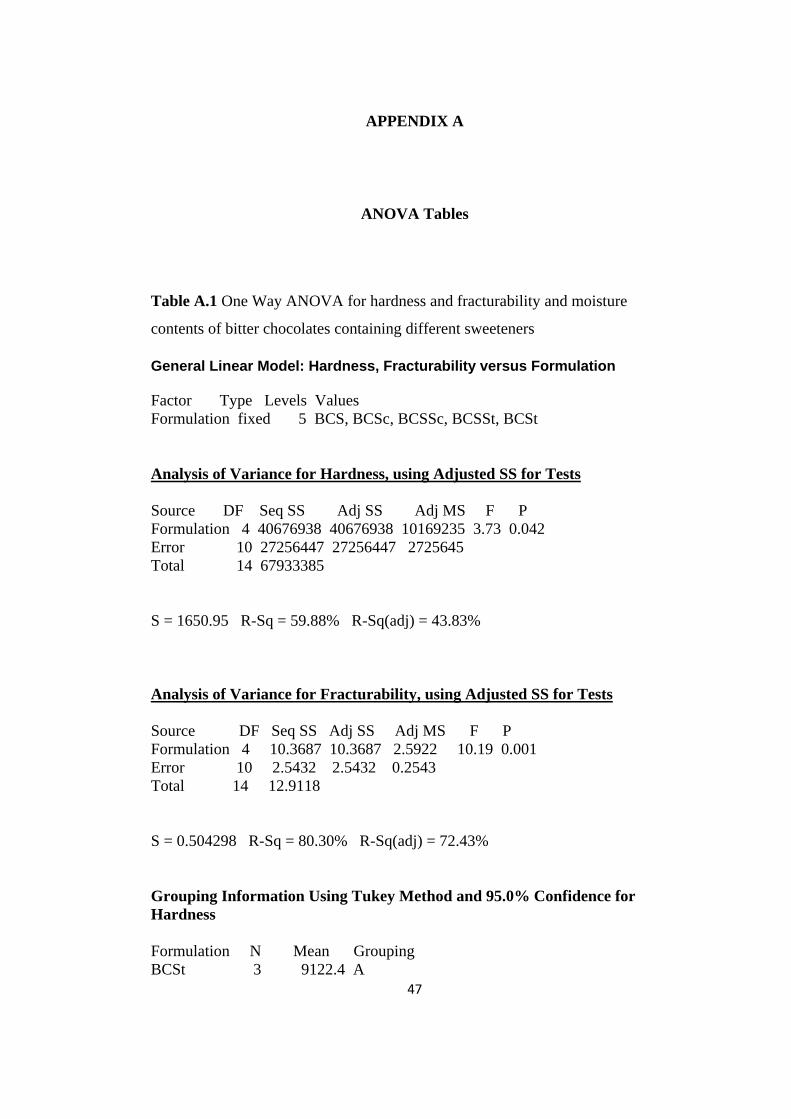
47
APPENDIX A
ANOVA Tables
Table A.1 One Way ANOVA for hardness and fracturability and moisture
contents of bitter chocolates containing different sweeteners
General Linear Model: Hardness, Fracturability versus Formulation
Factor Type Levels Values
Formulation fixed 5 BCS, BCSc, BCSSc, BCSSt, BCSt
Analysis of Variance for Hardness, using Adjusted SS for Tests
Source DF Seq SS Adj SS Adj MS F P
Formulation 4 40676938 40676938 10169235 3.73 0.042
Error 10 27256447 27256447 2725645
Total 14 67933385
S = 1650.95 R-Sq = 59.88% R-Sq(adj) = 43.83%
Analysis of Variance for Fracturability, using Adjusted SS for Tests
Source DF Seq SS Adj SS Adj MS F P
Formulation 4 10.3687 10.3687 2.5922 10.19 0.001
Error 10 2.5432 2.5432 0.2543
Total 14 12.9118
S = 0.504298 R-Sq = 80.30% R-Sq(adj) = 72.43%
Grouping Information Using Tukey Method and 95.0% Confidence for
Hardness
Formulation N Mean Grouping
BCSt 3 9122.4 A
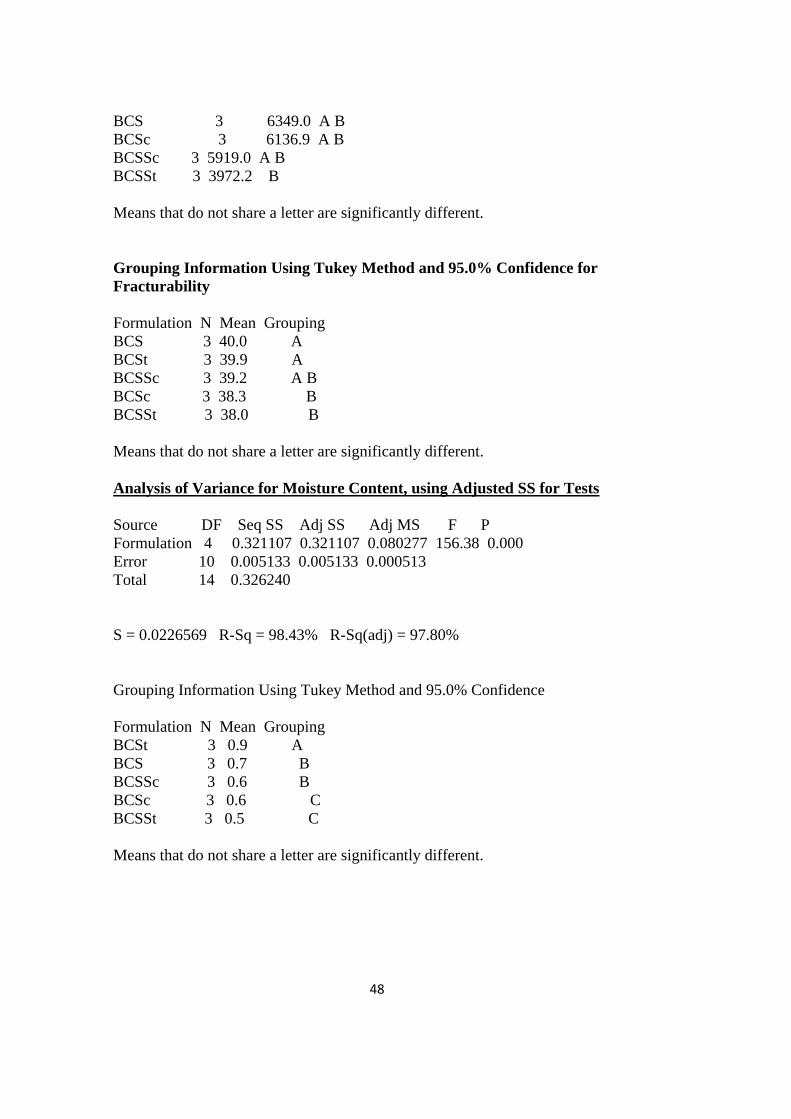
48
BCS 3 6349.0 A B
BCSc 3 6136.9 A B
BCSSc 3 5919.0 A B
BCSSt 3 3972.2 B
Means that do not share a letter are significantly different.
Grouping Information Using Tukey Method and 95.0% Confidence for
Fracturability
Formulation N Mean Grouping
BCS 3 40.0 A
BCSt 3 39.9 A
BCSSc 3 39.2 A B
BCSc 3 38.3 B
BCSSt 3 38.0 B
Means that do not share a letter are significantly different.
Analysis of Variance for Moisture Content, using Adjusted SS for Tests
Source DF Seq SS Adj SS Adj MS F P
Formulation 4 0.321107 0.321107 0.080277 156.38 0.000
Error 10 0.005133 0.005133 0.000513
Total 14 0.326240
S = 0.0226569 R-Sq = 98.43% R-Sq(adj) = 97.80%
Grouping Information Using Tukey Method and 95.0% Confidence
Formulation N Mean Grouping
BCSt 3 0.9 A
BCS 3 0.7 B
BCSSc 3 0.6 B
BCSc 3 0.6 C
BCSSt 3 0.5 C
Means that do not share a letter are significantly different.
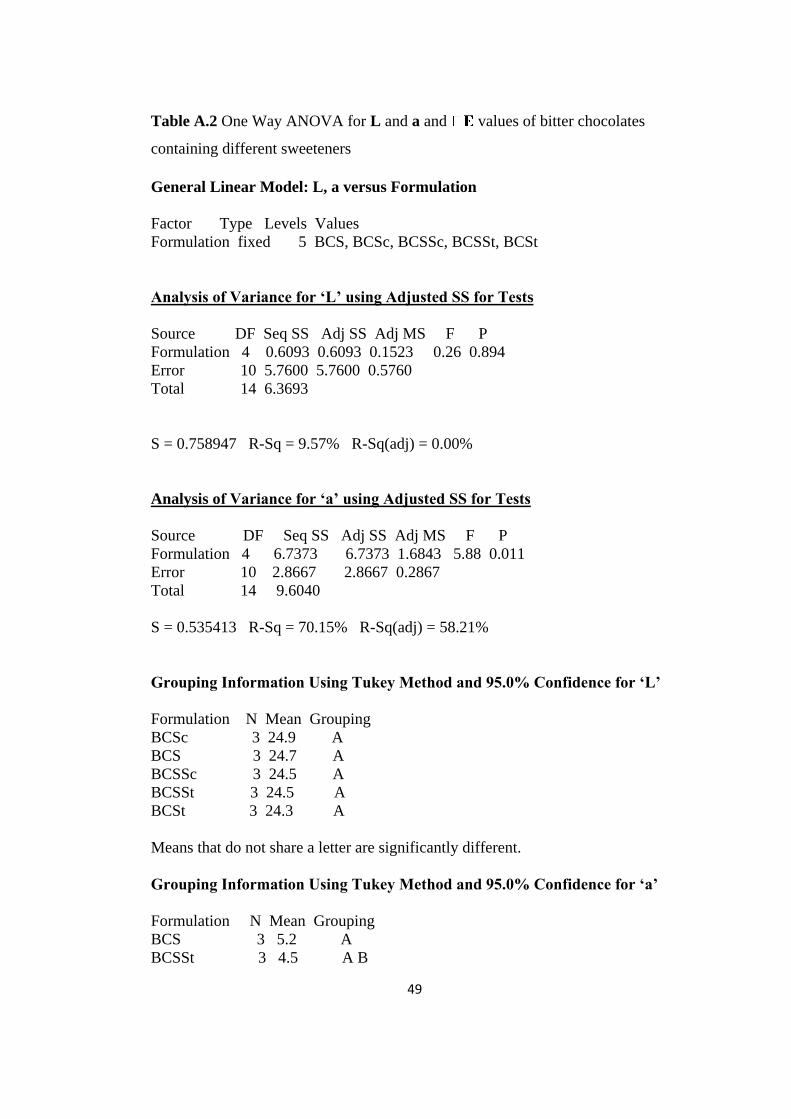
49
Table A.2 One Way ANOVA for L and a and values of bitter chocolates
containing different sweeteners
General Linear Model: L, a versus Formulation
Factor Type Levels Values
Formulation fixed 5 BCS, BCSc, BCSSc, BCSSt, BCSt
Analysis of Variance for ‘L’ using Adjusted SS for Tests
Source DF Seq SS Adj SS Adj MS F P
Formulation 4 0.6093 0.6093 0.1523 0.26 0.894
Error 10 5.7600 5.7600 0.5760
Total 14 6.3693
S = 0.758947 R-Sq = 9.57% R-Sq(adj) = 0.00%
Analysis of Variance for ‘a’ using Adjusted SS for Tests
Source DF Seq SS Adj SS Adj MS F P
Formulation 4 6.7373 6.7373 1.6843 5.88 0.011
Error 10 2.8667 2.8667 0.2867
Total 14 9.6040
S = 0.535413 R-Sq = 70.15% R-Sq(adj) = 58.21%
Grouping Information Using Tukey Method and 95.0% Confidence for ‘L’
Formulation N Mean Grouping
BCSc 3 24.9 A
BCS 3 24.7 A
BCSSc 3 24.5 A
BCSSt 3 24.5 A
BCSt 3 24.3 A
Means that do not share a letter are significantly different.
Grouping Information Using Tukey Method and 95.0% Confidence for ‘a’
Formulation N Mean Grouping
BCS 3 5.2 A
BCSSt 3 4.5 A B
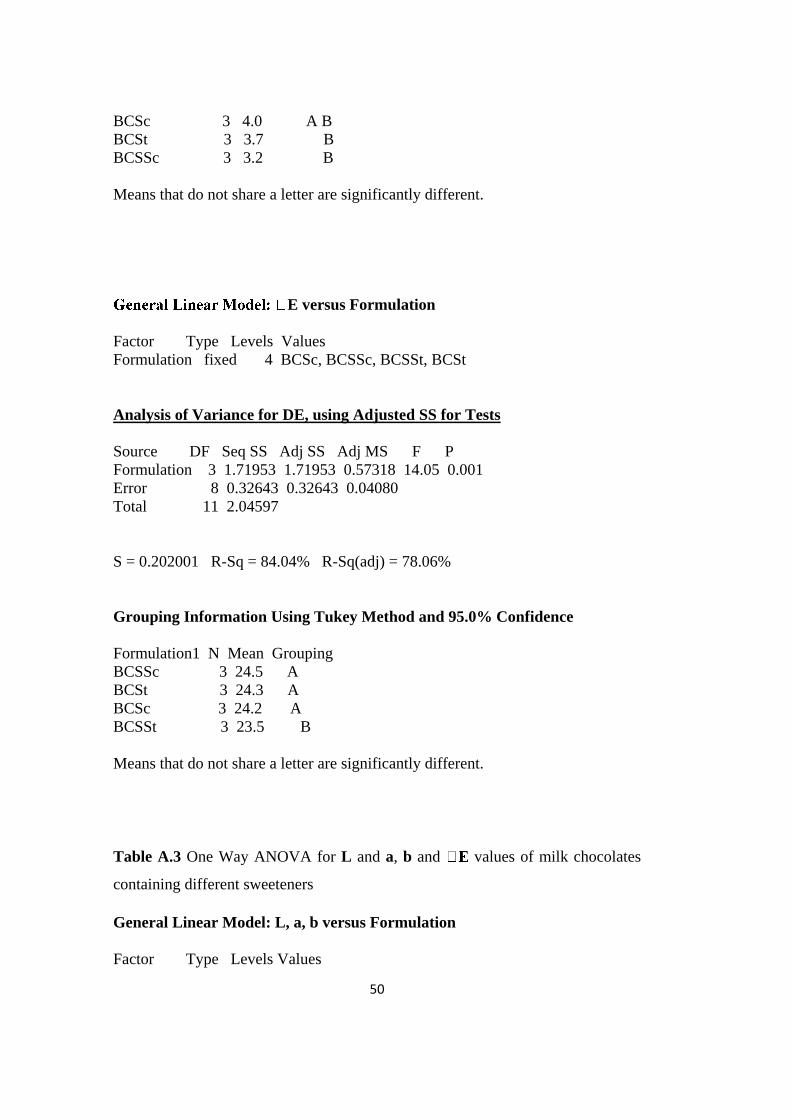
50
BCSc 3 4.0 A B
BCSt 3 3.7 B
BCSSc 3 3.2 B
Means that do not share a letter are significantly different.
E versus Formulation
Factor Type Levels Values
Formulation fixed 4 BCSc, BCSSc, BCSSt, BCSt
Analysis of Variance for DE, using Adjusted SS for Tests
Source DF Seq SS Adj SS Adj MS F P
Formulation 3 1.71953 1.71953 0.57318 14.05 0.001
Error 8 0.32643 0.32643 0.04080
Total 11 2.04597
S = 0.202001 R-Sq = 84.04% R-Sq(adj) = 78.06%
Grouping Information Using Tukey Method and 95.0% Confidence
Formulation1 N Mean Grouping
BCSSc 3 24.5 A
BCSt 3 24.3 A
BCSc 3 24.2 A
BCSSt 3 23.5 B
Means that do not share a letter are significantly different.
Table A.3 One Way ANOVA for L and a, b and values of milk chocolates
containing different sweeteners
General Linear Model: L, a, b versus Formulation
Factor Type Levels Values
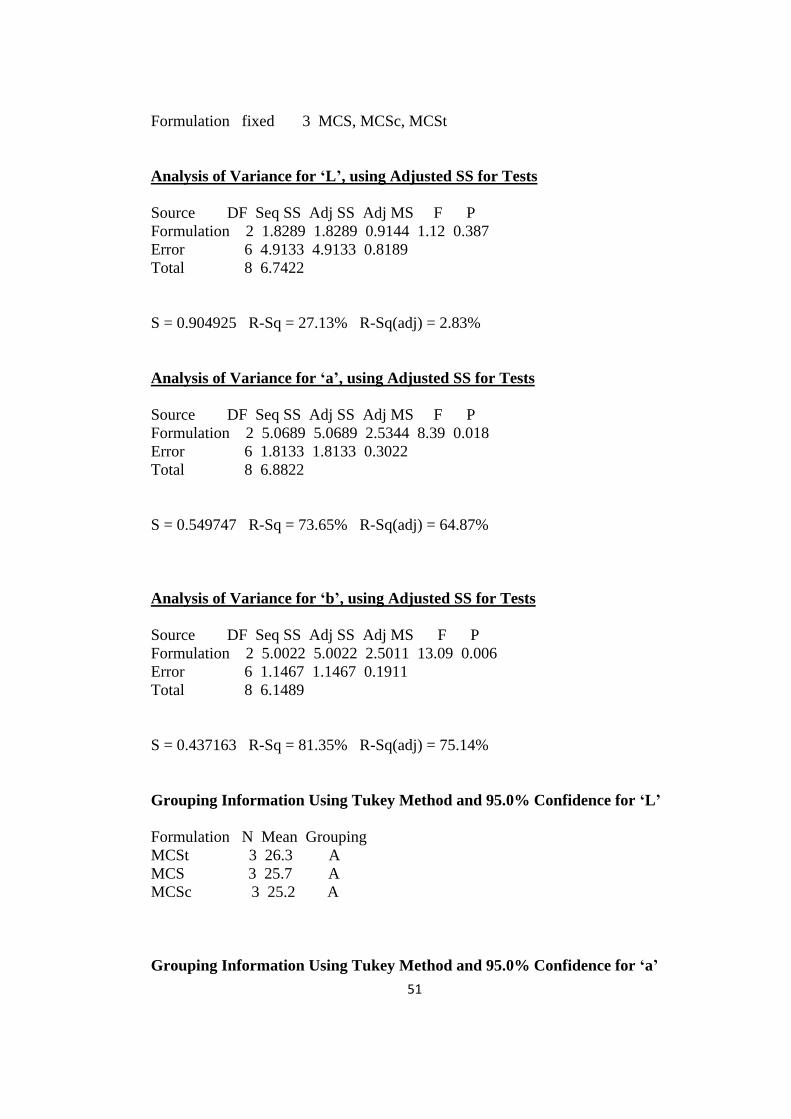
51
Formulation fixed 3 MCS, MCSc, MCSt
Analysis of Variance for ‘L’, using Adjusted SS for Tests
Source DF Seq SS Adj SS Adj MS F P
Formulation 2 1.8289 1.8289 0.9144 1.12 0.387
Error 6 4.9133 4.9133 0.8189
Total 8 6.7422
S = 0.904925 R-Sq = 27.13% R-Sq(adj) = 2.83%
Analysis of Variance for ‘a’, using Adjusted SS for Tests
Source DF Seq SS Adj SS Adj MS F P
Formulation 2 5.0689 5.0689 2.5344 8.39 0.018
Error 6 1.8133 1.8133 0.3022
Total 8 6.8822
S = 0.549747 R-Sq = 73.65% R-Sq(adj) = 64.87%
Analysis of Variance for ‘b’, using Adjusted SS for Tests
Source DF Seq SS Adj SS Adj MS F P
Formulation 2 5.0022 5.0022 2.5011 13.09 0.006
Error 6 1.1467 1.1467 0.1911
Total 8 6.1489
S = 0.437163 R-Sq = 81.35% R-Sq(adj) = 75.14%
Grouping Information Using Tukey Method and 95.0% Confidence for ‘L’
Formulation N Mean Grouping
MCSt 3 26.3 A
MCS 3 25.7 A
MCSc 3 25.2 A
Grouping Information Using Tukey Method and 95.0% Confidence for ‘a’
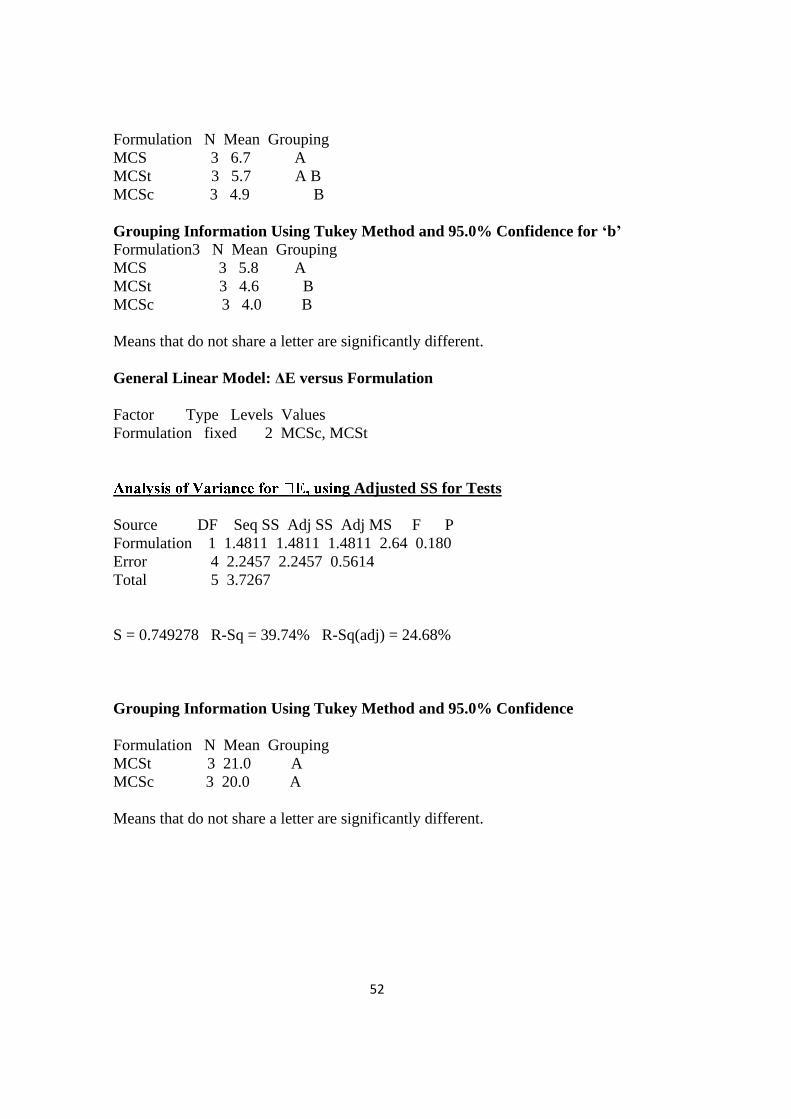
52
Formulation N Mean Grouping
MCS 3 6.7 A
MCSt 3 5.7 A B
MCSc 3 4.9 B
Grouping Information Using Tukey Method and 95.0% Confidence for ‘b’
Formulation3 N Mean Grouping
MCS 3 5.8 A
MCSt 3 4.6 B
MCSc 3 4.0 B
Means that do not share a letter are significantly different.
General Linear Model: ΔE versus Formulation
Factor Type Levels Values
Formulation fixed 2 MCSc, MCSt
g Adjusted SS for Tests
Source DF Seq SS Adj SS Adj MS F P
Formulation 1 1.4811 1.4811 1.4811 2.64 0.180
Error 4 2.2457 2.2457 0.5614
Total 5 3.7267
S = 0.749278 R-Sq = 39.74% R-Sq(adj) = 24.68%
Grouping Information Using Tukey Method and 95.0% Confidence
Formulation N Mean Grouping
MCSt 3 21.0 A
MCSc 3 20.0 A
Means that do not share a letter are significantly different.
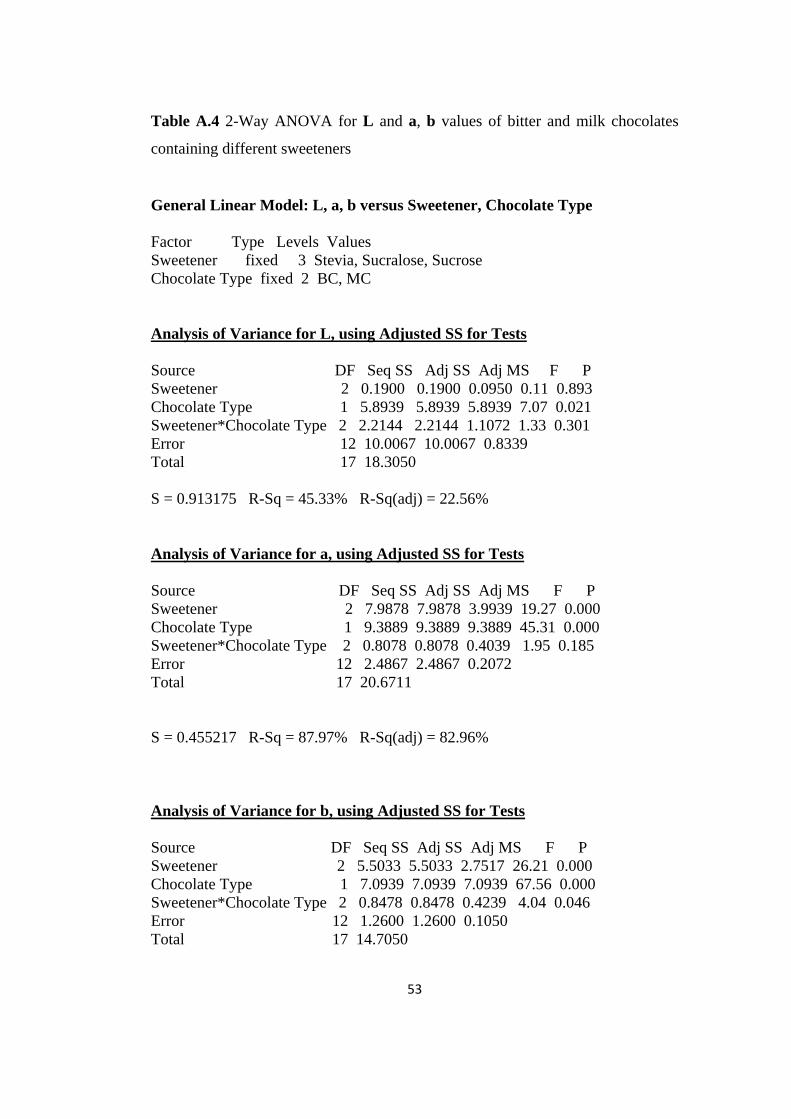
53
Table A.4 2-Way ANOVA for L and a, b values of bitter and milk chocolates
containing different sweeteners
General Linear Model: L, a, b versus Sweetener, Chocolate Type
Factor Type Levels Values
Sweetener fixed 3 Stevia, Sucralose, Sucrose
Chocolate Type fixed 2 BC, MC
Analysis of Variance for L, using Adjusted SS for Tests
Source DF Seq SS Adj SS Adj MS F P
Sweetener 2 0.1900 0.1900 0.0950 0.11 0.893
Chocolate Type 1 5.8939 5.8939 5.8939 7.07 0.021
Sweetener*Chocolate Type 2 2.2144 2.2144 1.1072 1.33 0.301
Error 12 10.0067 10.0067 0.8339
Total 17 18.3050
S = 0.913175 R-Sq = 45.33% R-Sq(adj) = 22.56%
Analysis of Variance for a, using Adjusted SS for Tests
Source DF Seq SS Adj SS Adj MS F P
Sweetener 2 7.9878 7.9878 3.9939 19.27 0.000
Chocolate Type 1 9.3889 9.3889 9.3889 45.31 0.000
Sweetener*Chocolate Type 2 0.8078 0.8078 0.4039 1.95 0.185
Error 12 2.4867 2.4867 0.2072
Total 17 20.6711
S = 0.455217 R-Sq = 87.97% R-Sq(adj) = 82.96%
Analysis of Variance for b, using Adjusted SS for Tests
Source DF Seq SS Adj SS Adj MS F P
Sweetener 2 5.5033 5.5033 2.7517 26.21 0.000
Chocolate Type 1 7.0939 7.0939 7.0939 67.56 0.000
Sweetener*Chocolate Type 2 0.8478 0.8478 0.4239 4.04 0.046
Error 12 1.2600 1.2600 0.1050
Total 17 14.7050
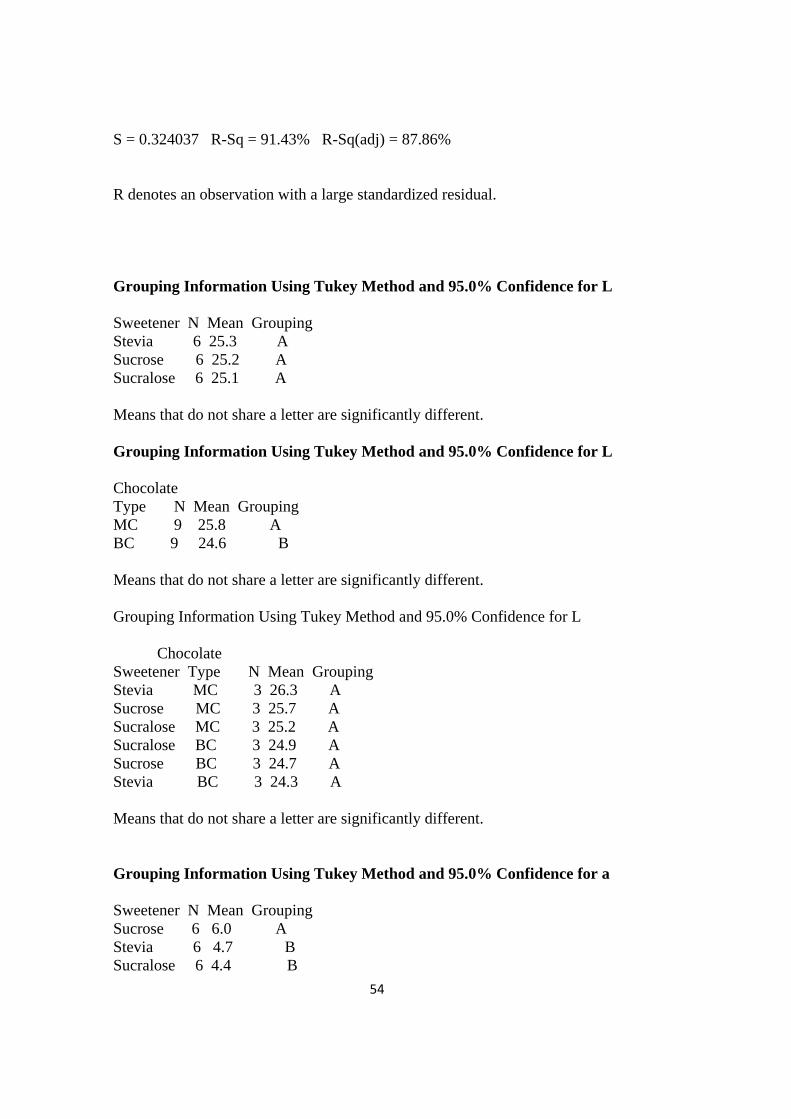
54
S = 0.324037 R-Sq = 91.43% R-Sq(adj) = 87.86%
R denotes an observation with a large standardized residual.
Grouping Information Using Tukey Method and 95.0% Confidence for L
Sweetener N Mean Grouping
Stevia 6 25.3 A
Sucrose 6 25.2 A
Sucralose 6 25.1 A
Means that do not share a letter are significantly different.
Grouping Information Using Tukey Method and 95.0% Confidence for L
Chocolate
Type N Mean Grouping
MC 9 25.8 A
BC 9 24.6 B
Means that do not share a letter are significantly different.
Grouping Information Using Tukey Method and 95.0% Confidence for L
Chocolate
Sweetener Type N Mean Grouping
Stevia MC 3 26.3 A
Sucrose MC 3 25.7 A
Sucralose MC 3 25.2 A
Sucralose BC 3 24.9 A
Sucrose BC 3 24.7 A
Stevia BC 3 24.3 A
Means that do not share a letter are significantly different.
Grouping Information Using Tukey Method and 95.0% Confidence for a
Sweetener N Mean Grouping
Sucrose 6 6.0 A
Stevia 6 4.7 B
Sucralose 6 4.4 B
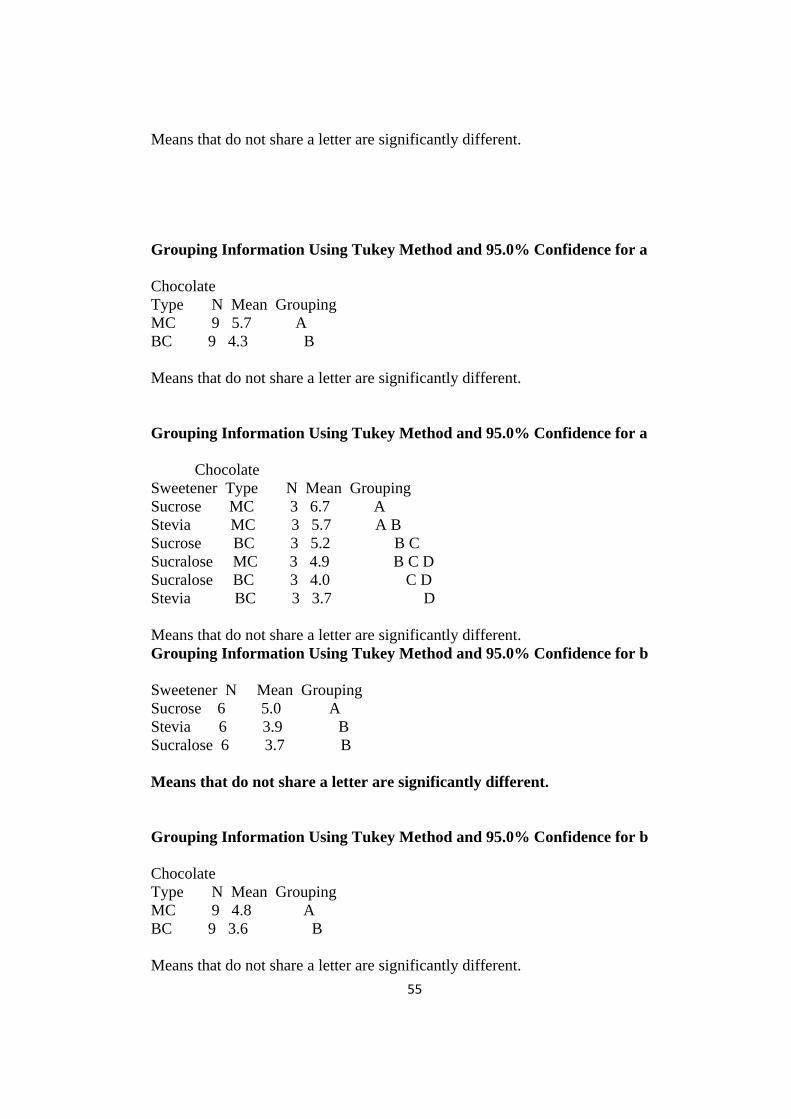
55
Means that do not share a letter are significantly different.
Grouping Information Using Tukey Method and 95.0% Confidence for a
Chocolate
Type N Mean Grouping
MC 9 5.7 A
BC 9 4.3 B
Means that do not share a letter are significantly different.
Grouping Information Using Tukey Method and 95.0% Confidence for a
Chocolate
Sweetener Type N Mean Grouping
Sucrose MC 3 6.7 A
Stevia MC 3 5.7 A B
Sucrose BC 3 5.2 B C
Sucralose MC 3 4.9 B C D
Sucralose BC 3 4.0 C D
Stevia BC 3 3.7 D
Means that do not share a letter are significantly different.
Grouping Information Using Tukey Method and 95.0% Confidence for b
Sweetener N Mean Grouping
Sucrose 6 5.0 A
Stevia 6 3.9 B
Sucralose 6 3.7 B
Means that do not share a letter are significantly different.
Grouping Information Using Tukey Method and 95.0% Confidence for b
Chocolate
Type N Mean Grouping
MC 9 4.8 A
BC 9 3.6 B
Means that do not share a letter are significantly different.
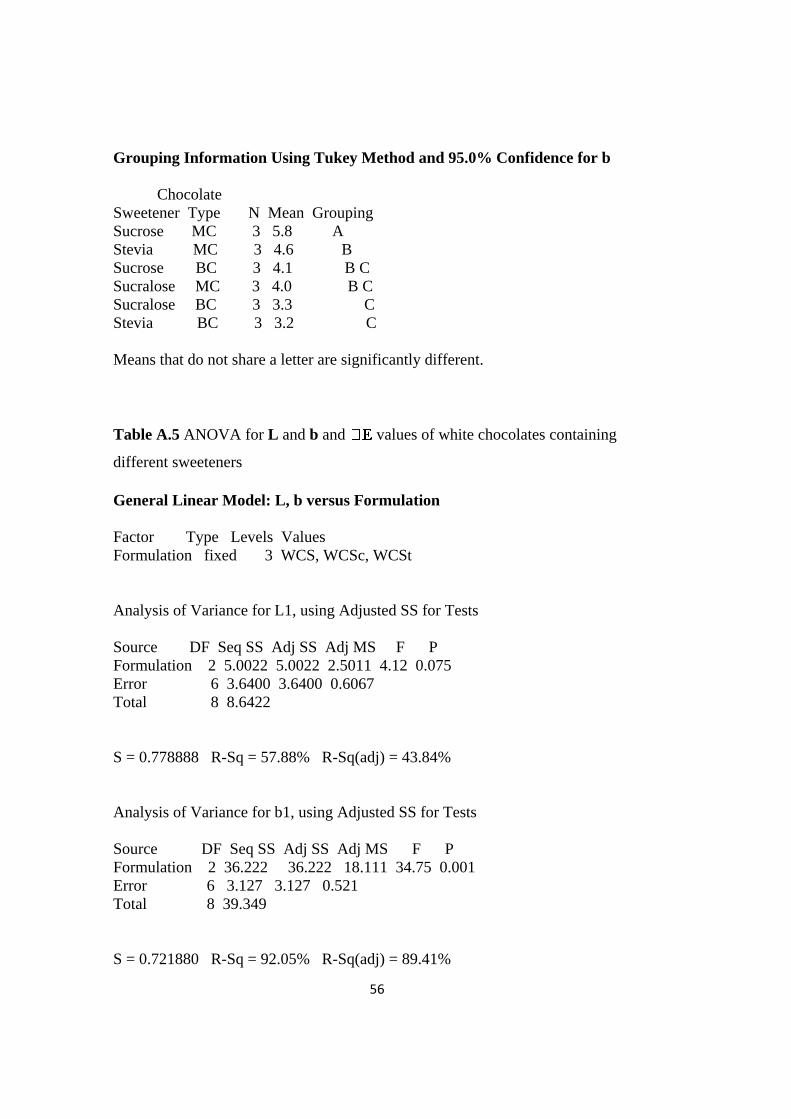
56
Grouping Information Using Tukey Method and 95.0% Confidence for b
Chocolate
Sweetener Type N Mean Grouping
Sucrose MC 3 5.8 A
Stevia MC 3 4.6 B
Sucrose BC 3 4.1 B C
Sucralose MC 3 4.0 B C
Sucralose BC 3 3.3 C
Stevia BC 3 3.2 C
Means that do not share a letter are significantly different.
Table A.5 ANOVA for L and b and values of white chocolates containing
different sweeteners
General Linear Model: L, b versus Formulation
Factor Type Levels Values
Formulation fixed 3 WCS, WCSc, WCSt
Analysis of Variance for L1, using Adjusted SS for Tests
Source DF Seq SS Adj SS Adj MS F P
Formulation 2 5.0022 5.0022 2.5011 4.12 0.075
Error 6 3.6400 3.6400 0.6067
Total 8 8.6422
S = 0.778888 R-Sq = 57.88% R-Sq(adj) = 43.84%
Analysis of Variance for b1, using Adjusted SS for Tests
Source DF Seq SS Adj SS Adj MS F P
Formulation 2 36.222 36.222 18.111 34.75 0.001
Error 6 3.127 3.127 0.521
Total 8 39.349
S = 0.721880 R-Sq = 92.05% R-Sq(adj) = 89.41%
57
Grouping Information Using Tukey Method and 95.0% Confidence for L1
Formulation N Mean Grouping
WCSt 3 80.5 A
WCS 3 79.8 A
WCSc 3 78.7 A
Means that do not share a letter are significantly different.
Grouping Information Using Tukey Method and 95.0% Confidence for b1
Formulation N Mean Grouping
WCS 3 27.5 A
WCSc 3 26.5 A
WCSt 3 22.8 B
Means that do not share a letter are significantly different
Factor Type Levels Values
Formulation fixed 2 WCSc, WCSt
Analysis of Variance for DE1, using Adjusted SS for Tests
Source DF Seq SS Adj SS Adj MS F P
Formulation2 1 15.870 15.870 15.870 36.08 0.004
Error 4 1.760 1.760 0.440
Total 5 17.629
S = 0.663241 R-Sq = 90.02% R-Sq(adj) = 87.52%
Grouping Information Using Tukey Method and 95.0% Confidence
Formulation N Mean Grouping
WCSt 3 4.9 A
WCSc 3 1.7 B
Means that do not share a letter are significantly different.
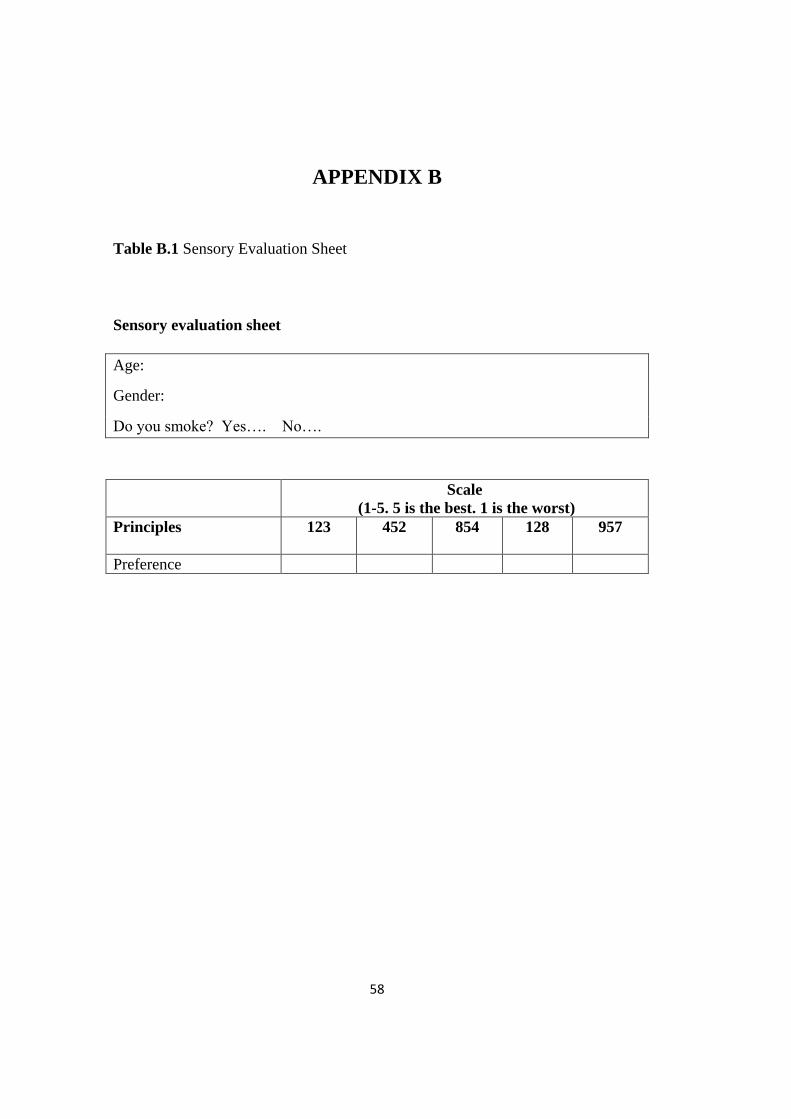
58
APPENDIX B
Table B.1 Sensory Evaluation Sheet
Sensory evaluation sheet
Age:
Gender:
Do you smoke? Yes…. No….
Scale
(1-5. 5 is the best. 1 is the worst)
Principles
123 452 854 128 957
Preference