Embed Size (px)
Citation preview
PERMAFROST AND PERIGLACIAL PROCESSESPermafrost and Periglac. Process. (2015)Published online in Wiley Online Library(wileyonlinelibrary.com) DOI: 10.1002/ppp.1871
Short CommunicationEffect of Snow Cover on the Active-Layer Thermal Regime – A Case Study fromJames Ross Island, Antarctic Peninsula
Filip Hrbáček,1* Kamil Láska1 and Zbyněk Engel2
1 Masaryk University, Faculty of Science, Department of Geography, Brno, Czech Republic2 Charles University in Prague, Department of Physical Geography and Geoecology, Praha, Czech Republic
*CorScienRepu
Copy
ABSTRACT
The response of active-layer thickness and the ground thermal regime to climatic conditions on the Ulu Peninsula(James Ross Island, northeastern Antarctic Peninsula) in 2011–13 is presented. The mean air temperature over thisperiod was –8.0°C and ground temperature at 5 cm depth varied from –6.4°C (2011–12) to –6.7°C (2012–13). Theactive-layer thickness ranged between 58 cm (January 2012) and 52 cm (February 2013). Correlation analyses indi-cate that air temperature affects ground temperature more significantly on snow-free days (R2 =0.82) than on snowcover days (R2 = 0.53). Although the effect of snow cover on the daily amplitude of ground temperature was observ-able to 20 cm depth, the overall influence of snow depth on ground temperature was negligible (freezing n-factor of0.95–0.97). Copyright © 2015 John Wiley & Sons, Ltd.
KEY WORDS: active-layer; ground temperature; snow cover; air temperature; Antarctic Peninsula; active layer thickness
INTRODUCTION
The Antarctic Peninsula (AP) has experienced the largestatmospheric warming of all regions on Earth over the last50 years (Turner et al., 2002), with the temperature increaseaccelerating downwasting of ice sheets on the AP (Vaughan,2006) and causing the collapse of ice shelves along its easterncoast (Cook and Vaughan, 2010). The response of regionalpermafrost to this warming remains unknown and representsone of the most important topics in climate modelling,because numerical models suggest that permafrost maybecome the dominant contributor of CO2 and CH4 into theatmosphere in the 21st century (Schaefer et al., 2011).Despite the increasing number of periglacial studies focusingon the AP in the last decade (Vieira et al., 2010; Guglielminet al., 2014; Bockheim et al., 2013; De Pablo et al., 2014;Almeida et al., 2014; Goyanes et al., 2014), thermal condi-tions in the active layer and its interaction with meteorologi-cal factors are not well known. In particular, the influence ofsnow on active-layer thickness (ALT) and the thermal regimeis relatively poorly understood, despite being a major modu-lating factor to the atmosphere (Boike et al., 2008; Vieira
respondence to: F. Hrbáček, Masaryk University, Faculty ofce, Department of Geography, Kotlářská 2, 611 37 Brno, Czechblic. E-mail: [email protected]
right © 2015 John Wiley & Sons, Ltd.
et al., 2014). In this paper, we evaluate the effect of air tem-perature and snow cover on active-layer temperature in thenorthern part of James Ross Island (JRI) from March 2011to April 2013, one of the largest permafrost regions in thenortheastern AP.
REGIONAL SETTINGS
The study site (63°48′S 57°52′W) is located in the UluPeninsula, northern JRI (Figure 1), approximately 100msouth of the Johann Gregor Mendel Station at 10m asl.Glaciers started to retreat from the Ulu Peninsula before12.9 ka (Nývlt et al., 2014), leaving low-lying areas ice-freeat the beginning of the Holocene. At present, small glacierspersist only on high-altitude volcanic plateaus and in valleyheads (Engel et al., 2012). Permafrost in the northern part ofJRI can approach 95m in thickness and the ALT is highly var-iable, ranging from 22 to 150cm (Borzotta and Trombotto,2004; Engel et al., 2010; Bockheim et al., 2013). The studysite is located on a Holocene marine terrace (Figure 2)formed by beach deposits composed of gravelly sand(Stachoň et al., 2014).
The climate of JRI is dominated by the advection of airmasses, which are strongly influenced by the position ofthe AP relative to the circumpolar trough of low pressure
Received 11 September 2014Revised 31 July 2015
Accepted 5 August 2015
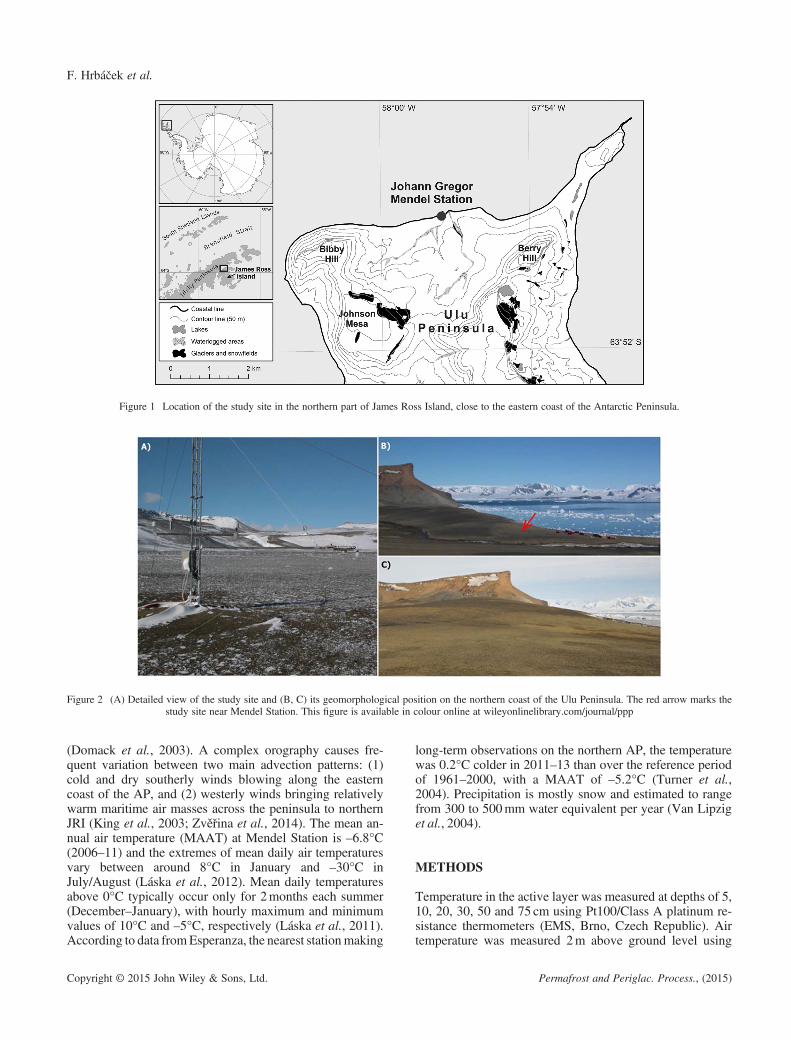
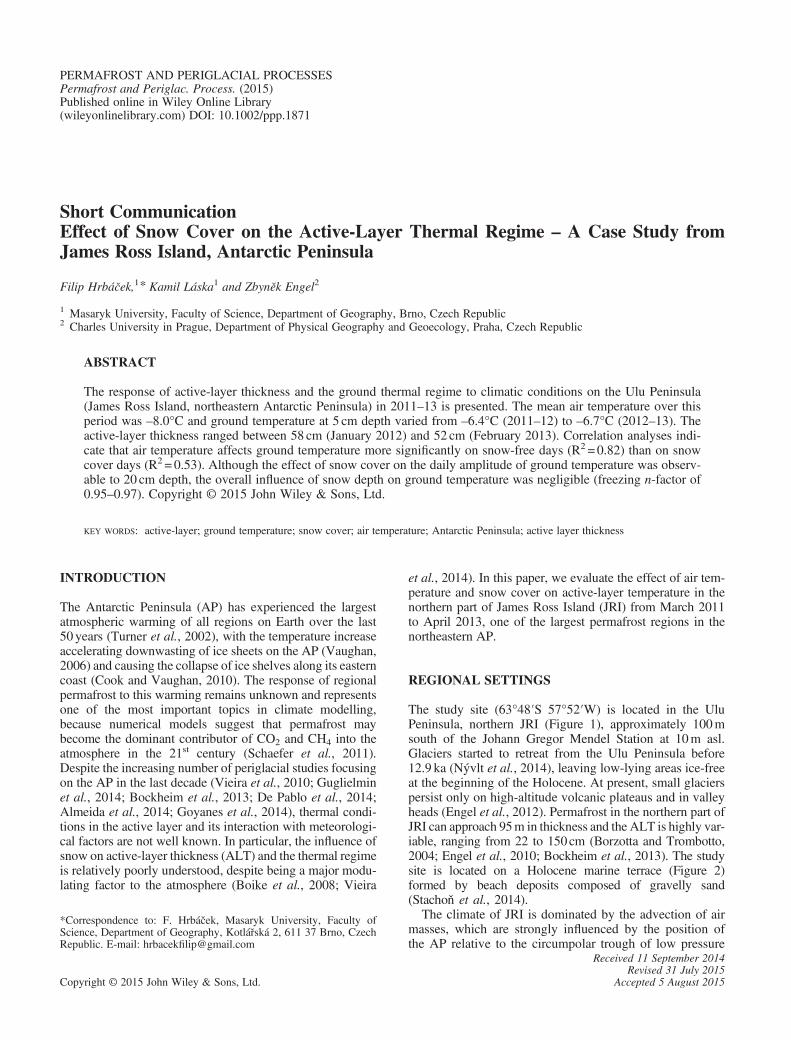
Figure 1 Location of the study site in the northern part of James Ross Island, close to the eastern coast of the Antarctic Peninsula.
Figure 2 (A) Detailed view of the study site and (B, C) its geomorphological position on the northern coast of the Ulu Peninsula. The red arrow marks thestudy site near Mendel Station. This figure is available in colour online at wileyonlinelibrary.com/journal/ppp
F. Hrbáček et al.
(Domack et al., 2003). A complex orography causes fre-quent variation between two main advection patterns: (1)cold and dry southerly winds blowing along the easterncoast of the AP, and (2) westerly winds bringing relativelywarm maritime air masses across the peninsula to northernJRI (King et al., 2003; Zvěřina et al., 2014). The mean an-nual air temperature (MAAT) at Mendel Station is –6.8°C(2006–11) and the extremes of mean daily air temperaturesvary between around 8°C in January and –30°C inJuly/August (Láska et al., 2012). Mean daily temperaturesabove 0°C typically occur only for 2months each summer(December–January), with hourly maximum and minimumvalues of 10°C and –5°C, respectively (Láska et al., 2011).According to data fromEsperanza, the nearest stationmaking
Copyright © 2015 John Wiley & Sons, Ltd.
long-term observations on the northern AP, the temperaturewas 0.2°C colder in 2011–13 than over the reference periodof 1961–2000, with a MAAT of –5.2°C (Turner et al.,2004). Precipitation is mostly snow and estimated to rangefrom 300 to 500mm water equivalent per year (Van Lipziget al., 2004).
METHODS
Temperature in the active layer was measured at depths of 5,10, 20, 30, 50 and 75 cm using Pt100/Class A platinum re-sistance thermometers (EMS, Brno, Czech Republic). Airtemperature was measured 2m above ground level using
Permafrost and Periglac. Process., (2015)
Active Layer Monitoring on James Ross Island
an EMS33 sensor (EMS Brno) with a Pt100/Class A plati-num resistance thermometer placed inside a solar radiationshield. Both ground and air temperatures were measuredwith an accuracy of ± 0.15°C and data were recorded at30min intervals with an EdgeBox V12 datalogger (EMSBrno). We then calculated mean daily air temperatures, thecumulative sum of mean daily air temperatures above 0°C(the thawing-degree days – TDDa) and the cumulativesum of mean daily air temperatures below 0°C (thefreezing-degree days – FDDa), according to Guglielminet al. (2008) and De Pablo et al. (2014). Incoming andreflected shortwave radiation (used to estimate albedo) weremeasured using EMS-11 (EMS Brno) and CM6B (Kipp &Zonen, Delft, The Netherlands) pyranometers, respectively,at 10 s time intervals and stored as 30min average values.Snow depth was recorded every 2h using an ultrasonic depthsensor (Judd Communication, Salt Lake City, UT, USA)with an accuracy of±1 cm. All meteorological parametersand ground temperature data were analysed during the periodfrom 1 March 2011 to 30 April 2013. MAAT and meanannual ground temperature (MAGT) were also calculatedfor a period of 2years from March 2011 to February 2013,referred to in the text as the 2011–12 and 2012–13 periods.The ground thermal regime for the period of 2011–13 was
evaluated in accordance with recent studies investigatingMaritime Antarctic (Guglielmin et al., 2008; Michel et al.,2012; De Pablo et al., 2014), using the following parameters:(1) mean annual and monthly ground temperatures; (2) the cu-mulative sum of mean daily ground temperatures above 0°C(the thawing-degree days – TDDg); (3) the cumulative sumof mean daily ground temperatures below 0°C (the freezing-degree days – FDDg); and (4) the ALT, interpolated as the0°C isotherm depth and derived from contours of the dailymean ground temperature interpolated using kriging algo-rithms in the Surfer® software program (Golden Software,Golden, CO, USA).Freezing and thawing n-factors (Karunaratne and Burn, 2003)
were calculated in order to evaluate the buffering effects of thesnow layer on heat transmission between air and the ground sur-face (De Pablo et al., 2014), with the effect of air temperature onthe ground analysed at 5cm depth (e.g. Zhang et al., 1997).Snow cover duration was estimated using a combination
of ultrasonic depth sensors and the radiometric albedo.The criteria for snow occurrence were a depth> 2 cm (fromthe ultrasonic sensors) and albedo> 0.4 (which correspondsto old snow; Warner, 2004). Snow depth records were avail-able for the period from 1 March 2011 to 11 June 2012,while radiometric albedo data were available for the periodsfrom 20 February to 16 May 2011 and 5 March 2012 to 30April 2013. Despite the presence of gaps in the records dueto sensor malfunctions, we were able to analyse an insula-tion effect of snow cover on the ground temperature regimeat 5 cm depth using (1) correlation analysis between meandaily air and ground temperatures during the surfacesnow-free and snow cover periods, and (2) comparison ofthe snow cover records with ground temperature daily am-plitudes (Zhang et al., 1997).
Copyright © 2015 John Wiley & Sons, Ltd.
RESULTS
Air and Ground Temperatures
The MAAT over the whole 2 year study period was –8.0°C;although the individual MAAT values for the 2 years wereequal, the temperature range differed from 44.0°C (2011–12) to 42.3°C (2012–13). The larger temperature extremein 2011–12 was documented by a lower mean temperatureof the coldest month (July 2011, –18.5°C) and a highermean temperature of the warmest month (December 2011,2.0°C) compared to those for 2012–13 (–15.0°C and 0.2°C, respectively). The maximum air temperature recordedduring the entire study period was 11.6°C on 23 February2013; the minimum recorded was –34.1°C on 26 July 2011.
The MAGT at 5 cm depth was –6.4°C in 2011–12 and –6.7°C in 2012–13. The mean monthly ground temperatureat 5 cm depth varied between –16.3°C (July 2011) and6.1°C (December 2011). Minimum (–26.3°C) and maxi-mum (16.0°C) 5 cm ground temperatures over the studyperiod were recorded on 1 August 2011 and 18 December2012, respectively. The MAGT at 50 cm depth, which rep-resents active-layer conditions close to the permafrost table,ranged between –6.1°C in 2011–12 and –6.0°C in 2012–13.Minimum (–16.3°C) and maximum (1.3°C) ground temper-atures at 50 cm were recorded on 5 August 2011 and 26January 2012, respectively. The MAGT at 75 cm depth,which represents the uppermost part of the permafrost zone,reached –5.8°C, while maximum and minimum tempera-tures for the greatest depth were –1.0°C and –14.4°C,respectively.
Thawing and Freezing Seasons
The duration of the thawing season as defined by the ther-mal regime at 5 cm depth differed significantly betweenthe two periods (Table 1). In 2011–12, the thawing seasonstarted on 9 October 2011 and terminated on 27 March2012, lasting for 170 days. In 2012–13, the thawing seasonboth started and ended later (13 December 2012 and 20April 2013, respectively) and its duration was considerablyshorter (128 days). The mean ground temperature at 5 cmdepth was lower during the longer thawing season of2011–2012 (2.3°C) than during the shorter thawing seasonof 2012–13 (4.3°C). TDDg calculated for the thawing sea-son, however, was much higher in 2011–12 (496.1°Cday)than in 2012–13 (358.3°Cday). The active layer thawedslowly in 2011–12, reaching its maximum on 26 January2012 (58 cm). In contrast, active-layer thaw was more rapidin 2012–13, reaching its maximum on 13 February 2013(52 cm).
The freezing season at 5 cm depth lasted for 203 days in2011 and 259days in 2012. The mean ground temperatureat 5 cm varied from –13.4°C in the freezing season of2011 to –10.6°C in that of 2012. Despite the lower meantemperature recorded in 2011, a small difference in totalFDDg was observed between the two freezing seasons, at
Permafrost and Periglac. Process., (2015)
Table 1 Quantitative characteristics of freezing and thawing seasons at Mendel Station during the period 2011–13.
Freezing season Thawing season
2011 2012 2011–12 2012–13
Period 19/3/2011 28/3/2012 9/10/2011 13/12/20128/10/2011 12/12/2012 27/3/2012 20/4/2013
Duration (days) 203 259 170 128Mean air temperature (°C) �13.7 �11.0 �1.0 �0.5Mean GT5 cm (°C) �13.4 �10.6 2.3 4.3Min air temperature (°C) �34.1 �30.7 �17.2 �14.6Max air temperature (°C) 5.7 7.1 9.9 11.6Min GT5 cm (°C) �26.0 �23.5 �12.3 �11.4Max GT5 cm (°C) �0.4 �0.3 15.3 16.0Min GT75 cm (°C) �14.4 �12.0 �9.0 �3.3Max GT75 cm (°C) �1.2 �1.0 �1.0 �1.1FDDa (°C day) �2814.1 �2878.9 �330.4 �195.8FDDg (°C day) �2735.5 �2748.5 �100.6 �77.6n-factor 0.97 0.95 3.03 2.27TDDa (°C day) 22.0 28.9 163.8 157.7TDDg (°C day) 0.0 0.0 496.1 358.3
GT5 cm=Ground temperature at 5 cm depth. See text for other abbreviations.
F. Hrbáček et al.
–2735.5°Cday in 2011 and –2748.5°Cday in 2012. Al-though positive air temperatures were recorded on severaldays during both the freezing seasons (Table 1), there wereno signs of ground thaw at 5 cm depth.
Effect of Snow Cover on Ground Temperature
The temporal distribution and duration of snow cover onJRI varied significantly over the study period (Figure 3).In 2011–12, snow covered the study site for 167 days,with the period of continuous snow cover lasting from22 March to 20 September (67 days). The period of maxi-mum snow depth (21 to 34 cm) persisted from 29 June to23 July. In 2012–13, continuous snow cover occurredbetween 8 May and 12 December. The maximum snowdepth of 15 cm was observed on 8 May, with relativelythick snow cover (up to 10 cm) lasting until at least 6 June.The continuous period of fresh snow cover was registeredbetween 21 June and 10 December, based on analbedo> 0.80 (Warner, 2004).Figure 4 shows the relationship between air temperature
and ground temperature at 5 cm depth for all days(Figure 4A, D), snow-free days (Figure 4B, E) and snowcover days (Figure 4C, F) during 2011–12 (Figure 4A–C)and 2012–13 (Figure 4D–F). The correlation patterns reveala significant relationship between the air and ground temper-atures (coefficient of determination R2= 0.80) in 2011–12.Moreover, a closer correlation between these temperatureswas found for snow-free days (R2=0.82) than for snowcover days (R2= 0.53). In contrast, a less significant rela-tionship (R2=0.67) between air and ground temperaturesat 5 cm depth, as well as a very small difference betweensnow-free days (R2= 0.56) and snow cover days(R2= 0.52), was observed in 2012–13.
Copyright © 2015 John Wiley & Sons, Ltd.
The effect of snow cover on the active-layer thermalregime was also indicated by a reduction in the daily ampli-tude of ground temperature. Although the influence of snowcover on amplitude values was detected to a depth of 20 cm,the most significant temperature changes were recorded at5 cm depth (Figure 5). Mean daily ground temperatureamplitudes during snow-free days in thawing seasonsranged between 5.8°C at 5 cm and 1.5°C at 20 cm. The max-imum daily ground temperature amplitude was recordedbetween 6 and 9 March 2012, when values ranged from15°C at 5 cm to 5°C at 20 cm. The effects of snow coveron daily ground temperature amplitudes were more signifi-cant during freezing seasons, with the longer duration ofsnow cover in 2012 resulting in lower amplitude values(1.9°C at 5 cm and 0.9°C at 20 cm) than those recorded in2011 (3.7°C and 1.2°C). Diurnal amplitudes of ground tem-perature rarely decreased to 0.1°C during freezing seasons.The longest period of very low diurnal amplitudes at depthsfrom 5 to 20 cm (0.1 to 0.4°C) was observed between 1 and11 November 2012.
The overall influence of snow on the ground thermalregime at 5 cm depth during the freezing seasons can beseen in the obtained values of the freezing n-factors (Table 1;Figure 6). Total freezing n-factors varied between 0.97(2011) and 0.95 (2012), with values ranging from 0.85 to0.95 on snow cover days. Differences in freezing n-factordevelopment were observed between the respective freezingseasons of 2011 and 2012. The slower increase in the n-fac-tor during the period from the end of March 2011 to the endof May 2011 indicates a more significant effect of snowcover during this early winter than in 2012. The observedfreezing n-factor regime indicates periods with thicker snowcover, which caused a slight decrease from values>0.95 toapprox. 0.90 in both study years.
Permafrost and Periglac. Process., (2015)
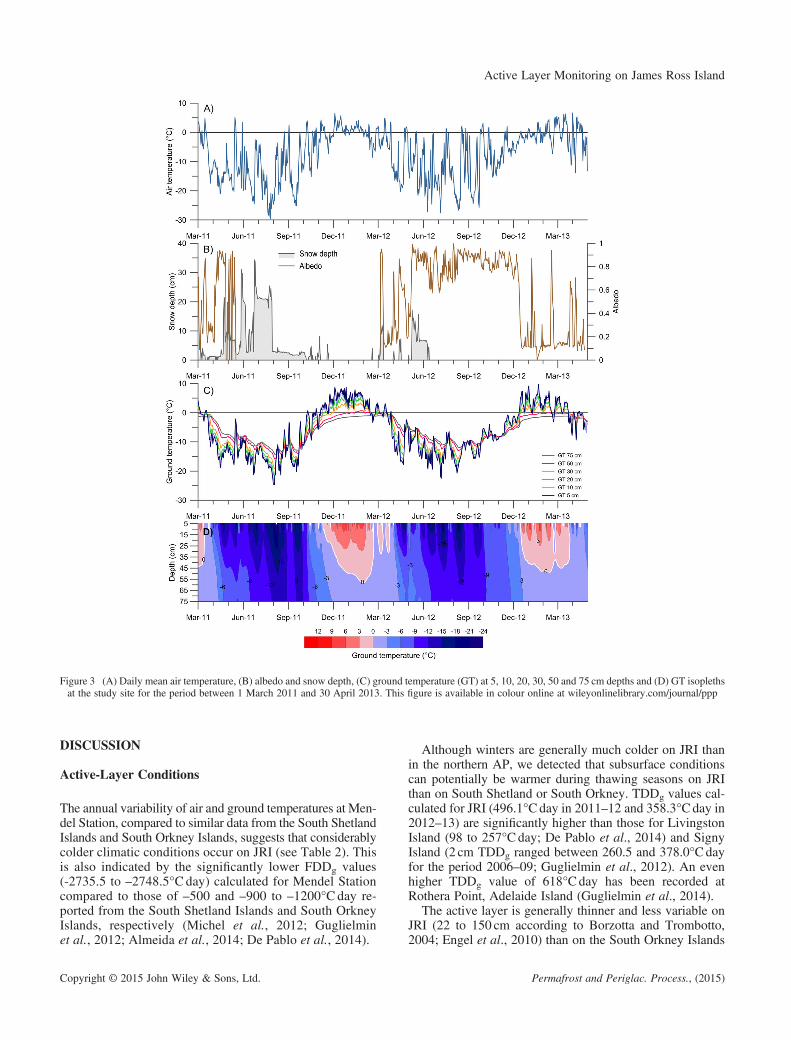
Figure 3 (A) Daily mean air temperature, (B) albedo and snow depth, (C) ground temperature (GT) at 5, 10, 20, 30, 50 and 75 cm depths and (D) GT isoplethsat the study site for the period between 1 March 2011 and 30 April 2013. This figure is available in colour online at wileyonlinelibrary.com/journal/ppp
Active Layer Monitoring on James Ross Island
DISCUSSION
Active-Layer Conditions
The annual variability of air and ground temperatures at Men-del Station, compared to similar data from the South ShetlandIslands and South Orkney Islands, suggests that considerablycolder climatic conditions occur on JRI (see Table 2). Thisis also indicated by the significantly lower FDDg values(-2735.5 to –2748.5°C day) calculated for Mendel Stationcompared to those of –500 and –900 to –1200°C day re-ported from the South Shetland Islands and South OrkneyIslands, respectively (Michel et al., 2012; Guglielminet al., 2012; Almeida et al., 2014; De Pablo et al., 2014).
Copyright © 2015 John Wiley & Sons, Ltd.
Although winters are generally much colder on JRI thanin the northern AP, we detected that subsurface conditionscan potentially be warmer during thawing seasons on JRIthan on South Shetland or South Orkney. TDDg values cal-culated for JRI (496.1°Cday in 2011–12 and 358.3°Cday in2012–13) are significantly higher than those for LivingstonIsland (98 to 257°Cday; De Pablo et al., 2014) and SignyIsland (2 cm TDDg ranged between 260.5 and 378.0°Cdayfor the period 2006–09; Guglielmin et al., 2012). An evenhigher TDDg value of 618°Cday has been recorded atRothera Point, Adelaide Island (Guglielmin et al., 2014).
The active layer is generally thinner and less variable onJRI (22 to 150 cm according to Borzotta and Trombotto,2004; Engel et al., 2010) than on the South Orkney Islands
Permafrost and Periglac. Process., (2015)
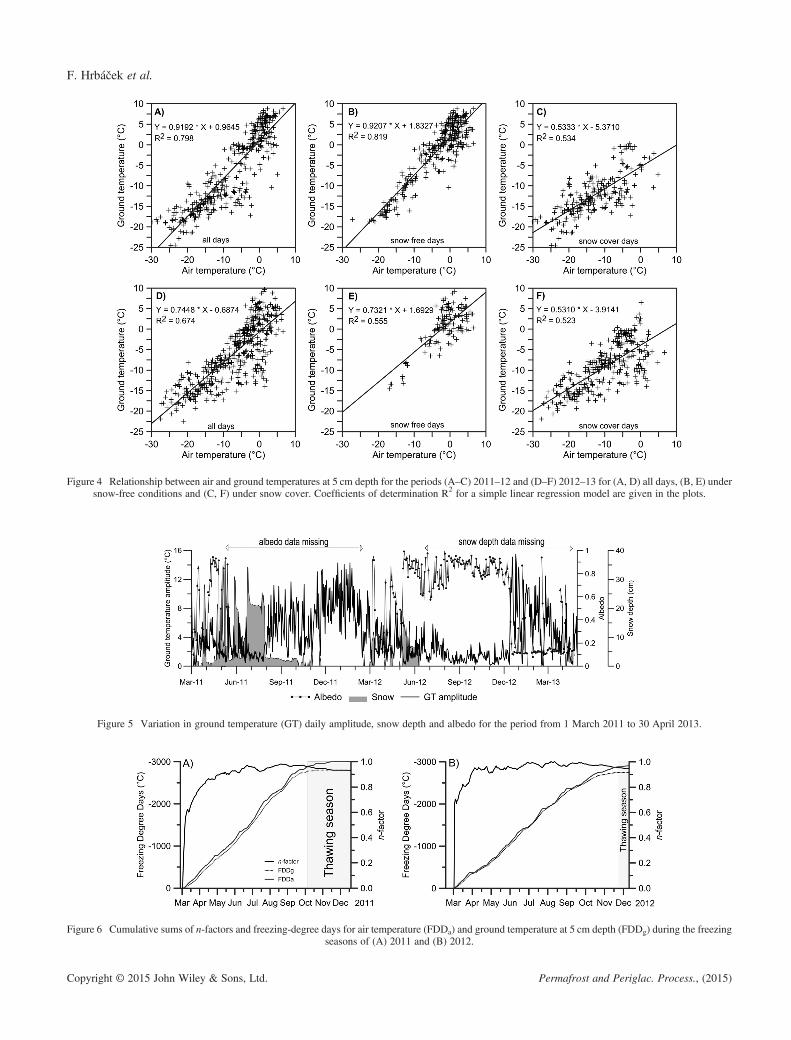
Figure 4 Relationship between air and ground temperatures at 5 cm depth for the periods (A–C) 2011–12 and (D–F) 2012–13 for (A, D) all days, (B, E) undersnow-free conditions and (C, F) under snow cover. Coefficients of determination R2 for a simple linear regression model are given in the plots.
Figure 5 Variation in ground temperature (GT) daily amplitude, snow depth and albedo for the period from 1 March 2011 to 30 April 2013.
Figure 6 Cumulative sums of n-factors and freezing-degree days for air temperature (FDDa) and ground temperature at 5 cm depth (FDDg) during the freezingseasons of (A) 2011 and (B) 2012.
F. Hrbáček et al.
Copyright © 2015 John Wiley & Sons, Ltd. Permafrost and Periglac. Process., (2015)
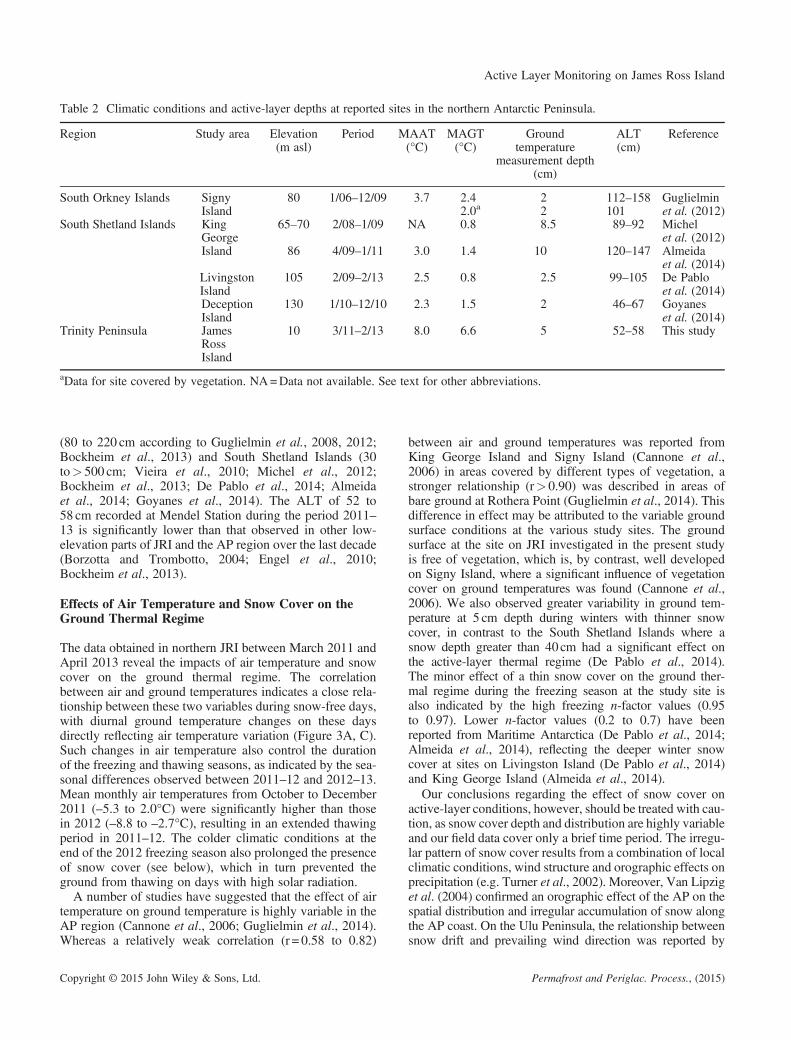
Table 2 Climatic conditions and active-layer depths at reported sites in the northern Antarctic Peninsula.
Region Study area Elevation(m asl)
Period MAAT(°C)
MAGT(°C)
Groundtemperature
measurement depth(cm)
ALT(cm)
Reference
South Orkney Islands SignyIsland
80 1/06–12/09 �3.7 �2.4 2 112–158 Guglielminet al. (2012)�2.0a 2 101
South Shetland Islands KingGeorgeIsland
65–70 2/08–1/09 NA �0.8 8.5 89–92 Michelet al. (2012)
86 4/09–1/11 �3.0 �1.4 10 120–147 Almeidaet al. (2014)
LivingstonIsland
105 2/09–2/13 �2.5 �0.8 2.5 99–105 De Pabloet al. (2014)
DeceptionIsland
130 1/10–12/10 �2.3 �1.5 2 46–67 Goyaneset al. (2014)
Trinity Peninsula JamesRossIsland
10 3/11–2/13 �8.0 �6.6 5 52–58 This study
aData for site covered by vegetation. NA=Data not available. See text for other abbreviations.
Active Layer Monitoring on James Ross Island
(80 to 220 cm according to Guglielmin et al., 2008, 2012;Bockheim et al., 2013) and South Shetland Islands (30to> 500 cm; Vieira et al., 2010; Michel et al., 2012;Bockheim et al., 2013; De Pablo et al., 2014; Almeidaet al., 2014; Goyanes et al., 2014). The ALT of 52 to58 cm recorded at Mendel Station during the period 2011–13 is significantly lower than that observed in other low-elevation parts of JRI and the AP region over the last decade(Borzotta and Trombotto, 2004; Engel et al., 2010;Bockheim et al., 2013).
Effects of Air Temperature and Snow Cover on theGround Thermal Regime
The data obtained in northern JRI between March 2011 andApril 2013 reveal the impacts of air temperature and snowcover on the ground thermal regime. The correlationbetween air and ground temperatures indicates a close rela-tionship between these two variables during snow-free days,with diurnal ground temperature changes on these daysdirectly reflecting air temperature variation (Figure 3A, C).Such changes in air temperature also control the durationof the freezing and thawing seasons, as indicated by the sea-sonal differences observed between 2011–12 and 2012–13.Mean monthly air temperatures from October to December2011 (–5.3 to 2.0°C) were significantly higher than thosein 2012 (–8.8 to –2.7°C), resulting in an extended thawingperiod in 2011–12. The colder climatic conditions at theend of the 2012 freezing season also prolonged the presenceof snow cover (see below), which in turn prevented theground from thawing on days with high solar radiation.A number of studies have suggested that the effect of air
temperature on ground temperature is highly variable in theAP region (Cannone et al., 2006; Guglielmin et al., 2014).Whereas a relatively weak correlation (r = 0.58 to 0.82)
Copyright © 2015 John Wiley & Sons, Ltd.
between air and ground temperatures was reported fromKing George Island and Signy Island (Cannone et al.,2006) in areas covered by different types of vegetation, astronger relationship (r>0.90) was described in areas ofbare ground at Rothera Point (Guglielmin et al., 2014). Thisdifference in effect may be attributed to the variable groundsurface conditions at the various study sites. The groundsurface at the site on JRI investigated in the present studyis free of vegetation, which is, by contrast, well developedon Signy Island, where a significant influence of vegetationcover on ground temperatures was found (Cannone et al.,2006). We also observed greater variability in ground tem-perature at 5 cm depth during winters with thinner snowcover, in contrast to the South Shetland Islands where asnow depth greater than 40cm had a significant effect onthe active-layer thermal regime (De Pablo et al., 2014).The minor effect of a thin snow cover on the ground ther-mal regime during the freezing season at the study site isalso indicated by the high freezing n-factor values (0.95to 0.97). Lower n-factor values (0.2 to 0.7) have beenreported from Maritime Antarctica (De Pablo et al., 2014;Almeida et al., 2014), reflecting the deeper winter snowcover at sites on Livingston Island (De Pablo et al., 2014)and King George Island (Almeida et al., 2014).
Our conclusions regarding the effect of snow cover onactive-layer conditions, however, should be treated with cau-tion, as snow cover depth and distribution are highly variableand our field data cover only a brief time period. The irregu-lar pattern of snow cover results from a combination of localclimatic conditions, wind structure and orographic effects onprecipitation (e.g. Turner et al., 2002). Moreover, Van Lipziget al. (2004) confirmed an orographic effect of the AP on thespatial distribution and irregular accumulation of snow alongthe AP coast. On the Ulu Peninsula, the relationship betweensnow drift and prevailing wind direction was reported by
Permafrost and Periglac. Process., (2015)
F. Hrbáček et al.
Zvěřina et al. (2014), suggesting a redistribution of snowdeposits in areas of low elevation in the Abernethy Flats(6km south of Mendel Station). Clearly, more work is neededregarding the snow cover distribution across JRI, using bothground-based and remote sensing observations.
CONCLUSIONS
Based on 2 years of meteorological observations and active-layer ground temperature monitoring at Mendel Station onJRI, we draw the following conclusions:
1. ALTs were observed between the end of January and themiddle of February. Thicknesses of 58 and 52 cm mea-sured in 2012 and 2013, respectively, are significantlylower than the ALT reported from low-elevation siteson the South Shetland Islands and South Orkney Islands.
2. Correlation analysis indicates a significant effect of airtemperature on the ground thermal regime. This effect isespecially apparent under snow-free conditions and dur-ing the advection of relatively warm air masses that causelarge day-to-day changes in air temperature during winter.
Copyright © 2015 John Wiley & Sons, Ltd.
3. The effect of snow cover depth on the ground thermalregime is indicated not only by the reduction in the dailyground temperature amplitude, but also by the totalfreezing n-factor values that were higher than 0.9. Theoverall influence of snow depth on ground temperatureseems therefore to be negligible regarding the highvalues of the n-factor, associated with a thin and irregu-larly distributed snow cover.
ACKNOWLEDGEMENTS
We thank the personnel at the Johann Gregor Mendel Sta-tion for their hospitality and logistical support. We are alsovery grateful to the members of the summer expeditions in2011–14 for their field assistance on JRI. The work of F.Hrbáček and K. Láska was supported by the Masaryk Uni-versity project MUNI/A/0952/2013: Analysis, evaluationand visualisation of global environmental changes in thelandscape sphere. Finally, we would like to thank two anon-ymous reviewers for their comments and suggestions whichimproved the manuscript.
REFERENCES
Almeida ICC, Schaefer CEGR, FernandesRBA, Pereira TTC, Nieuwendam A, PereiraAB. 2014. Active layer thermal regime atdifferent vegetation covers at Lion Rumps,King George Island, Maritime Antarctica.Geomorphology 225: 36–46.
Bockheim J, Vieira G, Ramos M, Lopez-Mar-tinez J, Serrano E, Guglielmin M, WilhelmK, Nieuwendam A. 2013. Climate warmingand permafrost dynamics in the AntarcticPeninsula region. Global and PlanetaryChange 100: 215–223.
Boike J, Hagedorn B, Roth K. 2008. Heat andwater transfer processes in permafrostaffected soils: A review of field-andmodeling-based studies for the Arctic andAntarctic. In Proceeding of the Ninth Inter-national Conference on Permafrost, Doug-las LK, Kenneth MH (eds). University ofAlaska: Fairbanks; Vol. 1:149–154.
Borzotta E, Trombotto D. 2004. Correlationbetween frozen ground thickness measuredin Antarctica and permafrost thickness esti-mated on the basis of the heat flow obtainedfrom magnetotelluric soundings. ColdRegion Science and Technology 40: 81–96.
Cannone N, Evans JCE, Strachan R,Guglielmin M. 2006. Interactions betweenclimate, vegetation and the active layer attwo Maritime Antarctica sites. AntarcticScience 18: 323–333.
Cook AJ, Vaughan DG. 2010. Overview of ar-eal changes of the ice shelves on the Antarctic
Peninsula over the past 50 years. TheCryosphere 4: 77–98.
De Pablo MA, Ramos M, Molina A. 2014.Thermal characterization of the active layerat the Limnopolar Lake CALM-S site onByers Peninsula (Livingston Island), Ant-arctica. Solid Earth 5: 721–739.
Domack EW, Burnett A, Leventer A. 2003. En-vironmental setting of the Antarctic Peninsula.In Antarctic Peninsula Climate Variability:Historical and Paleoenvironmental Perspec-tives, Domack E, Leventer A, Burnett A,Bindshadler R, Convey P, Kirby M (eds).American Geophysical Union: Washington,DC; Vol. 79: 1–13.
Engel Z, Láska K, Franta T, Máčka Z,Marvánek O. 2010. Recent changes of per-mafrost active layer on the James Ross Island,Maritime Antarctic. In Abstracts from theThird European Conference on Permafrost,Mertes JR, Christiansen HH, Etzelmüller B(eds). UNIS: Longyearbyen; 129.
Engel Z, Nývlt D, Láska K. 2012. Ice thickness,bed topography and glacier volume changeson James Ross Island, Antarctic Peninsula.Journal of Glaciology 58: 904–914.
Goyanes G, Vieira G, Caselli A, Cardoso M,Marmy A, Bernardo I, Hauck C. 2014. Geo-thermal anomalies, permafrost and geomor-phological dynamics (Deception Island,Antarctica). Geomorphology 225: 57–68.
Guglielmin M, Evans CJE, Cannone N. 2008.Active layer thermal regime under differentvegetation conditions in permafrost areas. Acase study at Signy Island (Maritime Ant-arctica). Geoderma 144: 73–85.
Guglielmin M, Worland MR, Cannone N. 2012.Spatial and temporal variability of ground sur-face temperature and active layer thickness atthe margin of maritime Antarctica, SignyIsland. Geomorphology 155–156: 20–33.
GuglielminM,WorlandMR, Baio F, Convey P.2014. Permafrost and snow monitoring atRothera Point (Adelaide Island, MaritimeAntarctica): Implications for rock weatheringin cryotic conditions. Geomorphology 225:47–56.
Karunaratne KC, Burn CR. 2003. Freezingn-factors in discontinuous permafrost terrain,Takhini River, Yukon Territory, Canada. InProceedings of the 8th International Confer-ence on Permafrost, Phillips M, SpringmanSM, Arenson LU (eds). University of Alaska:Fairbanks; 519–524.
King JC, Turner J, Marshall GJ, Connelly WM,Lachlan-Cope TA. 2003. Antarctic Peninsulaclimate variability and its causes as revealedby analysis of instrumental records. In Ant-arctic Peninsula Climate Variability: Histor-ical and Palaeoenvironmental Perspectives,Domack EW, Leventer A, Burnett A, Binds-chadler R, Convey P, Kirby M (eds). Ameri-can Geophysical Union: Washington DC;Vol. 79: 17–30.
Láska K, Barták M, Hájek J, Prošek P,Bohuslavová O. 2011. Climatic and ecolog-ical characteristics of deglaciated area ofJames Ross Island, Antarctica, with a spe-cial respect to vegetation cover. CzechPolar Reports 1: 49–62.
Láska K, Nývlt D, Engel Z, Budík L. 2012. Sea-sonal variation of meteorological variables
Permafrost and Periglac. Process., (2015)
Active Layer Monitoring on James Ross Island
and recent surface ablation / accumulationrates on Davies Dome and Whisky Glacier,James Ross Island, Antarctica. GeophysicalResearch Abstracts 14: EGU2012–5545.
Michel RFM, Schaefer CEGR, Poelking EL,Simas FNB, Filho EIF, Bockheim JG.2012. Active layer temperature in twoCryosols from King George Island, Mari-time Antarctica. Geomorphology 155-156:12–19.
Nývlt D, Braucher R, Engel Z, Mlčoch B, AS-TER team. 2014. Timing of the NorthernPrince Gustav Ice Stream retreat and the de-glaciation of northern James Ross Island,Antarctic Peninsula during the last glacial–interglacial transition. Quaternary Research82: 441–449.
Schaefer K, Zhang T, Brujwiler L, Barrett AP.2011. Amount and timing of permafrostcarbon release in response to climatewarming. Tellus 63: 165–180.
Stachoň Z, Russnák J, Nývlt D, Hrbáček F.2014. Stabilization of geodetic points inthe surrounding of Johann Gregor MendelStation, James Ross Island, Antarctica.Czech Polar Reports 4(1): 80–89.
Copyright © 2015 John Wiley & Sons, Ltd.
Turner J, Lachlan-Cope TA, Marshall GJ,Morris EM, Mulvaney R, Winter W. 2002.Spatial variability of Antarctic Peninsulanet surface mass balance. Journal of Geo-physical Research 107: 4173.
Turner J, Colwell SR, Marshall GJ, Lachlan-Cope TA, Carleton AM, Jones PD, LagunV, Reid PA, Iagovkina S. 2004. The SCARREADER project: towards a high-qualitydatabase of mean Antarctic meteorologicalobservations. Journal of Climate 17:2890–2898.
Van Lipzig NPM, King JC, Lachlan-Cope TA,van der Broeke MR. 2004. Precipitation,sublimation and snow drift in the AntarcticPeninsula region from a regional atmo-spheric model. Journal of Geophysical Re-search 109: D24106.
Vaughan DG. 2006. Recent trends in meltingconditions on the Antarctic Peninsula andtheir implications for ice-sheet mass bal-ance. Arctic, Antarctic, and Alpine Re-search 38: 147–152.
Vieira G, Bockheim J, Guglielmin M, BalksM, Abramov AA, Boelhouwers J, CannoneN, Ganzert L, Gilichinsky DA, GoryachkinS, López-Martínez J, Meiklejohn I, Raffi
R, Ramos M, Schaefer C, Serrano E, SimasF, Sletten R, Wagner D. 2010. ThermalState of permafrost and active-layer moni-toring in the Antarctic: advances duringthe International Polar Year 2007–09. Per-mafrost and Periglacial Processes 21:182–197. DOI: 10.1002/ppp.685.
Vieira G, Mora C, Pina P, Schaefer C. 2014. Aproxy for snow cover and winter groundsurface cooling: mapping Usnea sp commu-nities using high resolution remote sensingimagery (Maritime Antarctica). Geomor-phology 225(15): 69–75.
Warner TT. 2004. Desert Meteorology. Cam-bridge University Press: Cambridge, UK.
Zhang T, Osterkamp TE, Stamnes K. 1997.Effects of climate on the active layer andpermafrost on the North Slope of Alaska,U.S.A. Permafrost and Periglacial Pro-cesses 8: 45–67. 10.1002/(SICI)1099-1530(199701)8:<45::AID-PPP240>3.0.CO;2-K.
Zvěřina O, Láska K, Červenka R, Kuta J,Coufalík P, Komárek J. 2014. Analysis ofmercury and other heavy metals accumulatedin lichen Usnea antarctica from James RossIsland, Antarctica. Environmental Monitor-ing and Assessment 186: 9089–9100.
Permafrost and Periglac. Process., (2015)


![]History.pdf · snow falls it makes a different layer. These layers can tell us about the climate when the snow jell." Scientists like Cathy and Alex have found evidence that the](https://img.pdfslide.us/doc/110x75/5f5ce0f70d205748f926a8bc/499565historypdf-snow-falls-it-makes-a-different-layer-these-layers-can-tell.jpg)