Embed Size (px)
Citation preview

Effect of Silver Ion-Exchange on the Precipitation ofLead Sulfide Quantum Dots in Glasses
Kai Xu and Jong Heo†
Division of Advanced Nuclear Engineering, Department of Materials Science and Engineering,Pohang University of Science and Technology (POSTECH), Pohang, Gyeongbuk 790-784, Korea
This article reports the effect of Ag+ion-exchange on the precip-
itation of PbS quantum dots (QDs) in silicate glasses. The
glasses were subjected to ion-exchange in AgNO3 salt melts at
260°C for 60 s. Ag nanoparticles (NPs) and PbS QDs precipi-
tated after heat treatment at temperatures of 440°C–460°C for10 h. Photoluminescence wavelength kPL of PbS QDs was
longer (~1525 ≤ kPL ≤ ~1580 nm) in Ag+ ion-exchanged
regions than in Ag+-free regions (~1030 ≤ kPL ≤ ~1200 nm).
Average diameter D of PbS QDs estimated by calculation andTEM images was larger in Ag+ ion-exchanged regions (~5.2 ≤D ≤ ~5.5 nm) than in Ag+-free regions (~2.4 ≤ D ≤ ~3.3 nm).
Ag NPs that formed during heat treatment provided the sites for
heterogeneous nucleation of PbS QDs and promoted the precipi-tation of PbS QDs in glasses.
I. Introduction
NARROW band gap semiconductor quantum dots (QDs)embedded in oxide glasses can provide size-tunable
optical properties in near-infrared spectra and have potentialapplications in solid-state saturable absorbers and fiber-opticamplifiers.1–3 Early attempts to fabricate monodisperse QDsin silicate or phosphate glasses used heating at elevated tem-peratures.4,5 Ion implantation and femto-second lasers werealso used to control the spatial distribution of QDs in glassmatrices.6,7 Ion implantation can precipitate PbS QDs withinseveral hundred nanometers from the surface of glasses, andfemto-second laser irradiation can partially control the spa-tial distribution of QDs inside the glasses. But these externalirradiations produced an inhomogeneous size distributionand damaged the glasses. Therefore, a different method tocontrol the distribution of QDs in glass matrix is necessary.
Noble metal nanoparticles (NPs) such as Ag, Au or Pdhave been used as seed particles to control the shape and sizeof PbS (or PbSe) nanocrystals in solutions. They are inten-tionally added to provide a low-energy interface for heteroge-neous nucleation of nanocrystals.8,9 Ag or Au NPs are alsowell-known catalysts or nucleating agents for the crystalliza-tion of glasses.10 Our group has reported the precipitation ofPbS QDs in silicate glasses containing Ag NPs as nucleatingagents.11 The number densities of PbS QDs vary dependingon the concentrations of Ag+ ions in glasses and this differ-ence causes the glasses to have different absorption and pho-toluminescence (PL) intensities. However, solubility of Ag+
ions in precursor glasses is limited to < ~40 ppm, and this
low solubility makes the control of PbS QDs precipitationdifficult.
An alternative approach is to use the Ag+ ion-exchangemethod, which is used to fabricate optical waveguides inoxide glasses.12 This method can allow control of the spatialdistribution of Ag+ ions, and enable incorporation of largernumbers of them in glasses than can be achieved by othermethods. This article reports the precipitation of PbS QDs insilicate glasses using ion-exchanged Ag NPs, and the influ-ence of Ag NPs on the growth and optical properties of PbSQDs. Ag+ ions were incorporated by immersing the glassesinto molten AgNO3 salt at 260°C. Then Ag NPs and PbSQDs were precipitated using the sequential thermal treat-ment. The sizes of PbS QDs were larger in Ag+ ion-exchanged regions than in non-ion-exchanged regions.
II. Experimental Procedures
Glasses with a nominal composition (mol%) of 50SiO2–35Na2O–5Al2O3–8ZnO–2ZnS–0.9PbO were prepared using aconventional melt-quenching method. Starting powders wereweighed and ground in ethanol using a ball mill with ZrO2
balls. The mixtures were heated in an oven to remove etha-nol and moisture, and then melted in an alumina crucible at~1350°C for 40 min in an electric furnace. The melts werepoured onto a pre-heated brass mold and pressed to a thick-ness of ~1.5 mm using an iron plate. The glass was annealedat 350°C for 3 h to release the thermal stress, then cut intopieces of ~1.0 9 1.0 cm. The pieces were polished to thick-ness of ~1.0 mm and dipped into AgNO3 salt melts at 260°Cfor 60 s for the ion-exchange. Afterward, specimens were fur-ther heat-treated for 10 h at temperatures between 440°Cand 460°C to induce formation of Ag NPs and PbS QDs.
The Ag+ ion penetration depth was analyzed using energydispersive X-ray spectroscopy (EDX) after polishing a cross-section of the glass. Formation of QDs was confirmed using atransmission electron microscope (TEM) (JEM-2100F; JEOL,Tokyo, Japan) under an accelerating voltage of 200 kV. Spec-imens for the TEM measurement were prepared using thefocused ion beam milling. Ga+ ions were used to mill the thinsample under the accelerating voltage of 30 kV with smallincident angles (<2°). To reduce electrostatic charging and thedamage of the specimen during TEM investigation, specimenswere selectively coated with carbon.13 The artifacts caused byelectron illuminations can be avoided by limiting electronexposure to less than 10 min during the measurement.
The Ag states in glasses were identified using X-ray photo-electron spectroscopy (XPS) (Escalab 220i-XL, ThermalVG Scientific, East Grinstead, UK) using Mg-Ka (hυ =1253.6 eV) radiation. Optical absorption spectra of theglasses were recorded at wavelengths of 300–2500 nm using aUV/Vis/NIR spectrophotometer (Lambda 750S; PerkinElmer, Shelton, CT). PL spectra were recorded at room tem-perature using an 800-nm excitation beam from the continu-ous-wave Ti-sapphire laser (890 Tunable Laser; CoherentInc., Santa Clara, CA). Signals were collected and amplified
B. Dunn—contributing editor
Manuscript No. 31089. Received February 17, 2012; approved May 07, 2012.This work was supported by Basic Science Research (2010-0022407), Priority
Research Centers (2011-0031405) and World Class University (WCU) (R31-30005)Programs through the National Research Foundation of Korea (NRF) funded by theMinistry of Education, Science and Technology.
†Author to whom correspondence should be addressed. e-mail: [email protected]
1
J. Am. Ceram. Soc., 1–5 (2012)
DOI: 10.1111/j.1551-2916.2012.05313.x
© 2012 The American Ceramic Society
Journal

using a combination of a mechanical chopper of 50-Hz fre-quency, a 1/4 m monochromator (77200; Oriel, Rochester,NY), an InSb detector (J10D-M204-R01M-60-SP28; Tele-dyne Judson Technologies, Montgomeryville, PA) and alock-in amplifier system. Standard deviation (SD) during theestimation of PbS QDs sizes was ~15%. PL and absorptionmeasurement standard deviations were less than 1.5% includ-ing instrumental and experimental variances.
III. Results
Penetration of Ag+ ions into the glass from the AgNO3 meltwas analyzed using EDX. Ag+ ions replaced Na+ ions asexpected and the concentration of Ag+ ions increased at theexpense of Na+ ions. Penetration depth of Ag+ ions was~8 lm [Fig. 1(a)] for the ion-exchanged glass and after heat-treating at 460°C for 10 h, Ag+ ions diffused deeper into theglass (~20 lm) [Fig. 1(b)].
The glass surface affected by Ag+ ion-exchange turnedblack after heat treatment whereas the unaffected region inthe center turned light gray. High-resolution TEM micro-graphs (Fig. 2) were obtained from the black-colored regionwithin ~20 lm depth from the glass surface. The crystalplane distance of ~1.7 A matched with interplanar spacingbetween two (222) planes in PbS and it indicates thatnanocrystals formed in Ag+ ion-exchanged regions are thoseof PbS. They were near-spherical shape (Fig. 3) with an aver-age diameter of ~5.0 (SD = 0.8) nm and dispersion of ~16%[Fig. 3(a)]. A TEM image was also obtained from the as-pre-pared glass after heat treatment at 460°C for 10 h [Fig. 3(b)],as a reference. The average estimated diameter of PbS QDswas ~3.2 (SD = 0.5) nm, and they were visibly smaller thanthose formed in ion-exchanged glass.
Figure 4 compares the optical absorption spectra of ion-exchanged and as-prepared glasses after heat treatment at460°C for 10 h. The as-prepared glass showed a typical PbS
QDs absorption peak at ~1010 nm. The ion-exchanged glassshowed a large increase in the absorbance with a bandappeared only as a shoulder at ~1050 nm.
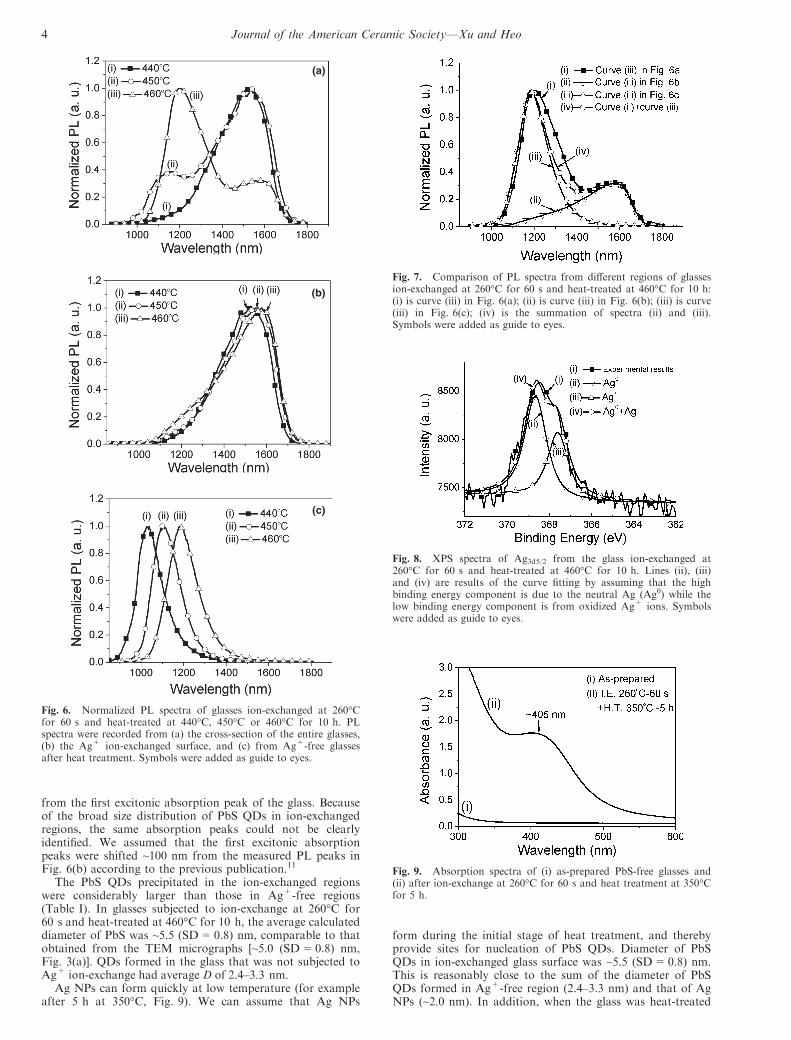
The PL spectra were recorded as illustrated in Fig. 5 toinvestigate the effect of the ion-exchange on the emission ofPbS QDs. First, PL spectra were recorded by exciting theentire cross-sectional region of the glasses that include bothAg+ ion-exchanged and Ag+-free regions [Fig. 5(a)]. Glassesheat-treated at 440°C showed one PL peak, but glasses heat-treated at 450°C and 460°C showed two PL peaks, one ofwhich had the similar wavelength as observed in the glass trea-ted at 440°C [Fig. 6(a)]. PL spectra were also recorded usingthe reflection mode by exciting the glass surface [Fig. 5(b)].Only one PL band was observed, regardless of the heat-treat-ment temperature, and the peak red-shifted from ~1525 to~1580 nm as heat-treatment temperature increased [Fig. 6(b)].On the other hand, PL spectra of Ag+-free glasses heat-treatedat 440°C–460°C showed only one PL band, and it also red-shifted, in this case from ~1030 to ~1200 nm as heat-treatmenttemperatures increased [Fig. 6(c)]. It is interesting to observethat the location of the PL bands at shorter wavelength inFig. 6(a) matched those of Ag+-free glasses [Fig. 6(c)],whereas the longer wavelength ones have similar wavelengthto those in Ag+ ion-exchanged regions [Fig. 6(b)].
IV. Discussion
Curves were fit to the PL spectra recorded from several dif-ferent glasses (Fig. 7). The PL spectrum (i) in Fig. 7 wasrecorded from the entire cross-section of the glass after ion-exchange and heat treatment at 460°C for 10 h. It is the sim-ple reproduction of the curve (iii) in Fig. 6(a). Spectrum (ii)is a copy of the curve (iii) in Fig. 6(b), while spectrum (iii) isa copy of the curve (iii) in Fig. 6(c). Spectrum (iv) is thesummation of spectra (ii) and (iii), and its shape, very muchsimilar to the spectrum (i) recorded from the cross-sectionrepresenting both regions. Therefore, the peak at short wave-length can be plausibly assigned to PL from Ag+-free region,and the peak at long wavelength to PL from the ion-exchanged glass surface.
During the ion-exchange process, Na+ ions in the parentglasses are substituted by Ag+ ions, as shown from thechanges in the concentrations of Na+ and Ag+ ions
(a)
(b)
Fig. 1. (a) Ag+ and Na+ ion concentrations in the glass after ion-exchange at 260°C for 60 s and (b) then heat treatment at 460°C for10 h.
Fig. 2. (a) High-resolution TEM micrograph of PbS QDs in theion-exchanged region after immersion in AgNO3 melts at 260°C for60 s and heat treatment at 460°C for 10 h.
2 Journal of the American Ceramic Society—Xu and Heo

[Fig. 1(a)]. During the subsequent heat treatment, Ag+ ionswere reduced to Ag0 by capturing electrons from non-bridg-ing oxygen ions or from impurities, then aggregated to formAg colloids or NPs.14,15 The chemical states of Ag in theglasses were identified using the Ag3d5/2 peak of the XPSspectra from the glass after ion-exchange (260°C for 60 s)and heat treatment (460°C for 10 h) (Fig. 8). The XPSAg3d5/2 spectrum was separated into two peaks using Gauss-ian curve fitting procedures. Results clearly showed that theneutral Ag (Ag0) formed in glasses after heat treatment.
Ag NPs formed in silicate glasses normally showed anabsorption band centered at 400–430 nm associated with thesurface plasmon resonance.15,16 However, this peak is nor-mally buried under the absorption bands of PbS QDs in ourglasses. Therefore, a PbO-free glass with a composition of50SiO2–35Na2O–5Al2O3–8ZnO–2ZnS (mol%) was prepared.The absorption band appeared at ~405 nm when the glasswas ion-exchanged at 260°C for 60 s and heat-treated at350°C for 5 h (Fig. 9). This absorption band clearly indicates
that Ag NPs formed in this glass. The average radius R (nm)of the Ag NPs can be estimated using the relationship16:
R ¼ Vfk2P
pCDk(1)
where, Vf is the Fermi velocity of the electron in bulk metal(1.39 9 106 m/s for Ag), kP is the wavelength at which sur-face plasmon resonance occurs (~405 nm), C is the speed oflight in vacuum (3.0 × 10⁸ m/s) and Dk is the full width athalf maximum intensity of the absorption (~120 nm). Thecalculated R was ~1.0 nm. Therefore, we can speculate thatAg NPs with diameter of ~2.0 nm also formed in glasses con-taining PbS QDs after the heat treatment. Unfortunately, AgNPs could not be identified in TEM images in the currentstudy, probably due to their small size and low concentra-tion. One cannot exclude the influence of Ag2S or Ag2O onthe absorption in the visible range (Fig. 4),17,18 and in fact,the Ag3d5/2 peak in the XPS spectra (Fig. 8) shows the pres-ence of Ag+ in glasses. Therefore, the possibility of Ag2S orAg2O formation in glasses cannot be ruled out.
The diameter D (nm) of PbS QDs can be calculated fromtheir first excitonic absorption peak using the followingequation19:
E0 ¼ 0:41þ 1
0:0252D2 þ 0:283D(2)
where, E0 is the effective band gap energy (eV) calculatedfrom the first excitonic absorption peak. Diameters of PbSQDs in the Ag+-free portion of the glass were calculated
(a)
(b)
Fig. 3. TEM images of PbS QDs in (a) glasses ion-exchanged at260°C for 60 s and (b) Ag+-free glasses. Both glasses were heat-treated at 460°C for 10 h. Inserts: the size distributions of PbS QDs.
Fig. 4. Absorption spectra of glasses (i) as-prepared and (ii) ion-exchanged in AgNO3 melts for 60 s at 260°C. Both specimens wereheat-treated at 460°C for 10 h to precipitate PbS QDs after thepreparation or ion-exchange.
(a) (b)
Fig. 5. Schematic drawings to illustrate the area of thephotoluminescence measurement from (a) the cross-section of theentire glasses and (b) the Ag+ ion-exchanged surface.
Ag Ion-Exchange on PbS QDs 3
from the first excitonic absorption peak of the glass. Becauseof the broad size distribution of PbS QDs in ion-exchangedregions, the same absorption peaks could not be clearlyidentified. We assumed that the first excitonic absorptionpeaks were shifted ~100 nm from the measured PL peaks inFig. 6(b) according to the previous publication.11
The PbS QDs precipitated in the ion-exchanged regionswere considerably larger than those in Ag+-free regions(Table I). In glasses subjected to ion-exchange at 260°C for60 s and heat-treated at 460°C for 10 h, the average calculateddiameter of PbS was ~5.5 (SD = 0.8) nm, comparable to thatobtained from the TEM micrographs [~5.0 (SD = 0.8) nm,Fig. 3(a)]. QDs formed in the glass that was not subjected toAg+ ion-exchange had average D of 2.4–3.3 nm.
Ag NPs can form quickly at low temperature (for exampleafter 5 h at 350°C, Fig. 9). We can assume that Ag NPs
form during the initial stage of heat treatment, and therebyprovide sites for nucleation of PbS QDs. Diameter of PbSQDs in ion-exchanged glass surface was ~5.5 (SD = 0.8) nm.This is reasonably close to the sum of the diameter of PbSQDs formed in Ag+-free region (2.4–3.3 nm) and that of AgNPs (~2.0 nm). In addition, when the glass was heat-treated
(a)
(b)
(c)
Fig. 6. Normalized PL spectra of glasses ion-exchanged at 260°Cfor 60 s and heat-treated at 440°C, 450°C or 460°C for 10 h. PLspectra were recorded from (a) the cross-section of the entire glasses,(b) the Ag+ ion-exchanged surface, and (c) from Ag+-free glassesafter heat treatment. Symbols were added as guide to eyes.
Fig. 7. Comparison of PL spectra from different regions of glassesion-exchanged at 260°C for 60 s and heat-treated at 460°C for 10 h:(i) is curve (iii) in Fig. 6(a); (ii) is curve (iii) in Fig. 6(b); (iii) is curve(iii) in Fig. 6(c); (iv) is the summation of spectra (ii) and (iii).Symbols were added as guide to eyes.
Fig. 8. XPS spectra of Ag3d5/2 from the glass ion-exchanged at260°C for 60 s and heat-treated at 460°C for 10 h. Lines (ii), (iii)and (iv) are results of the curve fitting by assuming that the highbinding energy component is due to the neutral Ag (Ag0) while thelow binding energy component is from oxidized Ag+ ions. Symbolswere added as guide to eyes.
Fig. 9. Absorption spectra of (i) as-prepared PbS-free glasses and(ii) after ion-exchange at 260°C for 60 s and heat treatment at 350°Cfor 5 h.
4 Journal of the American Ceramic Society—Xu and Heo

at the low temperature (440°C), PL peaks appeared only atlong wavelengths [Fig. 6(a)] and PbS QDs were mostlyformed in the ion-exchanged region. This suggests that thepresence of Ag NPs promoted the formation of PbS QDsand further supports our hypothesis that Ag NPs formnucleation sites.
V. Conclusions
Ag+ ion-exchange followed by thermal treatment were usedto precipitate PbS QDs in silicate glasses and the effect ofAg+ on the precipitation and optical properties of PbS QDswas investigated. Ag+ ions were diffused up to ~20 lm intothe glass. The peak wavelengths of PL bands recorded fromAg+ ion-exchanged regions were 1525–1580 nm while thosefrom the Ag+-free regions were 1030–1200 nm. Analysis ofTEM images showed the average diameter of PbS QDs was~5.0 (SD = 0.8) nm in the Ag+-exchanged regions, and 3.2(SD = 0.5) nm in Ag+-free regions. XPS Ag3d5/2 spectraand absorption spectra of the PbS-free glass clearly showedthat Ag NPs precipitated after heat treatment. We hypothe-size that these Ag NPs provided sites for heterogeneousformation of PbS QDs and thus resulted in the larger PbSQDs in the Ag+-implanted glasses than in the Ag+-freeglasses.
References
1L. Bakueva, I. Gorelikov, S. Musikhin, X. S. Zhao, E. H. Sargent, and E.Kumacheva, “PbS Quantum Dots with Stable Efficient Luminescence in theNear-IR Spectra Range,” Adv. Mater., 16, 926–9 (2004).
2A. M. Malyarevich, K. V. Yumashev, and A. A. Lipovskii, “Semiconduc-tor-Doped Glass Saturable Absorbers for Near-Infrared Solid State Lasers,”J. Appl. Phys., 103, 081301–25 (2008).
3J. Heo and C. Liu, “PbS Quantum-Dots in Glass Matrix for UniversialFiber-Optic Amplifier,” J. Mater. Sci. - Mater. Electron., 18, S135–9 (2007).
4N. F. Borrelli and D. W. Smith, “Quantum Confinement of PbS Micro-crystals in Glass,” J. Non-Cryst. Solids, 180, 25–31 (1994).
5A. A. Lipovskii, E. V. Kolobkva, A. Olkhovets, V. D. Petrikov, andF. Wise, “Synthesis of Monodisperse PbS Quantum Dots in Phosphate Glass,”Physica E, 5, 157–60 (2000).
6R. E. Lamaestre and H. Bernas, “Ion Beam-Induced Quantum Dots Syn-thesis in Glass,” Nucl. Instrum. Methods Phys. Res., Sect. A, 257, 1–5 (2007).
7C. Liu, Y. K. Kwon, J. Heo, B. H. Kim, and I. Sohn, “Controlled Precipi-tation of Lead Sulfide Quantum Dots in Glasses Using the Femtosecond LaserPulses,” J. Am. Ceram. Soc., 93, 1221–4 (2010).
8K. T. Yong, Y. Sahoo, K. R. Choudhury, M. T. Swihart, J. R. Minter,and P. N. Prasad, “Shape control of PbSe Nanocrystals Using Noble MetalSeed Particles,” Nano Lett., 6, 709–14 (2006).
9K. T. Yong, Y. Sahoo, K. R. Choudhury, M. T. Swihart, J. R. Minter,and P. N. Prasad, “Control of the Morphology and Size of PbS NanowiresUsing Gold Nanoparticles,” Chem. Mater., 18, 5965–72 (2006).
10S. D. Stookey, “Catalyzed Crystallization of Glass in Theory and Prac-tice,” Ind. Eng. Chem., 51, 805–8 (1959).
11K. Xu, C. Liu, S. Dai, X. Shen, X. Wang, and J. Heo, “Influence of SilverNanoclusters on Formation of PbS Quantum Dots in Glasses,” J. Non-Cryst.Solids, 357, 2428–30 (2011).
12S. I. Najafi, Introduction to Glass Integrated Optics. Artech House Inc.,Norwood, MA, 1992.
13T. Hoche, J. W. Gerlach, and T. Petsch, “Static-Charging Mitigationand Contamination Avoidance by Selective Carbon Coating of TEMSamples,” Ultramicroscopy, 106, 981–5 (2006).
14P. W. Wang, “Formation of Silver Colloids in Silver Ion-Exchanged Soda-Lime Glasses during Annealing,” Appl. Surf. Sci., 120, 291–8 (1997).
15J. Zhang, W. Dong, J. Sheng, J. Zheng, J. Li, L. Qiao, and L. Jiang, “Sil-ver Nanoclusters Formation in Ion-Exchanged Glasses by Thermal Annealing,UV-Laser and X-Ray Irradiation,” J. Cryst. Growth, 310, 234–9 (2008).
16D. Manikandan, S. Mohan, and K. G. M. Nair, “Absorption and Lumi-nescence of Silver Nanocomposite Soda-Lime Glass Formed by Ag-Na IonExchange,” Mater. Res. Bull., 38, 1545–50 (2003).
17G. Hota, S. Jain, and K. C. Khilar, “Synthesis of CdS-Ag2S Core-Shell/Composite Nanoparticles Using AOT/n-Heptane/Water Microemulsions,” Col-loids Surf., A: Physicochem. Eng. Aspects, 232, 119–27 (2004).
18L. M. Lyu, W. C. Wang, and M. H. Huang, “Synthesis of Ag2O Nano-crystals with Systematic Shape Evolution from Cubic to Hexapod Structuresand Their Surface Properties,” Chem. Eur. J., 16, 14167–74 (2010).
19I. Moreals, K. Lambert, D. Smeets, D. D. Muynck, T. Nollet, J. C.Martins, F. Vanhaecke, A. Vantomme, C. Delerue, G. Allan, and Z. Hens,“Size-Dependent Optical Properties of Colloidal PbS Quantum Dots,” ACSNano, 3, 3023–30 (2009). h
Table I. Peak Positions of Absorption (kAbs.) and PL (kPL)With the Calculated Average Diameters (D) of PbS QDs in
Ion-Exchanged Glasses. Glasses were Subjected to Ion-
Exchange at 260°C for 60 s and Then Heat-Treated at440 � T � 460°C for 10 h
Thermal Treatment
T (°C)
Ag-Free Portion
Ion-Exchanged Glass
Surface
kAbs.†
(nm)
kPL(nm)
D‡
(nm)
kAbs.§
(nm)
kPL(nm)
D‡
(nm)
440 765 1030 2.4 1425 1525 5.2450 865 1110 2.8 1450 1550 5.4460 1010 1200 3.3 1480 1580 5.5
†From as-prepared samples without ion-exchange.‡Standard deviation (SD) ~15%.§Assuming Stokes shifts ~100 nm.
Ag Ion-Exchange on PbS QDs 5


![Microsensor Measurements ofSulfate Reduction and Sulfide ...Jorgensen1992b.pdf · constants, respectively, of the sulfide equilibrium system, [S2-] is the sulfide concentration, and](https://img.pdfslide.us/doc/110x75/5e9a6d84dc840a57bc1baa83/microsensor-measurements-ofsulfate-reduction-and-sulfide-amp-constants.jpg)