Embed Size (px)
Citation preview
Columbia International Publishing Journal of Luminescence and Application (2014) Vol. 1 No. 2 pp. 61-72 doi:10.7726/jla.2014.1006
Research Article
______________________________________________________________________________________________________________________________ *Corresponding e-mail: [email protected], PH:+91-9827850113 1* Department of Applied Physics, Bhilai Institute of Technology (Seth Balkrishan Memorial), Near Bhilai
House, Durg (C.G.) Pin-491001, India
2 Director & Professor, Bhilai Institute of Technology (Seth Balkrishan Memorial), Near Bhilai House, Durg (C.G.) Pin-491001, India
3 Department of Electronics & Telecommunication, Bhilai Institute of Technology (Seth Balkrishan Memorial), Near Bhilai House, Durg (C.G.) Pin-491001, India
4 Department of Applied Physics, Bhilai Institute of Technology (Seth Balkrishan Memorial), Near Bhilai House, Durg (C.G.) Pin-491001, India
61
Effect of Silver Concentration on Thermoluminescence Studies of (Cd0.95Zn.05)S Phosphors with Trap Depth
Parameters Synthesized by Solid State Reaction Method
Raunak kumar Tamrakar1*, M. K. Kowar2, Kunal Uplop3, and C. S. Robinson4 Received 12 July 2014; Published online 6 September 2014 © The author(s) 2014. Published with open access at www.uscip.us
Abstract The present paper reports the synthesis and characterization of Ag+ doped (Cd0.95Zn.05)S phosphors. The effect of variable concentration of silver on thermoluminescence (TL) studies was investigated. The samples were prepared by solid state synthesis technique which is suitable for large scale production for phosphors. The starting materials used for sample preparation were CdS, ZnS, (Ag(NO3)3 and sodium chloride was used as a flux during synthesis. The prepared sample was characterized by X-ray diffraction technique (XRD). Sample shows hexagonal structure and the particle size calculated by Scherer’s formula. The prepared phosphors were also examined by thermoluminescence technique. For recording TL glow curve every time 2mg phosphor was irradiated by 254nm UV source and fixed the heating rate at 80C s-1. Sample shows well-resolved peak at 1020C for different concentration of Ag+. In addition, the effect of Ag+ concentration at fixed UV exposure time was studied. The effect of UV exposure time and dose versus intensity plot were studied. Sample shows linear response with dose and broaden peak with lower temperature shows the less stability and more fading in TL glow curve. Trapping parameters were calculated for every recorded glow curve. The heating rate effect on TL glow curve was also studied. The sample shows the shifting of TL glow curve towards to lower temperature side with increasing of heating rate. The kinetic parameters like trap depth, frequency factor were calculated by using the Peak shape method, which are discussed in details. The TL Glow curves were fitted in CGCD (computerized glow curve convolution deconvolution) technique & trapping parameters calculated. Keywords: (Cd0.95Zn.05)S phosphors; XRD; TEM; TL; Deconvolution
Raunak kumar Tamraka, M. K. Kowar, Kunal Uplop and C. S. Robinson / Journal of Luminescence and Application (2014) Vol. 1 No. 2 pp. 61-72
62
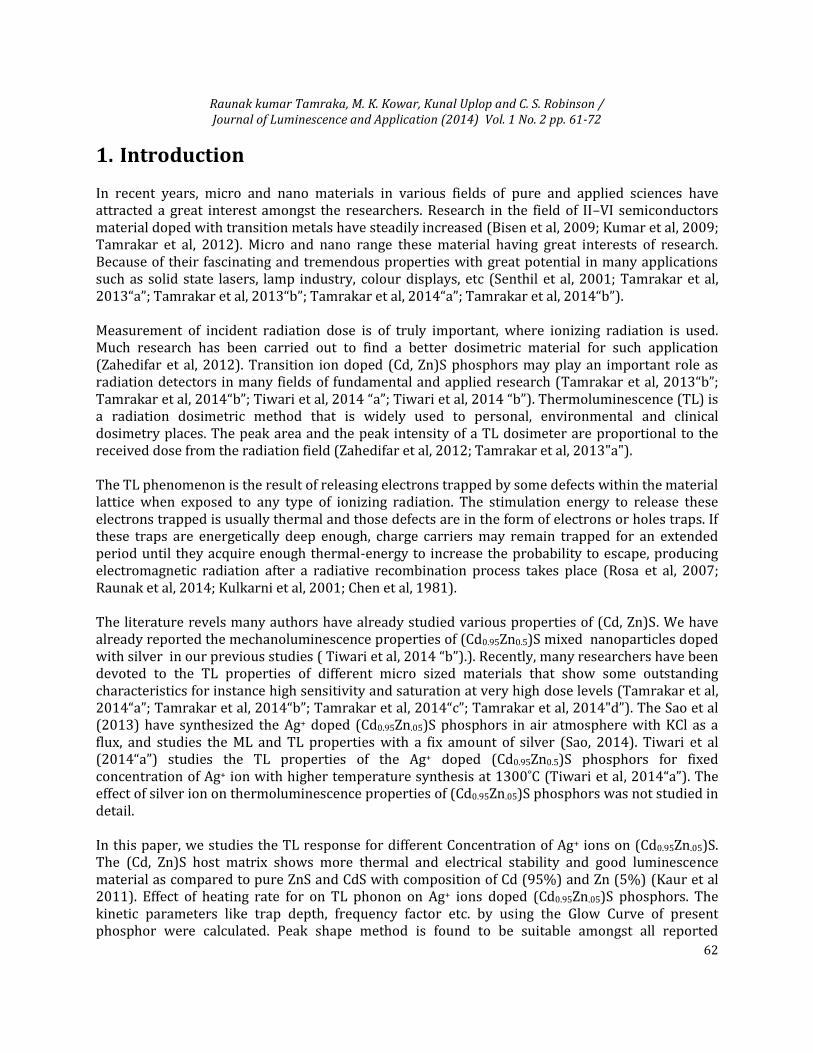
1. Introduction In recent years, micro and nano materials in various fields of pure and applied sciences have attracted a great interest amongst the researchers. Research in the field of II–VI semiconductors material doped with transition metals have steadily increased (Bisen et al, 2009; Kumar et al, 2009; Tamrakar et al, 2012). Micro and nano range these material having great interests of research. Because of their fascinating and tremendous properties with great potential in many applications such as solid state lasers, lamp industry, colour displays, etc (Senthil et al, 2001; Tamrakar et al, 2013“a”; Tamrakar et al, 2013“b”; Tamrakar et al, 2014“a”; Tamrakar et al, 2014“b”). Measurement of incident radiation dose is of truly important, where ionizing radiation is used. Much research has been carried out to find a better dosimetric material for such application (Zahedifar et al, 2012). Transition ion doped (Cd, Zn)S phosphors may play an important role as radiation detectors in many fields of fundamental and applied research (Tamrakar et al, 2013“b”; Tamrakar et al, 2014“b”; Tiwari et al, 2014 “a”; Tiwari et al, 2014 “b”). Thermoluminescence (TL) is a radiation dosimetric method that is widely used to personal, environmental and clinical dosimetry places. The peak area and the peak intensity of a TL dosimeter are proportional to the received dose from the radiation field (Zahedifar et al, 2012; Tamrakar et al, 2013"a"). The TL phenomenon is the result of releasing electrons trapped by some defects within the material lattice when exposed to any type of ionizing radiation. The stimulation energy to release these electrons trapped is usually thermal and those defects are in the form of electrons or holes traps. If these traps are energetically deep enough, charge carriers may remain trapped for an extended period until they acquire enough thermal-energy to increase the probability to escape, producing electromagnetic radiation after a radiative recombination process takes place (Rosa et al, 2007; Raunak et al, 2014; Kulkarni et al, 2001; Chen et al, 1981). The literature revels many authors have already studied various properties of (Cd, Zn)S. We have already reported the mechanoluminescence properties of (Cd0.95Zn0.5)S mixed nanoparticles doped with silver in our previous studies ( Tiwari et al, 2014 “b”).). Recently, many researchers have been devoted to the TL properties of different micro sized materials that show some outstanding characteristics for instance high sensitivity and saturation at very high dose levels (Tamrakar et al, 2014“a”; Tamrakar et al, 2014“b”; Tamrakar et al, 2014“c”; Tamrakar et al, 2014"d”). The Sao et al (2013) have synthesized the Ag+ doped (Cd0.95Zn.05)S phosphors in air atmosphere with KCl as a flux, and studies the ML and TL properties with a fix amount of silver (Sao, 2014). Tiwari et al (2014“a”) studies the TL properties of the Ag+ doped (Cd0.95Zn0.5)S phosphors for fixed concentration of Ag+ ion with higher temperature synthesis at 1300˚C (Tiwari et al, 2014“a”). The effect of silver ion on thermoluminescence properties of (Cd0.95Zn.05)S phosphors was not studied in detail. In this paper, we studies the TL response for different Concentration of Ag+ ions on (Cd0.95Zn.05)S. The (Cd, Zn)S host matrix shows more thermal and electrical stability and good luminescence material as compared to pure ZnS and CdS with composition of Cd (95%) and Zn (5%) (Kaur et al 2011). Effect of heating rate for on TL phonon on Ag+ ions doped (Cd0.95Zn.05)S phosphors. The kinetic parameters like trap depth, frequency factor etc. by using the Glow Curve of present phosphor were calculated. Peak shape method is found to be suitable amongst all reported
Raunak kumar Tamraka, M. K. Kowar, Kunal Uplop and C. S. Robinson / Journal of Luminescence and Application (2014) Vol. 1 No. 2 pp. 61-72
63
methods. This method provides the nearest possible values of all studied kinetic parameters that are discussed in details. The variable concentration of Ag+ ion on TL glow curve have been fitted by applying computerized glow curve convolution deconvolution(CGCD) and kinetic parameters were calculated(Tamrakar et al, 2014“b”).
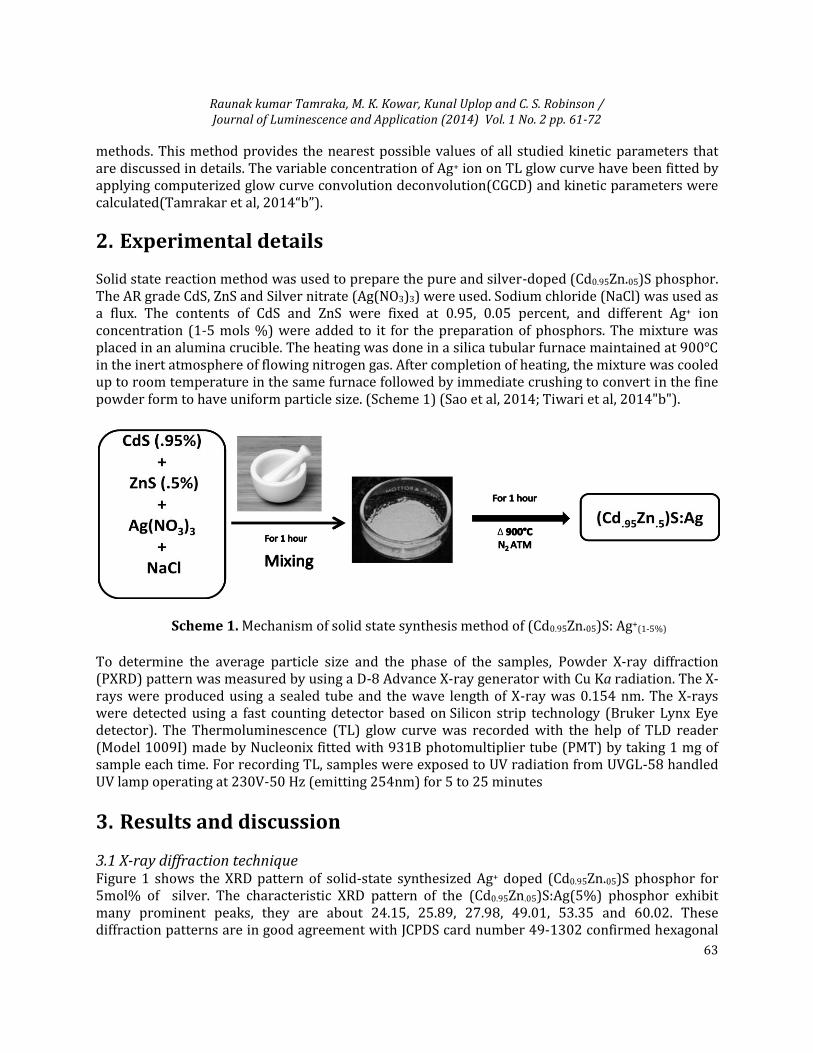
2. Experimental details Solid state reaction method was used to prepare the pure and silver-doped (Cd0.95Zn.05)S phosphor. The AR grade CdS, ZnS and Silver nitrate (Ag(NO3)3) were used. Sodium chloride (NaCl) was used as a flux. The contents of CdS and ZnS were fixed at 0.95, 0.05 percent, and different Ag+ ion concentration (1-5 mols %) were added to it for the preparation of phosphors. The mixture was placed in an alumina crucible. The heating was done in a silica tubular furnace maintained at 900°C in the inert atmosphere of flowing nitrogen gas. After completion of heating, the mixture was cooled up to room temperature in the same furnace followed by immediate crushing to convert in the fine powder form to have uniform particle size. (Scheme 1) (Sao et al, 2014; Tiwari et al, 2014"b").
Scheme 1. Mechanism of solid state synthesis method of (Cd0.95Zn.05)S: Ag+(1-5%)
To determine the average particle size and the phase of the samples, Powder X-ray diffraction (PXRD) pattern was measured by using a D-8 Advance X-ray generator with Cu Ka radiation. The X-rays were produced using a sealed tube and the wave length of X-ray was 0.154 nm. The X-rays were detected using a fast counting detector based on Silicon strip technology (Bruker Lynx Eye detector). The Thermoluminescence (TL) glow curve was recorded with the help of TLD reader (Model 1009I) made by Nucleonix fitted with 931B photomultiplier tube (PMT) by taking 1 mg of sample each time. For recording TL, samples were exposed to UV radiation from UVGL-58 handled UV lamp operating at 230V-50 Hz (emitting 254nm) for 5 to 25 minutes
3. Results and discussion
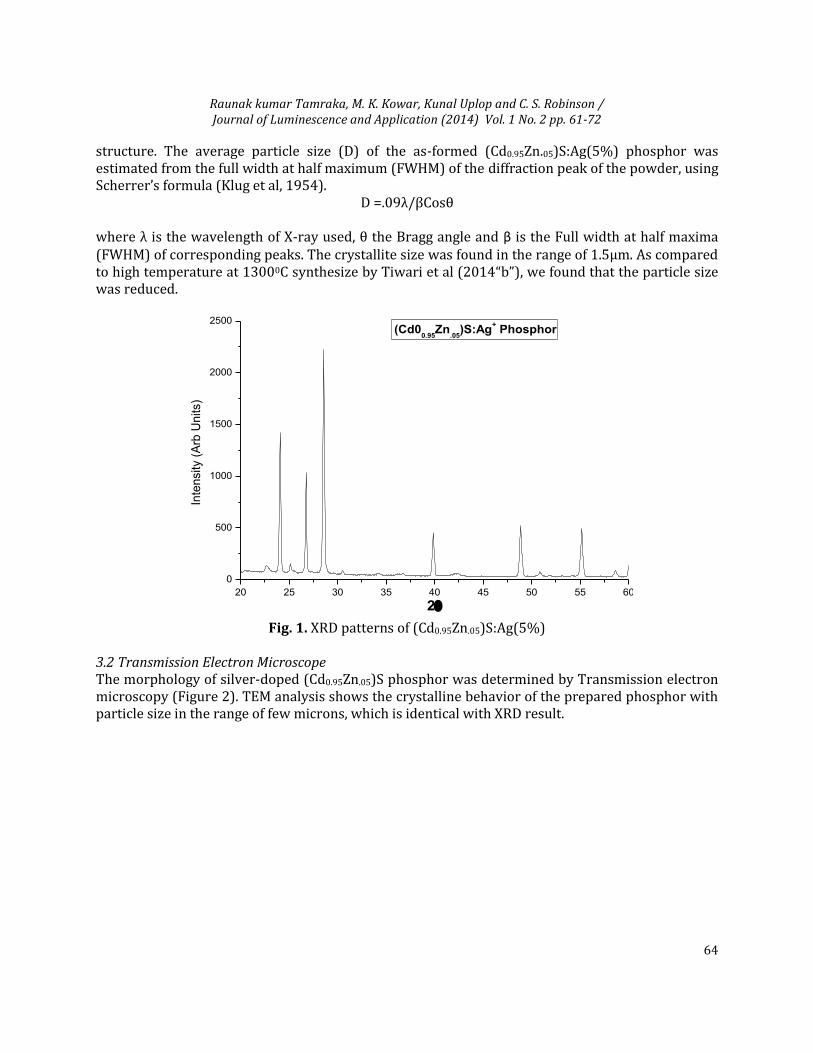
3.1 X-ray diffraction technique Figure 1 shows the XRD pattern of solid-state synthesized Ag+ doped (Cd0.95Zn.05)S phosphor for 5mol% of silver. The characteristic XRD pattern of the (Cd0.95Zn.05)S:Ag(5%) phosphor exhibit many prominent peaks, they are about 24.15, 25.89, 27.98, 49.01, 53.35 and 60.02. These diffraction patterns are in good agreement with JCPDS card number 49-1302 confirmed hexagonal
Raunak kumar Tamraka, M. K. Kowar, Kunal Uplop and C. S. Robinson / Journal of Luminescence and Application (2014) Vol. 1 No. 2 pp. 61-72
64
structure. The average particle size (D) of the as-formed (Cd0.95Zn.05)S:Ag(5%) phosphor was estimated from the full width at half maximum (FWHM) of the diffraction peak of the powder, using Scherrer’s formula (Klug et al, 1954).
D =.09λ/βCosθ where λ is the wavelength of X-ray used, θ the Bragg angle and β is the Full width at half maxima (FWHM) of corresponding peaks. The crystallite size was found in the range of 1.5µm. As compared to high temperature at 13000C synthesize by Tiwari et al (2014“b”), we found that the particle size was reduced.
20 25 30 35 40 45 50 55 60
0
500
1000
1500
2000
2500
Inte
nsity (
Arb
Un
its)
2
(Cd00.95
Zn.05
)S:Ag+ Phosphor
Fig. 1. XRD patterns of (Cd0.95Zn.05)S:Ag(5%)
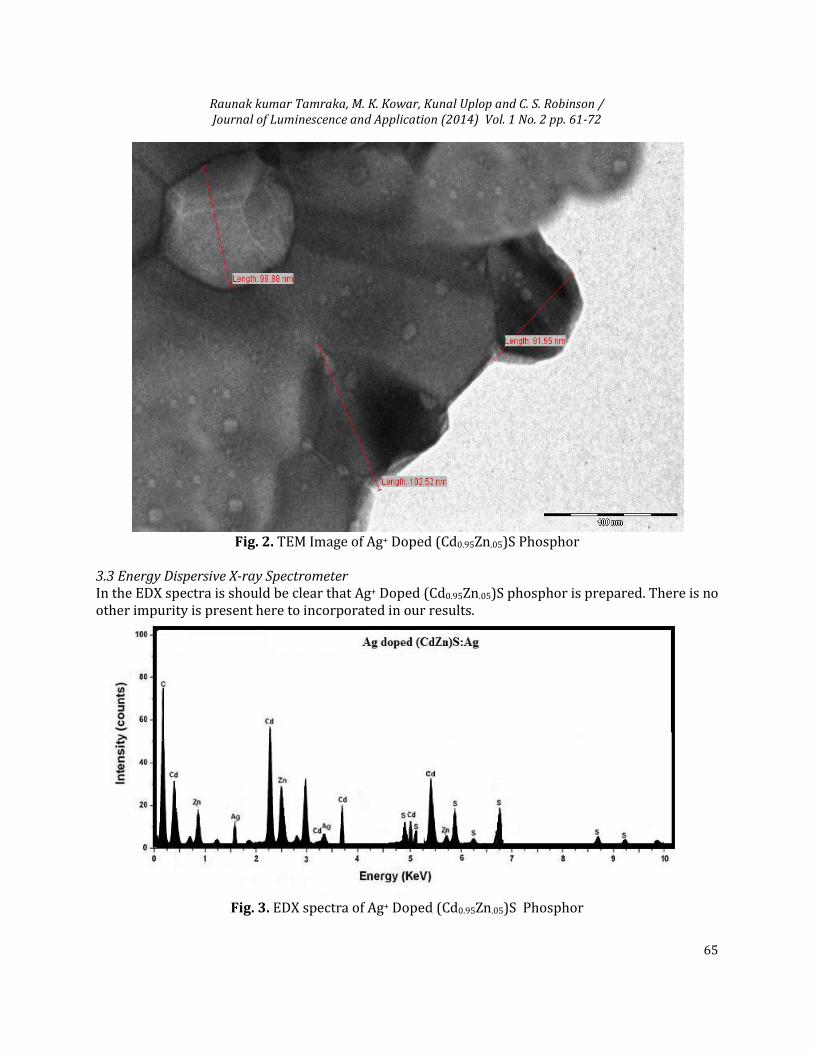
3.2 Transmission Electron Microscope The morphology of silver-doped (Cd0.95Zn.05)S phosphor was determined by Transmission electron microscopy (Figure 2). TEM analysis shows the crystalline behavior of the prepared phosphor with particle size in the range of few microns, which is identical with XRD result.
Raunak kumar Tamraka, M. K. Kowar, Kunal Uplop and C. S. Robinson / Journal of Luminescence and Application (2014) Vol. 1 No. 2 pp. 61-72
65
Fig. 2. TEM Image of Ag+ Doped (Cd0.95Zn.05)S Phosphor
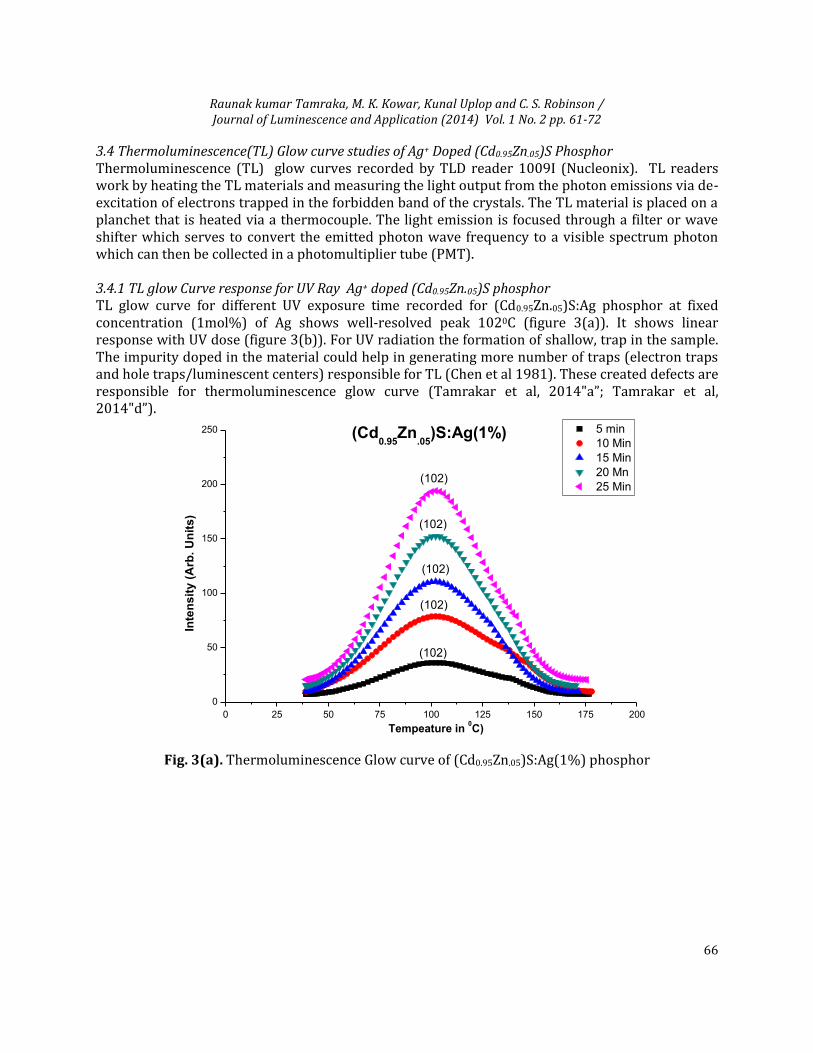
3.3 Energy Dispersive X-ray Spectrometer In the EDX spectra is should be clear that Ag+ Doped (Cd0.95Zn.05)S phosphor is prepared. There is no other impurity is present here to incorporated in our results.
Fig. 3. EDX spectra of Ag+ Doped (Cd0.95Zn.05)S Phosphor
Raunak kumar Tamraka, M. K. Kowar, Kunal Uplop and C. S. Robinson / Journal of Luminescence and Application (2014) Vol. 1 No. 2 pp. 61-72
66
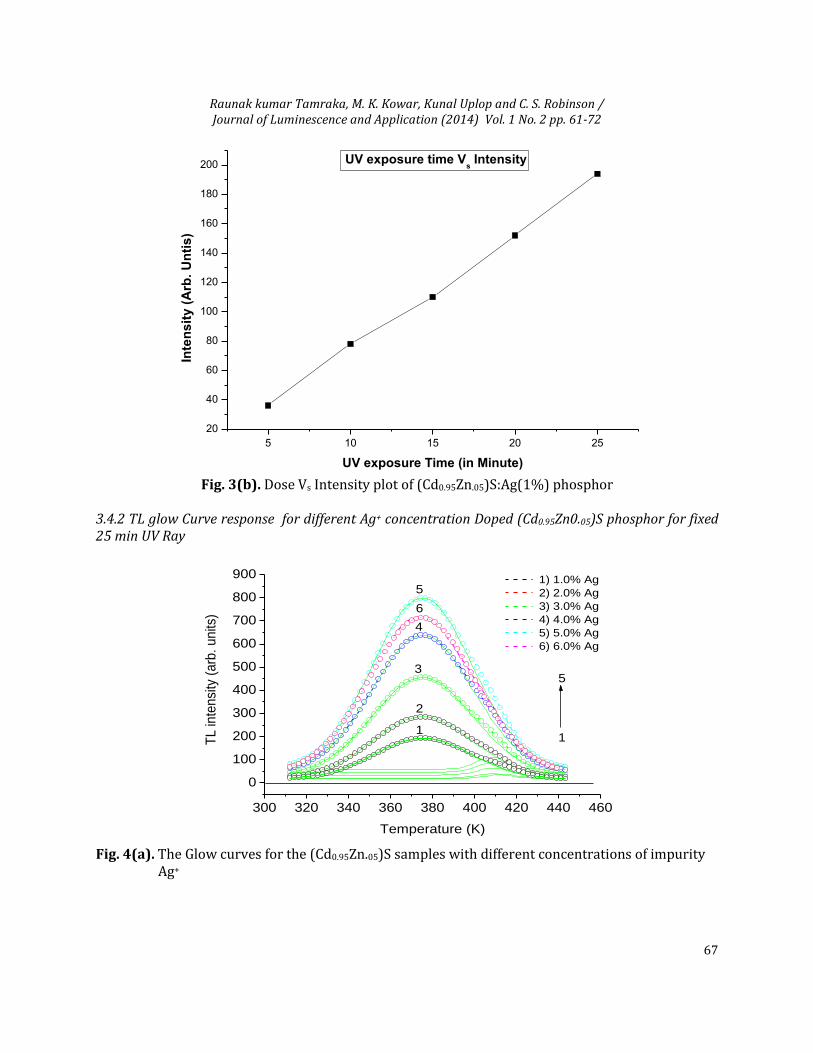
3.4 Thermoluminescence(TL) Glow curve studies of Ag+ Doped (Cd0.95Zn.05)S Phosphor Thermoluminescence (TL) glow curves recorded by TLD reader 1009I (Nucleonix). TL readers work by heating the TL materials and measuring the light output from the photon emissions via de-excitation of electrons trapped in the forbidden band of the crystals. The TL material is placed on a planchet that is heated via a thermocouple. The light emission is focused through a filter or wave shifter which serves to convert the emitted photon wave frequency to a visible spectrum photon which can then be collected in a photomultiplier tube (PMT). 3.4.1 TL glow Curve response for UV Ray Ag+ doped (Cd0.95Zn.05)S phosphor TL glow curve for different UV exposure time recorded for (Cd0.95Zn.05)S:Ag phosphor at fixed concentration (1mol%) of Ag shows well-resolved peak 1020C (figure 3(a)). It shows linear response with UV dose (figure 3(b)). For UV radiation the formation of shallow, trap in the sample. The impurity doped in the material could help in generating more number of traps (electron traps and hole traps/luminescent centers) responsible for TL (Chen et al 1981). These created defects are responsible for thermoluminescence glow curve (Tamrakar et al, 2014"a”; Tamrakar et al, 2014"d”).
0 25 50 75 100 125 150 175 200
0
50
100
150
200
250
(102)
(102)
(102)
(102)
(102)
5 min
10 Min
15 Min
20 Mn
25 Min
Inte
ns
ity
(A
rb. U
nit
s)
Tempeature in 0C)
(Cd0.95
Zn.05
)S:Ag(1%)
Fig. 3(a). Thermoluminescence Glow curve of (Cd0.95Zn.05)S:Ag(1%) phosphor
Raunak kumar Tamraka, M. K. Kowar, Kunal Uplop and C. S. Robinson / Journal of Luminescence and Application (2014) Vol. 1 No. 2 pp. 61-72
67
5 10 15 20 25
20
40
60
80
100
120
140
160
180
200
Inte
ns
ity
(A
rb.
Un
tis
)
UV exposure Time (in Minute)
UV exposure time Vs Intensity
Fig. 3(b). Dose Vs Intensity plot of (Cd0.95Zn.05)S:Ag(1%) phosphor
3.4.2 TL glow Curve response for different Ag+ concentration Doped (Cd0.95Zn0.05)S phosphor for fixed 25 min UV Ray
Fig. 4(a). The Glow curves for the (Cd0.95Zn.05)S samples with different concentrations of impurity
Ag+
300 320 340 360 380 400 420 440 460
0
100
200
300
400
500
600
700
800
900
5
1
6
5
4
3
2
TL
inte
nsi
ty (
arb
. u
nits
)
Temperature (K)
1) 1.0% Ag
2) 2.0% Ag
3) 3.0% Ag
4) 4.0% Ag
5) 5.0% Ag
6) 6.0% Ag
1
Raunak kumar Tamraka, M. K. Kowar, Kunal Uplop and C. S. Robinson / Journal of Luminescence and Application (2014) Vol. 1 No. 2 pp. 61-72
68
1 2 3 4 5 6
100
200
300
400
500
600
700
800
Inte
ns
ity
(A
rb.
Un
its
)
Silver Concentration (Mol %)
Ag+ concentration Vs Intensity
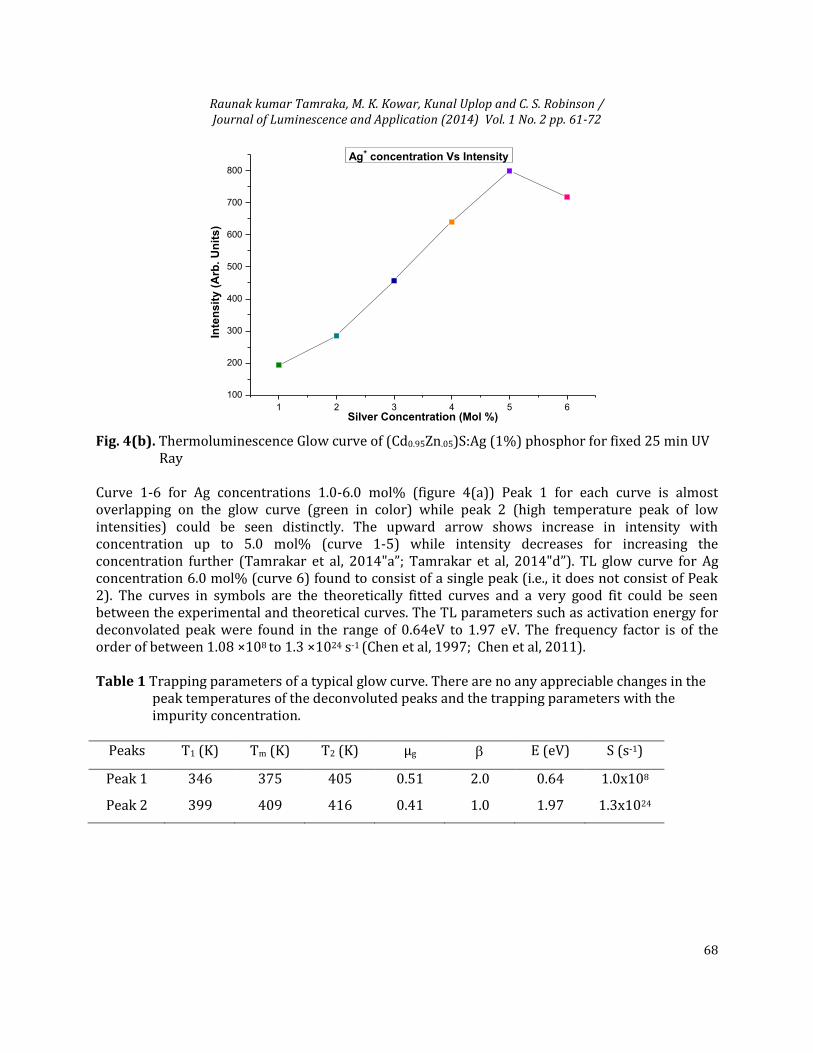
Fig. 4(b). Thermoluminescence Glow curve of (Cd0.95Zn.05)S:Ag (1%) phosphor for fixed 25 min UV
Ray Curve 1-6 for Ag concentrations 1.0-6.0 mol% (figure 4(a)) Peak 1 for each curve is almost overlapping on the glow curve (green in color) while peak 2 (high temperature peak of low intensities) could be seen distinctly. The upward arrow shows increase in intensity with concentration up to 5.0 mol% (curve 1-5) while intensity decreases for increasing the concentration further (Tamrakar et al, 2014"a”; Tamrakar et al, 2014"d”). TL glow curve for Ag concentration 6.0 mol% (curve 6) found to consist of a single peak (i.e., it does not consist of Peak 2). The curves in symbols are the theoretically fitted curves and a very good fit could be seen between the experimental and theoretical curves. The TL parameters such as activation energy for deconvolated peak were found in the range of 0.64eV to 1.97 eV. The frequency factor is of the order of between 1.08 ×10⁸ to 1.3 ×1024 s-1 (Chen et al, 1997; Chen et al, 2011). Table 1 Trapping parameters of a typical glow curve. There are no any appreciable changes in the
peak temperatures of the deconvoluted peaks and the trapping parameters with the impurity concentration.
Peaks T1 (K) Tm (K) T2 (K) µg E (eV) S (s-1)
Peak 1 346 375 405 0.51 2.0 0.64 1.0x10⁸
Peak 2 399 409 416 0.41 1.0 1.97 1.3x1024
Raunak kumar Tamraka, M. K. Kowar, Kunal Uplop and C. S. Robinson / Journal of Luminescence and Application (2014) Vol. 1 No. 2 pp. 61-72
69
3.4.3 Effect of Heating rate for fixed Ag+ concentration Doped (Cd0.95Zn.05)S phosphor for fixed 25 min UV Ray
20 40 60 80 100 120 140 160 180
0
100
200
300
400
500
600
700
800
900(Cd
0.95Zn
.05)S:Ag(5%) 5 HT
6HT
7HT
8 HT
10HT
Inte
ns
ity
(A
rb U
nit
s)
Temperature in 0C
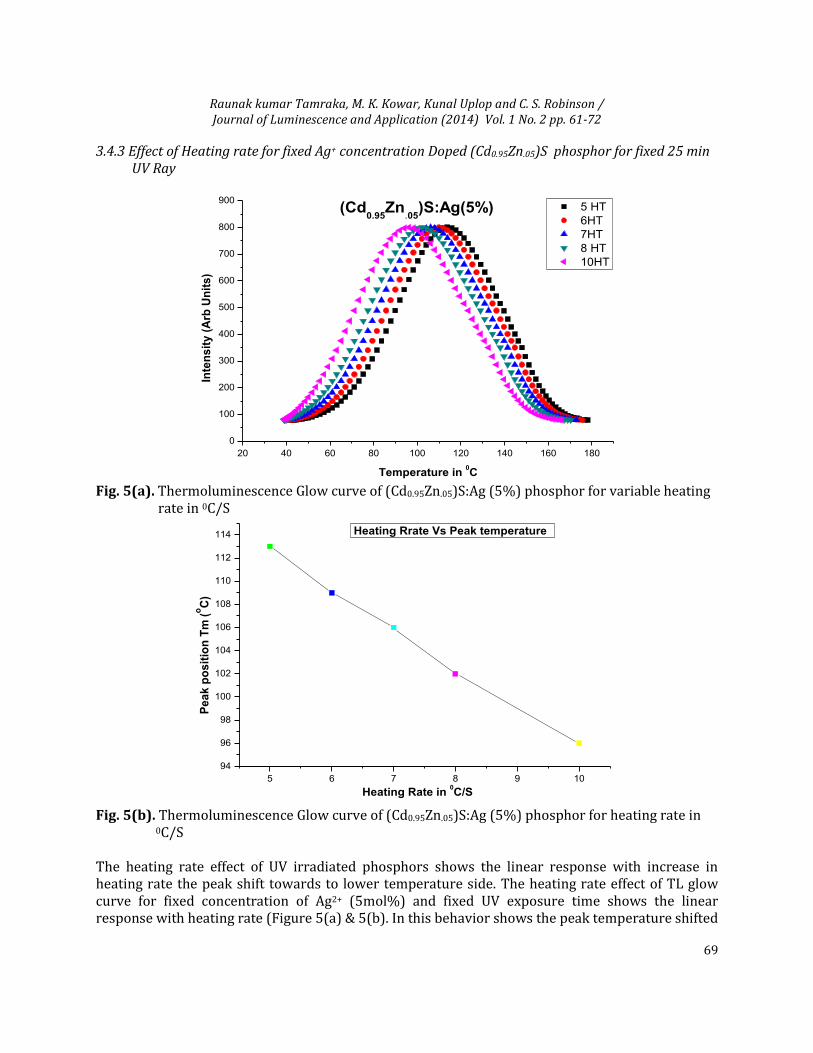
Fig. 5(a). Thermoluminescence Glow curve of (Cd0.95Zn.05)S:Ag (5%) phosphor for variable heating rate in 0C/S
5 6 7 8 9 10
94
96
98
100
102
104
106
108
110
112
114
Pea
k p
osit
ion
Tm
(oC
)
Heating Rate in 0C/S
Heating Rrate Vs Peak temperature
Fig. 5(b). Thermoluminescence Glow curve of (Cd0.95Zn.05)S:Ag (5%) phosphor for heating rate in
0C/S The heating rate effect of UV irradiated phosphors shows the linear response with increase in heating rate the peak shift towards to lower temperature side. The heating rate effect of TL glow curve for fixed concentration of Ag2+ (5mol%) and fixed UV exposure time shows the linear response with heating rate (Figure 5(a) & 5(b). In this behavior shows the peak temperature shifted
Raunak kumar Tamraka, M. K. Kowar, Kunal Uplop and C. S. Robinson / Journal of Luminescence and Application (2014) Vol. 1 No. 2 pp. 61-72
70
towards the lower temperature side on increase of heating rate. The heating rate effect of TL studies for 5 mol% of Ag and fixed UV exposure time shows the decreases the peak temperature when increase of heating rate this is the novel behavior proposed by so many authors and also Mckeever in his book thermoluminescence of solids (McKeever et al, 1985; Furetta et al, 2006; Tamrakar et al, 2014"d”).
4. Conclusion It is concluded that the prepared phosphor shows hexagonal structure when sample was prepared by solid state reaction method. The structural analysis and particle size was determined by XRD techniques the particle size of prepared phosphor found 1.5µm. The exact particle size was calculated by TEM study that shows the ranging of particle size distribution along few microns range. The TEM studies shows the formation of micro phosphors with the good surface morphology some defects found because the sample prepared by high temperature synthesis method. The thermoluminescence behavior for the variable concentration of Ag+ as well as the variable UV exposure time shows well resolved peak at 1020C. The peak is lower temperature peak shows the formation of shallower trap described by the trap model. According to the given models, irradiation of sample by electron beam creates two types of traps (one type are of shallower traps and other of deeper traps) in the forbidden band gap of material. When sample is irradiated by UV rays it forms shallower traps which confirmed by lower temperature peak at TL glow curve. (Furetta et al, 1985) In addition, the effect of heating rate on optimized sample with fixed UV exposure time shows the shifting of TL glow peak in lower temperature side. This phenomenon indicates that the prepared phosphor shows high fading and less stability. Peaks if fitted by CGCD technique the curves in symbols are the theoretically fitted curves and a very good fit could be seen between the experimental and theoretical curves for 1-6 mol% of silver in (Cd0.95Zn.05)S phosphor. The impurity doped in the material could help in generating more number of traps (electron traps and hole traps/luminescent centers) responsible for TL.The TL parameters such as activation energy for deconvolated peak was found in the range of 0.64eV to 1.97 eV. The frequency factor is of the order of between 1.08 ×10⁸ to 1.3 ×1024 s-1.
Acknowledgement We are very grateful to IUC Indore for XRD characterization and also thankful to Dr. Mukul Gupta for his cooperation. I am very thankful to SAIF IIT, Bombay for other characterization such as TEM and EDX.
Reference Bisen D. P., Sharma R., Brahme N., Tamrakar R. Effect of temperature on the Synthesis of CdS:Mn Doped
Nanoparticles. Chalcogenide Letters Vol. 6, No. 9, September 2009, p. 427 – 431.
Chen R. and Kirsh Y., 1981. The Analysis of Thermally Stimulated Processes, Pergamon Press, Oxford, New-York.
Chen R. and Mceever S.W.S., 1997. Theory of Thermoluminescence and Related Phenomena. World Scientific Publications, London, NJ, Singapore. http://dx.doi.org/10.1142/2781
Raunak kumar Tamraka, M. K. Kowar, Kunal Uplop and C. S. Robinson / Journal of Luminescence and Application (2014) Vol. 1 No. 2 pp. 61-72
71
Chen R. and Pagonis V., Thermally and Optically Stimulated Luminescence: A Simulation Approach, Chichester : Wiley, 2011. http://dx.doi.org/10.1002/9781119993766
Chen R., 1969. Thermally Stimulated Current Curves with Non-Constant Recombination Lifetime, Brit. J. Appl. Phys. 2, 371-375.
Chen R., Lawless J. L. and Pagonis V. " A model for explaining the concentration quenching of thermoluminescence" Radiation Measurements 46, 1380-1384 (2011). http://dx.doi.org/10.1016/j.radmeas.2011.01.022
Furetta C., Handbook of Thermoluminescence by World Scientific Publishing Co. Pte. Ltd, 2009.
Furetta C., Numerical and Practical Exercisesin Thermoluminescence, Vasilis Pagonis George Kitis,2006 Springer Science Business Media, Inc.
Kaur J., Suryanarayana N. S. and Dubey V. Chinese Chemical Letters 22 (2011) 709–712. http://dx.doi.org/10.1016/j.cclet.2010.12.006
Laukaitish G., Lindroos S., Tamulevicius S., Leskela M., Rackitis M., Applied Surface Science 161, 396, (2000). http://dx.doi.org/10.1016/S0169-4332(00)00275-0
McKeever S W S "Thermoluminescence of Solids (Cambridge Solid State Science Series) 1985. http://dx.doi.org/10.1017/CBO9780511564994
P. Klug, L.E Alexander, X-ray Diffraction Procedure, Wiley, New York, 1954.
Rosa E. De la, Rodrıguez R.A., Melendrez R., Salas P., Diaz-Torres L.A., Barboza-Flores M., Thermoluminescence properties of undoped and Tb3+ and Ce3+ doped YAG nanophosphor under UV-, X- and b-ray irradiation, Nuclear Instruments and Methods in Physics Research B 255 (2007) 357–364. http://dx.doi.org/10.1016/j.nimb.2006.11.135
Kulkarni, S. K., Winkler, U., Deshmukh, N., Borse, P. H., Fink, R., & Umbach, E. (2001). Investigations on chemically capped CdS, ZnS and ZnCdS nanoparticles. Applied surface science, 169, 438-446. http://dx.doi.org/10.1016/S0169-4332(00)00700-5
Sao S. K., Brahme N., Bisen, R. Sharma, G. Tiwari, S. Tigga, P. Chandrakar and R. Tamrakar, Thermoluminescence and Mechanoluminescence studies of (Cd0.95 Zn0.05)S: Ag doped phosphor Recent Research in Science and Technology 2012, 4(8): 117-118, ISSN: 2076-5061.
Senthil, K., Mangalarj, D., Narayandass, S.K. "Structural and optical properties of CdS thin film", Applied Surface Science, 169-170, pp 476-479 (2001) http://dx.doi.org/10.1016/S0169-4332(00)00732-7
T. Prem Kumar, K. Sankaranarayanan, Chalcogenide Letters Vol. 6, No. 11, November 2009, p. 617 – 622.
Tamrakar R. K. " UV-Irradiated thermoluminescence studies of bulk CdS with trap parameter, Research on chemical intermediates, (2013 "a")DOI10.1007/s11164-013-1166-4.
Tamrakar R. K. and Bisen D. P., Optical and kinetic studies of CdS:Cu nanoparticles Res Chem Intermed (2013 "b") 39:3043–3048.
Tamrakar R. K., Bisen D. P., Robinson C. S., Sahu I. P., and Brahme N., Ytterbium Doped Gadolinium Oxide (Gd2O3:Yb3+) Phosphor: Topology, Morphology, and Luminescence Behaviour in Hindawi Publishing Corporation, Indian Journal of Materials Science Volume (2014 "a"), Article ID 396147, 7.
Tamrakar R. K., Bisen D. P., Upadhyay K. and Bramhe N., Effect of Fuel on Structural and Optical Characterization of Gd2O3:Er3+ Phosphor, Journal of Luminescence and Applications (2014"b") Vol. 1 No. 1 pp. 23-29.
Tamrakar R. K., Bisen D. P., Upadhyay K. and Sahu I. P., UV-irradiated thermoluminescence studies of (Cd,Zn)S:Ag phosphors with trap parameter, "Shaping The Future With Green Chemistry (SFGC-14)" Page -109-112, (2014"c") ISBN:-978-93-82570-34-9.
Tamrakar R. K., Bisen D. P., Sahu I. P., and Brahme N., UV and gamma ray induced thermoluminescence properties of cubic Gd2O3:Er3+ phosphor, Journal of Radiation Research and Applied Sciences, 30 July

Raunak kumar Tamraka, M. K. Kowar, Kunal Uplop and C. S. Robinson / Journal of Luminescence and Application (2014) Vol. 1 No. 2 pp. 61-72
72
(2014"d"), DOI: 10.1016/j.jrras.2014.07.003 http://dx.doi.org/10.1016/j.jrras.2014.07.003
Tamrakar R. K., Studies on Absorption Spectra of Mn Doped CdS Nanoparticles, (LAP Lambert Academic Publishing, VerlAg, (2012). ISBN 978-3-659-26222-7.
Tiwari R., P. B. Taunk, R. K. Tamrakar, N. K. Swamd, V. Dubey "Synthesis, Characterization and Thermoluminescence Behavior of (Cd, Zn)S Mixed Phosphor Doped With Silver", Chalcogenide Letters Vol. 11, No. 3, March (2014"a"), P. 141 - 158.
Tiwari R.; Tamrakar R. K.; Swamy N. K.; Dubey V., Mechanoluminescence Properties of (Cd0.95Zn0.5)S mixed nanoparticles doped with silver Ultra Scientist Vol. 26(1)B,1-6 (2014 "b").
Zahedifar M., Sadeghi E. and Harooni S., Thermoluminescence characteristics of the novel CaF2:Dy nanoparticles prepared by using the hydrothermal method, Nuclear Instruments and Methods in Physics Research B 291 (2012) 65–72 . http://dx.doi.org/10.1016/j.nimb.2012.09.013