Embed Size (px)
Citation preview

NASA Techn ica I Paper 2047
1982
National Aeronautics and Space Administration
Sclentlflc and Technical lnformatlon Branch
Effect o f Shot Peening on Surfiwe Fatigue Life of Carburized and Hardened AIS1 9310 Spur Gears
Dennis P. Townsend and Erwin V. Zaretsky Lewis Research Center Cleveland, Ohio
https://ntrs.nasa.gov/search.jsp?R=19820024860 2020-06-15T19:37:59+00:00Z

Summary Gear surface fatigue endurance tests were condu :ted
on two groups of 10 gears each of carburized and hardened AISI 9310 spur gears manufactured from the same heat of material. Both groups were manufactiired with standard ground tooth surfaces. The second group was subjected to an additional shot-peening proces!, on the gear tooth surfaces and root radius to produce a residual surface compressive stress. The gear pitch diameter was 8.89 cm (3.5 in.). Test conditions were a gear temperature of 350 K (170" F), a maximum Hertz stress of 1.71 x 10⁹ N/m2 (248 OOO psi), and a speed of 10 OOOrpm.
The shot-peened gears exhibited pitting fatigue 1 ives 1.6 times the life of the standard gears without shot peening. Residual stress measurements and ana ysis indicate that the longer fatigue life is the result of the higher compressive stress produced by the shot peening. The life for the shot-peened gear was calculated to be 1.5 times that for the plain gear by using the measured residual stress difference for the standard and shot- peened gears. The measured residual stress for the shot- peened gears was much higher than that for the standard gears.
Introduction Shot peening has long been used as a method for
improving the bending strength of gear teeth (refs. 1 to 3). However, shot peening has not been considered as a means of extending the surface fatigue life of gears. In essence, shot peening induces a residual comprea sive stress below the surface of the gear tooth. Studie,; of residual stresses in rolling-element bearings have shown that increased residual compressive stress will incr :ase rolling-element (surface) fatigue life (refs. 4 and 5). There is always a need to improve the surface fatigue lift: of aircraft gears, especially in helicopter and V/STOL aircraft.
The objectives of the research reported herein werc: (1) to investigate the effects of shot peening of gear teeth on the surface fatigue life of standard ground, case- carburized, and hardened AISI 9310 spur gears, (2) to compare the life of shot-peened gears to that of non-siot- peened gears manufactured with the same material and specifications, and (3) to determine the residual stress produced by shot peening and its effect on the surface fatigue life.
To accomplish these objectives, 20 spur gears were manufactured from a consumable-electrode-vacuum- melted single heat of AISI 9310 material. Ten of t lese gears were shot peened after finish grinding. The ,gear pitch diameter was 8.89 cm (3.5 in.). Both the shot-
peened and non-shot-peened gears were then tested to fatigue by surface pitting under identical test conditions. These test conditions included a gear temperature of 350 K (170" F), a maximum Hertz stress of 1.71 x 10⁹ N/m2 (248 OOO psi), and a speed of 10 OOO rpm.
Apparatus, Specimens, and Procedure Gear Test Apparatus
The gear fatigue tests were performed in the NASA Lewis Research Center's gear test apparatus (fig. 1). This test rig uses the four-square principle of applying the test gear load so that the input drive only needs to overcome the frictional losses in the system.
A schematic of the test rig is shown in figure 10). Oil pressure and leakage flow are supplied to the load vanes through a shaft seal. As the oil pressure is increased on the load vanes inside the slave gear, torque is applied to the shaft. This torque is transmitted through the test gears back to the slave gear, where an equal but opposite torque is maintained by the oil pressure. This torque on the test gears, which depends on the hydraulic pressure
I
temperature measure- ment location
la) Cutaway view.
.-Slave qear
T e d gears
r
toque pressure2
View A-A lbl Schematic diagram.
CD-11124-1>
Figure 1. - NASA Lewis Research Center's gear fatigue test apparatus.

applied to the load vanes, loads the gear teeth to the desired stress level. The two identical test gears can be started under no load, and the load can be applied gradually, without changing the running track on the gear teeth.
Separate lubrication systems are provided for the test gears and the main gearbox. The two lubrication systems are separated at the gearbox shafts by pressurized labyrinth seals. Nitrogen is the seal gas. The test gear lubricant is filtered through a 5-pm-nominal fiberglass filter. The test lubricant can be heated electrically with an immersion heater. The temperature of the heater skin is controlled to prevent overheating the test lubricant.
to automatically shut off the test rig when a gear surface fatigue occurs. The gearbox is also automatically shut off if there is a loss of oil flow to either the main gearbox or
loss of seal gas pressurization.
speeds by changing pulleys. The operating speed for the tests reported herein was 10 000 rpm.
I
I A vibration transducer mounted on the gearbox is used
I the test gears, if the test gear oil overheats, or if there is a
The belt-driven test rig can be operated at several fixed ,
I
E 1 ement
C Mn S i N i C r Mo cu P S
I Test Materials
Composi t ion w t %
0.10 .63 .27
3.22 1.21
.12
.13
.005
.005
The test gears were manufactured from consumable- electrode-vacuum-melted (CVM) AISI 93 10 steel from the same heat of material. Both sets of gears were case hardened to a case hardness of Rockwell C 58 and a case depth of 0.97 mm (0.038 in.). The nominal core hardness was Rockwell C 40. One set of the gears was shot peened, after finish grinding, on the tooth root and the tooth profile according to the specifications given in table I. The chemical composition of the material is given in table 11. Both sets of gears were case carburized and heat
Process Temperature -
K O F
P rehea t i n a i r ___ - ---- 1172 1650 C a r b u r i z e
A i r c o o l t o room ___- ---- Copper p l a t e a l l over ---- ----
922 1200 Reheat A i r c o o l t o room ___- ----
Aus ten i t i z e 1117 1550 O i l quench
Double temper 450 350 F i n i s h g r i n d _-_- ---- S t r e s s r e l i e v e 450 350
temper a t u r e
temperature
_ _ _ _ ---- Subzero c o o l 180 -120
TABLE I. - SHOT-PEENING SPECIFICATION
Time, h r
------ 8
------
------ 2.5
------
2.5 ------
3.5 2 each ------
2
S p e c i f i c a t i o n . . . . . . . . . . . MIL-S-131658
Shot s i z e . . . . . . . . . . . . . . . . . 070 Shot t y p e . . . . . . . . . . . . . . Cas t s t e e l I n t e n s i t y ( h e i g h t o f Almen . . . . 0.18 t o 0.23
(0.007 t o 0.009) Coverage ( s i d e s and r o o t . . . . . . . . . . 200
BPS FW 4409
s t r i p , t y p e A), mm ( i n . )
o n l y ) p e r c e n t
- Step
__
1 2 3
4 5 6
7 8 9
10 11 12
TABLE 11. - NOMINAL CHEMICAL
COWOSITION OF CVM A I S I
9310 GEAR MATERIAL
TABLE 111. - HEAT TREATMENT FOR A I S I 9310
treated in accordance with the heat treatment schedule of table 111. Figure 2 is a photomicrograph of an etched and polished gear tooth surface showing the case micro- structure of the AIS1 9310 material.
Test Gears
Dimensions of the test gears are given in table IV. All gears have a nominal surface finish on the tooth face of 0.406 pm (16 pin.) rms and a standard 20" involute profile with tip relief. Tip relief was 0.0013 cm (0.0005 in.), starting at the highest point of single-tooth contact. Surface traces of the standard gear and the shot-peened gear are shown in figure 3.

l a ) Standard gear case.
( c l Shot-peened gear case,
Ibl Standard gear core.
( d l Shot-peened qear core.
F igure 2. - Photomicrographs of case a n d core f o r standard a n d shot-peened spur gears.
3

TABLE I V . - SPUR GEAR DATA Test Lubricant
[Gear t o l e r a n c e p e r ASMA c l a s s 12.1
Number o f t e e t h . . . . . . . . . . . . . . . 28 D i a m e t r a l p i t c h . . . . . . . . . . . . . . . 8 C i r c u l a r p i t c h , cm ( i n . ) . . . 0.9975 (0.3927) Whole depth, cm ( i n . ) . . . . . . 0.762 (0.300) Addendum, cm ( i n . ) . . . . . . . 0.318 (0.125)
P ressu re angle, deg . . . . . . . . . . . . . 20 P i t c h diameter, cm ( i n . ) . . . . 8.890 (3.500) Ou ts ide d iameter , cm ( i n . ) . . . 9.525 (3.750) Root f i l l e t , cm ( i n . ) . . . . . . 0.102 t o 0.152
(0.04 t o 0.06) Measurement over p ins , . . . . . 9.603 t o 9.630
cm ( i n . ) (3.7807 t o 3.7915) P i n diameter, cm ( i n . ) . . . . . 0.549 (0.216) Back lash re fe rence , cm ( i n . ) . . 0.0254 (0.010) T i p r e l i e f , cm ( i n . ) . . . . . 0.001 t o 0.0015
(0.0004 t o 0.0006) Tooth width, cm ( i n . ) . . . . . . . 0.635 (0.25)
Chordal t o o t h t h i c k n e s s . . . . . 0.485 (0.191) ( r e f e r e n c e ) , cm ( i n . )
la) Standard gear.
(b) Shot-peened gear.
Figure 3, - Surface f inish of standard ground and shot-peened gears.
All the gears were lubricated with a single batch of synthetic paraffinic oil. The physical properties of this lubricant are summarized in table V. Five percent of an extreme-pressure additive, designated Lubrizol 5002 (partial chemical analysis given in table V), was added to the lubricant.
Test Procedure
After the test gears were cleaned to remove the preservative, they were assembled on the test rig. The 0.635-cm (0.25-in.) wide test gears were run in an offset condition with a 0.30-cm (0.12-in.) tooth-surface overlap to give a load surface on the gear face of 0.28 cm (0.1 1 in.), thereby allowing for the edge radius of the gear teeth. If both faces of the gears were tested, four fatigue tests could be run for each set of gears. All tests were run in at a pitch-line load of 1225 N/cm (700 lb/in) for 1 hour, which gave a maximum Hertz stress of 0.756 x 10⁹ N/m2 (1 11 OOO psi). The load was then increased to 5784 N/cm (3305 lb/in), which gave a pitch-line maximum Hertz stress of 1.71 x IO9 N/m2 (248 OOO psi). At this pitch-line load the tooth root bending stress would be 0.21 x 10⁹ N/m2 (30 OOO psi) if plain bending were assumed. However, because there was an offset load, an additional stress was imposed on the tooth bending stress. Combining the bending and torsional moments gave a maximum stress of 0.26 x 10⁹ N/m2 (37 O00 psi). This bending stress does not include the effects of tip relief, which would also increase the bending stress.
TABLE V. - PROPERTIES OF SYNTHETIC
P A R A F F I N I C OIL
A d d i t i v e . . . . . . . . . . . . a L u b r i z o l 5002 K inemat i c v i s c o s i t y , cm2/sec ( c s ) a t - 244 K (-20' F ) . . . . . . . 311 K (100' F ) . . . . . . . 372 K (210" F ) . . . . . . . . 477 K (400" F ) . . . . . . . .
2 5 0 0 ~ 1 0 - ~ (2500) 3 1 . 6 ~ 1 0 - ~ (31.6)
5.7x10-* (5.7) 2 . 0 ~ 1 0 - ~ (2.0)
F l a s h p o i n t , K (OF) . . . . . . . . . . 508 (455) F i r e p o i n t , K (OF) . . . . . . . . . . 533 (500) Pour p o i n t , K (OF) . . . . . . . . . . 219 ( -65)
Vapor p ressu re a t 311 K (100' F ) , . . . . . 0.1
S p e c i f i c h e a t a t 311 K (100' F ) , . . 676 (0.523)
S p e c i f i c g r a v i t y . . . . . . . . . . . . 0.8285
mm t ig ( o r t o r r )
J / k g K ( B t u / l b O F )
a A d d i t i v e , L u b r i z o l 5002 (5 ~ 0 1 % ) ; c o n t e n t o f a d d i t i v e : phosphorus, 0.6 wt%; s u l f u r , 18.5 w t % .
4
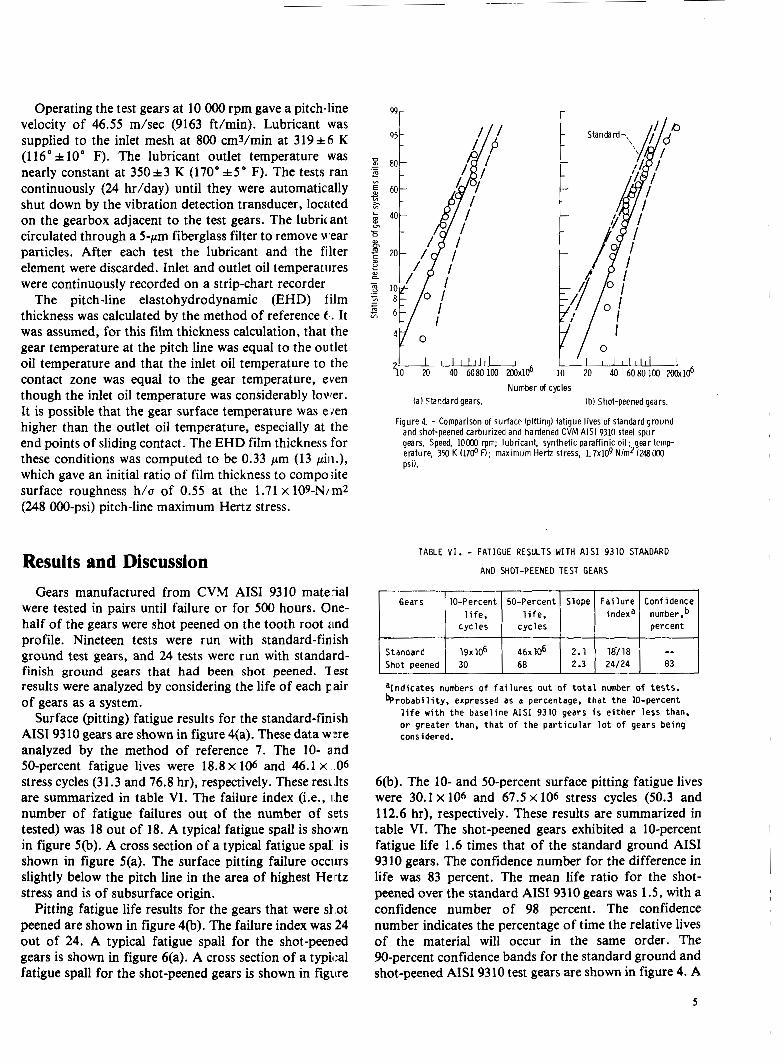
Operating the test gears at 10 OOO rpm gave a pitch-line velocity of 46.55 m/sec (9163 ftlmin). Lubricant was supplied to the inlet mesh at 800 cmVmin at 319*6 K (1 16" * 10" F). The lubricant outlet temperature was nearly constant at 350*3 K (170" *5" F). The tests ran continuously (24 hr/day) until they were automatically shut down by the vibration detection transducer, located on the gearbox adjacent to the test gears. The lubrkant circulated through a 5-pm fiberglass filter to remove vear particles. After each test the lubricant and the filter element were discarded. Inlet and outlet oil temperatures were continuously recorded on a strip-chart recorder
The pitch-line elastohydrodynamic (EHD) film thickness was calculated by the method of reference f ' . It was assumed, for this film thickness calculation, that the gear temperature at the pitch line was equal to the outlet oil temperature and that the inlet oil temperature to the contact zone was equal to the gear temperature, even though the inlet oil temperature was considerably lovier. It is possible that the gear surface temperature was egen higher than the outlet oil temperature, especially at the end points of sliding contact. The EHD film thickness for these conditions was computed to be 0.33 pm (13 pili.), which gave an initial ratio of film thickness to compo site surface roughness h/a of 0.55 at the 1.71x10⁹-N/mz (248 OOO-psi) pitch-line maximum Hertz stress.
Results and Discussion Gears manufactured from CVM AISI 9310 mate-ial
were tested in pairs until failure or for 500 hours. One- half of the gears were shot peened on the tooth root and profile. Nineteen tests were run with standard-finish ground test gears, and 24 tests were run with standard- finish ground gears that had been shot peened. ?est results were analyzed by considering the life of each air of gears as a system.
Surface (pitting) fatigue results for the standard-finish AISI 9310 gears are shown in figure 4(a). These data wxe analyzed by the method of reference 7. The 10- and 50-percent fatigue lives were 1 8 . 8 ~ 106 and 46.1 x 10⁶ stress cycles (31.3 and 76.8 hr), respectively. These resL Its are summarized in table VI. The failure index (Le., ihe number of fatigue failures out of the number of sets tested) was 18 out of 18. A typical fatigue spall is shown in figure 5(b). A cross section of a typical fatigue spa1 is shown in figure 5(a). The surface pitting failure occiirs slightly below the pitch line in the area of highest Hertz stress and is of subsurface origin.
Pitting fatigue life results for the gears that were sl.ot peened are shown in figure 4(b). The failure index was 24 out of 24. A typical fatigue spall for the shot-peened gears is shown in figure 6(a). A cross section of a typical fatigue spall for the shot-peened gears is shown in figure
4!f 9 ' , I , y /i p , ' , , , , , , , \O 20 40 6080 100 2wx106 10 20 40 6080100 200x106
Number of cycles (a) Standardgears. (b) Shot-peened gears
Figure 4. - Comparison of surface (pitting) fatigue lives of standard ground and shot-peened carburized and hardened CVM AIS1 9310 steel spur gears. Speed, loo00 rpm; lubricant, synthetic paraffinic oil; gear temp- erature, 350 K (1700 F); maximum Herh stress, 1.7x10⁹NlmZ1Z48000 psi).
TABLE V I . - FATIGUE RESULTS WITH A I S I 9310 STANDARD
AND SHOT-PEENED TEST GEARS
l i f e , l i f e , percent
S t andard Shot peened
aIndicates numbers o f f a i l u r e s out o f t o t a l number o f tests. b r o b a b i l i t y . expressed as a percentage. tha t the 10-percent
l i f e with the baseline A I S 1 9310 gears i s e i ther less than. or greater than, tha t of the par t icu lar l o t o f gears being considered.
6@). The 10- and 50-percent surface pitting fatigue lives were 30.1 x 10⁶ and 67.5 x 10⁶ stress cycles (50.3 and 112.6 hr), respectively. These results are summarized in table VI. The shot-peened gears exhibited a 10-percent fatigue life 1.6 times that of the standard ground AISI 9310 gears. The confidence number for the difference in life was 83 percent. The mean life ratio for the shot- peened over the standard AISI 9310 gears was 1.5, with a confidence number of 98 percent. The confidence number indicates the percentage of time the relative lives of the material will occur in the same order. The 90-percent confidence bands for the standard ground and shot-peened AISI 9310 test gears are shown in figure 4. A
5

- P i t t i n g -
0.3 cm ' 0.12in.
\ ' \
(a) Cross section of typical fat igue spall. ( b l Typical fat igue spall.
F igure 5. - Fatigue spall f o r standard g r o u n d gear.
- P i t t i n g 7
O.3crn , 1 0.12 in.
(a ) Typical fat igue spall. (b) Cross section of typical fat igue spall.
F igure 6. - Fatigue spall f o r shot-peened sear.

confidence number of 95 percent is equivalent to a 2a confidence level.
It is well known that shot peening produces residual subsurface stresses in steel in addition to the residual stresses produced by case carburizing, hardening, and grinding. It was theorized that the additional residual stresses induced by shot peening should account for the increased life of the shot-peened gears. Therefore two shot-peened and untested gear teeth and two standard ground and untested gear teeth were subjected to X-ray diffraction residual stress measurements to determine the magnitude of these residual stresses. Residual stress measurements were made near the pitch point at the surface and at nominal subsurface depths of 5,13,25,76, 127, and 254 pm (0.2, 0.5, 1.0, 3, 5, and 10 mil).
Material was removed for subsurface measurement by electropolishing in a sulphuric-phosphoric-chromic acid electrolyte in order to minimize possible alteration of the subsurface residual stress distribution as a result of material removal. All data obtained as a function of depth were corrected for the effects of the penetration of the radiation employed for residual stress measurement into the subsurface stress gradient and for stress relaxation, which occurred as a result of material removal. The method used for the X-ray stress measurements and the calibration procedures used are described in references 8 and 9.
Figure 7(a) shows two corrected X-ray diffraction residual stress measurements as a function of depth below the surface for the standard ground AISI 9310 gear teeth that had not been shot peened or tested. The high compressive stress on the surface of the gear tooth is the result of grinding and has a very shallow depth that has very little effect on the surface durability of the gear. The lower compressive stress, which has much greater depth, is from the case carburizing and hardening of the gear tooth surface. This compressive residual stress has a definite beneficial effect on surface fatigue and bending fatigue life.
Figure 7(b) contains two plots of corrected X-ray diffraction residual stress measurements as a function of depth below the surface in the ground and shot-peened AISI 9310 gear teeth that had not been tested. The high grinding compressive stress on the surface was reduced. A hook in the curve shows a high compressive stress 1.3 pm (0.5 mil) below the surface as a result of the shot peening. The compressive stress at greater depths below the surface was also increased as a result of the shot peening. It is the increased compressive stress at the greater depths that has the major effect on the surface fatigue life. The depth to the maximum shear stress for the load conditions reported herein was 178 pm (7 mil).
Figure 7(c) contain plots of the average of the two X-ray residual stress measurements as a function of depth below the surface for both the standard ground and shot-
10
n 5
10
10
Residual stress, psi
0 -40 -a0 -120 - 1 6 0 ~ 1 0 ~
Residual stress, Nlm
0 Gear A A Gear6
(a) Standard gears.
0 Gear C A GearD
L 5 1 6 1 4\ 9 -
2 4 1 h b
12 0 Standard gears A Shot-peened gears
1 1 20 24 [ 28
(c) Average principal residual stress for standard and shot-peened gears.
Figure 7. - Principal residual stress as a function of depth below the surface of carburized, hardened, ground and untested AIS1 9310 steel spur gear teeth.
peened gears. This figure shows the average increase in the residual compressive stress due to shot peening. At the maximum shear stress depth of 178 pm (7 mil) the average residual compressive stress was increased from 0.186 x 10⁹ N/m2 (27 OOO psi) in the standard ground
I
I

AISI 9310 gear to 0.26 x 10⁹ N/m2 (37 700 psi) in the ground and shot-peened AISI 9310 gear. From equation (AI l), taken from the analysis given in the appendix for maximum shear stress and residual stress,
1 (7max),= -3.15x10⁶ - ( L Z R ) - 2 sry
where
R = 7.62 mm (0.3 in.)
S,, = 1.71 x 10⁹ N/m2 (248 OOO psi)
3 = 578 375 N/m (3305 Ib/in) L
Therefore for peened gears, in SI units,
578 375 0.00762 x 1.71 x 109 (7m,)r= - 2 1 . 7 4 ~ 109
1 2
- - (0.26 x 10⁹) = -0.835 x 10⁹
in U.S. customary units,
1 0 . 3 ~ 2 4 8 OOO 2 - -(-37OOO) 3305
( T ~ , ) , = - 3 . 1 5 ~ 106
= - 121 080
And for standard gears, in SI units,
578 375 0.00762 x 1.71 x 109 ( T ~ , ) , = - 2 1 . 7 4 ~ 109
1 2 - -(0.186~109)= -0.872~109
in U.S. customary units,
3305 0.3 x 248 OOO (7,ax>,= - 3 . 1 5 ~ 106
1 2 - - (-27 ooO)= -126 430
The surface fatigue life from reference 10 for gears is inversely proportional to the maximum shear stress to the ninth power. The calculated life ratio from measured residual stress is therefore
This calculated ratio of the fatigue life of the shot-peened gears to that of the standard gear compares favorably with the experimental fatigue life ratio of 1.6.
Summary of Results Gear surface fatigue endurance tests were conducted
on two groups of carburized and hardened AISI 9310 steel spur gears manufactured from the same heat of material. Both groups were manufactured with a standard ground tooth surface. One group was subjected to an additional shot-peening process on the gear tooth surface and root radius to produce a residual compressive surface stress. The gear pitch diameter was 8.89 cm (3.5 in.). Test conditions were a gear temperature of 350 K (170" F), a maximum Hertz stress of 1.71 x IO9 N/m2 (248 OOO psi), and a speed of 10 OOO rpm. The lubricant was a synthetic paraffinic oil with an additive package.
The following results were obtained: 1. The 10-percent surface (pitting) fatigue life of the
shot-peened gears was 1.6 times that for the standard test gears that were not shot peened. This was shown to be statistically significant.
2. The calculated 10-percent surface (pitting) fatigue life for the shot-peened gears determined from measured residual subsurface stress was 1.5 times that for the standard gears that were not shot peened.
3. Measured residual stresses for the standard and shot-peened gears show an increase of 40 percent for the shot-peened gears over the standard gears at the depth of maximum shear stress in addition to a 350 percent increase at a depth of 13.0 pm (0.5 mil).
Lewis Research Center National Aeronautics and Space Administration Cleveland, Ohio, March 5 , 1982
1 8

Appendix - Derivation of Residual Stress Effect on Maximum Shear Stress 1 l = 2 R ( ~ ) 1-82 It is well known that classical rolling-element fatigue
begins in the subsurface zone of maximum shear stress (refs. 1 1 and 12). Therefore, to determine the effect of residual stress on rolling-element fatigue in gears, it is necessary to analyze the effect of residual stress on the maximum shear stress below the surface. The maximum shear stress at any point in a stressed volume below a rolling line-contact load is
1 (7ma.xIy = ( s z - s y ) (AI)
where PN normal load, N (lb) S,,, maximum Hertz stress, N/m2 (psi) Rl,R2 radius of curvature of the two rollers, m (in.) 6 Poisson’s ratio E Young’s modulus, N/m2 (psi) Substituting equations (A6) and (AS) into equation (AS) for 7m, results in
1 (7rnaxJX = 2 (SZ - s x ) (A2)
where Sz is the principal compressive stress in a direction normal to the contact area, S, is the principal compressive stress parallel to the direction of rolling (ref. 13), and Sx is the principal stress normal to the direction of rolling.
For rollers or gear teeth loaded statically, the maximum theoretical shear stress occurs in the y-z plane since the stress in the y, or rolling, direction is less than the stress in the x direction. Therefore the maximum shear stress is
(A3) 1
7max = 5 (Sz - s y )
If equation (A9) is substituted into equation (A4),
pN [ E ] - ;Sf , (A10) (7,,,),= -0.30025- ~
TLS,, R( 1 - 62)
For steel gears E=207 x 109 N/m2 ( 3 0 ~ 106 psi) and 6 == 0.30; therefore equation (A10) becomes for SI units
pN (T, , - ,~) ,= - 2 1 . 7 4 ~ 109- - LSrn,R zsfy (A1 la)
If the residual stresses are equal in the x and y directions, for the line contact in the y-z plane the maximum shear stress including the residual stress is
and for U.S. customary units
(A1 lb)
where S,, can be either compressive or tensile. When gears are shot peened, t.he residual stress is compressive and therefore reduces the maximum shear stress.
Since the rolling-element fatigue life of gears is inversely proportional to the maximum shear stress to the ninth power (ref. 14),
where S,, is the residual stress in the y direction and is positive for tensile stress and negative for compressive stress. From reference 13 for line contact of rollers
(A51 b
T~~ = -0.30025
where b is the half width of the Hertzian contact, or
and A for a contact of two rollers of the same material is From equation (A4), where (Tm,), = 7m, - 1 /2 (S,,),
RlR2 1-62 A=4- (7)
Rl +R2
If the rollers are of the same radius, using 9 life ratio of L1 and L2
9

When the residual stress developed by the shot peening of the gear teeth is known, the change in life produced by shot peening can be determined from equation (A14).

References
1. Moore, H. F.: Shot Peening and the Fatigue of Metals. American Foundry Equipment Co., 1944.
2. Straub, J. C.: Shot Peening in Gear Design. AGMA Paper 109.13, June 1964.
3. Valentine, K. B.: Recrystallization as a Measurement of Relative Shot Peening Intensities. Am. Soc. Met. Trans. Q., vol. 40, 1948, pp. 420-434.
4. Zaretsky, Erwin V.; et al.: Effects of Component Differential Hardness on Residual Stress and Rolling-Contact Fatigue. NASA
5. Zaretsky, E. V.; Parker, R. J.; and Anderson, W. J: Component Hardness Differences and Their Effect on Bearing Fatigue. J. Lub. Techno]., vol. 89, no. 1, Jan. 1%7, pp. 47-62.
6. Dowson, D.; and Higginson. G. R.: Elasto-Hydrodynamic Lubrication. Pergamon Press, 1966, p. %.
7. Johnson, Leonard G.: The Statistical Treatment of Fatigue Experiments. Elsevier Pub. Co., 1964.
8. Christenson, A. L.. ed.: Measurement of Stress by X-Ray. SAE
TN D-2664,1%5.
HS-182, Aug. 1971.
9. Prevey, Paul S.: Method of Determining the Elastic Properties of Alloys in Selected Crystallographic Directions for X-Ray Defraction Residual Stress Measurements. Adv. X-Ray Anal.,
10. Townsend, D. P.; Coy, J. J.; and Zaretsky, E. V.: Experimental and Analytical Load Life Relation for AIS1 9310 Steel Spur Gears. Journal of Mechanical Design, Trans. ASME, vol. 100, no. 1, Jan. 1978, pp. 54-60.
11. Jones, A. B.: Metallographic Observations of Ball Bearing Fatigue Phenomena. Symposium on Testing of Bearings, ASTM, 1947, pp. 35-48; discussion, pp. 49-52.
12. Carter, T. L.; et al.: Investigation of Factors Governing Fatigue Life with the Rolling-Contact Fatigue Spin Rig. Am. Soc. Lubr. Eng. Trans., vol. 1, no. 1, Apr. 1958, pp. 23-32.
13. Jones, A. B.: New Departure- Analysis of Stress and Deflections. Vol. I, New Departure, Div. Gen. Motors Corp., 1946, p. 22.
14. Lundberg, G.; and Palmgren, A.: Dynamic Capacity of Rolling Bearings. Acta. Polytech. Scand., Mech. Eng. Ser., vol. 1, no. 3, 1947.
VOI. 20, 1977, pp. 345-354.


1. Report No. NASA TP-2047
9. Performing Organization Name and Address
National Aeronautics and Space Administration Lewis Research Center
2. Government Accession No. 3. Recipient's Catalog No.
9. Security Classif. (of this report)
Unclassified
5. Report Date August 1982
20. Security Classif. (of this page) 21. No. of Pages 22. Price'
Unclassif ied 12 A02
6. Performing Organization Code
506- 53- 12 8. Performing Organization Report No.
E-936 10. Work Unit No.
11. Contract or Grant No.
13. Type of Report and Period Covered Cleveland, Ohio 44135
12. Sponsoring Agency Name and Address
National Aeronautics and Space Administration Washington, D. C. 20546
Technical Paper 14. Sponsoring Agency Code
15. Supplementary Notes
6. Abstract
Surface fatigue tests were conducted on two groups of AISI 9310 spur gears. Both groups were manufactured with standard ground tooth surfaces, with the second group subjected to an addi- tional shot-peening process on the gear tooth flanks, The gear pitch diameter was 8.89 cm (3.5 in. ). Test conditions were a gear temperature of 350 K (170' F), a maximum Hertz s t r e s s of 1.71~10~ N/m (248 000 psi), and a speed of 10 000 rpm. The shot-peened gears exhibited pitting fatigue lives 1.6 times the life of standard gears without shot peening. Residual s t r e s s measurements and analysis indicate that the longer fatigue life is the result of the higher com- pressive s t r e s s produced by the shot peening. The life f o r the shot-peened gear was calculated to be 1.5 times that for the plain gear by using the measured residual s t r e s s difference for the standard and shot-peened gears. The measured residual s t r e s s for the shot-peened gears was much higher than that for the standard gears.
2
7. Key Words (Suggested by Authorls))
Gears; Surface fatigue life; Shot peen; Gear life; Residual s t ress ; AISI 9310
18. Distribution Statement
Unclassified - unlimited STAR Category 37
* For sale by the National Technical Information Service, Springfield, Virginia 22161 NASA-Langley, 1982


![International Journal of Heat and Mass Transfer Volume 34 Issue 9 1991 [Doi 10.1016%2F0017-9310%2891%2990063-k] H.J.H. Brouwers -- An Improved Tangency Condition for Fog Formation](https://img.pdfslide.us/doc/110x75/577cc6801a28aba7119e6ac4/international-journal-of-heat-and-mass-transfer-volume-34-issue-9-1991-doi.jpg)
![International Journal of Heat and Mass Transfer Volume 17 Issue 10 1974 [Doi 10.1016%2F0017-9310%2874%2990123-9] K.G.T. Hollands -- An Analysis of a Counterflow Spray Cooling Tower](https://img.pdfslide.us/doc/110x75/56d6be1b1a28ab301690a793/international-journal-of-heat-and-mass-transfer-volume-17-issue-10-1974-doi.jpg)