Embed Size (px)
Citation preview

EFFECT OF SHOPPER MARKETING PRACTICES ON SALES
PERFORMANCE OF MEDIUM AND LARGE SUPERMARKETS, IN
NAIROBI COUNTY, KENYA
OTIENO MAUREEN OYUGA
A RESEARCH PROJECT SUBMITTED IN PARTIAL FULLFILMENT OF
THE REQUIREMENT FOR THE AWARD OF DEGREE OF MASTER OF
BUSINESS ADMINISTRATION (MBA) SCHOOL OF BUSINESS,
UNIVERSITY OF NAIROBI
SEPTEMBER 2015

ii
DECLARATION
This research project is my original work and has not been presented for the award of a degree or
any other quantification in any other university or institution.
Signature …………………………………….. Date ……………………….
Otieno Maureen Oyuga
D61/61924/2010
This research project has been submitted for examination with my approval as the University
Supervisor.
Signature …………………………………….. Date ……………………….
Prof. J.M Munyoki
School of Business
University of Nairobi

iii
DEDICATION
I dedicate this project to my family for unfailing encouragement and love. To my dear husband
Collins, and to my loving sons Baraka, Branson and Brian, who were constant sources of
encouragement for me to strive on to the completion of this project.

iv
ACKNOWLEDGEMENT
I wish to thank most sincerely all those whose contributions have made this project a success. To
my supervisor Prof. J.M Munyoki for his assistance and advice all through making this project a
success. To my wonderful family for their support both morally and financially. Most of all I
thank God for the gift of wisdom and strength to complete this project.
I feel indebted to the management of Uchumi Supermarket. To my classmates and all other
people who in one way or another played a part in my entire MBA process. To all of you may
the Almighty God bless you abundantly.
v
ABSTRACT
In the present day business environment that is characterized by increased competition among
local and international companies, the emergence of more demanding customers and great
technological advances has resulted in a complex market in the retail business. In this complex
market environment, the marketing strategy of the company could be a competitive advantage
versus other companies provided that they deliver services and values that not only meet the
customer demands, but surpass them. Shopper marketing has emerged in recent years as a
breakthrough concept in the evolution of consumer communication, as product manufacturers
and retailers alike have identified a growing need to influence the shopping experience. The
objective of the study was to establish the effect of shopper marketing practices on sales
performance of medium and large supermarkets in Nairobi County. The research design adopted
by the study was descriptive cross sectional survey design. The population of this study
comprised of all medium and large supermarkets in Nairobi County. According to Nairobi
county records 2015, there are 24 medium and large supermarkets in Nairobi. The study used
primary data which was collected using self-administered questionnaires. The data collected was
analyzed using descriptive measures and presented in tables and charts. The study found out that
the supermarkets have adopted shopper marketing practices that include the use of free-standing
product display racks, end-aisle display, navigational signs (aisle directories, product markers),
free-standing advertisements, shelf advertisements, display bins, store staff, floor advertisements,
shopper cart advertisements and in-store flyers as the shopper marketing practices. The shopper
marketing practices were found to have an effect on sales performance as they increased sales
volume, stock turnover rate, average customer spend, number of sales units and efficiency in
service delivery.

vi
TABLE OF CONTENTS
DECLARATION........................................................................................................................... ii
DEDICATION.............................................................................................................................. iii
ACKNOWLEDGEMENT ........................................................................................................... iv
ABSTRACT ................................................................................................................................... v
LIST OF TABLES ....................................................................................................................... ix
LIST OF FIGURES ...................................................................................................................... x
CHAPTER ONE ........................................................................................................................... 1
INTRODUCTION......................................................................................................................... 1
1.1 Background of the Study .......................................................................................................... 1
1.1.1 The Concept of Shopper Marketing ................................................................................... 2
1.1.2 Shopper Marketing Practices ............................................................................................. 3
1.1.3 The Concept of Sales Performance .................................................................................... 4
1.1.4 Supermarkets in Kenya ...................................................................................................... 5
1.2 Research Problem ..................................................................................................................... 6
1.3 Research objectives ................................................................................................................... 7
1.4 Value of the study ..................................................................................................................... 8
1.5 Summary ................................................................................................................................... 8
CHAPTER TWO .......................................................................................................................... 9
LITERATURE REVIEW ............................................................................................................ 9
2.1 Introduction ............................................................................................................................... 9

vii
2.2 Theoretical foundation .............................................................................................................. 9
2.2.1 Fishbein Model ................................................................................................................. 10
2.2.2 The Rosenberg Model ...................................................................................................... 11
2.3 Consumer Behavior as an Aspect of Shopper Marketing ....................................................... 12
2.4 Shopper Marketing.................................................................................................................. 13
2.5 Sales Performance ................................................................................................................... 15
2.6 Shopper Marketing Practices and Sales Performance ............................................................ 17
2.7 Summary ................................................................................................................................. 18
CHAPTER THREE .................................................................................................................... 20
RESEARCH METHODOLOGY .............................................................................................. 20
3.1 Introduction ............................................................................................................................. 20
3.2 Research Design...................................................................................................................... 20
3.3 Population of the Study ........................................................................................................... 20
3.4 Data Collection ....................................................................................................................... 21
3.5 Data Analysis .......................................................................................................................... 22
3.6 Validation and Reliability Test ............................................................................................... 22
3.7 Summary ................................................................................................................................. 23
CHAPTER FOUR ....................................................................................................................... 24
DATA ANALYSIS, RESULTS AND DISCUSSION ............................................................... 24
4.1 Introduction ............................................................................................................................. 24
4.2 Response Rate ......................................................................................................................... 24
viii
4.3 Background Information of the Respondents and the Supermarkets..................................... 24
4.3.1 Number of years in position ............................................................................................. 24
4.3.2 Duration of supermarket operation .................................................................................. 25
4.3.3 Number of branches in Kenya .......................................................................................... 26
4.3.4 Sales collection per month ............................................................................................... 27
4.3.5 Number of Employees ...................................................................................................... 28
4.4 Shopper Marketing Practices .................................................................................................. 28
4.4.1 Shopper Marketing Practices ........................................................................................... 29
4.5 Sales Performance Indicators .................................................................................................. 30
4.6 Discussion ............................................................................................................................... 31
4.7 Summary ................................................................................................................................. 33
CHAPTER FIVE ........................................................................................................................ 34
SUMMARY, CONCLUSION AND RECOMMENDATIONS .............................................. 34
5.1 Introduction ............................................................................................................................. 34
5.2 Summary of Findings .............................................................................................................. 34
5.3 Conclusion .............................................................................................................................. 35
5.4 Limitations of the Study.......................................................................................................... 36
5.5 Recommendations for Policy and Practice ............................................................................. 36
5.6 Suggestion for further research ............................................................................................... 37
REFERENCES ............................................................................................................................ 38
APPENDIX I: QUESTIONNAIRE ........................................................................................... 42
APPENDIX II: LIST OF MEDIUM AND LARGE SUPERMARKETS .............................. 45
APPENDIX III: LETTER OF INTRODUCTION .................................................................. 46
ix
LIST OF TABLES
Table 4.1: Number of years in position ........................................................................................ 25
Table 4.2: Duration of supermarket operation .............................................................................. 25
Table 4. 3: Sales collection per month .......................................................................................... 27
Table 4. 4: Number of Employees ................................................................................................ 28
Table 4.5 : Shopper Marketing Practices ...................................................................................... 29
Table 4.6 : Sales Performance Indicators ..................................................................................... 31

x
LIST OF FIGURES
Figure 2. 1: Attitude components and manifestations. ................................................................... 9
Figure 4.1: Number of branches in Kenya .................................................................................... 26
1
CHAPTER ONE
INTRODUCTION
1.1 Background of the Study
There is widespread belief that many purchases are unplanned for, with 70 percent made in
stores.68 percent of which are impulse driven (Grocery Marketing Association, 2007). Five
percent of these shoppers are loyal to the brand of one product group. These statistics have
caused marketing investments to shift from consumer marketing to shopper marketing. Shopper
marketing also labeled as ‘in-store marketing’ is a set of marketing activities that comprise of
understanding the motivation, attitude and behavior of shoppers over the path to purchase and
the shopping cycle across all touch points. Organizations invest considerable resources inside the
store to influence shoppers. According to Grocery Marketing Association (2007), there is a
forecast of a compound annual growth rate of more than 20% for in-store marketing budgets.
Sales are an activity involving the selling of goods and services in return for money or other
compensation, which is initiated and completed by the seller, the owner of the goods. The first
step of the agreement to an acquisition is followed by the passing of the title and settlement of
the prices, the sales completes prior to payment and makes the payment obligatory. Sales
performance is the sum of all efforts that it takes to deliver a product or service, therefore is
measured in terms of items produced and services performed within a given time period
(Christenen,2001).
In the last fifteen years, the Kenyan supermarket scene has evolved from a rich man`s shopping
place to a one-stop-shopping place for both the middle and lower classes. Large supermarkets of
above 60,000 square feet referred to as hypermarkets have been established to provide for all

2
product categories pertaining to a category of needs. The development of hypermarkets has been
due to an increased demand for time and cost savings by consumers. Customers are value-based,
they demand for better value in terms of time and cost savings compared to buying bundled
products individually.
1.1.1 The Concept of Shopper Marketing
Shopper marketing is the planning and executing of all marketing activities that influence a
shopper along and beyond the entire path to purchase, from the point at which the motivation to
shop first emerges through to purchase, consumption, repurchase and recommendation (Shankar,
2011). According to Young (2009), Shopper marketing is brand marketing in the retail market. It
therefore includes category management, displays, sales, packaging, promotion, research and
marketing. Shopper marketing is involving. It entails understanding how one`s target consumers
behave as shoppers, in different channels and formats, and leveraging this intelligence to the
benefit of all stake-holders defined as brands, consumers, retailers and shoppers. Manufacturers
target portions of their marketing investment at specific retailers or retail environments. For
instance, supermarkets have several products under their own private label. Such targeting is
dependent on agreement of objectives, targets and strategies between the manufacturer and a
given retailer or given type of retail environment (Stahlberg and Maila, 2010).
When shoppers enter a store, they have different goals with an overall goal ranging from precise
to concrete (e.g. taking advantage of a particular promotion) to relatively abstract (e.g. to fill up
on weekly needs). Shopper marketers take it upon themselves to utilize each occasion. Shoppers’
responsiveness to marketing stimuli is an essential condition in research in retailing. Association
3
with stimuli is based on a deep understanding of shopper behaviour designed to build brand
equity, engage the shopper and lead him to purchase (Liberman and Warkslok, 2007).
Shopper marketing can extend outside the store to the place and time a customer decides to
purchase a product. Out of store activities include use of traditional media, new media, direct
marketing, loyalty, trade promotions, product modification and other marketing techniques.
Marketing activities carried out in-store often capture a shopper`s attention and therefore drives
up unplanned shopping. On trips which the shopper takes note of marketing information outside
the store environment, the shopper is likely to have engaged in planning (Bettman, 1979), so it
doesn`t affect unplanned buying.
1.1.2 Shopper Marketing Practices
Shopper marketing practices are adopted from the traditional marketing mix and thus can be
divided into the four P’s; Product, Price, Place and Promotion. Product represents size, shape,
color, material, packing messages and graphics. Price represents discounts, bundled offers, price
communication and coupons. Place represents store concept, lightning, shelves and placing of
special presentations.
Shopper marketing practices encompass in-store deals; promotions that are not store based.
Shopper marketing practices include promotional activity by retailers and manufacturers before a
shopper enters a store as well as in –store promotions. In-store promotions include end-aisle
displays, free standing product display racks, in-store flyers, navigational signs (aisle directories,
product markers),display bins, free standing advertisements, inflatables, pallet of featured
product, shelf advertisements, floor advertisements, coupon dispensers, freezer door

4
advertisements, video or interactive displays, shopper cart advertisements and use of store staff
to attract shoppers.
1.1.3 The Concept of Sales Performance
Organizational performance is the efficiency and effectiveness of the organization such that in
effectiveness there is a fit between the organization and its environment, its capabilities help it
achieve its mission, while efficiency is the cost per unit of output which should be much less
than the input. Organizational performance can thus mean; satisfactory profit (sales) or return on
investment (financial); the organization`s ability to satisfy its members e.g. employees, managers
and stakeholders; the organization`s ability to achieve its current goals and the organization`s
ability to continuously adapt to changes and survive in the changing environment. Traditionally,
performance has been assessed in terms of profits, sales, market share, productivity, debt ratios
and stock markets (March and Sutton, 1997).
Sales performance refers to the volume of sales achieved within a specified period compared to
predetermined sales levels. In manufacturing, labour, machines, raw material and semi-
manufactures are inputs for a certain method of production, and as such determinants of the
volume that is and can be produced (Siegler, 2010). Sales performance becomes the value of the
result of the price of a product or service deducted from all costs (supplies, materials, human
labor, etc) that go into the effort. An effective retailer tries to minimize the inputs to generate
higher outputs, where inputs are money and time and outputs are purchases and satisfaction.
Financial performance is a subjective measure of how well a firm can use assets from its primary
mode of business and generate revenues. This term is also used as a general measure of a firm’s
overall financial health over a given period of time, and can be used to compare similar firms.
5
1.1.4 Supermarkets in Kenya
A supermarket is a marketing intermediary that sells to ultimate consumers for their own use.
Supermarkets create utility for consumers, that is, the want-satisfying ability and value that an
organization adds to goods and services by making them more useful or accessible to consumers.
Supermarkets in Kenya mushroomed from upper income suburbs in large cities to middle class
and poorer consumer markets. The spread of supermarkets then advanced into `poorer and less
advanced countries` such as Uganda, Tanzania, Rwanda and South Sudan. Njenga (2006) noted
that Kenya`s advancement in supermarkets is evident from the fact that its five cities; Nairobi,
Mombasa, Kisumu, Nakuru and Eldoret have at least 165 supermarkets. The expansion of
Kenyan supermarkets is similar to that of South Africa (Njenga, 2006). Nakumatt has presently
expanded into Uganda, Tanzania, Rwanda, Burundi and South Sudan. Uchumi supermarkets
have also expanded into Tanzania, Rwanda and Uganda. Within these countries and also in
Kenya, supermarkets are spreading into secondary cities and smaller towns. Presently, Kenya has
over 300 supermarkets. (Economic Survey 2015). There are at least six big supermarkets which
include Nakumatt, Naivas, Tuskys, Uchumi, Ukwala with the smaller ones being Chandarana
(Food plus), Eastmatt and Tumaini supermarkets. This study limits itself to mainstream
supermarkets which can be described as supermarkets with more than 50 employees in day to
day activities and are of 15,000 to 60,000 square feet.
Supermarkets have also revolutionalized the products they offer and are rapidly penetrating into
urban food retailing, spreading beyond their initial tiny market niche into the food markets of
lower-income groups (Kiumbura, 2003).Having penetrated processed and staple foods much
earlier and faster then fresh foods, supermarkets have made in –roads into the fresh fruits and
vegetables category. The important changes in their procurement system bring significant

6
opportunities and challenges for smaller farmers and have implications for agricultural
diversification and rural development programs and policies (Neven, 2004).
Supermarkets in Kenya have moved to create brand differentiators in order to position
themselves differently, they have moved to have loyalty cards, 24 – hour shopping concept and
price uniformity across outlets than primarily focus on individual product categories and in-store
activities. The orientation of shopper marketing expands to multiple categories across all touch
points and channels including social media (Briesch et al. 2009).
1.2 Research Problem
Over the years there has been intensified focus in understanding the actual action of buying by a
consumer. There numerous possible reasons for this on the ‘moment of truth’ compared to other
perspectives on consumers (for example consumer needs, brand preferences, usage).One
explanation is that of traditional marketing approach is broken and has become separate from the
actual consumer who makes decisions to buy. Marketing must engage more with the shopper to
fix the model (Inman, Winer and Ferraro, 2009). There has been growing interest in shopper
marketing, which reflects organizations interest in managing their brands at retail and retailers’
interest in growing category demand and overall sales, including private label. Both
manufacturers and retailers also have an interest in enhancing the experience for shoppers on a
continual basis.
The ultimate goal of a company is to make profits hence improve sales performance. Thus firms
employ various competitive strategies in order to gain an edge over its competitors. Scheder
(2011) shows that shopper marketing incorporates the efforts of the firm to be competent in the
changing business environment and to excel in all key success factors. According to Shankar

7
(2011), shopper marketing is directly linked to sales performance. He argued that shopper-centric
marketing strategies amongst other things improve the sales performance of businesses. Positive
behavioral consequences for marketers allow a firm to achieve its financial goals. The
involvement of employees ensures ownership of these strategies with greater motivation for
implementation.
In Kenya, a number of studies have been done on the retailing industry. For instance, Karemu
(1993) studied the state of strategic management practices in retailing sector with a particular
focus on supermarkets in Nairobi. Lagat (1995) studied the state of marketing using online
activities in Kenya`s retail sector while Munyoki (1997) did an analysis of factors affecting
pricing strategies of selected consumer goods in the retail market with a specific focus on
supermarkets in Nairobi. Similarly, Njenga (2006) investigated the attitudes of selected
stakeholders towards growth strategies that were followed by large scale retailers in Kenya.
Kiumbura (2003) studied retailer brands and channel conflict of supermarkets in Nairobi.
Karanja (2011) looked at the extent of adoption of shopper marketing tools in supermarkets in
Kenya. It is worth noting that though studies have been done touching on aspects of
supermarkets, none has been undertaken on shopper marketing and the sales performance of
supermarkets. This study therefore seeks to establish the relationship between shopper marketing
and sales performance. The study will be guided by the following research question: What is the
effect of shopper marketing on the sales performance of supermarkets?
1.3 Research objectives
The study had two research objectives and these are ;
i. To determine shopper marketing practices of supermarkets in Nairobi, Kenya.
8
ii. To establish the effect of shopper marketing on the sales performance of supermarkets in
Nairobi.
1.4 Value of the study
The findings of this study are expected to be of importance to theory, practice and policy. In
practice, the study will provide insights to guide shopper marketing trends. It is anticipated that
this study will help management of supermarkets to be aware of shopper marketing practices and
their effect on sales performance. The study will also establish how product category
characteristics, customer characteristics and customer activities affect in-store as well as outside
the store decision making, by retail managers.
It is expected that the study will be of importance to academicians in that the knowledge
generated will enable other researchers to improve and develop a better understanding of shopper
marketing practices in the retail industry. By researching on this topic which has received little
attention mostly from local researchers, the study will also stimulate future scholars to further
research on shopper marketing.
In addition, it is hoped that the research findings will help the government in formulating
strategic policies for effective management and shaping of the industry. The study will provide
information for government and policy makers that will be relevant for ensuring that the retail
market industry is well regulated.
1.5 Summary
Chapter one provides an introduction to Background of the study, the Concepts of Shopper
Marketing, Shopper Marketing Practices and Sales performance. A brief history of supermarkets
in Kenya to the presented day is provided. The research problem is defined as well as the
research objectives and value of the study is discussed in brief.
9
CHAPTER TWO
LITERATURE REVIEW
2.1 Introduction
This chapter provides the theoretical foundation of shopper marketing, consumer behavior as an
aspect of shopper marketing, an overview of shopper marketing practice and its applicability
both in global and local arena. The section also contains an overview of sales performance and
how shopper marketing practices relate to sales performance.
2.2 Theoretical foundation
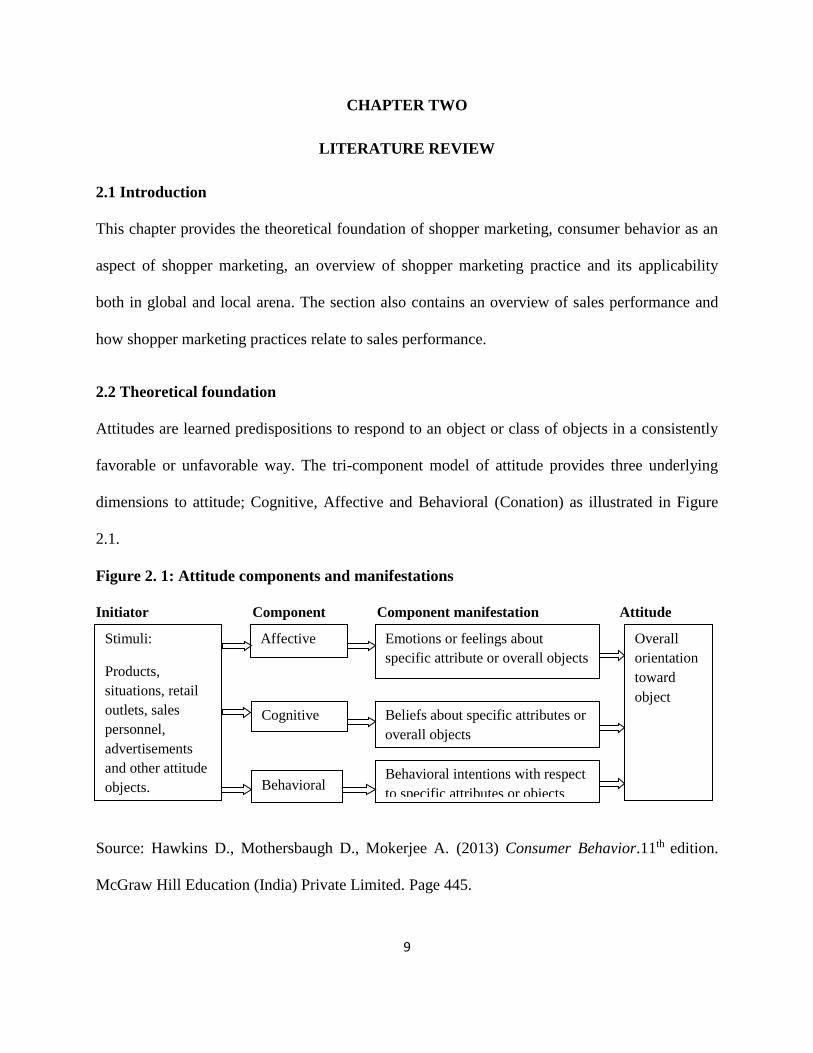
Attitudes are learned predispositions to respond to an object or class of objects in a consistently
favorable or unfavorable way. The tri-component model of attitude provides three underlying
dimensions to attitude; Cognitive, Affective and Behavioral (Conation) as illustrated in Figure
2.1.
Figure 2. 1: Attitude components and manifestations
Initiator Component Component manifestation Attitude
Source: Hawkins D., Mothersbaugh D., Mokerjee A. (2013) Consumer Behavior.11th edition.
McGraw Hill Education (India) Private Limited. Page 445.
Stimuli:
Products,
situations, retail
outlets, sales
personnel,
advertisements
and other attitude
objects.
Affective
Cognitive
Behavioral
Emotions or feelings about
specific attribute or overall objects
Beliefs about specific attributes or
overall objects
Behavioral intentions with respect
to specific attributes or objects
Overall
orientation
toward
object

10
The cognitive component consists of a consumer’s belief about an object. In logic the more
positive each belief is and easier it is for an individual to recall the beliefs, the more favorable
the overall cognitive component presumed to be. The affective component represents feelings or
emotional reactions to an object. The behavioral component refers to one’s tendency to respond
in a particular manner towards an object or activity. This component is reflected by tendencies to
seek out brands on store shelves or search for brand information. Actual behaviors reflect these
intensions as they are modified by the situation in which the behavior will occur. All the three
attitudes tend to be consistent so that a change in one attitude component leads to a related
change in the other attitude component.
Marketing managers are ultimately concerned with influencing behavior, which is difficult to
influence directly. It can be difficult to cause customers to buy, use or recommend their products.
However customers will often listen to sales personnel, attend to advertisements or examine
packages. Marketers can therefore indirectly influence behavior by providing information, music
or other stimuli that influence a belief or feeling about that product if the three components are
indeed consistent with each other. The multi-attribute models below, (Fishbein and Rosenberg)
of attitude explain how various cognitions or beliefs about an object, product or brand combine
to form a global attitude, the cognitive route to attitude change.
2.2.1 Fishbein Model
The Fishbein model tries to explain the formation of overall attitude by seeing the object as
having a set of consequences which could be desirable or undesirable. Attitude is the sum of
those weighted consequences, where each consequence is weighted by the evaluation of that
consequence, that is, how good or bad that consequence is.
11
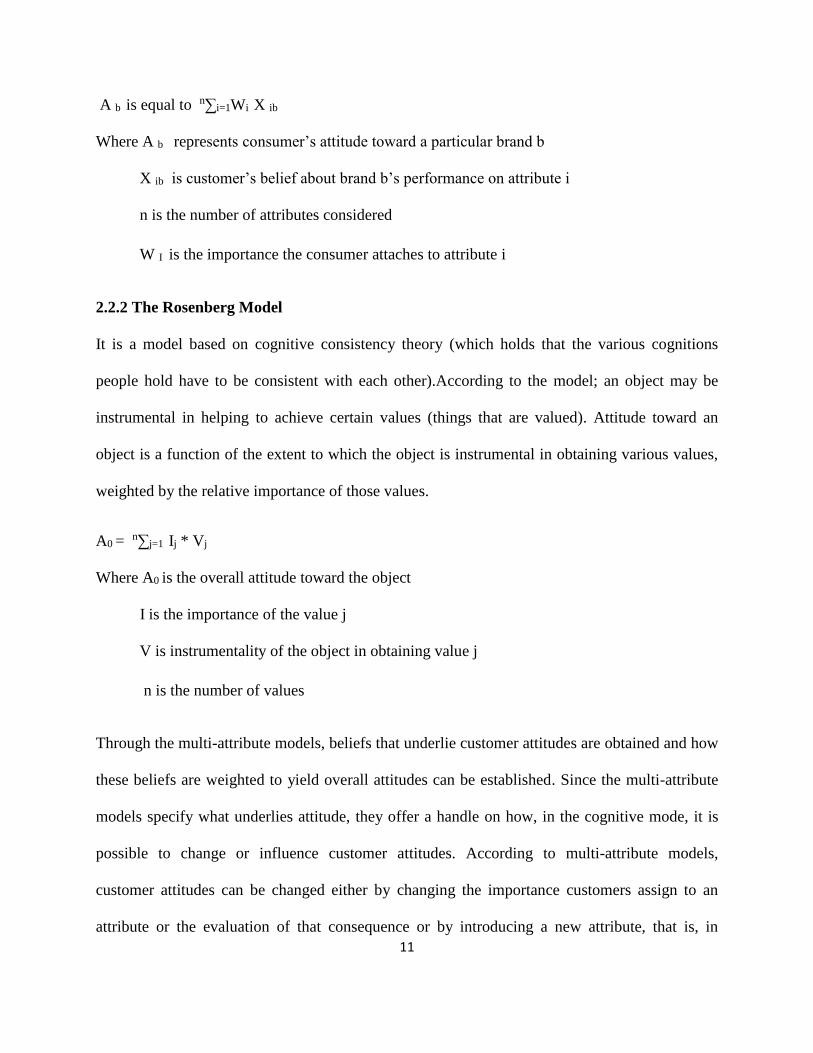
A b is equal to n∑i=1Wi X ib
Where A b represents consumer’s attitude toward a particular brand b
X ib is customer’s belief about brand b’s performance on attribute i
n is the number of attributes considered
W I is the importance the consumer attaches to attribute i
2.2.2 The Rosenberg Model
It is a model based on cognitive consistency theory (which holds that the various cognitions
people hold have to be consistent with each other).According to the model; an object may be
instrumental in helping to achieve certain values (things that are valued). Attitude toward an
object is a function of the extent to which the object is instrumental in obtaining various values,
weighted by the relative importance of those values.
A0 = n∑j=1 Ij * Vj
Where A0 is the overall attitude toward the object
I is the importance of the value j
V is instrumentality of the object in obtaining value j
n is the number of values
Through the multi-attribute models, beliefs that underlie customer attitudes are obtained and how
these beliefs are weighted to yield overall attitudes can be established. Since the multi-attribute
models specify what underlies attitude, they offer a handle on how, in the cognitive mode, it is
possible to change or influence customer attitudes. According to multi-attribute models,
customer attitudes can be changed either by changing the importance customers assign to an
attribute or the evaluation of that consequence or by introducing a new attribute, that is, in

12
evaluation criteria, into customers’ evaluation process or by changing a specific component
belief which can be done by changing the perception of the corresponding attribute level or
associated consequence.
2.3 Consumer Behavior as an Aspect of Shopper Marketing
Shopper behavior in the shopping cycle comprises search, evaluation, category/brand/item
choice, store choices, store navigation and post-purchase actions (Shankar, 2011).Shopping
marketing as a process can be addressed in the perspective of the Consumer Decision Process
Model. Need recognition occurs when an individual senses a difference between what he
perceives to be ideal versus the actual state of affairs. In the Problem Recognition stage,
memory, individual differences and environmental influences have interplay. Low involvement
purchase tends to be selective while high involvement purchase tends to be generic. In
Information Search stage, consumers will search for information internally from memory or
externally by collecting information from peers, family or workplace. A consumer`s decision
requires information on; the appropriate evaluation criteria for the solution of a problem, the
existence of various alternative solution and the performance level or characteristic of each
alternative solution on each evaluative criterion.
When evaluating alternatives, consumers use new or pre-existing evaluations stored in memory
to select products, services, brands and store that will most likely result in their satisfaction with
the purchase or consumption. Different consumers employ different evaluative criteria.
Evaluative criteria can become a product specific manifestation of an individual`s needs, values
or lifestyle. After deciding whether or not to purchase, the consumer moves to two phases;
choosing one retailer over the other and involving in-store choices influenced by sales people,

13
product displays, electronic media and point –of-purchase advertising. The final stage is the post-
purchase evaluation. Post purchase dissonance which is doubt or anxiety occurs in the process
after purchase. It occurs because the consumer is making a permanent commitment to a chosen
alternative. At this point the consumer may fail to use the product. Upon usage the product is
disposed of and further evaluation takes place. The consumer may be disappointed with the
product leading to complaint behavior. Alternatively, if the consumer has satisfaction (whereby
the consumer`s expectation is matched by perceived performance), repeat purchases occur as
well as increased use of product, brand loyalty, brand switching or discontinued use.
2.4 Shopper Marketing
Shopper marketing orientation focuses heavily on the shopper and shopper mode, compared to
traditional brand and consumption focus. Brand building is achieved through triggers in the
shopping cycle. This contrasts with traditional focus on awareness building and push-and-pull
marketing. Rather than primarily focus on individual product categories and in-store activities
the orientation of shopper marketing expands to multiple categories across all touch points and
channels including social media (Briesch et al. 2009)
The shopping cycle is more complex than purchase funnel because it reflects behavior in a more
complex shopping environment. Hansen and Singh (2009) argue that shopper marketing
characteristic should start long before one enters the store. Marketers need to find creative ways
to influence people at key points in the shopping cycle and develop relevant metrics for
monitoring behavior in an integrated way. Marketing Science Institute (2010) emphasized some
specific ways this plays out in practice. Marketing activities are based on shopper insights, a
distinct type of research and analysis that covers the entire consumer decision stream on the path
14
to purchase. Marketing activities are expected to build brand equity for both the manufacturer
and the retailer. There is often strategic collaboration with other retailers and other brands. This
approach opens up opportunities for targeting shoppers with activities designed specifically for
them. The fact that more than half of purchases are made in-store is highly motivating to shopper
marketers. It means that there is considerable untapped potential if they can find the right
marketing drivers.
Paying attention to the shopping behavior of customers is the essential part of being customer-
centric manufacturing company. The world of retailing is changing in ways that mean traditional
tools for connecting with customers are no longer adequate. As a result, many manufacturers are
employing shopper marketing strategies. By your products one can integrate attitudinal and
causal data that can give a 360-degree overview of the shopper and behavior. This can provide
for a rich experience for the shopper since we can observe the behavior, seek to understand it
with integrating attitudinal research and deliver relevant communication to the consumer.
Organizations must leverage the increasing investment in shopper marketing to create brand
value. Understanding the shopper follows a tried-time process. According to Van Heerde et.al
(2008), the following must be in place; shopper centric marketing; a shopper-centric culture; an
intimate household- level understanding; brilliant execution; continual
measurement/improvement and strategic collaboration. Most questions about shopper marketing
start from a brand or store-centric point of view. Capturing those that shopper purchases within
the stories more cost effective than acquiring new ones and reduces the risk of shoppers shifting
store preferences or loading their baskets on a shopper trip elsewhere. Consumer migration over
time becomes the key score-card for brand health (Tsiros, Michael and Hardesty, 2010).
Manufacturers need to make a commitment to identify interests, motivation and needs of their
15
most loyal shopper segments. Although shopper marketing has only really permeated the
marketing mainstream over the last few years, its proponents argue that it is an important move
away from short term and adversarial past of trade marketing and sales promotion tactics to a
more strategic marketing discipline that has a key role to play in an integrated marketing
approach. This is a strategy employed by companies in hard recessive times.
Shopper marketing in Kenya is adapted to a large extent by manufacturers and retailers. Karanja
(2011) established that manufacturers and retailers are increasingly investing in-store decision
making as evidenced by the projected growth rate of 21 percent for in-store marketing through
2010.Traditional marketing which includes television, print media and trade promotions is on the
decline compared to shopper marketing in Kenya. This is driven by the urgent need to develop
actionable insights capable of better influencing shoppers all along the path to purchase and
generate measurable results. Over 55 percent of manufacturers in the food, beverage, health and
beauty, and household product categories surveyed indicated an increase in investment in
shopper marketing by 5 percent annually in the last three years.
2.5 Sales Performance
Highly competitive environments, globalization, ever-growing amounts of performance data and
increasing pressure to do more with less made it imperative for firms to be demand driven. It is
no wonder that measuring, reporting and overall sales performance are hot topics. Companies in
every industry are seeking ways to get a clear, accurate view of sales performance. Essentially,
they need an effective, reliable approach to connect sales performance to financial results
(Clarke, 2007)
16
Christensen (2001)argues that the sales department contributes the largest in any organization`s
growth; the goal is to increase the number of interactions between potential customers and the
company using promotional techniques such as advertising techniques, sales promotions,
publicity and public relations, creating new sales channels or creating new products. It is used to
compare the effectiveness of the organization, department, workstation or individual to itself,
overtime for the same operation or with other counterparts. It can be expressed as partial, multi-
factor and total measures, partial measures are used to analyze characteristics in terms of a single
input, multi-factor measure is used to analyze the utilization of multiple inputs, and total
productivity express the ratio of overall output produced to all resources used.
Cameron et al. (2009) says that performance is the quantum of sales done by a sales person
within a given time period, which can be measured by value of sales, number of sales units and
quality of sales persons which increases with work experience in a given environment, are found
to be good at product knowledge, understanding the company and the client`s needs, network of
contacts, references and his overall experience which results in increased productivity of the
company.
According to a research done by Hernant (2009) on profitability performance of supermarkets,
the challenge that retail managers face is that of making decisions and taking actions, in order to
satisfy consumers needs and wants and respond to the actions of competitors. Companies are
changing their organizational structure to support shopper-centric marketing to focus on the
needs of the consumer. This involves allocating resource, creating departments within the
marketing department which are dedicated to research, program development, relationship
management and the execution of shopper marketing initiatives.

17
Levy (2007) discusses retail store management as characterized by highly complex operations,
comprising tasks that are long-term as well as short-term which involve strategic features e.g. the
selection of the store location, issues on price, merchandise and service attributes as well as
operational issues on scheduling staff members, organizing daily routines, monitoring and
evaluating current performance. Consumers will choose stores depending on price image
perceptions (Hansen and Singh 2009), breadth and depth of assortment, location, convenience,
ability to do one-stop shopping and store service as important element in store positioning.
2.6 Shopper Marketing Practices and Sales Performance
Top performers in shopper marketing are becoming more sophisticated in their efforts. They are
putting more and better resources into shopper marketing, investing in the toolsets to help make
more strategic decisions, and working hard to recruit and train the right people. Most important,
the leaders are doing so faster than other companies, many of which are adopting a wait-and-see
attitude or approaching shopper marketing tentatively through ad hoc experimentation. As a
result, the sophistication gap between top performers and everyone else is getting wider, and the
slower moving companies find themselves at risk of being left behind. Companies with advanced
shopper marketing capabilities report that their initiatives perform significantly better at driving
company-level results such as boosting top line growth, driving value from relationships, and
building brand equity. They report one and a half times greater effectiveness than the less
sophisticated group at achieving results across all shopper marketing objectives. They have
overcome key challenges such as obtaining executive sponsorship and funding, and are putting
the planning and evaluation infrastructure in place to even further improve shopper marketing
effectiveness.
18
Shopper marketing effectiveness at company level generates competitive advantage by
minimizing the cost of in-store programs, building brand equity, driving new product
development and innovation, generating relevance with retail partners, and by meeting retailer
requirements. Less advanced companies often struggle to resource their emerging shopper
marketing initiatives. They face insufficient funding and lack of appropriate skill-sets and talent.
Often lacking executive buy-in or organizational understanding of the importance of shopper
marketing, they are unable to secure the commitment for additional headcount and programs.
They tend to conduct their programs on an ad hoc basis (68 percent of companies in this group)
versus as part of a formal planning process.
Once the programs are in place, an average respondent rating their shopper marketing programs
effectiveness at achieving objectives is done, on a scale of 1(not at all effective) to 5 (very
effective).More sophisticated companies report greater effectiveness across all shopper
marketing objectives. Drivers of differences in shopper marketing effectiveness include inability
to generate/obtain shopper insights, lack of executive sponsorship , availability of appropriate
capabilities/skill-sets, insufficient head count budget, and inconsistent understanding of shopper
marketing within the organization. Less sophisticated companies struggle with resourcing,
planning and measurement. Tellingly, respondents acknowledge that some industry leaders are
miles ahead in their shopper marketing journey, yet none have given up the chase.(Grocery and
Manufacturers Association, Deloitte Consulting, 2008).
2.7 Summary
The theoretical background provides an insight into the possible attitude change strategies that
marketers can use to influence shopper marketing behavior. This is further elaborated by the

19
Fishbein and Rosenberg Multi-attribute Models. Shopper marketing heavily borrows from
Consumer Behaviour as suggested. Shopper Marketing Practices and Sales Performance are
examined in detail and their relationship is reviewed as postulated.

20
CHAPTER THREE
RESEARCH METHODOLOGY
3.1 Introduction
This chapter puts into focus the methodology that was used. It specifically discusses the research
design, population of the study, the data collection and the data analysis techniques.
3.2 Research Design
Research design provides the conceptual framework within which the research is conducted: It
constituted the blue print or roadmap for the collection, measurement and analysis of data
(Kothari,2007).The study adopted a descriptive cross sectional survey design which according to
Kothari (2004) is structured to examine a number of logical sub-units or units of analysis within
an organization.
Morris and Wood (1991) acknowledged the importance of cross sectional survey design
especially when the intent is gaining broader understanding of the research and the processes
being enacted. Moreover, they argue that the design has considerable ability to generate answers
to questions of Why? What? and How? of the phenomenon being researched. Nachmias and
Nachmias(2007) pointed out that a researcher can employ a survey design to measure variables
or test hypothesis using survey data collection instruments to get a feel of the population or
industry. This kind of study was used to determine the effect of shopper marketing practices on
sales performance.
3.3 Population of the Study
Population refers to an entire group of individuals, events or objects having common
characteristics that can be observed and measured (Yin, 2003).The target population of this study
was all medium and large supermarkets in Nairobi County. These supermarkets were selected on
21
the assumption that they were in a better position to be implement shopper marketing due to their
growth focus. According to Nairobi county records 2015, there are 24 medium and large
supermarkets in Nairobi. A medium-sized supermarket is one that has 50 employees to 149
employees while a large supermarket has above 150 employees. Due to the small size of the
population, the researcher carried out a census hence each supermarket had a subject who was
the source of information required. An appendix of the list of supermarkets is attached for
reference.
3.4 Data Collection
In this study, primary data was collected using questionnaires. A questionnaire as a data
collection instrument of choice is easy to formulate and administer and also provides a relatively
simple and straight forward approach to the study of attitudes, values, beliefs and
motives(Robson,2002).Questionnaires were also preferred because they ensured a high response
rate as the questions are distributed to complete and collected by the researcher. They also
require less time and energy to administer, offer the possibility of anonymity because subjects
names are not required on the completed questionnaire.
The questionnaire was administered to each supermarket’s branch/marketing manager or the
equivalent using two methods. Self administered questionnaires, where respondents were asked
to complete the questionnaires themselves. In this case, the questionnaires were hand delivered
and picked. Follow up calls were made to ensure that the questionnaires were dully filled within
a reasonable period of time. The researcher-administered questionnaire method, where the
researcher used the questionnaire to interview the respondents was also used. This was necessary
where subjects were not able to interpret the questions. The researcher guided the respondents
22
where applicable to ensure that the information gathered was valid, reliable and suitable for the
study.
3.5 Data Analysis
Based on the data evaluation instruments, quantitative and qualitative data analytical techniques
were utilized. Qualitative data was analyzed through thematic summary analysis where responses
were grouped into themes, summarized and grouped data presented in prose. Descriptive
statistics included measures of central tendency and measures of variation. Once the data was
collected, the questionnaires were edited for accuracy, consistency and completeness.
However before final analysis was performed data was cleaned to eliminate any discrepancies
and thereafter, classified on the basis of similarity and then tabulated. The responses were coded
into numerical form to facilitate statistical analysis. The questionnaire was analyzed based on
descriptive analysis. In particular, mean scores, standard deviations, percentages and frequency
distribution were used to summarize the responses and to show the magnitude of similarities and
differences. Results were presented in tables and charts.
3.6 Validation and Reliability Test
To measure the validity and reliability of the instrument, a pilot study was done where the
questionnaire was administered to two supermarkets prior to the actual collection of data.
Content validation was used to measure the degree to which data collected using the
questionnaire represented a specific domain of indicators or content of the particular concept.
The questionnaire contained sales performance indicators such as increase in sales volume,
increase in average customer spend, increase in stock turnover rate, and increase in number of
sales units as well as efficiency in service delivery. The test-retest technique was used as a

23
reliability test. It involved administering the same instrument twice to the same group of
subjects. This was done with the aim of establishing the measure of degree to which the research
instrument yielded consistent results after repeated trials.
3.7 Summary
The research design adopted was of a descriptive cross-sectional design. This was believed to be
able to generate to questions as to Why? What? And How? Of the phenomenon researched. The
target population was of all medium and large supermarkets in Nairobi County, where medium
sized supermarkets had 50 to 149 employees and large supermarkets had employees above
150.The data collection method was discussed briefly as well as the data analysis techniques
used. The validity of the data collection instrument used and its reliability was then assessed.
24
CHAPTER FOUR
DATA ANALYSIS, RESULTS AND DISCUSSION
4.1 Introduction
The research objective was to determine the effect of shopper marketing practices on sales
performance of medium and large supermarkets, Nairobi County. This chapter presents the
analysis, findings and discussion. The findings are presented in percentages and frequency
distributions, mean and standard deviations.
4.2 Response Rate
A total of 24 questionnaires were issued out and only 22 were returned. This represented a
response rate of 92%. This response rate was adequate for data analysis and conforms to
Mugenda and Mugenda (2003) stipulation that a response rate of 70% and over was adequate.
4.3 Background Information of the Respondents and the Supermarkets
The background information considered in the study was the number of years in the current
position, duration of supermarket operation, number of branches, sales per month and the
number of employees.
4.3.1 Number of years in position
The respondents were requested to indicate the number of years in the position. Duration of
service in the position was important for the study in order to determine the respondents’ level of
understanding on the marketing practices that have been adopted by the supermarket and its
effects. The results are presented in Table 4.1.
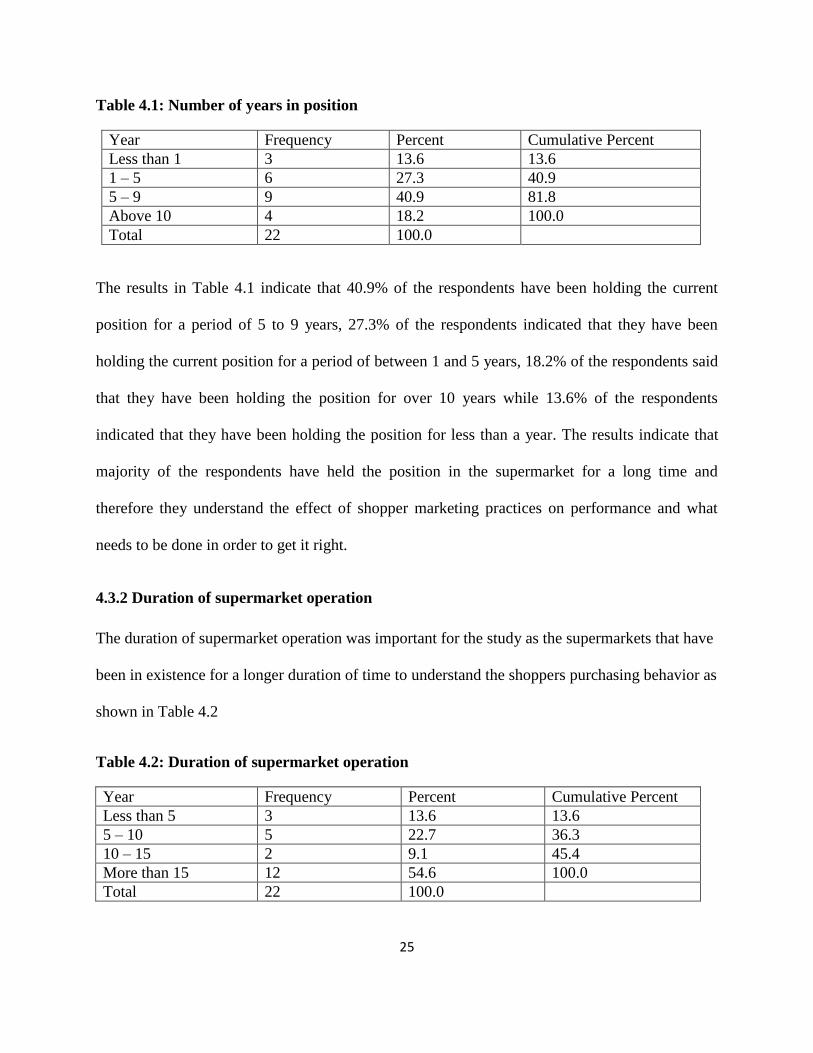
25
Table 4.1: Number of years in position
Year Frequency Percent Cumulative Percent
Less than 1 3 13.6 13.6
1 – 5 6 27.3 40.9
5 – 9 9 40.9 81.8
Above 10 4 18.2 100.0
Total 22 100.0
The results in Table 4.1 indicate that 40.9% of the respondents have been holding the current
position for a period of 5 to 9 years, 27.3% of the respondents indicated that they have been
holding the current position for a period of between 1 and 5 years, 18.2% of the respondents said
that they have been holding the position for over 10 years while 13.6% of the respondents
indicated that they have been holding the position for less than a year. The results indicate that
majority of the respondents have held the position in the supermarket for a long time and
therefore they understand the effect of shopper marketing practices on performance and what
needs to be done in order to get it right.
4.3.2 Duration of supermarket operation
The duration of supermarket operation was important for the study as the supermarkets that have
been in existence for a longer duration of time to understand the shoppers purchasing behavior as
shown in Table 4.2
Table 4.2: Duration of supermarket operation
Year Frequency Percent Cumulative Percent
Less than 5 3 13.6 13.6
5 – 10 5 22.7 36.3
10 – 15 2 9.1 45.4
More than 15 12 54.6 100.0
Total 22 100.0

26
The results in Table 4.2 show that 54.6% of the supermarkets have been in existence for more
than 15 years, 22.7% of the respondents said that the supermarkets have been in operation for a
period of between 5 and 10 years, 13.6% of the respondents said that the supermarkets have been
in operation for less than 5 years while 9.1% of the respondents indicated that the supermarkets
have been in operation for a period of between 10 and 15 years. The results show that majority of
the supermarkets have been in operation for more than 5 years and therefore they understand the
competitive nature of the industry and the effect of shoppers practices on performance of the
supermarkets.
4.3.3 Number of branches in Kenya
The respondents were requested to indicate the number of branches the medium and large
supermarket have in Kenya. This was important for the study as the number of branches the
supermarket has indicates the size of the supermarket and the market share they hold, as
presented in Figure 4.1.
Figure 4.1: Number of branches in Kenya

27
The findings on the number of supermarkets the supermarkets have indicates that 45.4% of the
respondents said that the supermarkets have more than 15 braches, 27.3% of the respondents said
that the supermarkets have between 10 and 15 supermarkets, 18.2% of the respondents indicated
that the supermarkets have 5 to 10 branches while 9.1% of the respondents said that the
supermarkets have less than 5 branches. The results indicate that the supermarkets have several
branches and this enable the supermarkets increase the number of customers they have in order
to improve their performance thus the need to understand their customers.
4.3.4 Sales collection per month
The monthly sales collection for the month question was intended to determine the movement of
goods in the supermarket as this would indicate the frequency of shoppers to the supermarket as
tabulated on Table 4.3.
Table 4. 3: Sales collection per month
Sales Frequency Percent Cumulative Percent
11-20 million 3 13.6 13.6
21-30 million 4 18.2 31.8
31-40 million 6 27.3 59.1
Above 51 million 9 40.9 100.0
Total 22 100.0
The results in Table 4.3 indicate that 40.9% of the respondents said that the supermarkets sales
collection for the month was above 51 million, 27.3% of the respondents said that the
supermarkets sales was between 31 and 40 million, 18.2% of the respondents said that the
supermarkets sales was 21 to 30 million while 13.6% of the respondents indicated the sales level
to be between 11 and 20 million. The results show that the sales per month for the supermarkets
28
varied and this can be attributed to the number of branches, shoppers visiting the supermarket,
prices of goods in the supermarket and the marketing practices that are used by the supermarket.
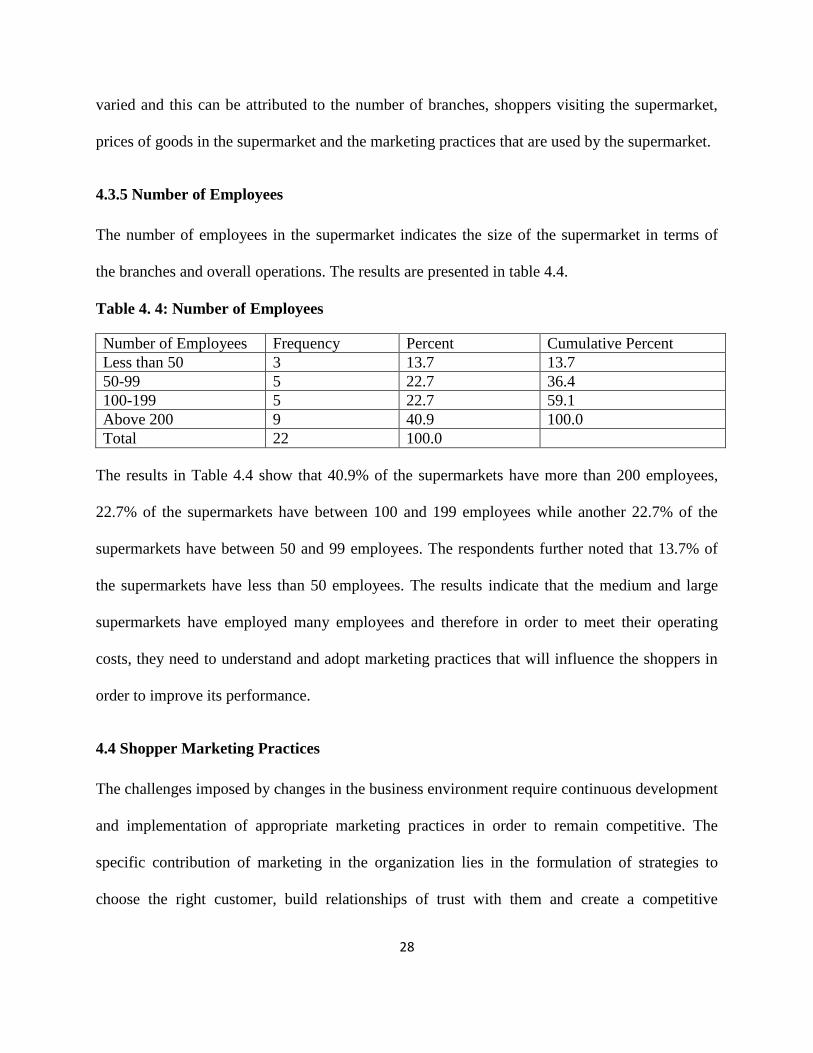
4.3.5 Number of Employees
The number of employees in the supermarket indicates the size of the supermarket in terms of
the branches and overall operations. The results are presented in table 4.4.
Table 4. 4: Number of Employees
Number of Employees Frequency Percent Cumulative Percent
Less than 50 3 13.7 13.7
50-99 5 22.7 36.4
100-199 5 22.7 59.1
Above 200 9 40.9 100.0
Total 22 100.0
The results in Table 4.4 show that 40.9% of the supermarkets have more than 200 employees,
22.7% of the supermarkets have between 100 and 199 employees while another 22.7% of the
supermarkets have between 50 and 99 employees. The respondents further noted that 13.7% of
the supermarkets have less than 50 employees. The results indicate that the medium and large
supermarkets have employed many employees and therefore in order to meet their operating
costs, they need to understand and adopt marketing practices that will influence the shoppers in
order to improve its performance.
4.4 Shopper Marketing Practices
The challenges imposed by changes in the business environment require continuous development
and implementation of appropriate marketing practices in order to remain competitive. The
specific contribution of marketing in the organization lies in the formulation of strategies to
choose the right customer, build relationships of trust with them and create a competitive

29
advantage. Therefore, for the organization to cope with the outside world of customers and
competitors, it is necessary to understand the shopper marketing practices.
4.4.1 Shopper Marketing Practices
The use of shopper marketing practices was undertaken in order to determine the practices that
are mostly adopted by the supermarkets in order to improve their sales in a five point Likert
scale. The range was ‘very low extent (1)’ to ‘very great extent’ (5). The scores of respondents’
low level of practice usage represent a variable which had a mean score of below 3.0 while the
scores of above 3.0 represent respondents’ agreement with the usage of marketing practice. A
standard deviation of >0.9 implies a significant difference on the impact of the variable among
respondents.
Table 4.5 : Shopper Marketing Practices
Shopper Marketing Practices Mean Std. Deviation
End-aisle display 4.2545 1.2140
Free-standing product display racks 4.3364 .9902
In-store flyers 3.4053 .8268
Navigational signs(aisle directories, product markers) 3.9545 1.1512
Display bins 3.7636 .7583
Free-standing advertisements 2.8643 .9598
Inflatable (advertisements that are inflated ) 2.7227 1.0059
Pallet of featured product 2.5273 .8827
Shelf advertisements 3.8273 .7558
Floor advertisements 3.7345 .8230
Coupon dispensers/tear-off pads 2.8049 1.0500
Store staff 3.7818 .7724
Refrigerator/freezer door advertisements 2.7615 .8123
Video or interactive displays or kiosks 2.2483 .8239
Shopper cart advertisements 3.4412 1.2238
30
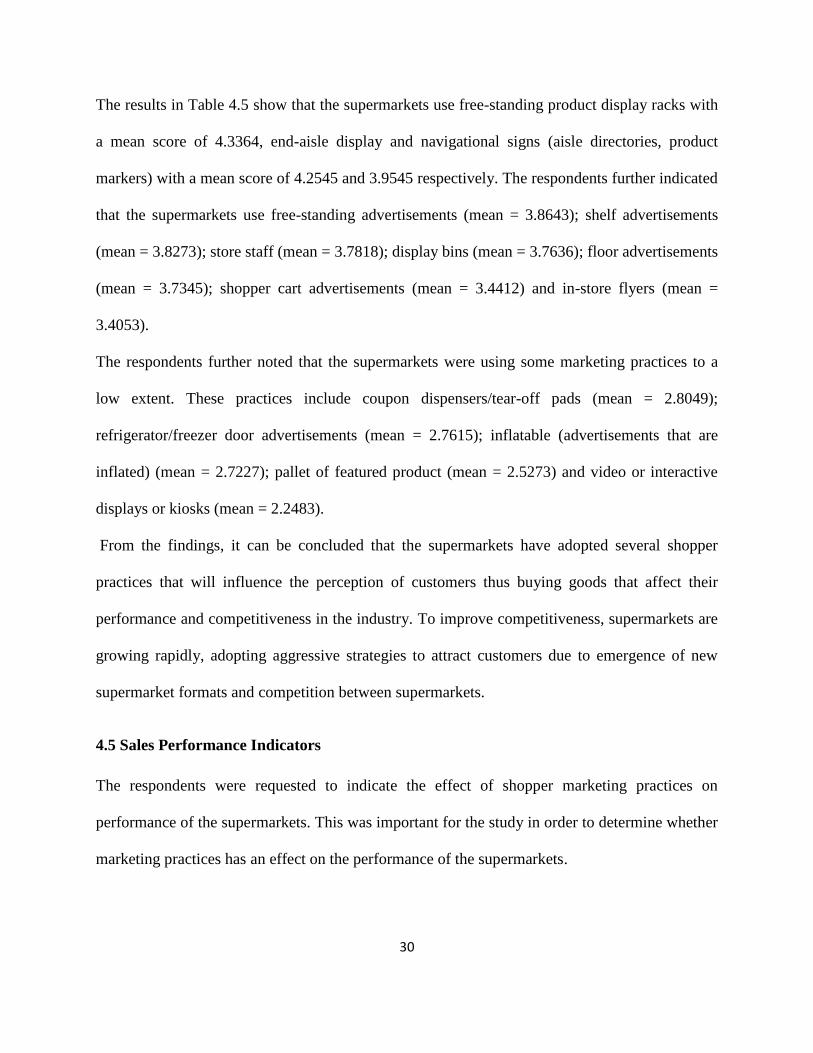
The results in Table 4.5 show that the supermarkets use free-standing product display racks with
a mean score of 4.3364, end-aisle display and navigational signs (aisle directories, product
markers) with a mean score of 4.2545 and 3.9545 respectively. The respondents further indicated
that the supermarkets use free-standing advertisements (mean = 3.8643); shelf advertisements
(mean = 3.8273); store staff (mean = 3.7818); display bins (mean = 3.7636); floor advertisements
(mean = 3.7345); shopper cart advertisements (mean = 3.4412) and in-store flyers (mean =
3.4053).
The respondents further noted that the supermarkets were using some marketing practices to a
low extent. These practices include coupon dispensers/tear-off pads (mean = 2.8049);
refrigerator/freezer door advertisements (mean = 2.7615); inflatable (advertisements that are
inflated) (mean = 2.7227); pallet of featured product (mean = 2.5273) and video or interactive
displays or kiosks (mean = 2.2483).
From the findings, it can be concluded that the supermarkets have adopted several shopper
practices that will influence the perception of customers thus buying goods that affect their
performance and competitiveness in the industry. To improve competitiveness, supermarkets are
growing rapidly, adopting aggressive strategies to attract customers due to emergence of new
supermarket formats and competition between supermarkets.
4.5 Sales Performance Indicators
The respondents were requested to indicate the effect of shopper marketing practices on
performance of the supermarkets. This was important for the study in order to determine whether
marketing practices has an effect on the performance of the supermarkets.
31
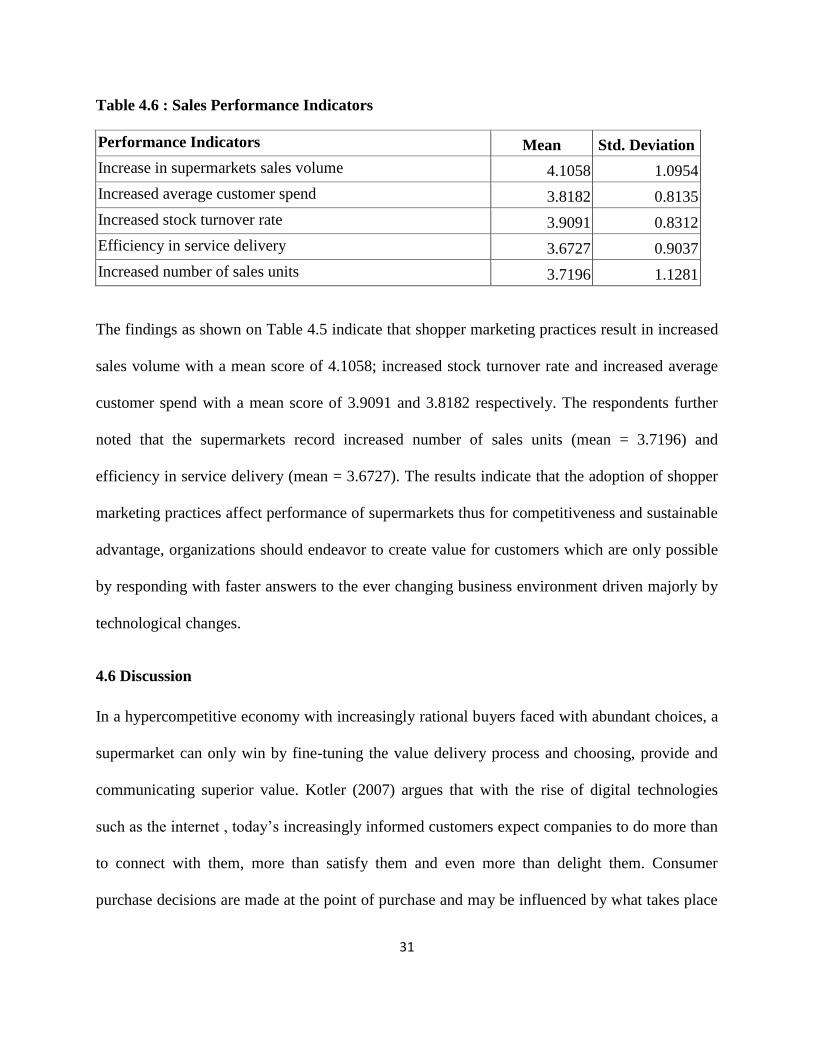
Table 4.6 : Sales Performance Indicators
Performance Indicators Mean Std. Deviation
Increase in supermarkets sales volume 4.1058 1.0954
Increased average customer spend 3.8182 0.8135
Increased stock turnover rate 3.9091 0.8312
Efficiency in service delivery 3.6727 0.9037
Increased number of sales units 3.7196 1.1281
The findings as shown on Table 4.5 indicate that shopper marketing practices result in increased
sales volume with a mean score of 4.1058; increased stock turnover rate and increased average
customer spend with a mean score of 3.9091 and 3.8182 respectively. The respondents further
noted that the supermarkets record increased number of sales units (mean = 3.7196) and
efficiency in service delivery (mean = 3.6727). The results indicate that the adoption of shopper
marketing practices affect performance of supermarkets thus for competitiveness and sustainable
advantage, organizations should endeavor to create value for customers which are only possible
by responding with faster answers to the ever changing business environment driven majorly by
technological changes.
4.6 Discussion
In a hypercompetitive economy with increasingly rational buyers faced with abundant choices, a
supermarket can only win by fine-tuning the value delivery process and choosing, provide and
communicating superior value. Kotler (2007) argues that with the rise of digital technologies
such as the internet , today’s increasingly informed customers expect companies to do more than
to connect with them, more than satisfy them and even more than delight them. Consumer
purchase decisions are made at the point of purchase and may be influenced by what takes place
32
there (Jobber, 2010). Thus, there is need to understand the shopper’s situational factors which
might influence his or her buying decision process. The study established that the supermarkets
use free-standing product display racks, end-aisle display, navigational signs (aisle directories,
product markers), free-standing advertisements, shelf advertisements, display bins, store staff,
floor advertisements, shopper cart advertisements and in-store flyers as the shopper marketing
practices. This was found to be consistent with Turley and Chebat (2002) findings that the
environment created by retail managers is an important strategic variable, being able to affect the
shopping behaviour.
Wilburn (2011) noted that shoppers marketing practices are major contributors in the sales
performance of a company and it helps a company do business in accordance with its objectives
and it helps many companies achieve their targets or realign their objectives. Marketing practices
are important in business as it helps convince potential customers buy a company’s product it is
more important due to many company’s offering similar products a marketer must take his time
to persuade and convince potential buyers buy their products. The adoption of shoppers
marketing practices by the supermarkets was found to have an effect on its performance as it
increased sales volume, stock turnover rate, average customer spend, number of sales units and
efficiency in service delivery. Hansen and Singh (2009) established that companies with
advanced shopper marketing capabilities report that their initiatives perform significantly better
at driving company-level results such as boosting top line growth, driving value from
relationships, and building brand equity. They report one and a half times greater effectiveness
than the less sophisticated group at achieving results across all shopper marketing objectives.

33
4.7 Summary
Background information on respondents considered for data analysis included the number of
years the respondents had worked for the supermarket. A majority of the respondents had held
the position of branch/marketing manager for a moderately long period of time (above 5
years).The duration of the supermarkets existence determined its growth. The longer it had been
in existence, the more the number of branches it had and the higher the number of employees it
had. Shopper Marketing Practices used most frequently included free-standing product displays
racks, end-aisle display and navigational signs while those least frequently used included video
or interactive kiosks, pallet of featured products, inflatables amongst others.

34
CHAPTER FIVE
SUMMARY, CONCLUSION AND RECOMMENDATIONS
5.1 Introduction
The chapter is outlined into summary of the findings, conclusions, recommendations, limitations
of the study and suggestions for further research.
5.2 Summary of Findings
The study established that the supermarkets duration of operation varied and for the ones which
have been in operation for a longer period of time they understand the challenges facing the
industry and the marketing strategies that ensures that the supermarket compete effectively. The
study found out that the supermarkets have several branches and therefore they can reach many
customers in different parts of the county and these impacts positively on its performance. The
sales per month for the supermarkets was found to be over 11 million for all the supermarkets
although it varied and this can be attributed to the size, number of branches and the marketing
strategies that have been put in place by the supermarkets. The number of employees in the
supermarkets was found to vary with the supermarket and therefore in order to meet its
operations costs, they need to understand and adopt marketing practices that will influence the
shoppers in order to improve its performance.
Shopping marketing practices was found by the study to have been used by the supermarkets.
The practices were found to be free-standing product display racks, end-aisle display,
navigational signs (aisle directories, product markers), free-standing advertisements, shelf
35
advertisements, display bins, store staff, floor advertisements, shopper cart advertisements and
in-store flyers as the shopper marketing practices.
Marketing plans help companies and organizations employ shopper marketing practices that will
help them realize both their long-term and short-term objectives. The effectiveness of shopper
marketing practices has to be captured by the additional sales of a product over and above those
that would have happened in absence of any marketing or promotion. The sales performance of
the supermarkets was found to have been affected by the shopper marketing practices as it
resulted in increased sales volume, stock turnover rate, average customer spend, number of sales
units and efficiency in service delivery.
5.3 Conclusion
Today’s consumers are highly knowledgeable and demanding. For supermarkets to succeed in
the competitive environment, they have to be responsive to the needs and wants of their target
customers better than competitors. The supermarkets have come to realize that understanding,
meeting and anticipating customer needs is probably the most important source of sustained
competitive advantage. To gain competitive advantage and increase organizational effectiveness,
it is paramount to focus attention on improving shopper marketing practices as a way of
differentiation. Supermarket services are likely to directly expand demand for all items sold by
attracting more consumers. Supermarkets, like other forms of enterprises, do business with the
core reason of increasing sales thus making profit. The factors underlying the buying behavior of
customers need be improved. To improve the customer base, the supermarkets need to position
themselves strategically, in terms of location, shopper marketing practices and space. The study
found out that the performance of the medium and large supermarkets is dependent on the
36
effectiveness of shopper marketing practices and therefore for the supermarkets to have
competitive advantage over its competitors, they need to ensure that the customers interests are
well taken care off through the practices.
5.4 Limitations of the Study
The study used key informants from the medium and large supermarkets which put constraints
on the generalizability of the results to other firms and other country contexts. The sample
selection may also limit the generalization of results to the overall population. The narrow and
specific focus of this study means the results are limited to medium and large supermarkets only
which may not translate to other industry and national contexts.
The other limitation of this study is that the supermarkets are spread all over the country but only
medium and large supermarkets have been taken into consideration. For collecting data from all
over the country, a large amount of financial resources and huge time are required. The findings
of the current study may be applicable only to the retailers (medium and large markets).
5.5 Recommendations for Policy and Practice
The study found out that shopper marketing practices enables the supermarkets to improve their
sales performance, it is recommended that the medium and large supermarkets should adapt and
develop their marketing practices in line with the conditions in the business environment, and
with their internal capabilities, as they are able to exploit the full potential of shopper marketing
practices and achieve superior sales performance.
The study established that the medium and large supermarkets have adopted shopper marketing
practices and it is recommended that customer satisfaction strategies should be implemented to
attract, retain and improve customer loyalty. This would improve supermarket performance.

37
Management need to have a thorough understanding of customer beliefs, behaviors, product or
service attributes and competitors.
The study has shown the importance of shopper marketing practices on sales performance. The
identification of shopper marketing practices will help practitioners to establish effective
marketing practices. It is very important to understand marketing practices from customers' point
of view, and whether these practices are parallel to customers’ perceptions, expectations, needs
and goals. Knowing this, may assist managers to develop marketing practices based on
consumers' perceptions and meanings of the product.
5.6 Suggestion for further research
The study was undertaken in the service industry in Nairobi County which is dominated by a few
supermarkets. A further research should be undertaken to further explore the nature of shopper
marketing practices in employing bigger samples and carrying out a more detailed analysis of
firms. This study should be undertaken on other sectors in order to compare the findings and
draw conclusions on the influence of shopper marketing practices.

38
REFERENCES
Briesch, R., Pradeep C. and Fox C.J. (2009).How does assortment affect grocery store
choice? Journal of Marketing Research, 46(4), pp.176-89.
Cameron A., Ewen M., Ross-Degnan D., Ball D.,Laing R.(2009) Medicine prices,
availability and affordability in 36 developing and middle-income countries: a
secondary analysis. The Lancet, Volume 373, pp. 240-249.
Christensen, C.M. (2001) The Past and Future of Competitive Advantage. Massachusetts
Institute of Technology Sloan Management Review, Volume 42, Number 2.
Grocery and Manufacturers Association, Deloitte Consulting (2008) Delivering the
Promise of Shopper Marketing: Mastering Execution for Competitive Advantage.
Hansen, Karsten and Singh V. (2009) Market structure across retail formats, Marketing
Science 28(4), 656-73.
Hawkins D., Mothersbaugh D., Mokerjee.A. (2013) Consumer Behavior, 11th Edition.
McGraw Hill Education (India) Private Limited.
Hernant, Mikael, Thomas Andersson & Olli-Pekka Hilmoli (2007) Managing retail chain
profitability based on local competitive conditions-Preliminary analysis,
International Journal of Retail and Distribution Management, Volume 35, No.11,
Pages 912-935.
Inman,J., Russell S. Winer and Ferraro R. (2009).The Interplay among Category
Characteristics, Customer characteristics and Customer Activities on In-Store
Decision Making. Journal of Marketing, 73(5), 19-2.
Karanja, D.M. (2011) The extent of the adoption of shopper marketing in Kenya.
Unpublished MBA Project.
39
Karemu C.K.(1993) The state of strategic management practices in supermarkets in
Nairobi. Unpublished MBA Project.
Kiumbura, G. (2003) Retailer brands and channel conflicts of supermarkets in
Nairobi. Unpublished MBA Project.
Kothari,C.R. (2004) Research Methodology: Methods and Techniques,2nd Edition. New
Delhi: New Age International Publishers.
Lagat K. (1995) The state of marketing using on-line activities in Kenya’s retail
Section. Unpublished MBA Project.
Liberman N., Wakslak C., Trope Y. (2007) Construal Levels and Psychological Distance:
Effects on Representation, Prediction, Evaluation, and Behavior. Journal of
Consumer Psychology, 17(2), 83-95.
March J.G, Sutton R.I. (1997). Organizational Performance as a dependant variable.
Organizational Science, 8(6), 698-706
Morris H., Wood R. (1991).Testing the Survey Method: Continuity and Change in British
Industrial Relations. Work, Employment and Society, 06/1991; 5(2):259-282.
Munyoki, J.M. (1997) Factors affecting the pricing strategies of selected consumer
goods in supermarkets in Nairobi. Unpublished MBA Project.
Nairobi County Records (2015) List of supermarkets within Nairobi County.
Neven. D. (2004) The Rapid Rise of Kenyan Supermarkets: Impact on the Fruits and
Vegetables Supply System.2004.
40
Njenga, J. (2006) The attitudes of selected stakeholders towards growth strategies of
large scale retailers in Kenya. Unpublished MBA Project.
Perez Casas,T.E. Herman,A.J.Ford (2001).The market profitability relationship. An
empirical assessment of major assertions and contradictions. Strategic
Management Journal, 3,377-394
Scherder R., Blatt R.(2011) Shopper intimacy: A practical guide to leveraging
marketing intelligence to drive retailer success. New Jersey Financial Times
Press.
Siegler, K.J. (2010) The U.S. Retail Industry: Are CEO`s Paid for Performance?
International Review of Business and Social Sciences Vol.1, No.4 (33-39)
Shankar V.et al (2011) Innovations in Shopper Marketing. Current Insights and Future
Research Issues, New York, Elsevier Inc.
Stahlberg M., Maila V. (2010) Shopper Marketing: How to increase purchase decisions
at the point of sale. Kogan Page Publishers,
Tsiros, Michael and Hardesty (2010) Ending a Price Promotion; Retracting it in One Step.
Journal of Marketing Research, 25(January), 345-364.
Van Heerde H., Gijsbrechts E. and Keen Pauwels K. (2008) Winners and Losers of a
Major Price War. Journal of Marketing Research, 45(October), 499-518.
Verhoef R. (2010) Customer Engagement as a New Perspective in Marketing.
Marketing Institute Science.

41
Young H. (2009) Does In-Store Marketing Work? Effects of the Number and Position of
Shelf Facings on Brand Attention and Evaluation at The Point of Purchase.
Journal of Marketing, 73(11), 1-17.
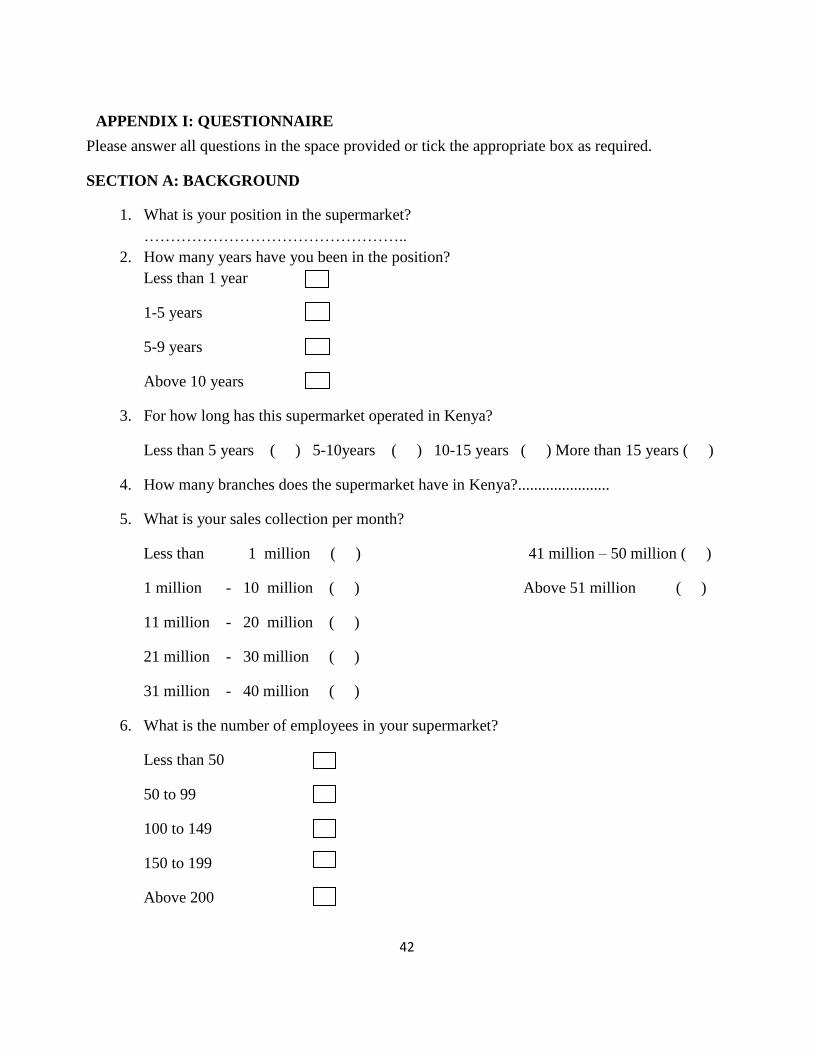
42
APPENDIX I: QUESTIONNAIRE
Please answer all questions in the space provided or tick the appropriate box as required.
SECTION A: BACKGROUND
1. What is your position in the supermarket?
…………………………………………..
2. How many years have you been in the position?
Less than 1 year
1-5 years
5-9 years
Above 10 years
3. For how long has this supermarket operated in Kenya?
Less than 5 years ( ) 5-10years ( ) 10-15 years ( ) More than 15 years ( )
4. How many branches does the supermarket have in Kenya?.......................
5. What is your sales collection per month?
Less than 1 million ( ) 41 million – 50 million ( )
1 million - 10 million ( ) Above 51 million ( )
11 million - 20 million ( )
21 million - 30 million ( )
31 million - 40 million ( )
6. What is the number of employees in your supermarket?
Less than 50
50 to 99
100 to 149
150 to 199
Above 200
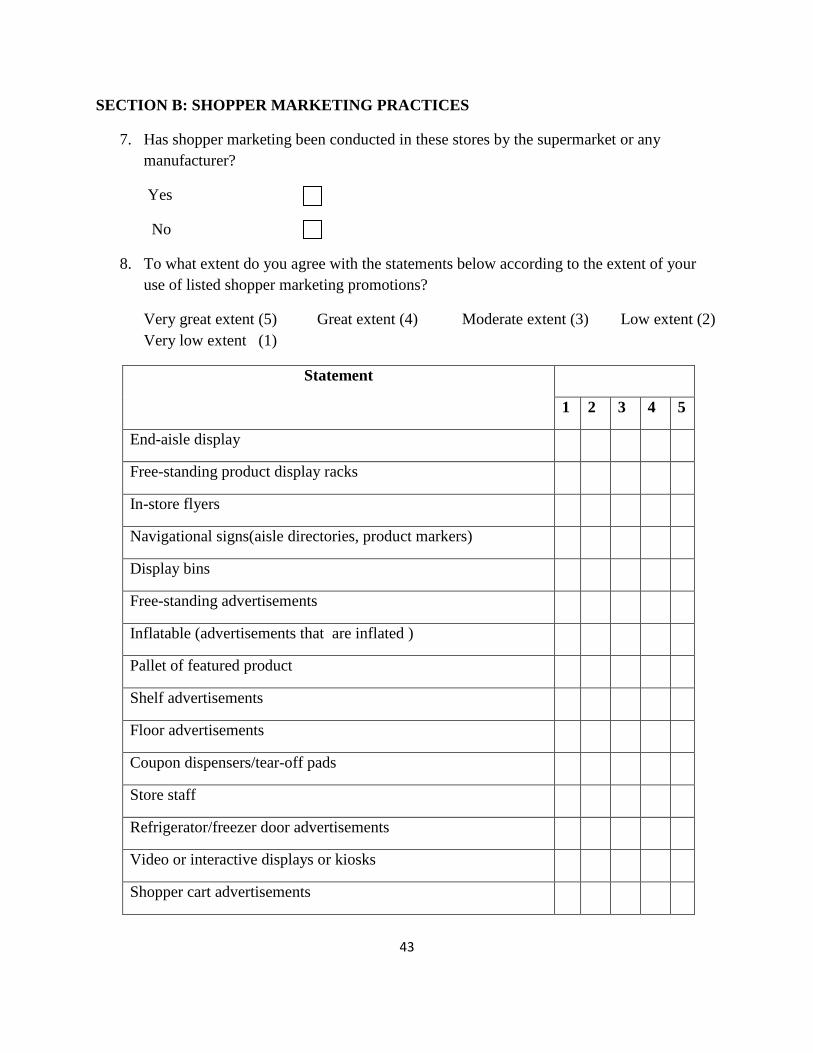
43
SECTION B: SHOPPER MARKETING PRACTICES
7. Has shopper marketing been conducted in these stores by the supermarket or any
manufacturer?
Yes
No
8. To what extent do you agree with the statements below according to the extent of your
use of listed shopper marketing promotions?
Very great extent (5) Great extent (4) Moderate extent (3) Low extent (2)
Very low extent (1)
Statement
1 2 3 4 5
End-aisle display
Free-standing product display racks
In-store flyers
Navigational signs(aisle directories, product markers)
Display bins
Free-standing advertisements
Inflatable (advertisements that are inflated )
Pallet of featured product
Shelf advertisements
Floor advertisements
Coupon dispensers/tear-off pads
Store staff
Refrigerator/freezer door advertisements
Video or interactive displays or kiosks
Shopper cart advertisements
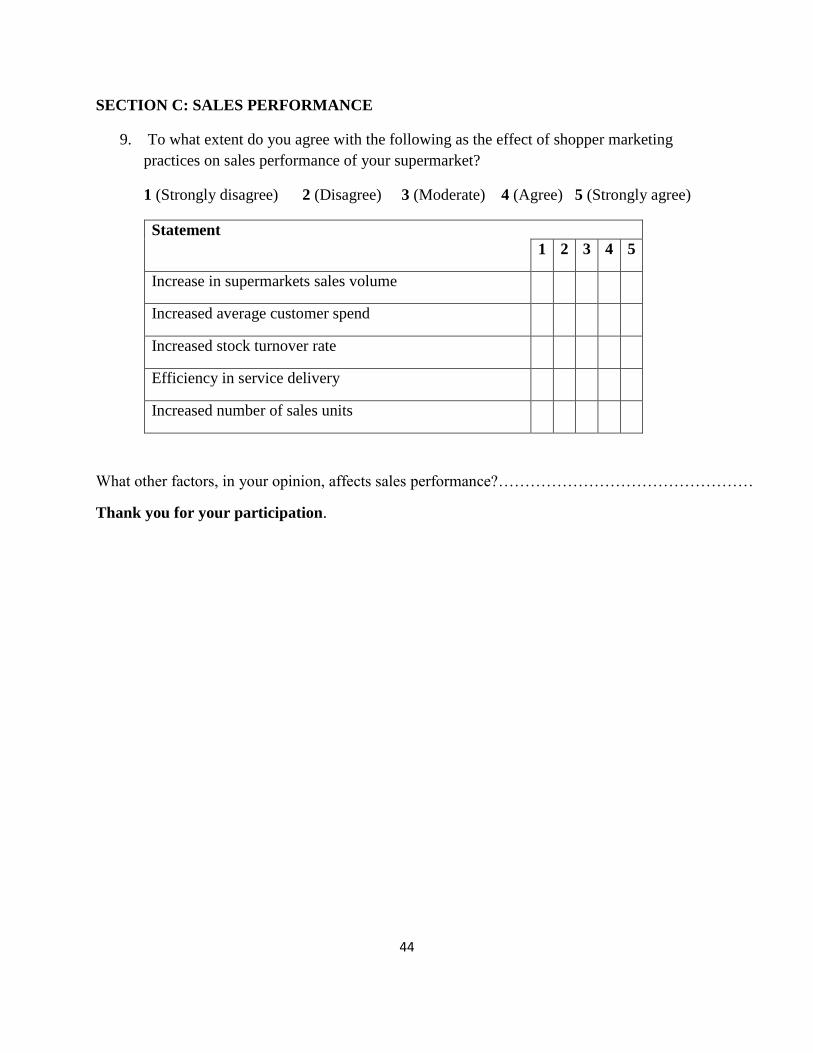
44
SECTION C: SALES PERFORMANCE
9. To what extent do you agree with the following as the effect of shopper marketing
practices on sales performance of your supermarket?
1 (Strongly disagree) 2 (Disagree) 3 (Moderate) 4 (Agree) 5 (Strongly agree)
Statement
1 2 3 4 5
Increase in supermarkets sales volume
Increased average customer spend
Increased stock turnover rate
Efficiency in service delivery
Increased number of sales units
What other factors, in your opinion, affects sales performance?…………………………………………
Thank you for your participation.
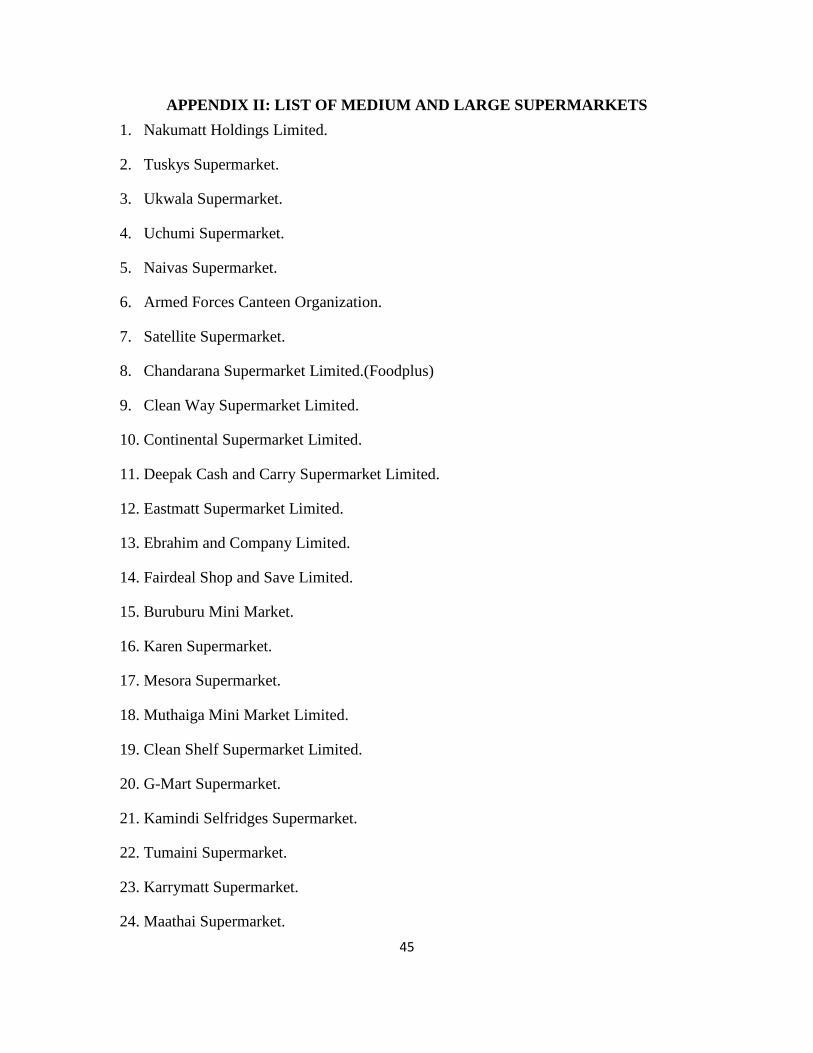
45
APPENDIX II: LIST OF MEDIUM AND LARGE SUPERMARKETS
1. Nakumatt Holdings Limited.
2. Tuskys Supermarket.
3. Ukwala Supermarket.
4. Uchumi Supermarket.
5. Naivas Supermarket.
6. Armed Forces Canteen Organization.
7. Satellite Supermarket.
8. Chandarana Supermarket Limited.(Foodplus)
9. Clean Way Supermarket Limited.
10. Continental Supermarket Limited.
11. Deepak Cash and Carry Supermarket Limited.
12. Eastmatt Supermarket Limited.
13. Ebrahim and Company Limited.
14. Fairdeal Shop and Save Limited.
15. Buruburu Mini Market.
16. Karen Supermarket.
17. Mesora Supermarket.
18. Muthaiga Mini Market Limited.
19. Clean Shelf Supermarket Limited.
20. G-Mart Supermarket.
21. Kamindi Selfridges Supermarket.
22. Tumaini Supermarket.
23. Karrymatt Supermarket.
24. Maathai Supermarket.

46
APPENDIX III: LETTER OF INTRODUCTION
Maureen Oyuga
P.O.BOX 10922
00100
Nairobi.
Dear Sir/Madam,
Re: Collection of Survey Data.
I am a post-graduate student at the University of Nairobi, School of Business pursuing a Master’s
degree in M.B.A (Marketing).Part of this course entails undertaking a research study in order to
fulfill the requirements of the degree program.
My research topic is ‘The effect of shopper marketing practices on the sales performance of
medium and large supermarkets in Nairobi County’. This is to kindly request your
permission in collection of data by filling out the accompanying questionnaire which will be
filled by the marketing manager.
The information that you provide will be used exclusively for academic purposes and as such
will be treated with total confidentiality.
Your co-operation will be highly appreciated.
Maureen Oyuga