Embed Size (px)
Citation preview
UNIVERSITY OF LJUBLJANA
Faculty of Mechanical Engineering
Effect of recycling and additives on physical
properties of Polypropylene (PP)
A Master’s thesis of the second-cycle master’s study programme in
MECHANICAL ENGINEERING – a research and development programme
Carlos Alamar Tarazona
Ljubljana, July 2020


UNIVERSITY OF LJUBLJANA
Faculty of Mechanical Engineering
Effect of recycling and additives on physical
properties of Polypropylene (PP)
A Master’s thesis of the second-cycle master’s study programme in
MECHANICAL ENGINEERING – a research and development programme
Carlos Alamar
Adviser: dr. assist. prof. Lidija Slemenik Perše
Ljubljana, July 2020


v
Acknowledgements
I would like to thank first and foremost my working mentor dr. assist. prof. Lidija
Slemenik Perše, and the group of workers that have helped me in the creation of this thesis,
specially Alen Oseli for his advices and patience. Also, I would like to thank the University
of Ljubljana and in particular the Mechanical Facuty for giving me a chance to study and
present this thesis. Finally, I would like to thank my sister Marta, who has helped me and
supported me during the creation of this thesis.

vi
vii
Declaration
1. I, the undersigned Carlos Alamar Tarazona, born 3 November in Valencia 1998, a
student at the Faculty of Mechanical Engineering at the University of Ljubljana, hereby
declare that this master’s thesis titled Effect of recycling and additives on physical
properties of Polypropylene (PP) is my own original work created under the supervision
of my advisor dr. assist. prof. Lidija Slemenik Perše.
2. I hereby declare that the submitted electronic copy of this master’s thesis is identical to
the printed copy.
3. Pursuant to the provisions of the Copyright and Related Rights Act (Official Gazette of
the Republic of Slovenia, No. 21/1995 as amended), I hereby expressly give my
permission for this master’s thesis to be published on the websites of the Faculty of
Mechanical Engineering and the University of Ljubljana.
4. By signing this Declaration, I grant my permission for this master’s thesis to be made
publicly accessible online via the Repository of the University of Ljubljana.
By signing this document, I certify that:
‐ the presented text is the product of my own original research in its entirety;
‐ the presented text adheres to linguistic and stylistic conventions and the technical
requirements of the Guidelines for Composing Final Theses, meaning that:
‐ the works and opinions of other authors used in master’s thesis are appropriately cited
or acknowledged pursuant to the Guidelines for Composing Final Theses, and
‐ I have obtained the permission for the use of any data and original work reproduced in
the text in full (either as text or as a graphic) from their respective authors and duly
noted that in the text itself;
‐ I am aware that plagiarism, i.e. the misrepresentation of someone else’s work (be it text
or graphics) as my own, is a crime under the Criminal Code of the Republic of Slovenia
(Official Gazette of the Republic of Slovenia, No. 55/2008 as amended);
‐ I am aware of the potential repercussions concerning my status at the Faculty of
Mechanical Engineering at the University of Ljubljana as per the applicable Rules should
plagiarism be proven in connection to the submitted master’s thesis.
Ljubljana, July 2020 Signature of the author:__________________

viii
ix
Abstract (in English)
UDC 123.45:678.91:234.56(789.1)
Serial No.: MAG II/866 E
Effect of recycling and rejuvenating agents on physical properties of
Polypropylene (PP)
Carlos Alamar Tarazona
Keywords: physical properties
polypropylene
recycling
additives
molecular weight
polymer
Plastic waste grows every year, therefore the recyclability of plastics has been studied vastly
to get the higher performance of the used polymers. In this thesis, the effects of recycling
and rejuvenating agents are explained in a polymer commonly know as polypropylene (PP).
First, a wide theoretical overview where the physical properties (thermal, mechanical and
rheological) are explained and their dependence with the structure and molecular weight and
methods of recycling are presented. Later, the effects of the recycling process and how
physical properties decrease with the molecular weight reduction and extruding cycles are
explained. Also, the study of the addition of the additives is explained in this thesis and how
physical properties are increased, depending on the different types of fillers or
concentrations. This thesis is supported by several studies that enable the understanding of
the behavior of recycled PP; moreover, the results of different experiments are shown.

x
xi
Povzetek (in Sloven)
UDC 123.45:678.91:234.56(789.1)
Serial No.: MAG II/866 E
Vpliv recikliranja in pomlajevalnih dodatkov na fizikalne lastnosti
polipropilena
Ključne besede: fizikalne lastnosti
polipropilen
recycling
aditivi
molekulska masa
polimeri
Količina plastičnih odpadkov vsako leto močno narašča, zato je mnogo razisakv usmerjenih
v recikliranje z namenom dobiti višjo učinkovitost recikliranih plastičnih odpadkov. V
predstavljeni nalogi so razloženi vplivi recikliranja in pomlajevalnih dodatkov recikliranemu
polipropilenu. Najprej so obširno predstavljene teoretične osnove z razlago fizikalnih
lastnosti (termične, mehanske in reološke) in vpliv na strukturo in molekulsko maso.
Predstavljene so tudi metode recikliranja. V drugem delu so predstavljeni procesi
ekstrudiranja, vplivi procesa recikliranja in sprememba fizikalnih lastnosti z molekulsko
maso. V nalogi so predstavljene tudi raziskave vpeljave pomlajevalnih dodatkov in vpliv
vrste in koncentracije dodatkov na fizikalne lastnosti. Magistrska naloga je podkrepljena z
vrsto raziskav iz literature, ki omogočajo razumeti obnašanje recikliranega polipropilena.
Predstavljeni so tudi rezultati različnih eksperimentov.

xii
xiii
Table of contents
1. Introduction ........................................................................ 1
1.1 Background ...............................................................................................1
1.2 Objectives ..................................................................................................1
2 Theoretical background..................................................... 3
2.1 Physical properties of polymers ...............................................................5
2.1.1 Thermal properties ..................................................................................5
2.1.1.1 Viscoelasticity of polymers ............................................................................8 2.1.1.2 Effect of temperature ................................................................................... 12
2.1.2 Rheological behavior ............................................................................ 13
2.1.2.1 Flow behavior .............................................................................................. 13 2.1.2.2 Oscillatory behavior ..................................................................................... 15
2.2 Recycling of polymers ............................................................................. 18
2.2.1 Methods of recycling ............................................................................ 19
2.2.2 Ambiguities and solutions of recycling.................................................. 21
3 Literature research .......................................................... 25
3.1 Effect of recycling on physical properties .............................................. 25 3.1.1 Effect of recycling on thermal properties ......................................................... 25 3.1.2 Effect of recycling on mechanical properties ................................................... 28 3.1.3 Effect of recycling on rheological properties ...................................................... 30
3.2 Effect of rejuvenating agents on physical properties of recycled
polypropylene .......................................................................................................... 35 3.2.1 Effect of additives on thermal properties ......................................................... 36 3.2.2 Effect of additives on mechanical properties ...................................................... 41 3.2.3 Effect of additives on rheological properties ...................................................... 44
4 Conclusions ....................................................................... 49
5 Bibliography ..................................................................... 51

xiv

xv
List of figures
Figure 2.1: Classification of polymers, based on the structure of macromolecules [1]. ....................3
Figure 2.2: Classification of polymers based on thermal response [1]. ............................................4
Figure 2.3: Effect of temperature on volume for amorphous, elastomers and thermosets polymer (a) and semi crystalline polymer (b) [3]. .......................................................................................6
Figure 2.4: Classical DSC thermogram for example of A.) amorphous and B.) semi-crystalline polymers [5]. ..........................................................................................................................7
Figure 2.5: Different responses of a) elastic and b) viscoelastic materials to external loads [1]. .......8
Figure 2.6:Creep process in polymers [1]. ......................................................................................9
Figure 2.7: Relaxation process in polymers [1]. ............................................................................ 10
Figure 2.8: Effect of molecular structure on creep (a) and relaxation (b) process [1]. .................... 11
Figure 2.9:Effect of temperature in creep (a) and relaxation (b) process in the case of shear loading [1]. ....................................................................................................................................... 12
Figure 2.10: Isochronal curves for shear relaxation modulus in a) time and b) frequency domain [2]. ....................................................................................................................................... 13
Figure 2.11: Layers of sliding fluid layer one over another [7]. ..................................................... 13
Figure 2.12: Different flow behavior of polymers [8]. .................................................................. 15
Figure 2.13: Stress-strain response of polymers during oscillation tests [10]. ................................ 16
Figure 2.14: Effect of molecular weight in viscosity (a) and viscoelastic properties (b) [12]. ......... 17
Figure 2.15: Effect of molecular weight distribution on viscosity and viscoelastic properties [12]. 18
Figure 2.16: Differences between thermoplastics (upper part) and thermosets in recycling [13]. ... 19
Figure 2.17: Percentage of recycled plastic [14]. .......................................................................... 20
Figure 2.18:Stages of recycling in a processing plant [15]. ........................................................... 21
Figure 2.19: Chain scission in polymer [16]. ................................................................................ 22
Figure 2.20:Steps of thermal degradation [17]. ............................................................................. 23
Figure 3.1: Change in the average molecular weight with extrusion cycles [20]. ........................... 26
Figure 3.2: Relation between Tg and average molecular weight [21]. ............................................ 26
Figure 3.3: Enthalpy of fusion as a function of Molecular Weight for polyethylene [22]. .............. 27
Figure 3.4: Schematic representation on the effect of recycling on phase transition temperatures of PP. ....................................................................................................................................... 28
Figure 3.5: Elongation at break depending on extrusion cycles [24]. ............................................. 29
Figure 3.6: Change of Young's modulus with the number of extrusions [24]. ................................ 29
Figure 3.7: Effect of recycling on the time dependent properties of two types of polyethylene [24]. ............................................................................................................................................. 30
Figure 3.8:Variation of MFI with extrusions [24]. ........................................................................ 31
Figure 3.9: Effect of recycling on complex viscosity [27]. ............................................................ 32
Figure 3.10: Cole-Cole plot for viscosity of recycled PP [26]. ...................................................... 32
Figure 3.11: Effect of recycling on storage modulus G' for virgin PP (P1), three times recycled PP (P2) and five times recycled PP (P3) [28].............................................................................. 33
Figure 3.12:Crossover point for virgin polypropylene (V), three times recycled PP (R3) and seven times recycled PP (R7) [28]. ................................................................................................. 34
xvi
Figure 3.13:Phase shift with the frequency [28]. ........................................................................... 35
Figure 3.14: Effect of SGWP on melting temperature of recycled PP [31]. ................................... 37
Figure 3.15: Effect of GnP on crystallization temperature for different PP samples [32]. .............. 37
Figure 3.16: Effect of different concentration of talc nanocomposites on 𝑇𝑐(left) and 𝑇𝑚.(right) [33] ...................................................................................................................................... 38
Figure 3.17: Effect of additives on crystallization rate [34]. .......................................................... 39
Figure 3.18: Effect of 𝐶𝑎𝐶𝑂3 in thermal conductivity of recycled PP (rPP) and virgin PP (vPP) [35]. ..................................................................................................................................... 40
Figure 3.19: Effect of BAL additives on thermal degradation of recycled PP (rPP) [33]. ............... 40
Figure 3.20: Effect of graphite nanocomposites on tensile strength [36]. ....................................... 41
Figure 3.21: Effect of graphene nanocomposites on Young's modulus measured in parts per hundred (PHR)[36]. .............................................................................................................. 42
Figure 3.22:Effect of the addition of long glass fibers on tensile strength for the recycled PP [38].42
Figure 3.23: Stress-strain curves for different PP compositions [39]. ............................................ 43
Figure 3.24: Effect of nanocomposites content on impact strength ................................................ 44
Figure 3.25: Effect of additives on processability of PP [43]......................................................... 45
Figure 3.26: Dependence of MFI a) and the viscosity b) on the percentage of ZnO [45]. ............... 46
Figure 3.27: Dependence of MFI a) and viscosity b) on the concentration of SiO2 [47]. ................ 46
Figure 3.28:Dependence of viscosity on the weight percentage of oligomer [27]. ......................... 47
Figure 3.29: Storage modulus (G'') over frequency for different PP composites ............................ 47
Figure 3.30: Effect of silica and PEG additive on loss modulus [50]. ............................................ 48

xvii
List of tables
Table 2.1: Viscoelastic functions of polymers .............................................................................. 11

xviii
xix
List of symbols used
Symbol Unit Meaning
A m2 surface area
D Pa-1 creep compliance
E Pa Young's modulus
E Pa relaxation modulus
F N force
∆G J Gibb's free energy
G' Pa storage modulus
G'' Pa loss modulus
H J enthalphy
K W K-1m-1 thermal conductivity
Mw G mol-1 molecular weight
S J entropy
T K temperature
P Pa, bar pressure
V m3 volume
X degree of crystallization
𝛼 W K-1m-1 thermal expansion
ε strain
ε elongation
η Pa s dynamic viscosity
σ Pa stress
φ Rd phase shift
τ Pa shear stress
γ shear strain
ω Hz frequency
ρ Kg m-3 density
ȳ s-1 shear rate
Index
0 initial
c crystallization
e equilibrium
g glassy state
i index
m molten state

xx
xxi
List of acronyms used
Acronym Meaning
BAL Boehmite Aluminia
C Graphite
CaCO3 Calcium carbonate, nanopowder
CB Carbon black
CNT Carbon nanotubes
CO2 Cabon dioxide
DMA Dynamic Mechanical Analysis
DSC Differential Scanning Calorimetry
GN Graphene
GPC Gel Permeation Chromatography
HALS Hindered Amine Light Stabilizers
HDPE High Density Polyethylene
MFI Melt Flow Index
Mw Molecular weight
PET Polyethylene terephthalate
PI Polydispersity
PP Polypropylene
PS Polystyrene
PVC Polyvinyl chloride
SiO2 Oxidum of silica
SGWPF Stone Groun Wood Pulp Fillers
SS Shrimp shells
UV Ultraviolete
UTS Ultima Tensile Stress
ZnO Zinc oxide, nanopowder

xxii
1
1. Introduction
1.1 Background
In today’s world, the consume of polymers is increasing every year, with a bigger
production than 300 million tonnes of plastic since 2018. This yearly increase has negative
consequences as the increase of plastic waste produces an environmental impact that has led
to several studies of the recyclability of the polymers, only being recycled less than 15% of
plastics in the world. The main problem with recyclability is the different structures that the
polymer present, not allowing thermosets to be recycled, and the continued loss of physical
properties e.g. molecular structure, viscosity, degree of crystallinity or Young’s modulus.
This is due to the extrusion process, which starts the degradation of the polymer by several
factors as oxidation or chain scission. The loss of physical properties negatively affects the
final performance of recycled polymers only being useful with the introduction of additives
that improve the properties to the virgin polymers levels.
In this thesis, Polypropylene was chosen to research the effects of recycling and
rejuvenating agents on physical properties. Polypropylene belongs to the polyolefin group
and is one of the most used polymers in the world. This is because the ease of PP to be
produced due to the high meltig point, lower density or higher toughness compared to the
rest of the polymers or the several uses it can have. It is stimated than more than 50 tonnes
of polypropylene are produced yearly in the world and the levels increase yearly.
1.2 Objectives
In this masther thesis, the effect of recycling and the addition of additives on the internal
structure of polymers is going to be studied. This effect characterises the final performance
of the polymer and the properties of final polymer product. The starting hypothese is that
recycling reduces molecular weight and chain length and consequently physical properties.
The main objective is to explain by the experience of several studies with different additives
the different influences they have on the performance of PP.
In the following chapters the following topics will be discussed:
In chapter 2, i.e. Theoretical background, the general information about
polymers, effect of molecular and morphological structures on physical
properties. Later, the recycling in polymers is discussed, how the polymers are

Error! Use the Home tab to apply Naslov 1 to the text that you want to appear here.
2
degraded and what are the mechanisms of the rejuvenating agents during
recycling.
In chapter 3, i.e. Literature research, the effect of recycling on physical properties
is discussed.
In chapter 4, i.e. Conclusions, Summay of literature research as well as future
work is presented.

3
2 Theoretical background
The use of polymers as engineering materials has increased significantly during past
decades, their increased usage in construction and automatization is the result of better
engineering, economic and environmental advantages compared to other currently utilized
materials such as metals. However, the polymer industry in the past was restricted by the
lack of information about them, and it was not until the twentieth century, when Hermann
Staudinger discovered the real structure of polymers, suggesting a large chain of little
molecules called monomers, linked with covalent bonds, which allowed the study and
progress in this field.
Nowadays, we can distinguish different structures of macromolecules, such as linear
structures and non-linear structures, Figure 2.1. The latter can be further divided in cyclic
polymers or ring polymers, branched polymers, and cross-linked polymers presenting three
dimensional structures where macromolecules are connected with primary, i.e. covalent,
bonds. The point where macromolecules connect are called junction points and the number
of junction points per volume represents the degree of crosslinking.
Figure 2.1: Classification of polymers, based on the structure of macromolecules [1].
There are a lot of different classification of polymers depending on the mode of formation,
crystallinity, tacticity, etc., but the most common classification for polymers is related to
Error! Use the Home tab to apply Naslov 1 to the text that you want to appear here.
4
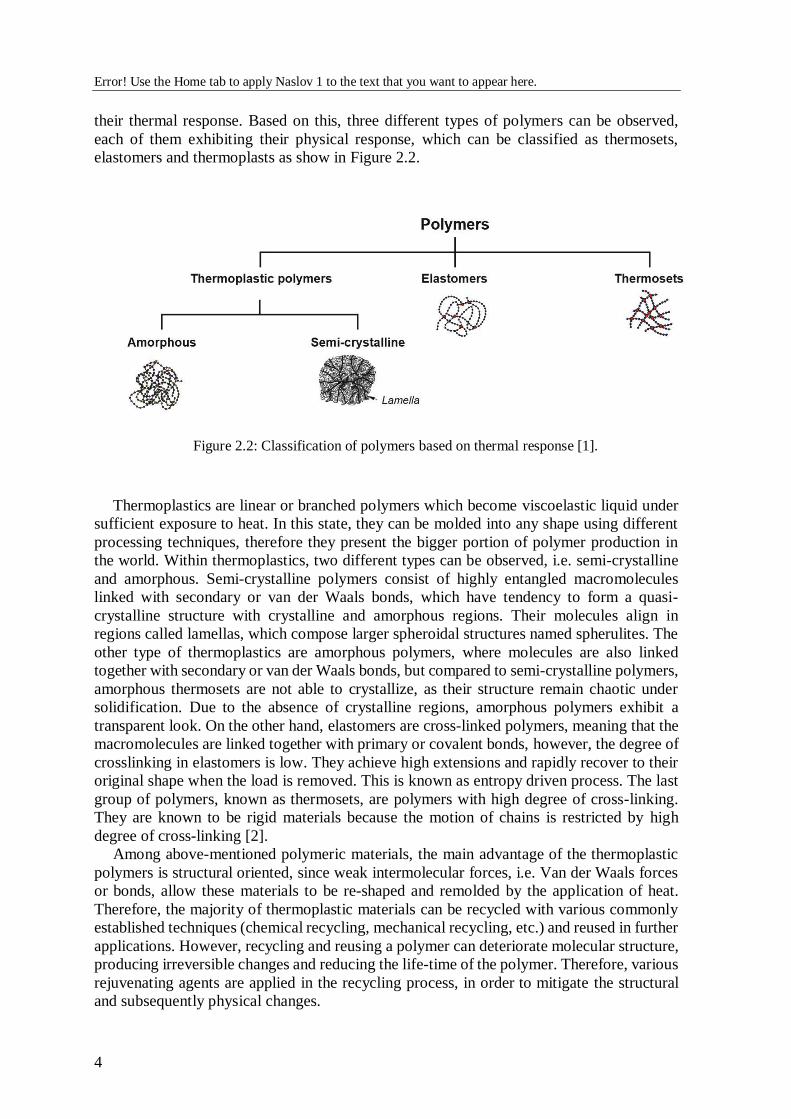
their thermal response. Based on this, three different types of polymers can be observed,
each of them exhibiting their physical response, which can be classified as thermosets,
elastomers and thermoplasts as show in Figure 2.2.
Figure 2.2: Classification of polymers based on thermal response [1].
Thermoplastics are linear or branched polymers which become viscoelastic liquid under
sufficient exposure to heat. In this state, they can be molded into any shape using different
processing techniques, therefore they present the bigger portion of polymer production in
the world. Within thermoplastics, two different types can be observed, i.e. semi-crystalline
and amorphous. Semi-crystalline polymers consist of highly entangled macromolecules
linked with secondary or van der Waals bonds, which have tendency to form a quasi-
crystalline structure with crystalline and amorphous regions. Their molecules align in
regions called lamellas, which compose larger spheroidal structures named spherulites. The
other type of thermoplastics are amorphous polymers, where molecules are also linked
together with secondary or van der Waals bonds, but compared to semi-crystalline polymers,
amorphous thermosets are not able to crystallize, as their structure remain chaotic under
solidification. Due to the absence of crystalline regions, amorphous polymers exhibit a
transparent look. On the other hand, elastomers are cross-linked polymers, meaning that the
macromolecules are linked together with primary or covalent bonds, however, the degree of
crosslinking in elastomers is low. They achieve high extensions and rapidly recover to their
original shape when the load is removed. This is known as entropy driven process. The last
group of polymers, known as thermosets, are polymers with high degree of cross-linking.
They are known to be rigid materials because the motion of chains is restricted by high
degree of cross-linking [2].
Among above-mentioned polymeric materials, the main advantage of the thermoplastic
polymers is structural oriented, since weak intermolecular forces, i.e. Van der Waals forces
or bonds, allow these materials to be re-shaped and remolded by the application of heat.
Therefore, the majority of thermoplastic materials can be recycled with various commonly
established techniques (chemical recycling, mechanical recycling, etc.) and reused in further
applications. However, recycling and reusing a polymer can deteriorate molecular structure,
producing irreversible changes and reducing the life-time of the polymer. Therefore, various
rejuvenating agents are applied in the recycling process, in order to mitigate the structural
and subsequently physical changes.
Error! Use the Home tab to apply Naslov 1 to the text that you want to appear here.
5
In this chapter, we outline the most important physical properties of polymers, recycling
in general, and the commonly used rejuvenating agents, which provide the theoretical basis
for the literature research, where the effect of recycling and rejuvenating agents on the
physical properties will be studied.
2.1 Physical properties of polymers
Within this chapter we address the most common physical properties of polymers utilized
during processing and later on during their utilization, coupled with various environmental
effects (mainly related to temperature), which could profoundly alter the behavior of
polymer products. Therefore, thermal, rheological and mechanical properties will be
thoroughly discussed in continuation.
2.1.1 Thermal properties
Among several thermal properties of polymers, such as thermal expansion, conductivity,
etc., phase transition temperatures and their underlying aspects of molecular reconfiguration
are the most fundamental in order to understand macroscopic behavior of the polymers. In
general, temperature presents an average kinetic energy or the random walk of constituents
(Brownian motion). For polymers, such motion of macromolecules induced by the
temperature is hindered because of their chain structure. In this respect, the temperature
induces the molecular motion or vibration allowing molecules to reconfigure in available
space, also called as backbone mobility or segmental mobility of the molecules.
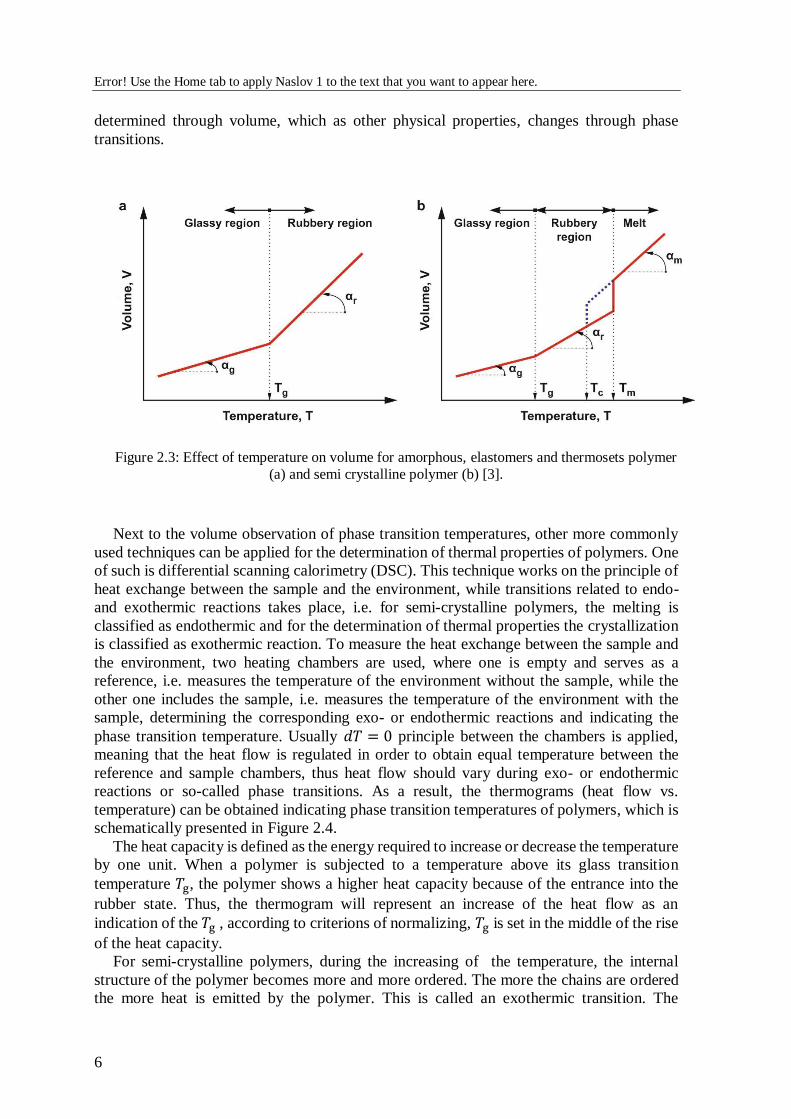
When the temperature increases, the mobility of macromolecules does as well, occupying
more space, which is vividly shown through volume, Figure 2.3. Thus, from volume
observations three distinct regions of polymer behavior can be observed, namely glassy
region, rubbery region and melt. The three regions are distinguish by so called phase
transition temperatures, that present the fundamental aspects of molecular reconfiguration,
and their effect on polymer’s macroscopic behavior. The first transition is common for all
polymers and is called the glass-transition, usually characterized with glass transition
temperature 𝑇g, Figure 2.3a. Below this temperature, the Brownian motion of polymer main
chain ceases and the side chain movement is severely hindered. Within this region, denoted
as glassy region, molecular configuration of polymers is more or less “frozen”, resulting in
negligible change in volume and elastic behavior of the polymer. With increasing
temperature, above 𝑇g, segmental mobility profoundly increases, representing global
movement of the molecules, which can be observed with increase in volume. Within this
region, denoted as rubbery region, molecular movement is not hindered, resulting in
viscoelastic response of material. From the Figure 2.3b, another region can be observed,
which is common only for semi-crystalline polymers, distinguished from the others with
melting temperature 𝑇m. Within this region, the Brownian motion of macromolecules
overcomes the van der Waals bonds holding lamellas and spherulites together, which results
in abrupt change in volume. Above 𝑇m where the polymer is in molten state, it exhibits
viscous behaviour, and therefore can be considered as a fluid. Besides phase transition
temperatures, thermal expansion coefficient 𝛼, given as 𝛼 = (1 𝑉⁄ ) 𝜕𝑉 𝜕𝑇⁄ can be also
Error! Use the Home tab to apply Naslov 1 to the text that you want to appear here.
6
determined through volume, which as other physical properties, changes through phase
transitions.
Figure 2.3: Effect of temperature on volume for amorphous, elastomers and thermosets polymer
(a) and semi crystalline polymer (b) [3].
Next to the volume observation of phase transition temperatures, other more commonly
used techniques can be applied for the determination of thermal properties of polymers. One
of such is differential scanning calorimetry (DSC). This technique works on the principle of
heat exchange between the sample and the environment, while transitions related to endo-
and exothermic reactions takes place, i.e. for semi-crystalline polymers, the melting is
classified as endothermic and for the determination of thermal properties the crystallization
is classified as exothermic reaction. To measure the heat exchange between the sample and
the environment, two heating chambers are used, where one is empty and serves as a
reference, i.e. measures the temperature of the environment without the sample, while the
other one includes the sample, i.e. measures the temperature of the environment with the
sample, determining the corresponding exo- or endothermic reactions and indicating the
phase transition temperature. Usually 𝑑𝑇 = 0 principle between the chambers is applied,
meaning that the heat flow is regulated in order to obtain equal temperature between the
reference and sample chambers, thus heat flow should vary during exo- or endothermic
reactions or so-called phase transitions. As a result, the thermograms (heat flow vs.
temperature) can be obtained indicating phase transition temperatures of polymers, which is
schematically presented in Figure 2.4.
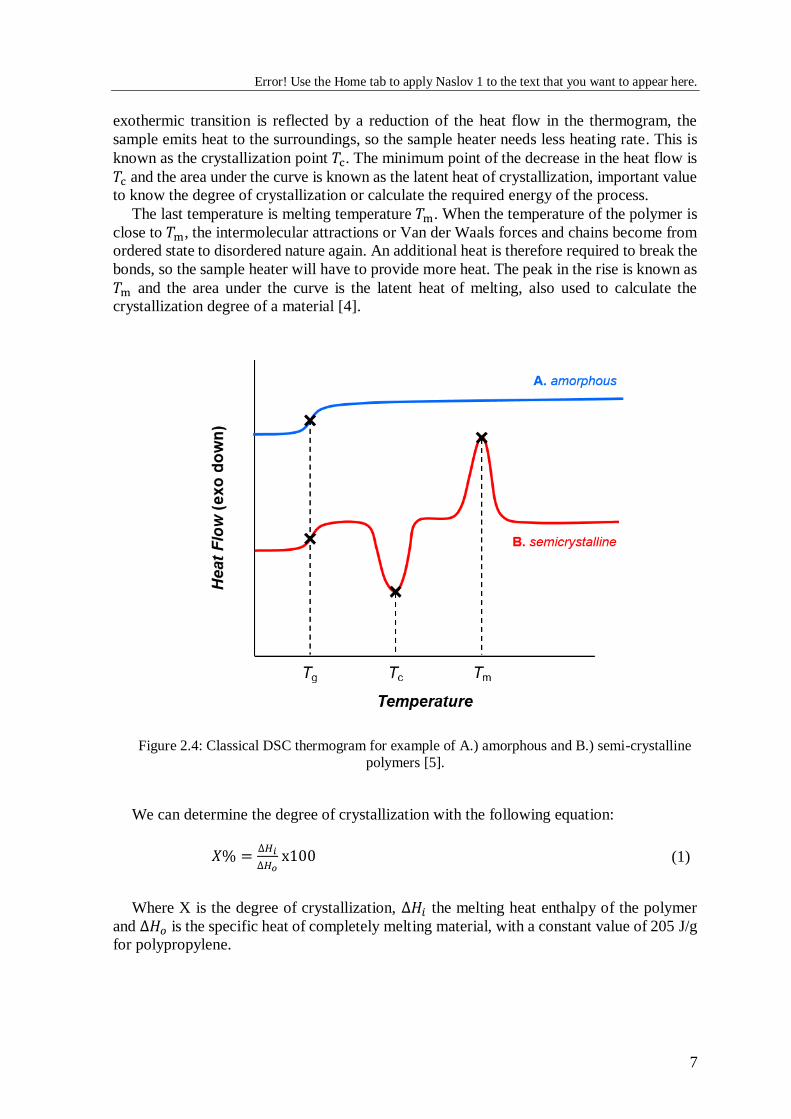
The heat capacity is defined as the energy required to increase or decrease the temperature
by one unit. When a polymer is subjected to a temperature above its glass transition
temperature 𝑇g, the polymer shows a higher heat capacity because of the entrance into the
rubber state. Thus, the thermogram will represent an increase of the heat flow as an
indication of the 𝑇g , according to criterions of normalizing, 𝑇g is set in the middle of the rise
of the heat capacity.
For semi-crystalline polymers, during the increasing of the temperature, the internal
structure of the polymer becomes more and more ordered. The more the chains are ordered
the more heat is emitted by the polymer. This is called an exothermic transition. The
Error! Use the Home tab to apply Naslov 1 to the text that you want to appear here.
7
exothermic transition is reflected by a reduction of the heat flow in the thermogram, the
sample emits heat to the surroundings, so the sample heater needs less heating rate. This is
known as the crystallization point 𝑇c. The minimum point of the decrease in the heat flow is
𝑇c and the area under the curve is known as the latent heat of crystallization, important value
to know the degree of crystallization or calculate the required energy of the process.
The last temperature is melting temperature 𝑇m. When the temperature of the polymer is
close to 𝑇m, the intermolecular attractions or Van der Waals forces and chains become from
ordered state to disordered nature again. An additional heat is therefore required to break the
bonds, so the sample heater will have to provide more heat. The peak in the rise is known as
𝑇m and the area under the curve is the latent heat of melting, also used to calculate the
crystallization degree of a material [4].
Figure 2.4: Classical DSC thermogram for example of A.) amorphous and B.) semi-crystalline
polymers [5].
We can determine the degree of crystallization with the following equation:
𝑋% =∆𝐻𝑖
∆𝐻𝑜 x100 (1)
Where X is the degree of crystallization, ∆𝐻𝑖 the melting heat enthalpy of the polymer
and ∆𝐻𝑜 is the specific heat of completely melting material, with a constant value of 205 J/g
for polypropylene.
Error! Use the Home tab to apply Naslov 1 to the text that you want to appear here.
8
2.1.1.1 Viscoelasticity of polymers
Unlike elastic materials, such as metals, ceramics, etc., polymers exhibit both solid or
elastic-like (recoverable) as well as fluid or viscous-like (non-recoverable) behavior, mainly
because of their unbounded morphological structure.
The tensile stress (𝜎) measurements consist of applying a load in the form of stress onto
a small area and studying the results. For polymers it is characteristic that with the stress
induced over time, the area is decreased and the material starts to elongate. This is usually
carried out with an ultimate tensile stress (UTS) machine, that uses the intensive property of
the polymer as elongation and stress, which means that it does not depend on the size of the
tested polymer. The stress can be defined by the following equation:
𝜎 =𝐹
𝐴 (2)
This directly affects Young's modulus, which is a measure of how much stress or strain a
material is able bear under tensile or compressive load. The Young's modulus is defined by
the equation:
𝐸 =𝜎
ℇ (3)
Where 𝐸 is Young's modulus, 𝜎 is the stress in the material and ℇ is the elongation of the
polymer.
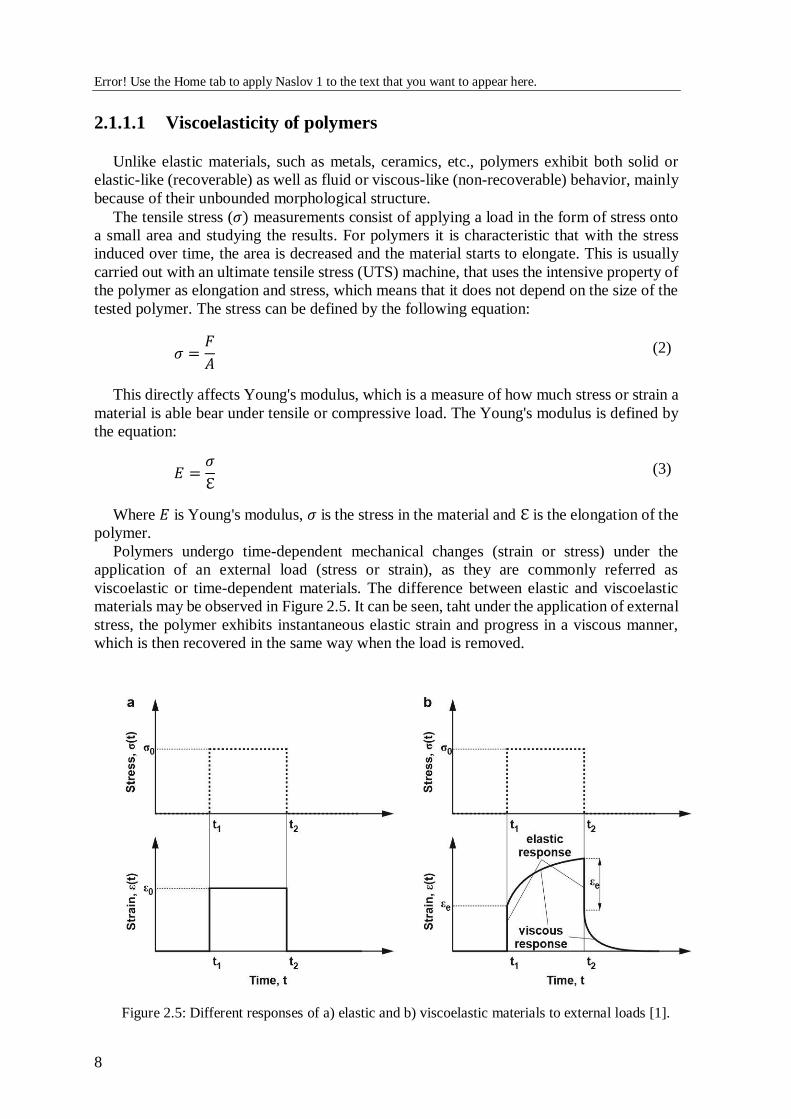
Polymers undergo time-dependent mechanical changes (strain or stress) under the
application of an external load (stress or strain), as they are commonly referred as
viscoelastic or time-dependent materials. The difference between elastic and viscoelastic
materials may be observed in Figure 2.5. It can be seen, taht under the application of external
stress, the polymer exhibits instantaneous elastic strain and progress in a viscous manner,
which is then recovered in the same way when the load is removed.
Figure 2.5: Different responses of a) elastic and b) viscoelastic materials to external loads [1].

Error! Use the Home tab to apply Naslov 1 to the text that you want to appear here.
9
To understand the relationship between the cause (stress or strain) and the response (strain
or stress) of viscoelastic materials, linear theory of viscoelasticity may be applied, which is
given either in integral or differential formulation. The main equations to describe the linear
theory of viscoelasticity are the same as for linear theory of elasticity, except that the
generalized Hook’s law of elasticity is replaced by a constitutive description that is sensitive
to the materials (past) history of loading with convolution integral, written as:
𝑟(𝑡) = ∫ 𝑄(𝑡 − 𝑢)d𝑐(𝑢)
d𝑢 d𝑢
∞
−∞, (2)
where 𝑟(𝑡) represent the response (either stress or strain), 𝑐(𝑡) cause (either strain or
stress) and 𝑄(𝑡) represents the mechanical property (moduli or compliances) also refered as
a material function. However, due to the nature of the polymers, we can now differ between
two processes within polymeric materials when subjected to the external load, namely creep
and relaxation process, which will be in continuation explained on simple case, using
uniaxial step loading format.
Creep Process
When a material is subjected to step load in the form of stress, all polymers exhibit
increasing deformation with time, which is known as the creep process, shown in Figure 2.6.
Figure 2.6:Creep process in polymers [1].
Therefore, creep process describes a time-dependent response of viscoelastic material in
the form of strain 휀(𝑡) when it is subjected to the constant external load in the form of stress
𝜎0. The relation between stress as load and strain as response is described by material
property (material function) known as creep compliance 𝐷(𝑡), given as:
Error! Use the Home tab to apply Naslov 1 to the text that you want to appear here.
10
𝐷(𝑡) =휀(𝑡)
𝜎0, (3)
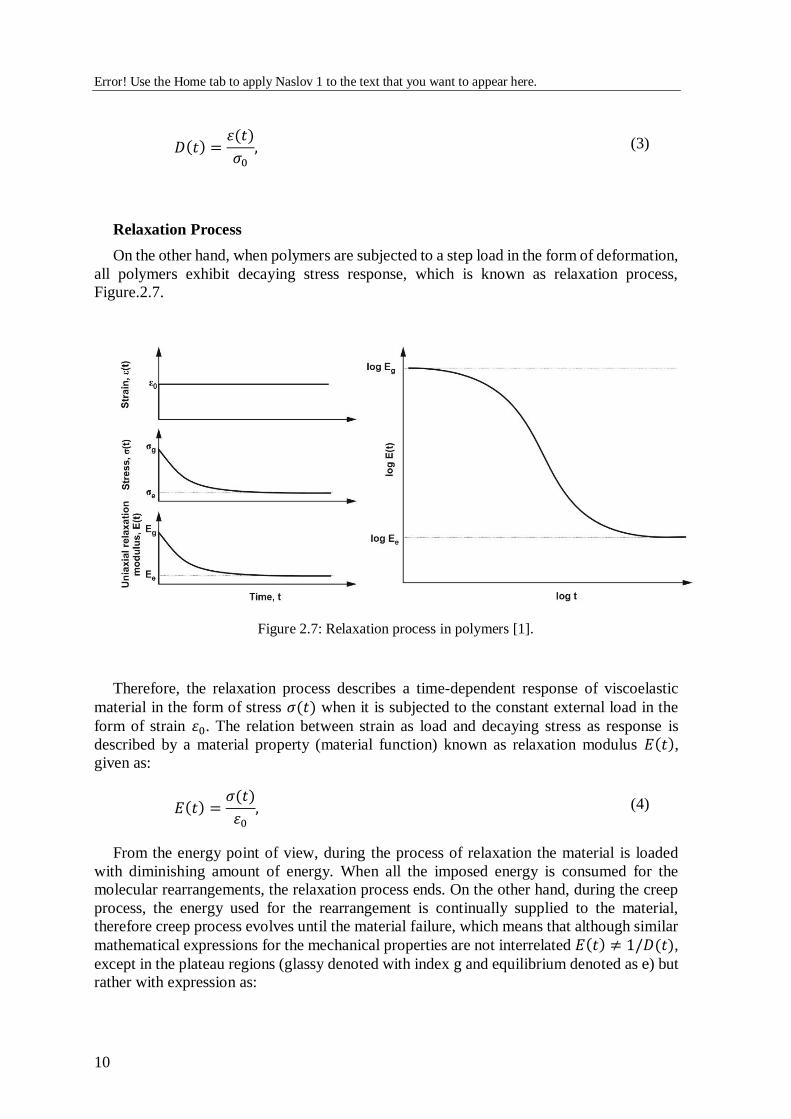
Relaxation Process
On the other hand, when polymers are subjected to a step load in the form of deformation,
all polymers exhibit decaying stress response, which is known as relaxation process,
Figure.2.7.
Figure 2.7: Relaxation process in polymers [1].
Therefore, the relaxation process describes a time-dependent response of viscoelastic
material in the form of stress 𝜎(𝑡) when it is subjected to the constant external load in the
form of strain 휀0. The relation between strain as load and decaying stress as response is
described by a material property (material function) known as relaxation modulus 𝐸(𝑡),
given as:
𝐸(𝑡) =𝜎(𝑡)
휀0, (4)
From the energy point of view, during the process of relaxation the material is loaded
with diminishing amount of energy. When all the imposed energy is consumed for the
molecular rearrangements, the relaxation process ends. On the other hand, during the creep
process, the energy used for the rearrangement is continually supplied to the material,
therefore creep process evolves until the material failure, which means that although similar
mathematical expressions for the mechanical properties are not interrelated 𝐸(𝑡) ≠ 1/𝐷(𝑡),
except in the plateau regions (glassy denoted with index g and equilibrium denoted as e) but
rather with expression as:
Error! Use the Home tab to apply Naslov 1 to the text that you want to appear here.
11
𝑡 = ∫ 𝐸(𝑡)𝐷(𝑡 − 𝑢) d𝑢∞
−∞
, (5)
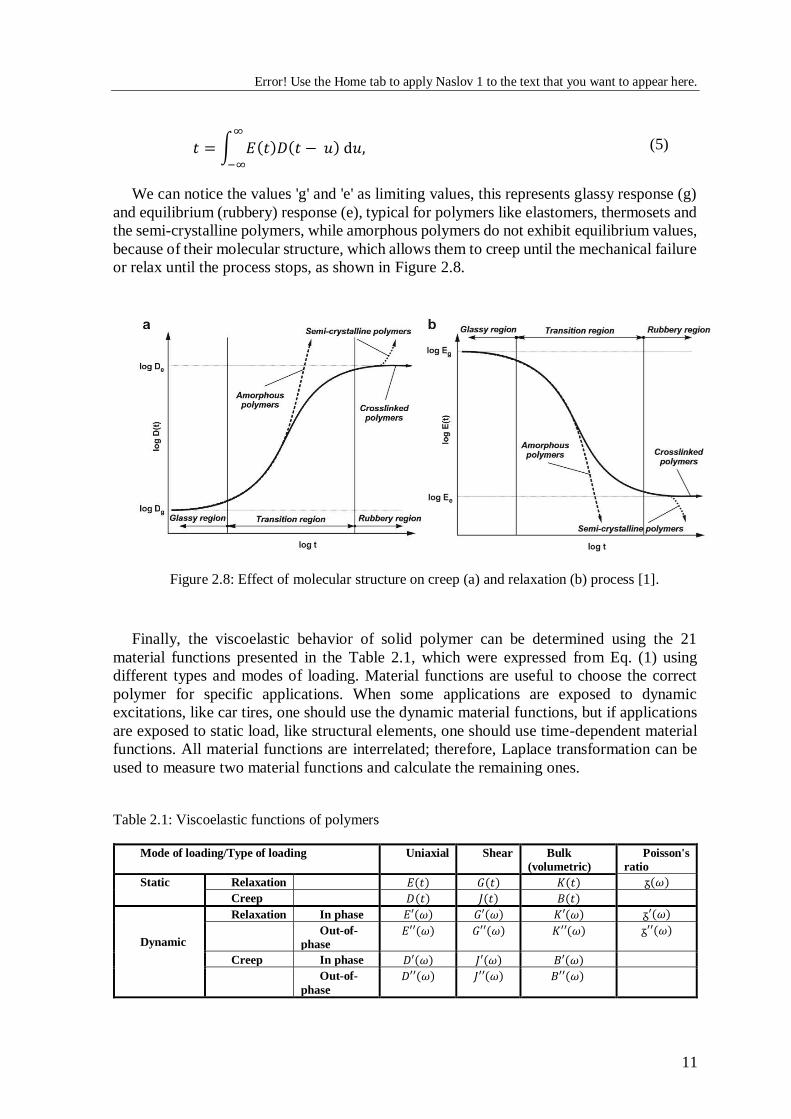
We can notice the values 'g' and 'e' as limiting values, this represents glassy response (g)
and equilibrium (rubbery) response (e), typical for polymers like elastomers, thermosets and
the semi-crystalline polymers, while amorphous polymers do not exhibit equilibrium values,
because of their molecular structure, which allows them to creep until the mechanical failure
or relax until the process stops, as shown in Figure 2.8.
Figure 2.8: Effect of molecular structure on creep (a) and relaxation (b) process [1].
Finally, the viscoelastic behavior of solid polymer can be determined using the 21
material functions presented in the Table 2.1, which were expressed from Eq. (1) using
different types and modes of loading. Material functions are useful to choose the correct
polymer for specific applications. When some applications are exposed to dynamic
excitations, like car tires, one should use the dynamic material functions, but if applications
are exposed to static load, like structural elements, one should use time-dependent material
functions. All material functions are interrelated; therefore, Laplace transformation can be
used to measure two material functions and calculate the remaining ones.
Table 2.1: Viscoelastic functions of polymers
Mode of loading/Type of loading Uniaxial Shear Bulk
(volumetric)
Poisson's
ratio
Static
Relaxation 𝐸(𝑡) 𝐺(𝑡) 𝐾(𝑡) ᵹ(𝜔)
Creep 𝐷(𝑡) 𝐽(𝑡) 𝐵(𝑡)
Dynamic
Relaxation In phase 𝐸′(𝜔) 𝐺′(𝜔) 𝐾′(𝜔) ᵹ′(𝜔)
Out-of-
phase 𝐸′′(𝜔) 𝐺′′(𝜔) 𝐾′′(𝜔) ᵹ′′(𝜔)
Creep In phase 𝐷′(𝜔) 𝐽′(𝜔) 𝐵′(𝜔)
Out-of-
phase
𝐷′′(𝜔) 𝐽′′(𝜔) 𝐵′′(𝜔)

Error! Use the Home tab to apply Naslov 1 to the text that you want to appear here.
12
2.1.1.2 Effect of temperature
To understand the effect of temperature on mechanical properties we have to take a look
into the free volume concept, explained in the thermal properties. When the temperature
rises, the free volume increases, which results in increase of available space for the motion
of macromolecules (reconfiguration) that consequently accelerates the creep or relaxation
process. This acceleration can be on macroscale observed by horizontal shifting of time-
dependent mechanical properties to shorter times, as shown in Figure 2.9.
.
Figure 2.9:Effect of temperature in creep (a) and relaxation (b) process in the case of
shear loading [1].
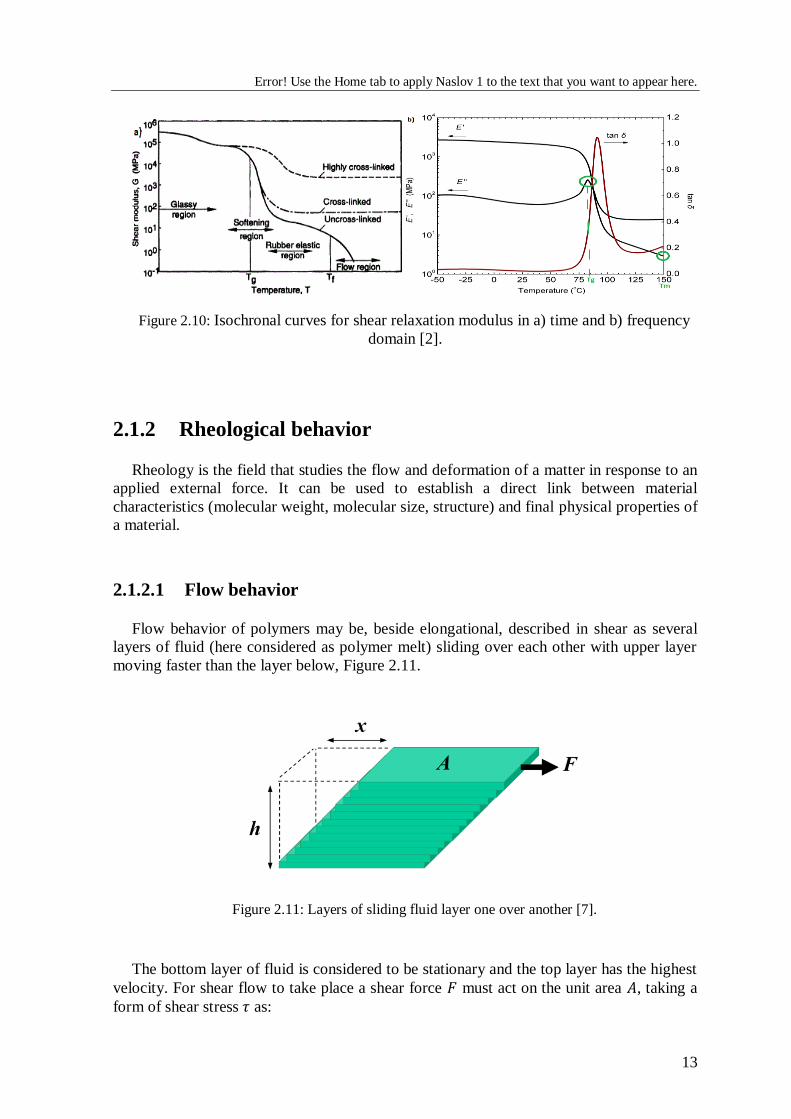
The most common representation of the effect of temperature on mechanical properties
is through so-called isochronal curves, which showthe material behavior at different
temperature for specific time or frequency, Figure 2.10. However, the procedure for
constructing isochronal curves from creep or relaxation process in either time or frequency
domain can be found elsewhere [1]. Nevertheless, based on the results three distinct regions
can be observed as also shown via volume measurements, i.e. glassy, rubbery and flow
(melt) region as well as phase transition temperatures, i.e. glassy transition and melting
temperature [6].
Please note that using frequency results (utilizing dynamic mechanical analysis or DMA),
three types of glass transition temperature may be determined: i.) onset of the storage
modulus 𝐺′, ii.) the peak in loss modulus 𝐺′′ or the iii.) peak in tan δ. The first value
represents the 𝑇g as the temperature where the short-range relaxation can occur, reducing the
resistance against the load. The second value represents the match or link of the vibrational
frequencies of small chains of polymers and results in a peak in the loss storage. The third
value is the tan δ peak, which represents the 𝐺′′/𝐺′ ratio. It is common, that the 𝑇g is
determined by the peak of 𝐺′′ (small chain movement or transition from local to global
movement of molecular chains), meanwhile 𝑇m is determined as the drop of 𝐺′.
Error! Use the Home tab to apply Naslov 1 to the text that you want to appear here.
13
Figure 2.10: Isochronal curves for shear relaxation modulus in a) time and b) frequency
domain [2].
2.1.2 Rheological behavior
Rheology is the field that studies the flow and deformation of a matter in response to an
applied external force. It can be used to establish a direct link between material
characteristics (molecular weight, molecular size, structure) and final physical properties of
a material.
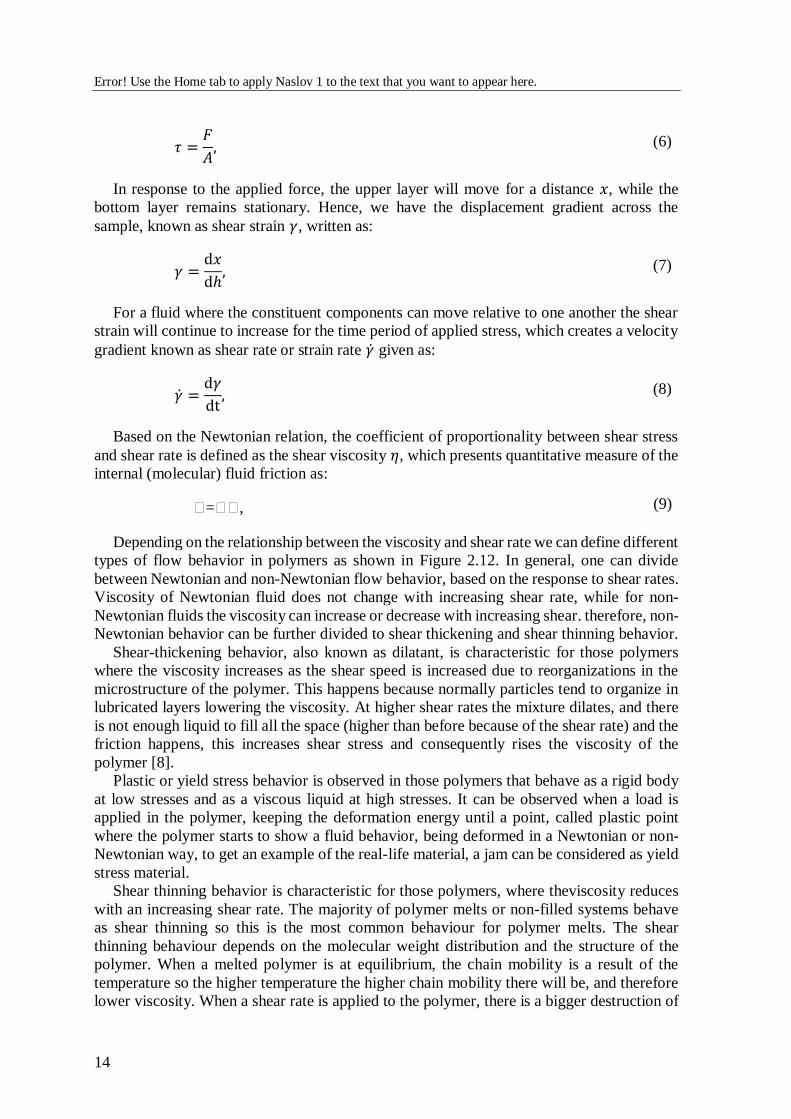
2.1.2.1 Flow behavior
Flow behavior of polymers may be, beside elongational, described in shear as several
layers of fluid (here considered as polymer melt) sliding over each other with upper layer
moving faster than the layer below, Figure 2.11.
Figure 2.11: Layers of sliding fluid layer one over another [7].
The bottom layer of fluid is considered to be stationary and the top layer has the highest
velocity. For shear flow to take place a shear force 𝐹 must act on the unit area 𝐴, taking a
form of shear stress 𝜏 as:
Error! Use the Home tab to apply Naslov 1 to the text that you want to appear here.
14
𝜏 =𝐹
𝐴, (6)
In response to the applied force, the upper layer will move for a distance 𝑥, while the
bottom layer remains stationary. Hence, we have the displacement gradient across the
sample, known as shear strain 𝛾, written as:
𝛾 =d𝑥
dℎ, (7)
For a fluid where the constituent components can move relative to one another the shear
strain will continue to increase for the time period of applied stress, which creates a velocity
gradient known as shear rate or strain rate �̇� given as:
�̇� =d𝛾
dt, (8)
Based on the Newtonian relation, the coefficient of proportionality between shear stress
and shear rate is defined as the shear viscosity 𝜂, which presents quantitative measure of the
internal (molecular) fluid friction as:
𝜂=𝜂𝜂, (9)
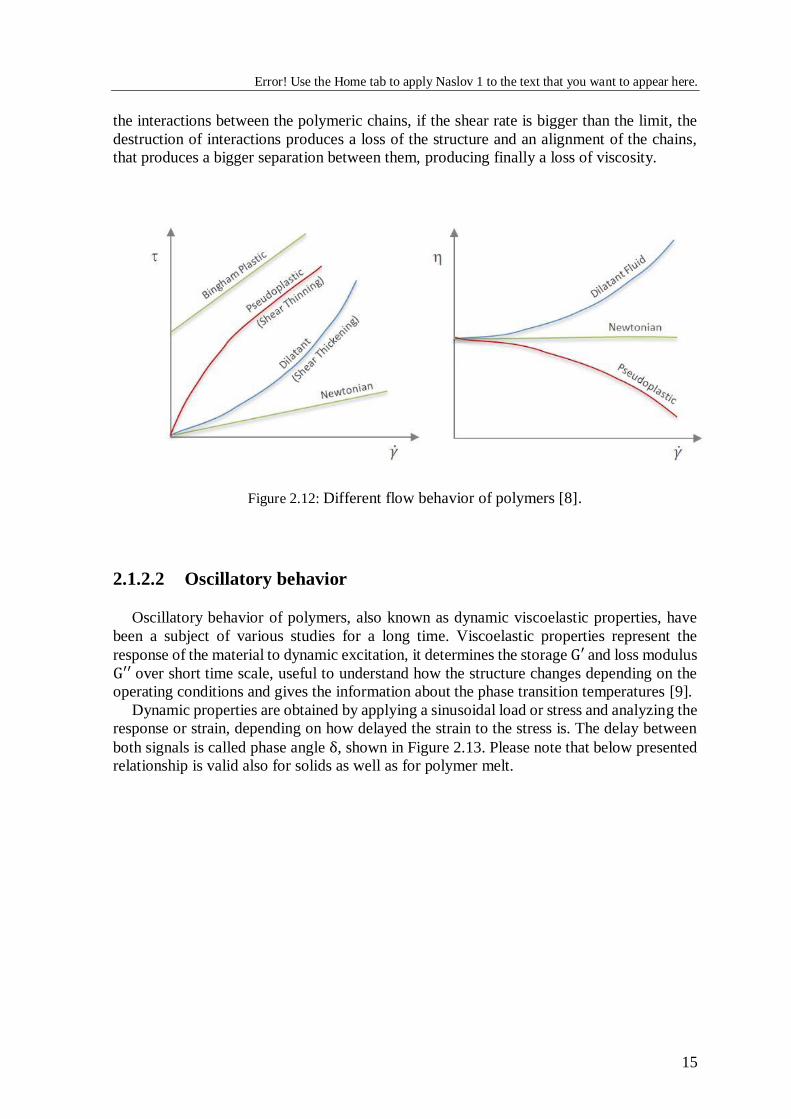
Depending on the relationship between the viscosity and shear rate we can define different
types of flow behavior in polymers as shown in Figure 2.12. In general, one can divide
between Newtonian and non-Newtonian flow behavior, based on the response to shear rates.
Viscosity of Newtonian fluid does not change with increasing shear rate, while for non-
Newtonian fluids the viscosity can increase or decrease with increasing shear. therefore, non-
Newtonian behavior can be further divided to shear thickening and shear thinning behavior.
Shear-thickening behavior, also known as dilatant, is characteristic for those polymers
where the viscosity increases as the shear speed is increased due to reorganizations in the
microstructure of the polymer. This happens because normally particles tend to organize in
lubricated layers lowering the viscosity. At higher shear rates the mixture dilates, and there
is not enough liquid to fill all the space (higher than before because of the shear rate) and the
friction happens, this increases shear stress and consequently rises the viscosity of the
polymer [8].
Plastic or yield stress behavior is observed in those polymers that behave as a rigid body
at low stresses and as a viscous liquid at high stresses. It can be observed when a load is
applied in the polymer, keeping the deformation energy until a point, called plastic point
where the polymer starts to show a fluid behavior, being deformed in a Newtonian or non-
Newtonian way, to get an example of the real-life material, a jam can be considered as yield
stress material.
Shear thinning behavior is characteristic for those polymers, where theviscosity reduces
with an increasing shear rate. The majority of polymer melts or non-filled systems behave
as shear thinning so this is the most common behaviour for polymer melts. The shear
thinning behaviour depends on the molecular weight distribution and the structure of the
polymer. When a melted polymer is at equilibrium, the chain mobility is a result of the
temperature so the higher temperature the higher chain mobility there will be, and therefore
lower viscosity. When a shear rate is applied to the polymer, there is a bigger destruction of
Error! Use the Home tab to apply Naslov 1 to the text that you want to appear here.
15
the interactions between the polymeric chains, if the shear rate is bigger than the limit, the
destruction of interactions produces a loss of the structure and an alignment of the chains,
that produces a bigger separation between them, producing finally a loss of viscosity.
Figure 2.12: Different flow behavior of polymers [8].
2.1.2.2 Oscillatory behavior
Oscillatory behavior of polymers, also known as dynamic viscoelastic properties, have
been a subject of various studies for a long time. Viscoelastic properties represent the
response of the material to dynamic excitation, it determines the storage G′ and loss modulus
G′′ over short time scale, useful to understand how the structure changes depending on the
operating conditions and gives the information about the phase transition temperatures [9].
Dynamic properties are obtained by applying a sinusoidal load or stress and analyzing the
response or strain, depending on how delayed the strain to the stress is. The delay between
both signals is called phase angle δ, shown in Figure 2.13. Please note that below presented
relationship is valid also for solids as well as for polymer melt.
Error! Use the Home tab to apply Naslov 1 to the text that you want to appear here.
16
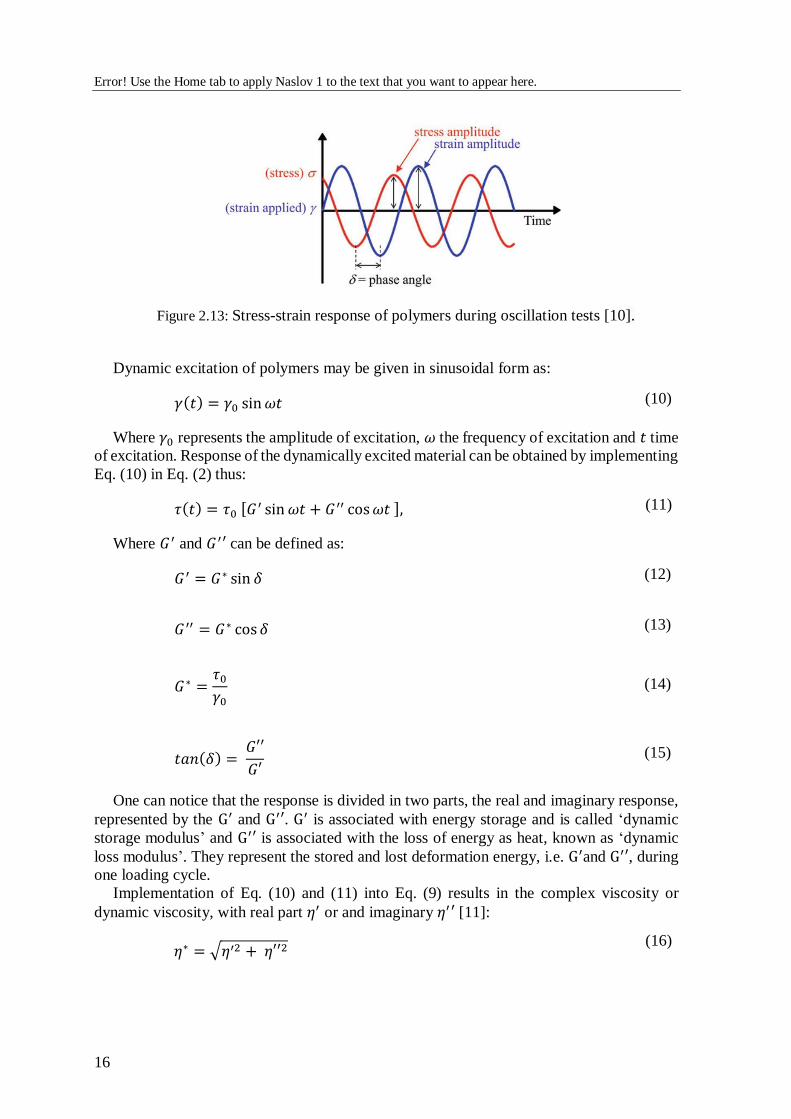
Figure 2.13: Stress-strain response of polymers during oscillation tests [10].
Dynamic excitation of polymers may be given in sinusoidal form as:
𝛾(𝑡) = 𝛾0 sin 𝜔𝑡 (10)
Where 𝛾0 represents the amplitude of excitation, 𝜔 the frequency of excitation and 𝑡 time
of excitation. Response of the dynamically excited material can be obtained by implementing
Eq. (10) in Eq. (2) thus:
𝜏(𝑡) = 𝜏0 [𝐺′ sin 𝜔𝑡 + 𝐺′′ cos 𝜔𝑡 ], (11)
Where 𝐺′ and 𝐺′′ can be defined as:
𝐺′ = 𝐺∗ sin 𝛿 (12)
𝐺′′ = 𝐺∗ cos 𝛿 (13)
𝐺∗ =𝜏0
𝛾0 (14)
𝑡𝑎𝑛(𝛿) = 𝐺′′
𝐺′ (15)
One can notice that the response is divided in two parts, the real and imaginary response,
represented by the G′ and G′′. G′ is associated with energy storage and is called ‘dynamic
storage modulus’ and G′′ is associated with the loss of energy as heat, known as ‘dynamic
loss modulus’. They represent the stored and lost deformation energy, i.e. G′and G′′, during
one loading cycle.
Implementation of Eq. (10) and (11) into Eq. (9) results in the complex viscosity or
dynamic viscosity, with real part 𝜂′ or and imaginary 𝜂′′ [11]:
𝜂∗ = √𝜂′2 + 𝜂′′2
(16)
Error! Use the Home tab to apply Naslov 1 to the text that you want to appear here.
17
𝜂′(𝜔) =
𝐺′′(𝜔)
𝜔
(17)
𝜂′′(𝜔) =
𝐺′(𝜔)
𝜔
(18)
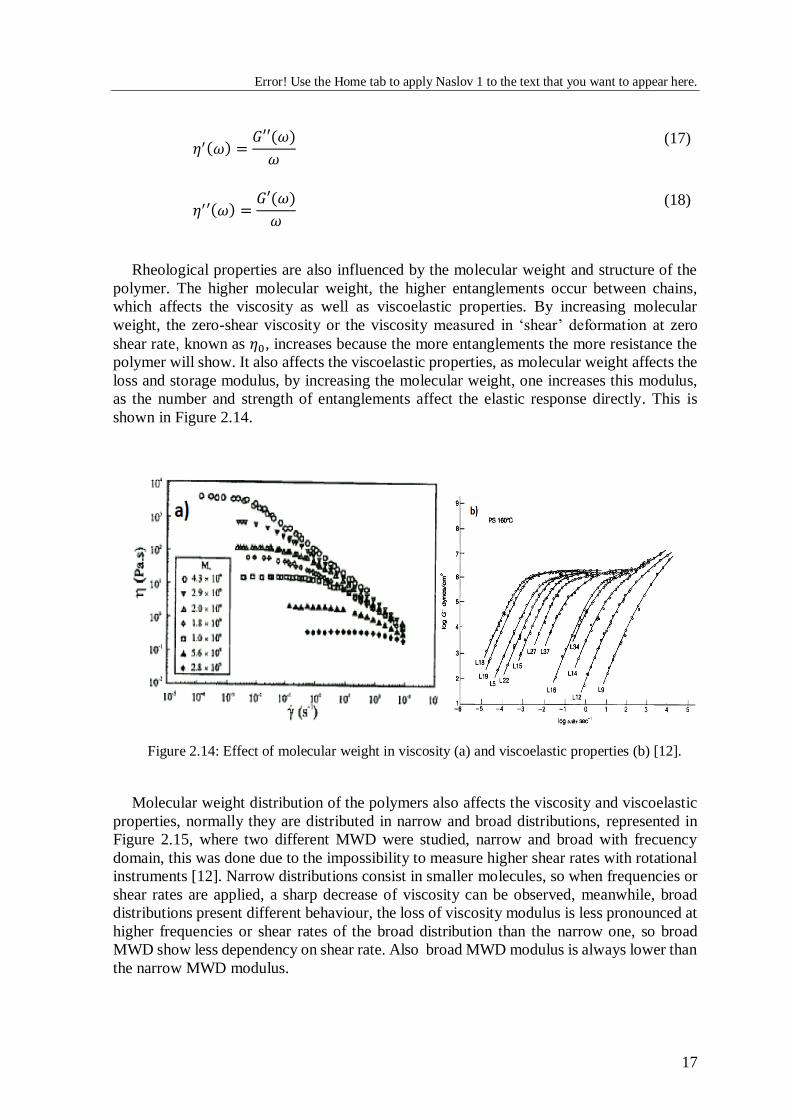
Rheological properties are also influenced by the molecular weight and structure of the
polymer. The higher molecular weight, the higher entanglements occur between chains,
which affects the viscosity as well as viscoelastic properties. By increasing molecular
weight, the zero-shear viscosity or the viscosity measured in ‘shear’ deformation at zero
shear rate, known as 𝜂0, increases because the more entanglements the more resistance the
polymer will show. It also affects the viscoelastic properties, as molecular weight affects the
loss and storage modulus, by increasing the molecular weight, one increases this modulus,
as the number and strength of entanglements affect the elastic response directly. This is
shown in Figure 2.14.
Figure 2.14: Effect of molecular weight in viscosity (a) and viscoelastic properties (b) [12].
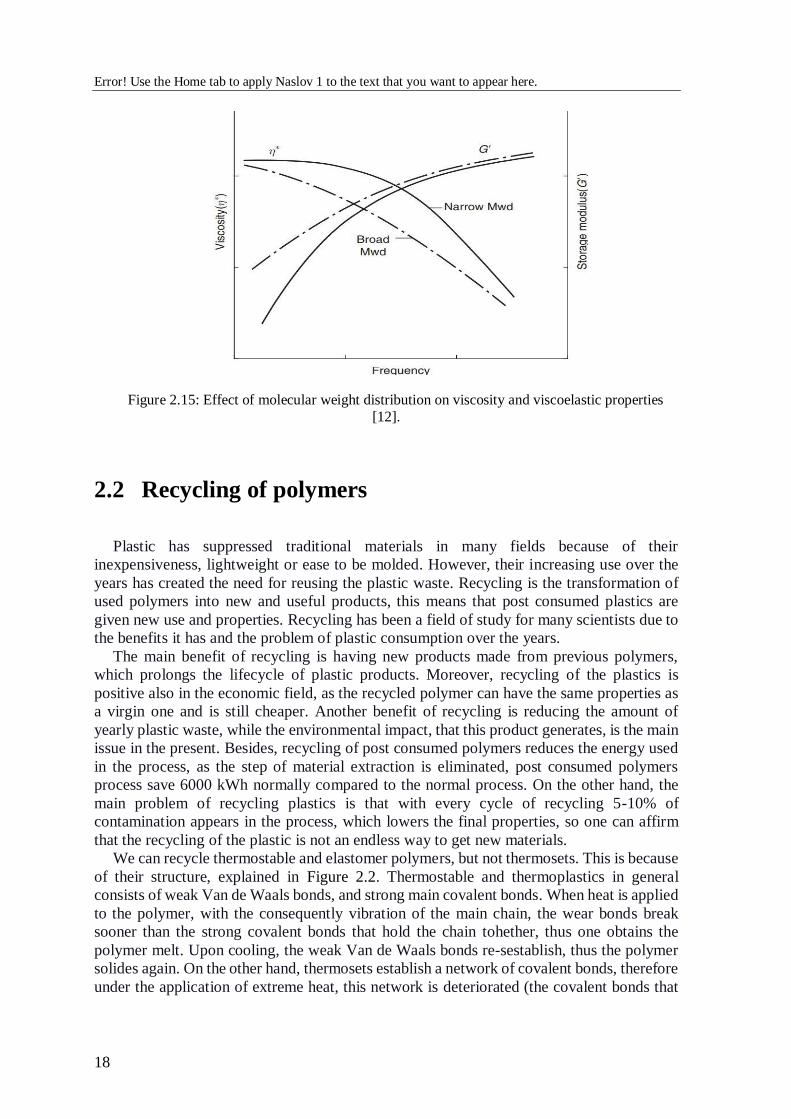
Molecular weight distribution of the polymers also affects the viscosity and viscoelastic
properties, normally they are distributed in narrow and broad distributions, represented in
Figure 2.15, where two different MWD were studied, narrow and broad with frecuency
domain, this was done due to the impossibility to measure higher shear rates with rotational
instruments [12]. Narrow distributions consist in smaller molecules, so when frequencies or
shear rates are applied, a sharp decrease of viscosity can be observed, meanwhile, broad
distributions present different behaviour, the loss of viscosity modulus is less pronounced at
higher frequencies or shear rates of the broad distribution than the narrow one, so broad
MWD show less dependency on shear rate. Also broad MWD modulus is always lower than
the narrow MWD modulus.
Error! Use the Home tab to apply Naslov 1 to the text that you want to appear here.
18
Figure 2.15: Effect of molecular weight distribution on viscosity and viscoelastic properties
[12].
2.2 Recycling of polymers
Plastic has suppressed traditional materials in many fields because of their
inexpensiveness, lightweight or ease to be molded. However, their increasing use over the
years has created the need for reusing the plastic waste. Recycling is the transformation of
used polymers into new and useful products, this means that post consumed plastics are
given new use and properties. Recycling has been a field of study for many scientists due to
the benefits it has and the problem of plastic consumption over the years.
The main benefit of recycling is having new products made from previous polymers,
which prolongs the lifecycle of plastic products. Moreover, recycling of the plastics is
positive also in the economic field, as the recycled polymer can have the same properties as
a virgin one and is still cheaper. Another benefit of recycling is reducing the amount of
yearly plastic waste, while the environmental impact, that this product generates, is the main
issue in the present. Besides, recycling of post consumed polymers reduces the energy used
in the process, as the step of material extraction is eliminated, post consumed polymers
process save 6000 kWh normally compared to the normal process. On the other hand, the
main problem of recycling plastics is that with every cycle of recycling 5-10% of
contamination appears in the process, which lowers the final properties, so one can affirm
that the recycling of the plastic is not an endless way to get new materials.
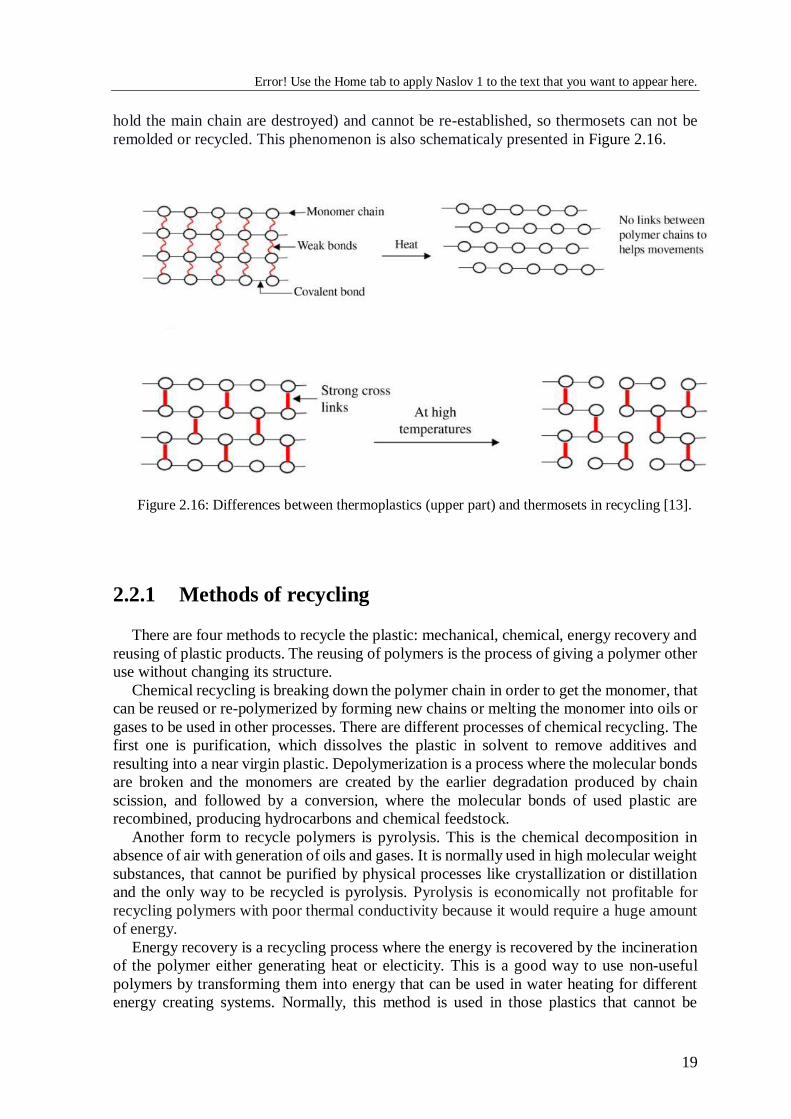
We can recycle thermostable and elastomer polymers, but not thermosets. This is because
of their structure, explained in Figure 2.2. Thermostable and thermoplastics in general
consists of weak Van de Waals bonds, and strong main covalent bonds. When heat is applied
to the polymer, with the consequently vibration of the main chain, the wear bonds break
sooner than the strong covalent bonds that hold the chain tohether, thus one obtains the
polymer melt. Upon cooling, the weak Van de Waals bonds re-sestablish, thus the polymer
solides again. On the other hand, thermosets establish a network of covalent bonds, therefore
under the application of extreme heat, this network is deteriorated (the covalent bonds that
Error! Use the Home tab to apply Naslov 1 to the text that you want to appear here.
19
hold the main chain are destroyed) and cannot be re-established, so thermosets can not be
remolded or recycled. This phenomenon is also schematicaly presented in Figure 2.16.
Figure 2.16: Differences between thermoplastics (upper part) and thermosets in recycling [13].
2.2.1 Methods of recycling
There are four methods to recycle the plastic: mechanical, chemical, energy recovery and
reusing of plastic products. The reusing of polymers is the process of giving a polymer other
use without changing its structure.
Chemical recycling is breaking down the polymer chain in order to get the monomer, that
can be reused or re-polymerized by forming new chains or melting the monomer into oils or
gases to be used in other processes. There are different processes of chemical recycling. The
first one is purification, which dissolves the plastic in solvent to remove additives and
resulting into a near virgin plastic. Depolymerization is a process where the molecular bonds
are broken and the monomers are created by the earlier degradation produced by chain
scission, and followed by a conversion, where the molecular bonds of used plastic are
recombined, producing hydrocarbons and chemical feedstock.
Another form to recycle polymers is pyrolysis. This is the chemical decomposition in
absence of air with generation of oils and gases. It is normally used in high molecular weight
substances, that cannot be purified by physical processes like crystallization or distillation
and the only way to be recycled is pyrolysis. Pyrolysis is economically not profitable for
recycling polymers with poor thermal conductivity because it would require a huge amount
of energy.
Energy recovery is a recycling process where the energy is recovered by the incineration
of the polymer either generating heat or electicity. This is a good way to use non-useful
polymers by transforming them into energy that can be used in water heating for different
energy creating systems. Normally, this method is used in those plastics that cannot be
Error! Use the Home tab to apply Naslov 1 to the text that you want to appear here.
20
recycled by other ways because they can not be economically profitable. The main problem
is the contamination that this proces produces, as the emissions generated in the process of
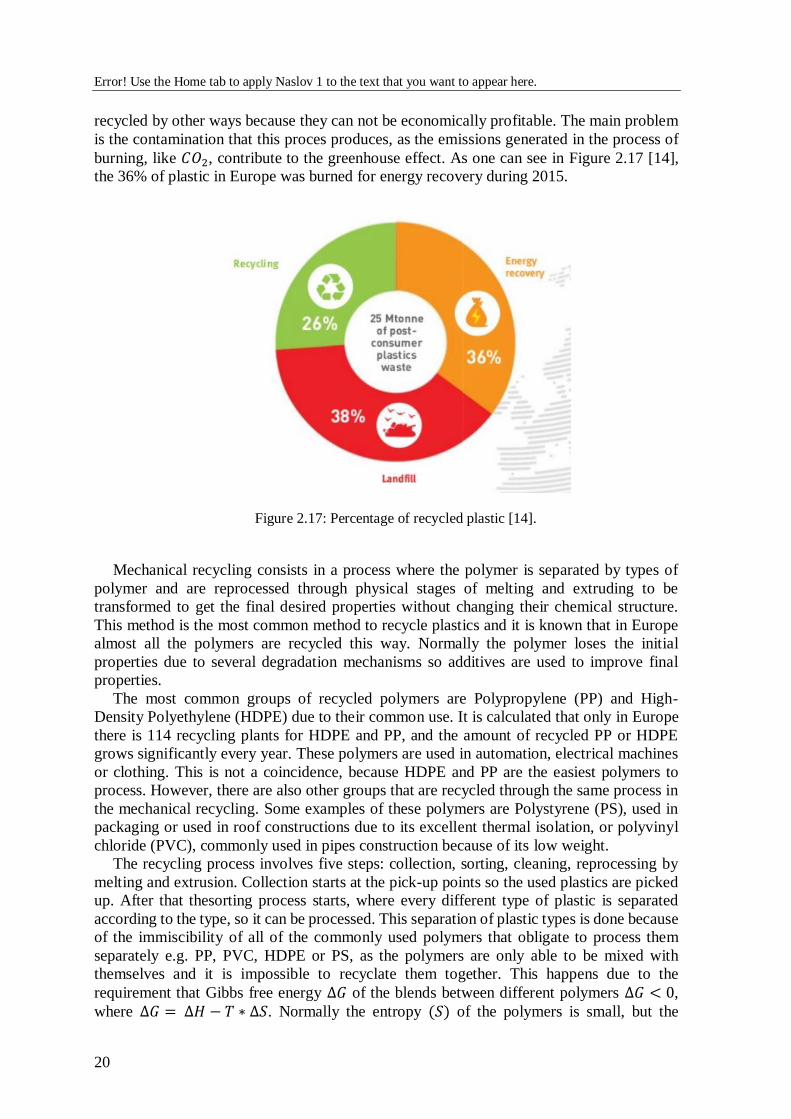
burning, like 𝐶𝑂2, contribute to the greenhouse effect. As one can see in Figure 2.17 [14],
the 36% of plastic in Europe was burned for energy recovery during 2015.
Figure 2.17: Percentage of recycled plastic [14].
Mechanical recycling consists in a process where the polymer is separated by types of
polymer and are reprocessed through physical stages of melting and extruding to be
transformed to get the final desired properties without changing their chemical structure.
This method is the most common method to recycle plastics and it is known that in Europe
almost all the polymers are recycled this way. Normally the polymer loses the initial
properties due to several degradation mechanisms so additives are used to improve final
properties.
The most common groups of recycled polymers are Polypropylene (PP) and High-
Density Polyethylene (HDPE) due to their common use. It is calculated that only in Europe
there is 114 recycling plants for HDPE and PP, and the amount of recycled PP or HDPE
grows significantly every year. These polymers are used in automation, electrical machines
or clothing. This is not a coincidence, because HDPE and PP are the easiest polymers to
process. However, there are also other groups that are recycled through the same process in
the mechanical recycling. Some examples of these polymers are Polystyrene (PS), used in
packaging or used in roof constructions due to its excellent thermal isolation, or polyvinyl
chloride (PVC), commonly used in pipes construction because of its low weight.
The recycling process involves five steps: collection, sorting, cleaning, reprocessing by
melting and extrusion. Collection starts at the pick-up points so the used plastics are picked
up. After that thesorting process starts, where every different type of plastic is separated
according to the type, so it can be processed. This separation of plastic types is done because
of the immiscibility of all of the commonly used polymers that obligate to process them
separately e.g. PP, PVC, HDPE or PS, as the polymers are only able to be mixed with
themselves and it is impossible to recyclate them together. This happens due to the
requirement that Gibbs free energy ∆𝐺 of the blends between different polymers ∆𝐺 < 0,
where ∆𝐺 = ∆𝐻 − 𝑇 ∗ ∆𝑆. Normally the entropy (𝑆) of the polymers is small, but the
Error! Use the Home tab to apply Naslov 1 to the text that you want to appear here.
21
enthalpy (𝐻) is positive and higher than the 𝑇 ∗ ∆𝑆 product, which leads to positive free
energies, making the miscibility of the blends impossible. After being sorted, the plastic is
washed to remove all the impurities. The level of the impurities in the plastic will have large
influence on the final properties of the recycled polymer.
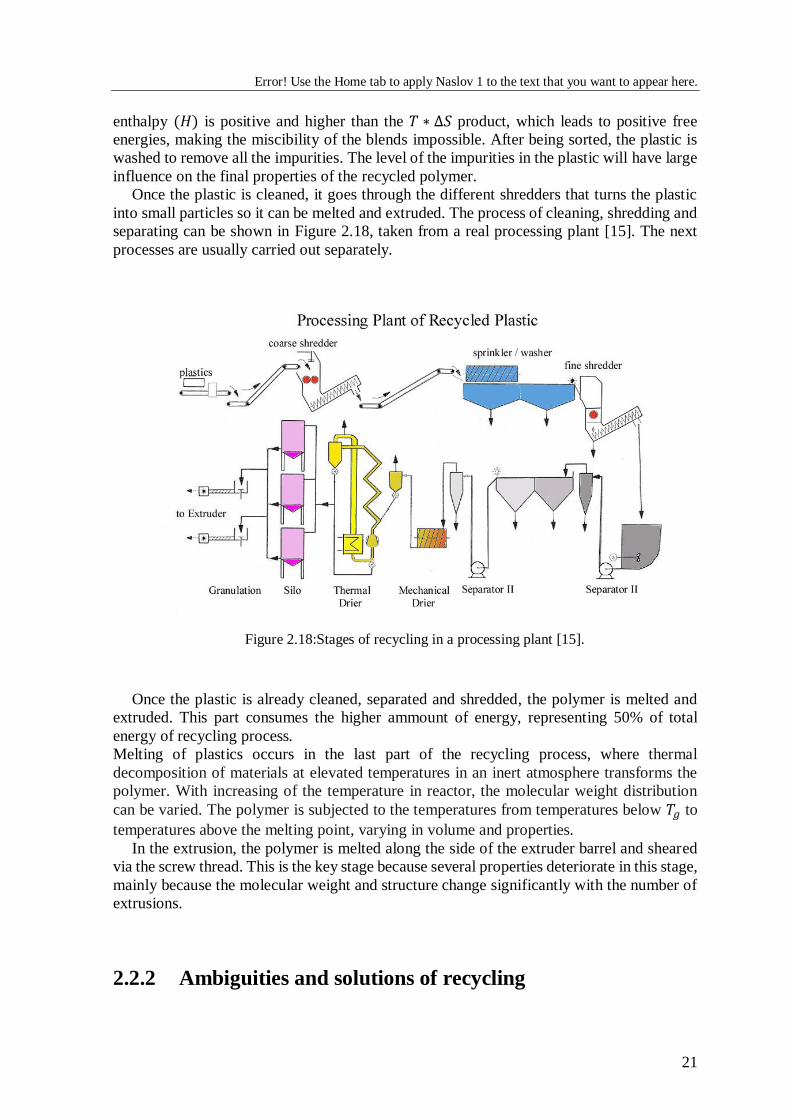
Once the plastic is cleaned, it goes through the different shredders that turns the plastic
into small particles so it can be melted and extruded. The process of cleaning, shredding and
separating can be shown in Figure 2.18, taken from a real processing plant [15]. The next
processes are usually carried out separately.
Figure 2.18:Stages of recycling in a processing plant [15].
Once the plastic is already cleaned, separated and shredded, the polymer is melted and
extruded. This part consumes the higher ammount of energy, representing 50% of total
energy of recycling process.
Melting of plastics occurs in the last part of the recycling process, where thermal
decomposition of materials at elevated temperatures in an inert atmosphere transforms the
polymer. With increasing of the temperature in reactor, the molecular weight distribution
can be varied. The polymer is subjected to the temperatures from temperatures below 𝑇𝑔 to
temperatures above the melting point, varying in volume and properties.
In the extrusion, the polymer is melted along the side of the extruder barrel and sheared
via the screw thread. This is the key stage because several properties deteriorate in this stage,
mainly because the molecular weight and structure change significantly with the number of
extrusions.
2.2.2 Ambiguities and solutions of recycling
Error! Use the Home tab to apply Naslov 1 to the text that you want to appear here.
22
Recycled polymers suffer degradation during the recycling process. Usually polymers are
susceptible to suffer thermal degradation during the mechanical recycling because of the
effect of the oxygen contained in the groups of their structure, resulting in reactions that alter
the molecular structure, morphology and later on physical properties. Degradation in
polymers can occur by different paths, normally related with the recycling stages, but the
most important degradations are produced by the effect of temperature, oxygen and light.
Thermal degradation can limit the processing temperature due to the continued loss of
mechanical properties at high temperature. When the polymer starts to degrade due to the
temperature, the components of the backbone start to react with each other, changing the
polymer structure and properties. There are four main degradation mechanisms:
depolymerization, chain scission, elimination and oxidation. Depolymerization consists in
the decomposition of the polymer into a monomer, forming free radicals. Random chain
scission occurs at any position of the polymer, normally there are two big groups depending
on where the chain scission starts. When the chain scission starts in the backbone, the
polymer starts degrading and finally it causes the polymer vaporization. On the other hand,
when the chain scission starts in the side chains, the process of chain scission produces a
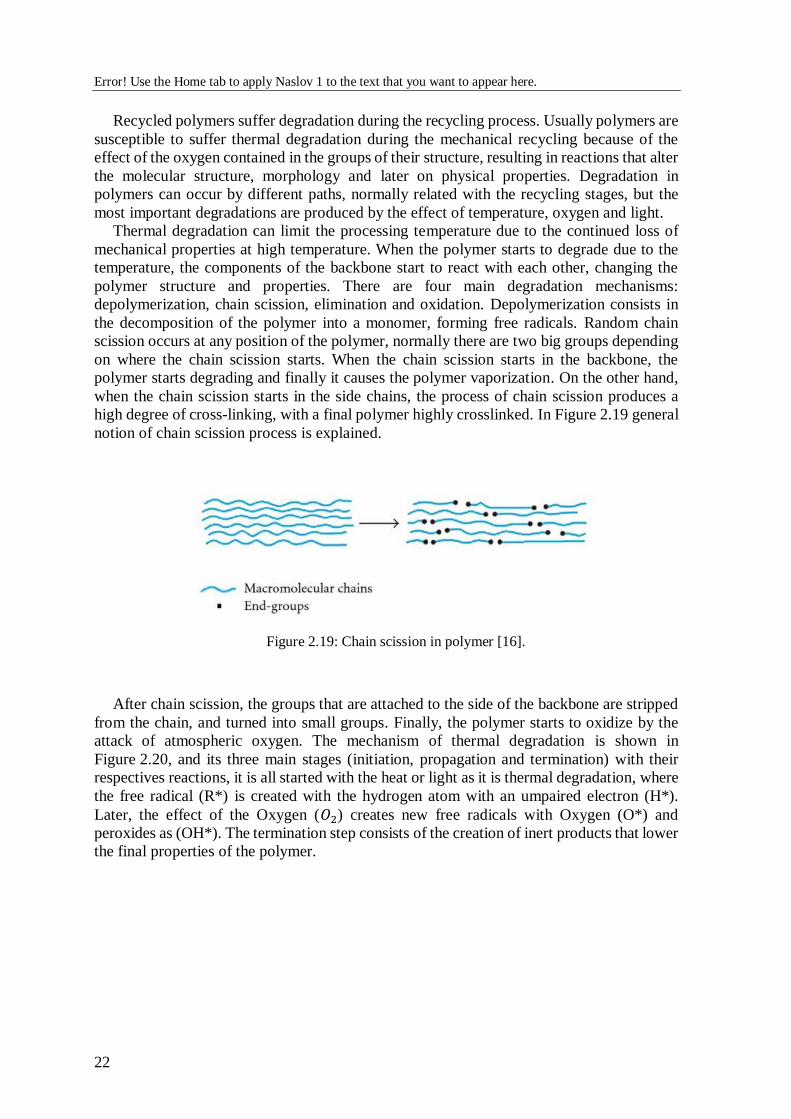
high degree of cross-linking, with a final polymer highly crosslinked. In Figure 2.19 general
notion of chain scission process is explained.
Figure 2.19: Chain scission in polymer [16].
After chain scission, the groups that are attached to the side of the backbone are stripped
from the chain, and turned into small groups. Finally, the polymer starts to oxidize by the
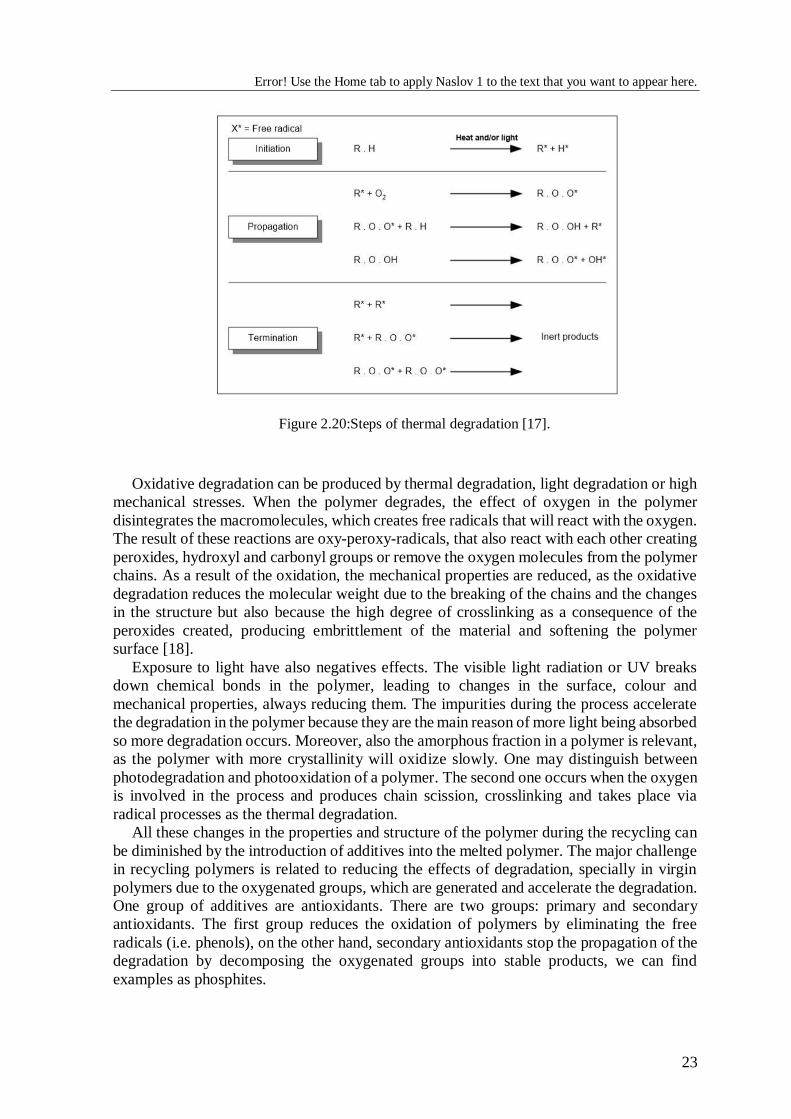
attack of atmospheric oxygen. The mechanism of thermal degradation is shown in
Figure 2.20, and its three main stages (initiation, propagation and termination) with their
respectives reactions, it is all started with the heat or light as it is thermal degradation, where
the free radical (R*) is created with the hydrogen atom with an umpaired electron (H*).
Later, the effect of the Oxygen (𝑂2) creates new free radicals with Oxygen (O*) and
peroxides as (OH*). The termination step consists of the creation of inert products that lower
the final properties of the polymer.
Error! Use the Home tab to apply Naslov 1 to the text that you want to appear here.
23
Figure 2.20:Steps of thermal degradation [17].
Oxidative degradation can be produced by thermal degradation, light degradation or high
mechanical stresses. When the polymer degrades, the effect of oxygen in the polymer
disintegrates the macromolecules, which creates free radicals that will react with the oxygen.
The result of these reactions are oxy-peroxy-radicals, that also react with each other creating
peroxides, hydroxyl and carbonyl groups or remove the oxygen molecules from the polymer
chains. As a result of the oxidation, the mechanical properties are reduced, as the oxidative
degradation reduces the molecular weight due to the breaking of the chains and the changes
in the structure but also because the high degree of crosslinking as a consequence of the
peroxides created, producing embrittlement of the material and softening the polymer
surface [18].
Exposure to light have also negatives effects. The visible light radiation or UV breaks
down chemical bonds in the polymer, leading to changes in the surface, colour and
mechanical properties, always reducing them. The impurities during the process accelerate
the degradation in the polymer because they are the main reason of more light being absorbed
so more degradation occurs. Moreover, also the amorphous fraction in a polymer is relevant,
as the polymer with more crystallinity will oxidize slowly. One may distinguish between
photodegradation and photooxidation of a polymer. The second one occurs when the oxygen
is involved in the process and produces chain scission, crosslinking and takes place via
radical processes as the thermal degradation.
All these changes in the properties and structure of the polymer during the recycling can
be diminished by the introduction of additives into the melted polymer. The major challenge
in recycling polymers is related to reducing the effects of degradation, specially in virgin
polymers due to the oxygenated groups, which are generated and accelerate the degradation.
One group of additives are antioxidants. There are two groups: primary and secondary
antioxidants. The first group reduces the oxidation of polymers by eliminating the free
radicals (i.e. phenols), on the other hand, secondary antioxidants stop the propagation of the
degradation by decomposing the oxygenated groups into stable products, we can find
examples as phosphites.
Error! Use the Home tab to apply Naslov 1 to the text that you want to appear here.
24
The role of stabilizing agents is to prevent the effects of the thermal degradation. The
effects of the additive will decrease over the time. In general, we differ two types: thermal
and photo stabilizers. When the combination of heat and oxygen causes the thermal
oxidation of the polymer and it results in the degradation by the appearance of highly reactive
free radicals, additives as hindered phenols help reducing the creation of this groups by
acting as peroxide radical decomposers, eliminating the groups. The light, especially in the
UV range starts to produce the photooxidation. The effect of photodegradation can be
reduced by the addition of UV absorbers, these additives absorb the UV radiation and
converts it to harmless infrared radiation or heat energy, an example of this additive is
benzophenone. Other type of additive are quenchers. These additives contain chromophore
groups, which are special light-absorbing groups that reduces the effect of the light by
absorbing the energy and transforming it into other forms less harmful for the polymer. The
last group of anti oxidants are HALS or hindered amine light stabilizers, which are small
amine groups that remove cyclically the free radicals that initiate the degradation so it never
occurs. For example, HALS are normally used with polyolefins or polyethylene [19]. As
mentioned before, one of the problems in polymers is the immiscibility between different
types of polymers, which can be eliminated by the action of compatibilizers, allowing the
blend between two polymers. This is mostly used in recycling blends and adding new
polymers to improve the properties. One example is the blend PP/PET which is usually
treated with thermoplastic rubbers. With the help of additives, the process of recycling
improves the efficiency, as the final properties are not reduced drastically. This leads also to
improvements in the economical and applicative field, allowing mixing different polymers
and increasing the life cycle of the polymers.
25
3 Literature research
3.1 Effect of recycling on physical properties
Recycling and studying of the process and properties of the plastics, especially
polypropylene is becoming more important due to its importance in various industries due
to its physical properties and variety of uses, such as automotive and household appliances.
In this master thesis we are going to focus on the effects of recycling onto the physical
properties of the polypropylene.
As it was explained in the previous chapter, the extrusion is the most used technique to
process and recycle thermoplastics, since more than half of the reprocessed plastics is being
recycled this way. Studying the effect of extrusion on the properties comes from the need to
recycle the materials and conserving all of the properties. However, normally we observe
decreasing properties during the recycling process.
When a material is extruded, the degradation process starts to accelerate, and the
molecular weight loss occurs because the chains start to break and become shorter. This
affects first the long chains. A molecular weight loss is observed already after the first
extruding cycle and the polypropylene continues to lose molecular weight with the following
cycles. After fourth extruding cycle, cross-linking starts to show due to the free radicals
formed by the scission of molecular chains. Meanwhile the polydispersity (𝑃𝐼 = �̅�𝑤 �̅�𝑛⁄ )
also decreases during the extrusions, mostly because with the continued scission suffered by
the molecular chain, homogeneous molecular sizes are produced, but also the imperfections
grow with the extrusions, leading to a loss in thermal properties. This results in lower thermal
stability with the extrusion cycles, as new free radicals are created, leading to a higher
degradation [20].
3.1.1 Effect of recycling on thermal properties
The thermal degradation process of the recycled and virgin polypropylene is the same.
This is known from the DSC measurements, where the peaks have the same shape and size,
and are only shifted, meaning that the degradation suffered by the polymer is only due to the
chain scission and there is no different molecular size structure formed. This would lead to
different kinetics degradation, so one can affirm that the number of free radicals created after
the first extrusion is not big enough to change the kinetic of degradation.
Error! Use the Home tab to apply Naslov 1 to the text that you want to appear here.
26
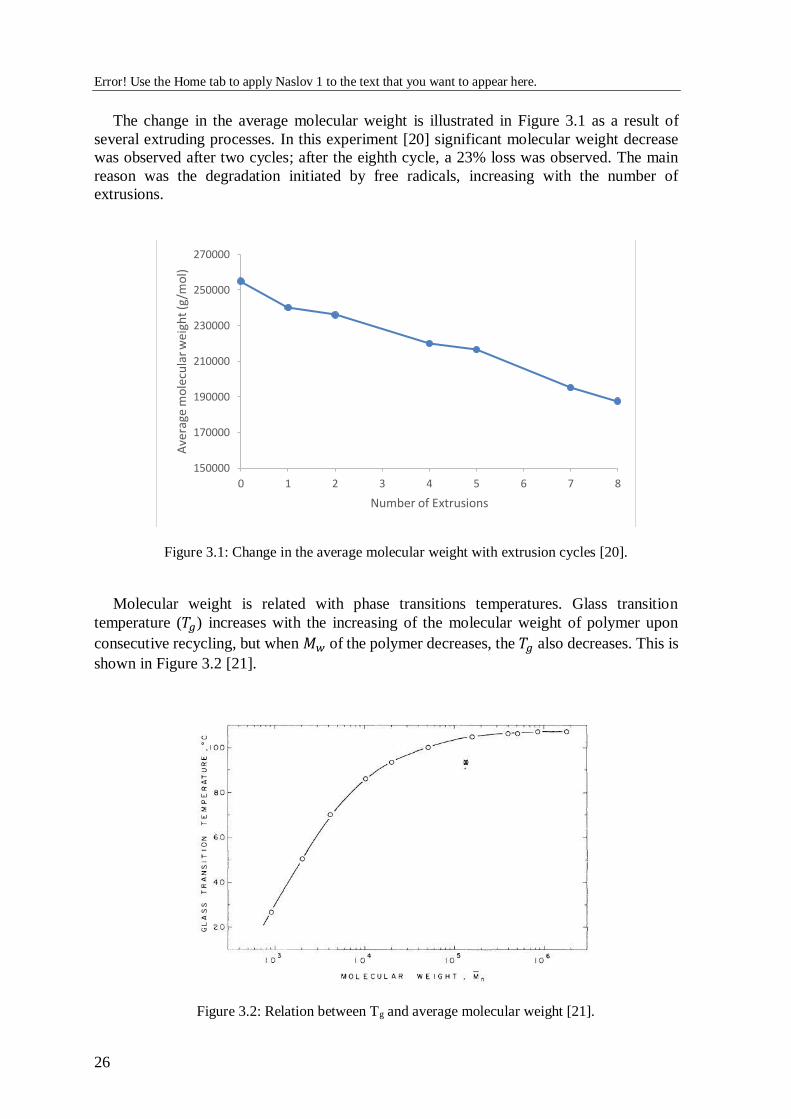
The change in the average molecular weight is illustrated in Figure 3.1 as a result of
several extruding processes. In this experiment [20] significant molecular weight decrease
was observed after two cycles; after the eighth cycle, a 23% loss was observed. The main
reason was the degradation initiated by free radicals, increasing with the number of
extrusions.
Figure 3.1: Change in the average molecular weight with extrusion cycles [20].
Molecular weight is related with phase transitions temperatures. Glass transition
temperature (𝑇𝑔) increases with the increasing of the molecular weight of polymer upon
consecutive recycling, but when 𝑀𝑤 of the polymer decreases, the 𝑇𝑔 also decreases. This is
shown in Figure 3.2 [21].
Figure 3.2: Relation between Tg and average molecular weight [21].
150000
170000
190000
210000
230000
250000
270000
0 1 2 3 4 5 6 7 8
Ave
rage
mo
lecu
lar w
eigh
t (g
/mo
l)
Number of Extrusions

Error! Use the Home tab to apply Naslov 1 to the text that you want to appear here.
27
As the molecular weight decreases with the processing cycles, the enthalpy of fusion
increases, which means that more heat is required to get the polymer into the melted state.
The difference in the enthalpy of fusion between the recycled and virgin PP is due higher
amount of chains or particles in the polymer, for which the more heat is required to break
them. Moreover, the melting temperature (𝑇𝑚) is lower, because of the reduction of
molecular weight. Mandelkern [22] tested polyethylene and the results are shown in Figure
3.3. In the study, three different types of polyethylene were tested, each with different
molecular weight. In the Figure, the higher molecular weight pallet is represented with black
squares, and the lower molecular weight pallet with white circles. The graph shows the
different results obtained and it is clearly seen that the enthalpy of fusion increase with the
number of extrusions and with the decrease of the molecular weight.
Figure 3.3: Enthalpy of fusion as a function of Molecular Weight for polyethylene [22].
Furthermore, lower molecular weights correspond to lower entanglements, which means
that higher mobility of the particles is reflected in higher crystallinity of the polypropylene.
This increase can be also explained by the fact that macromolecules with lower molecular
weight act as nucleating agents, which leads to the crystallization of semicrystalline
polymers by folding and building bigger crystal structures. Also, crystallization temperature
increases with the number of extrusions, as a result of the decrease of molecular weight.
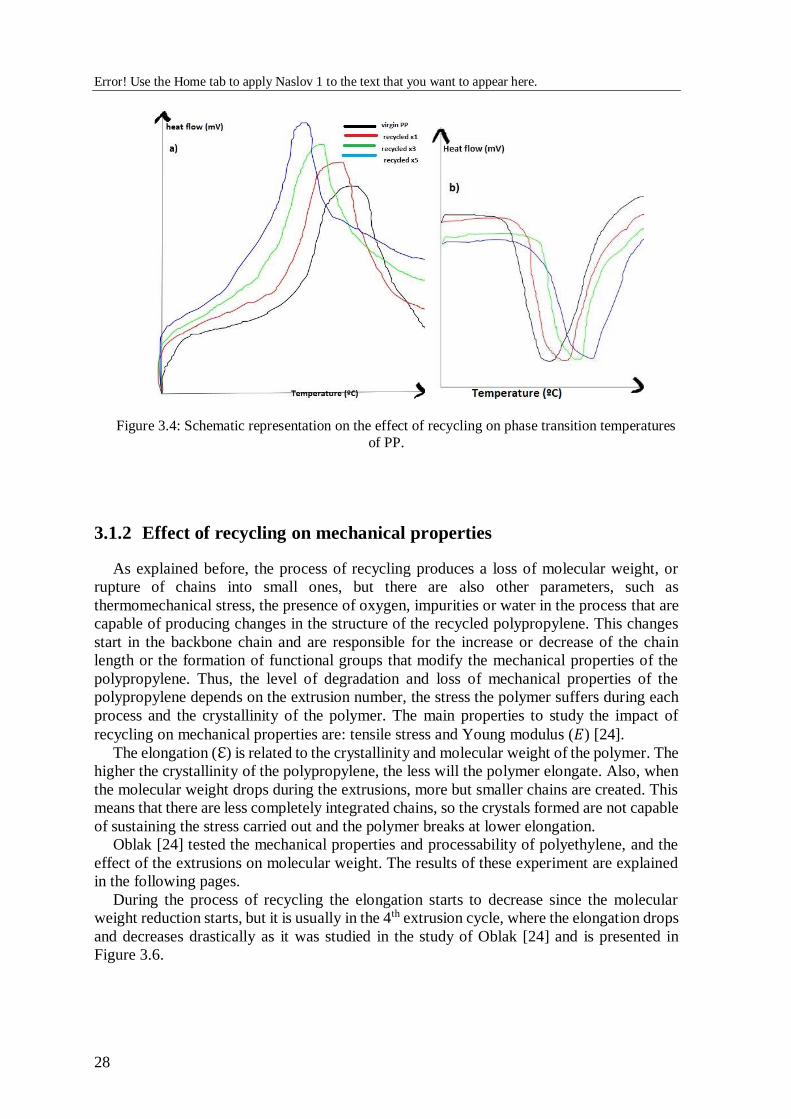
To summarize the influence of the recycling on the phase transition temperature Figure
3.4 was recreated, schematically representing the behaviour of the recycled polypropylene
during the heating a) and the cooling process b) of a DSC graph.
Error! Use the Home tab to apply Naslov 1 to the text that you want to appear here.
28
Figure 3.4: Schematic representation on the effect of recycling on phase transition temperatures
of PP.
3.1.2 Effect of recycling on mechanical properties
As explained before, the process of recycling produces a loss of molecular weight, or
rupture of chains into small ones, but there are also other parameters, such as
thermomechanical stress, the presence of oxygen, impurities or water in the process that are
capable of producing changes in the structure of the recycled polypropylene. This changes
start in the backbone chain and are responsible for the increase or decrease of the chain
length or the formation of functional groups that modify the mechanical properties of the
polypropylene. Thus, the level of degradation and loss of mechanical properties of the
polypropylene depends on the extrusion number, the stress the polymer suffers during each
process and the crystallinity of the polymer. The main properties to study the impact of
recycling on mechanical properties are: tensile stress and Young modulus (𝐸) [24].
The elongation (ℇ) is related to the crystallinity and molecular weight of the polymer. The
higher the crystallinity of the polypropylene, the less will the polymer elongate. Also, when
the molecular weight drops during the extrusions, more but smaller chains are created. This
means that there are less completely integrated chains, so the crystals formed are not capable
of sustaining the stress carried out and the polymer breaks at lower elongation.
Oblak [24] tested the mechanical properties and processability of polyethylene, and the
effect of the extrusions on molecular weight. The results of these experiment are explained
in the following pages.
During the process of recycling the elongation starts to decrease since the molecular
weight reduction starts, but it is usually in the 4th extrusion cycle, where the elongation drops
and decreases drastically as it was studied in the study of Oblak [24] and is presented in
Figure 3.6.
Error! Use the Home tab to apply Naslov 1 to the text that you want to appear here.
29
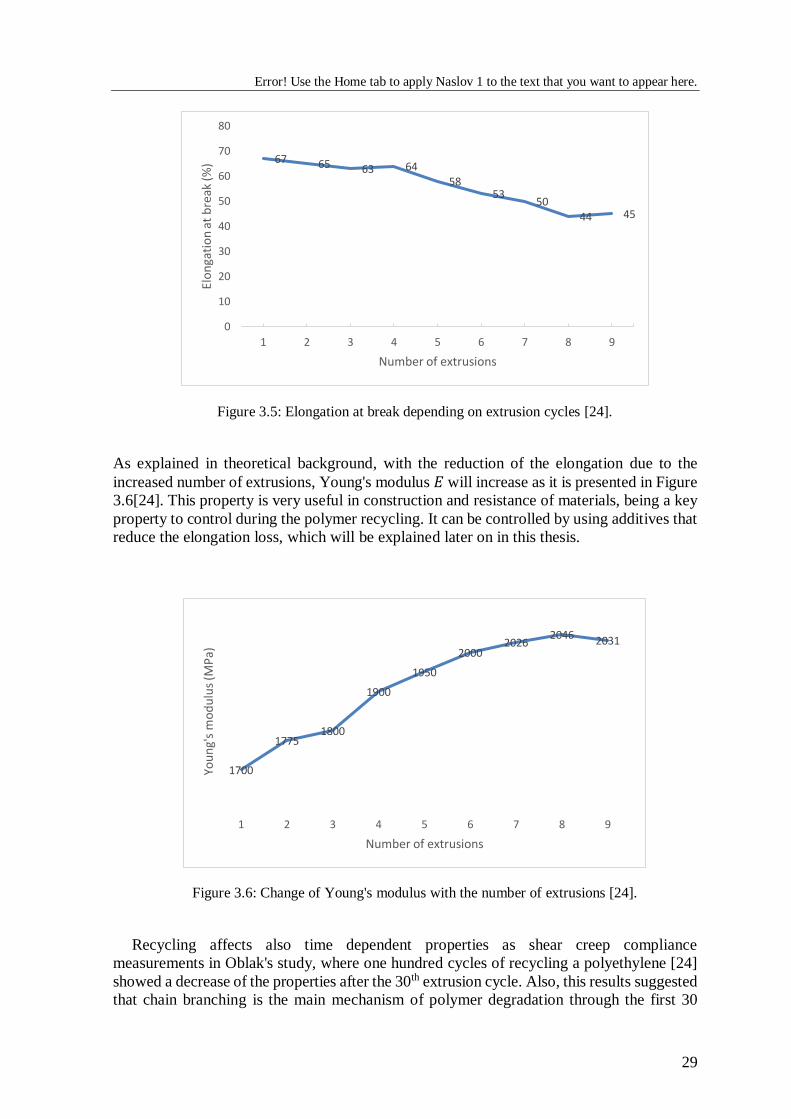
Figure 3.5: Elongation at break depending on extrusion cycles [24].
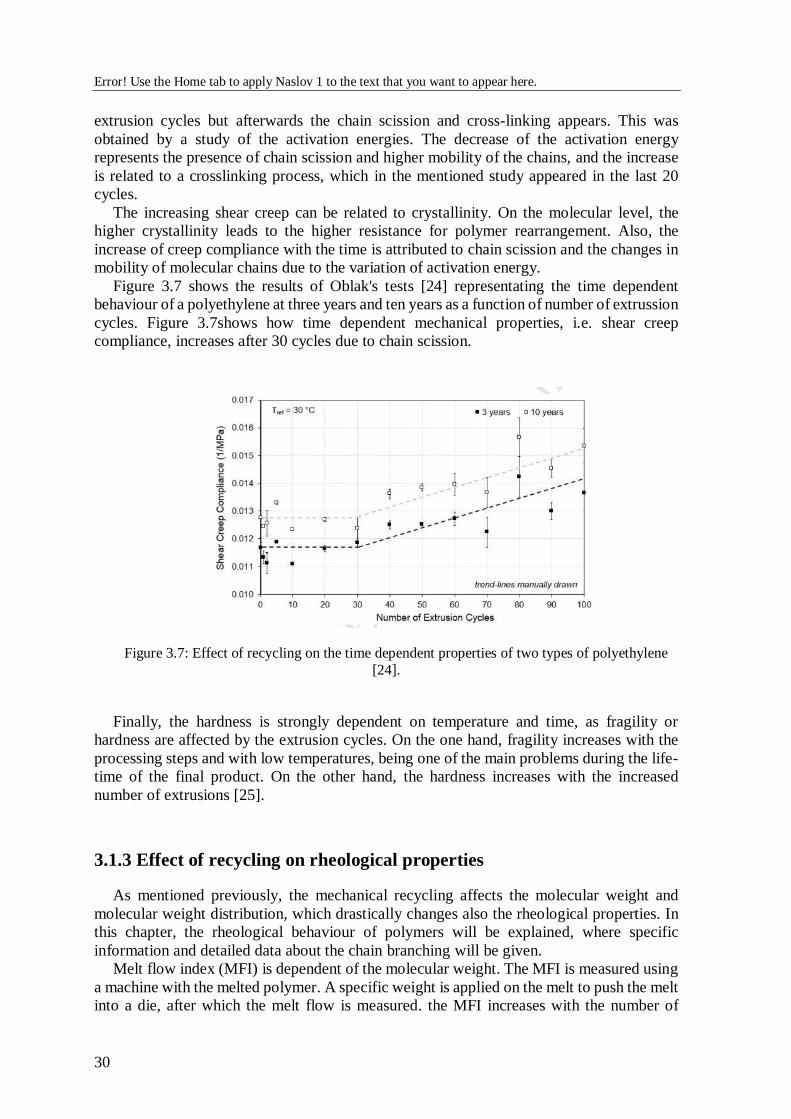
As explained in theoretical background, with the reduction of the elongation due to the
increased number of extrusions, Young's modulus 𝐸 will increase as it is presented in Figure
3.6[24]. This property is very useful in construction and resistance of materials, being a key
property to control during the polymer recycling. It can be controlled by using additives that
reduce the elongation loss, which will be explained later on in this thesis.
Figure 3.6: Change of Young's modulus with the number of extrusions [24].
Recycling affects also time dependent properties as shear creep compliance
measurements in Oblak's study, where one hundred cycles of recycling a polyethylene [24]
showed a decrease of the properties after the 30th extrusion cycle. Also, this results suggested
that chain branching is the main mechanism of polymer degradation through the first 30
67 65 63 6458
5350
44 45
0
10
20
30
40
50
60
70
80
1 2 3 4 5 6 7 8 9
Elo
nga
tio
n a
t b
reak
(%)
Number of extrusions
1700
17751800
1900
1950
20002026
2046 2031
1 2 3 4 5 6 7 8 9
You
ng'
s m
od
ulu
s (M
Pa)
Number of extrusions
Error! Use the Home tab to apply Naslov 1 to the text that you want to appear here.
30
extrusion cycles but afterwards the chain scission and cross-linking appears. This was
obtained by a study of the activation energies. The decrease of the activation energy
represents the presence of chain scission and higher mobility of the chains, and the increase
is related to a crosslinking process, which in the mentioned study appeared in the last 20
cycles.
The increasing shear creep can be related to crystallinity. On the molecular level, the
higher crystallinity leads to the higher resistance for polymer rearrangement. Also, the
increase of creep compliance with the time is attributed to chain scission and the changes in
mobility of molecular chains due to the variation of activation energy.
Figure 3.7 shows the results of Oblak's tests [24] representating the time dependent
behaviour of a polyethylene at three years and ten years as a function of number of extrussion
cycles. Figure 3.7shows how time dependent mechanical properties, i.e. shear creep
compliance, increases after 30 cycles due to chain scission.
Figure 3.7: Effect of recycling on the time dependent properties of two types of polyethylene
[24].
Finally, the hardness is strongly dependent on temperature and time, as fragility or
hardness are affected by the extrusion cycles. On the one hand, fragility increases with the
processing steps and with low temperatures, being one of the main problems during the life-
time of the final product. On the other hand, the hardness increases with the increased
number of extrusions [25].
3.1.3 Effect of recycling on rheological properties
As mentioned previously, the mechanical recycling affects the molecular weight and
molecular weight distribution, which drastically changes also the rheological properties. In
this chapter, the rheological behaviour of polymers will be explained, where specific
information and detailed data about the chain branching will be given.
Melt flow index (MFI) is dependent of the molecular weight. The MFI is measured using
a machine with the melted polymer. A specific weight is applied on the melt to push the melt
into a die, after which the melt flow is measured. the MFI increases with the number of
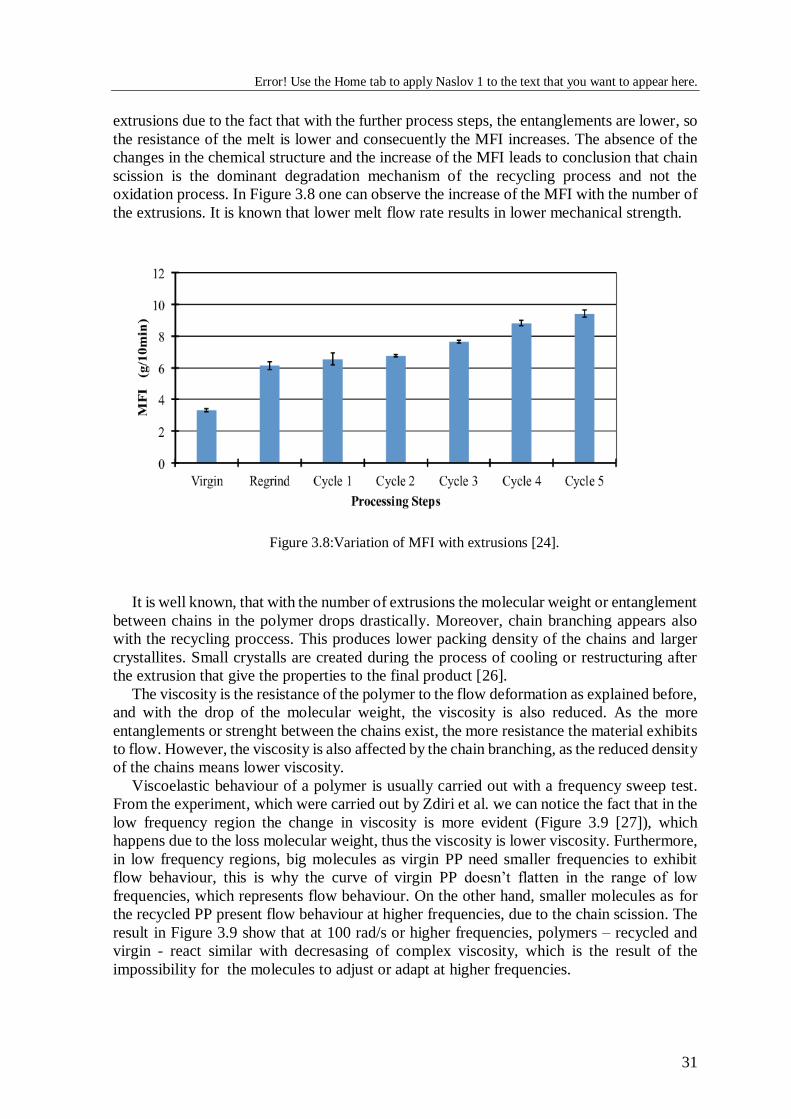
Error! Use the Home tab to apply Naslov 1 to the text that you want to appear here.
31
extrusions due to the fact that with the further process steps, the entanglements are lower, so
the resistance of the melt is lower and consecuently the MFI increases. The absence of the
changes in the chemical structure and the increase of the MFI leads to conclusion that chain
scission is the dominant degradation mechanism of the recycling process and not the
oxidation process. In Figure 3.8 one can observe the increase of the MFI with the number of
the extrusions. It is known that lower melt flow rate results in lower mechanical strength.
Figure 3.8:Variation of MFI with extrusions [24].
It is well known, that with the number of extrusions the molecular weight or entanglement
between chains in the polymer drops drastically. Moreover, chain branching appears also
with the recycling proccess. This produces lower packing density of the chains and larger
crystallites. Small crystalls are created during the process of cooling or restructuring after
the extrusion that give the properties to the final product [26].
The viscosity is the resistance of the polymer to the flow deformation as explained before,
and with the drop of the molecular weight, the viscosity is also reduced. As the more
entanglements or strenght between the chains exist, the more resistance the material exhibits
to flow. However, the viscosity is also affected by the chain branching, as the reduced density
of the chains means lower viscosity.
Viscoelastic behaviour of a polymer is usually carried out with a frequency sweep test.
From the experiment, which were carried out by Zdiri et al. we can notice the fact that in the
low frequency region the change in viscosity is more evident (Figure 3.9 [27]), which
happens due to the loss molecular weight, thus the viscosity is lower viscosity. Furthermore,
in low frequency regions, big molecules as virgin PP need smaller frequencies to exhibit
flow behaviour, this is why the curve of virgin PP doesn’t flatten in the range of low
frequencies, which represents flow behaviour. On the other hand, smaller molecules as for
the recycled PP present flow behaviour at higher frequencies, due to the chain scission. The
result in Figure 3.9 show that at 100 rad/s or higher frequencies, polymers – recycled and
virgin - react similar with decresasing of complex viscosity, which is the result of the
impossibility for the molecules to adjust or adapt at higher frequencies.
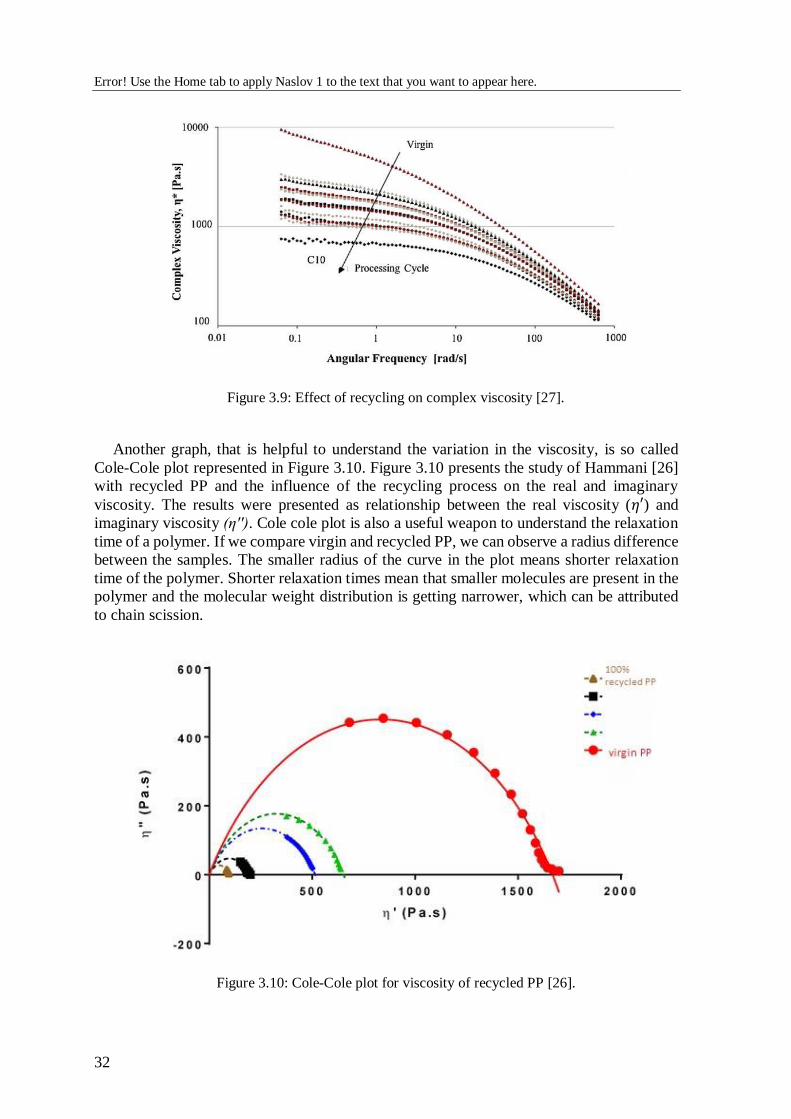
Error! Use the Home tab to apply Naslov 1 to the text that you want to appear here.
32
Figure 3.9: Effect of recycling on complex viscosity [27].
Another graph, that is helpful to understand the variation in the viscosity, is so called
Cole-Cole plot represented in Figure 3.10. Figure 3.10 presents the study of Hammani [26]
with recycled PP and the influence of the recycling process on the real and imaginary
viscosity. The results were presented as relationship between the real viscosity (𝜂′) and
imaginary viscosity (η''). Cole cole plot is also a useful weapon to understand the relaxation
time of a polymer. If we compare virgin and recycled PP, we can observe a radius difference
between the samples. The smaller radius of the curve in the plot means shorter relaxation
time of the polymer. Shorter relaxation times mean that smaller molecules are present in the
polymer and the molecular weight distribution is getting narrower, which can be attributed
to chain scission.
Figure 3.10: Cole-Cole plot for viscosity of recycled PP [26].
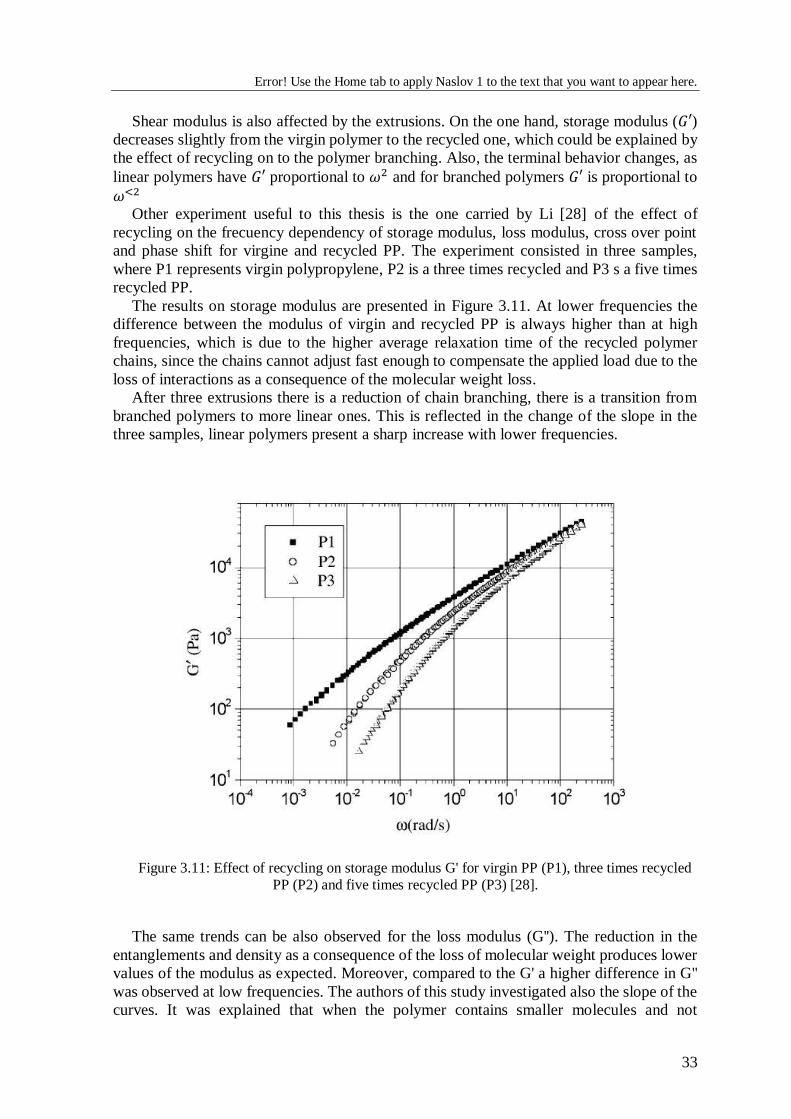
Error! Use the Home tab to apply Naslov 1 to the text that you want to appear here.
33
Shear modulus is also affected by the extrusions. On the one hand, storage modulus (𝐺′) decreases slightly from the virgin polymer to the recycled one, which could be explained by
the effect of recycling on to the polymer branching. Also, the terminal behavior changes, as
linear polymers have 𝐺′ proportional to 𝜔2 and for branched polymers 𝐺′ is proportional to
𝜔<2 Other experiment useful to this thesis is the one carried by Li [28] of the effect of
recycling on the frecuency dependency of storage modulus, loss modulus, cross over point
and phase shift for virgine and recycled PP. The experiment consisted in three samples,
where P1 represents virgin polypropylene, P2 is a three times recycled and P3 s a five times
recycled PP.
The results on storage modulus are presented in Figure 3.11. At lower frequencies the
difference between the modulus of virgin and recycled PP is always higher than at high
frequencies, which is due to the higher average relaxation time of the recycled polymer
chains, since the chains cannot adjust fast enough to compensate the applied load due to the
loss of interactions as a consequence of the molecular weight loss.
After three extrusions there is a reduction of chain branching, there is a transition from
branched polymers to more linear ones. This is reflected in the change of the slope in the
three samples, linear polymers present a sharp increase with lower frequencies.
Figure 3.11: Effect of recycling on storage modulus G' for virgin PP (P1), three times recycled
PP (P2) and five times recycled PP (P3) [28].
The same trends can be also observed for the loss modulus (G''). The reduction in the
entanglements and density as a consequence of the loss of molecular weight produces lower
values of the modulus as expected. Moreover, compared to the G' a higher difference in G''
was observed at low frequencies. The authors of this study investigated also the slope of the
curves. It was explained that when the polymer contains smaller molecules and not

Error! Use the Home tab to apply Naslov 1 to the text that you want to appear here.
34
branching the slope of the curve is gentle, while the slope of the branched polymers is much
more steep due to the effect of strong interactions between the chains.
If we compare the evolution of 𝐺′ and 𝐺′′ with frequency, we can investigate the point,
where the moduli are the same. This point is called cross-over modulus point (G = 𝐺′= 𝐺′′) and the frequency, at which the moduli are the same, is called cross-over frequency, as it is
shown in Figure 3.12. As it can be seen from the figure, with the extrusions, the cross over
point is higher (at higher frequencies with higher values of modulus). With the rise of the
cross-over point, the relaxation times are smaller for the molecules, which is characteristic
for shorter molecules and it reflects chain scission.
Figure 3.12:Crossover point for virgin polypropylene (V), three times recycled PP (R3) and
seven times recycled PP (R7) [28].
It is also important to understand how the phase shift varies during the processing. This
relationship between 𝐺′ and 𝐺′′ can be explained with the cross-over point and the evoluton
of 𝛿. One can see that with the number of extrusions tan 𝛿 decreases as the difference
between 𝐺′ and 𝐺′′ is lower this lower difference between both modulus is explained by the
loss of molecular weight. Figure 3.13 shows the behaviour of the PP polymer as the results
of the experiment of Li and coworkers [28]. The results showed that the phase shift at low
frequencies is higher and reaching the peak at frequency of aproximately 1 Hz. Then at
higher frequencies the phase shift decreases because the molecules cannot adjust in time.
Phase shift also decreases with the extruding cycles as it is shown with the virgin PP, one
time recycled PP, three times recycled PP and five times recycled PP.
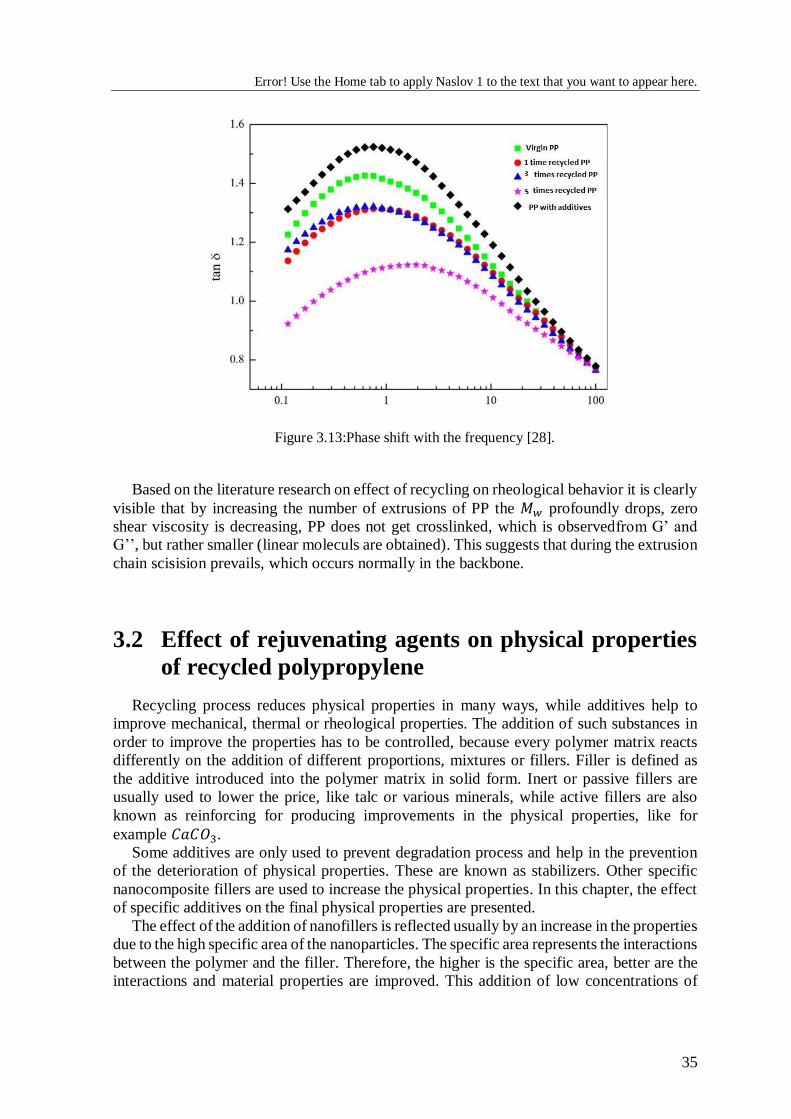
Error! Use the Home tab to apply Naslov 1 to the text that you want to appear here.
35
Figure 3.13:Phase shift with the frequency [28].
Based on the literature research on effect of recycling on rheological behavior it is clearly
visible that by increasing the number of extrusions of PP the 𝑀𝑤 profoundly drops, zero
shear viscosity is decreasing, PP does not get crosslinked, which is observedfrom G’ and
G’’, but rather smaller (linear moleculs are obtained). This suggests that during the extrusion
chain scisision prevails, which occurs normally in the backbone.
3.2 Effect of rejuvenating agents on physical properties
of recycled polypropylene
Recycling process reduces physical properties in many ways, while additives help to
improve mechanical, thermal or rheological properties. The addition of such substances in
order to improve the properties has to be controlled, because every polymer matrix reacts
differently on the addition of different proportions, mixtures or fillers. Filler is defined as
the additive introduced into the polymer matrix in solid form. Inert or passive fillers are
usually used to lower the price, like talc or various minerals, while active fillers are also
known as reinforcing for producing improvements in the physical properties, like for
example 𝐶𝑎𝐶𝑂3.
Some additives are only used to prevent degradation process and help in the prevention
of the deterioration of physical properties. These are known as stabilizers. Other specific
nanocomposite fillers are used to increase the physical properties. In this chapter, the effect
of specific additives on the final physical properties are presented.
The effect of the addition of nanofillers is reflected usually by an increase in the properties
due to the high specific area of the nanoparticles. The specific area represents the interactions
between the polymer and the filler. Therefore, the higher is the specific area, better are the
interactions and material properties are improved. This addition of low concentrations of
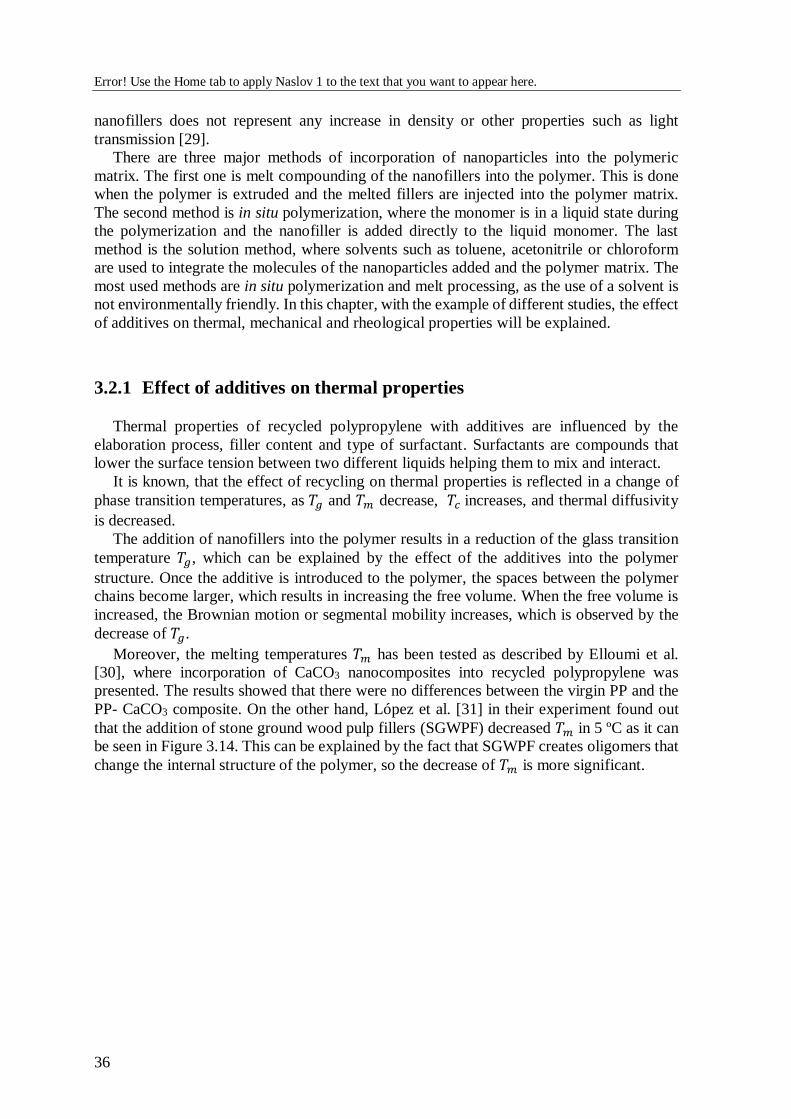
Error! Use the Home tab to apply Naslov 1 to the text that you want to appear here.
36
nanofillers does not represent any increase in density or other properties such as light
transmission [29].
There are three major methods of incorporation of nanoparticles into the polymeric
matrix. The first one is melt compounding of the nanofillers into the polymer. This is done
when the polymer is extruded and the melted fillers are injected into the polymer matrix.
The second method is in situ polymerization, where the monomer is in a liquid state during
the polymerization and the nanofiller is added directly to the liquid monomer. The last
method is the solution method, where solvents such as toluene, acetonitrile or chloroform
are used to integrate the molecules of the nanoparticles added and the polymer matrix. The
most used methods are in situ polymerization and melt processing, as the use of a solvent is
not environmentally friendly. In this chapter, with the example of different studies, the effect
of additives on thermal, mechanical and rheological properties will be explained.
3.2.1 Effect of additives on thermal properties
Thermal properties of recycled polypropylene with additives are influenced by the
elaboration process, filler content and type of surfactant. Surfactants are compounds that
lower the surface tension between two different liquids helping them to mix and interact.
It is known, that the effect of recycling on thermal properties is reflected in a change of
phase transition temperatures, as 𝑇𝑔 and 𝑇𝑚 decrease, 𝑇𝑐 increases, and thermal diffusivity
is decreased.
The addition of nanofillers into the polymer results in a reduction of the glass transition
temperature 𝑇𝑔, which can be explained by the effect of the additives into the polymer
structure. Once the additive is introduced to the polymer, the spaces between the polymer
chains become larger, which results in increasing the free volume. When the free volume is
increased, the Brownian motion or segmental mobility increases, which is observed by the
decrease of 𝑇𝑔.
Moreover, the melting temperatures 𝑇𝑚 has been tested as described by Elloumi et al.
[30], where incorporation of CaCO3 nanocomposites into recycled polypropylene was
presented. The results showed that there were no differences between the virgin PP and the
PP- CaCO3 composite. On the other hand, López et al. [31] in their experiment found out
that the addition of stone ground wood pulp fillers (SGWPF) decreased 𝑇𝑚 in 5 ºC as it can
be seen in Figure 3.14. This can be explained by the fact that SGWPF creates oligomers that
change the internal structure of the polymer, so the decrease of 𝑇𝑚 is more significant.

Error! Use the Home tab to apply Naslov 1 to the text that you want to appear here.
37
Figure 3.14: Effect of SGWP content on melting temperature of recycled PP 31].
On the other hand, the addition of the aditives increases the crystallization temperature
(Tc). This can be explained by the role of the additives as nucleating agents, which cause the
increase in 𝑇𝑐 and crystallinity. In work of Ajorloo et al. [32] the effect of
polypropylene/graphite (GnP) nanopallets was studied and the effect of the size as short and
long fibers where tested with lenghts of 100𝜇m and 1500𝜇m, respectively. Moreover, their
dependence on concentration was studied. The results showed that the recycled
polypropylene exhibited higher 𝑇𝑐 for concentrations higher than 4% as it can be seen in
Figure 3.15, where PBH and PBE represent the branched PP and F13E and F13H represent
linear PP with different lenghts 100 𝜇𝑚 (F13H and PBH) and 1500 𝜇𝑚 (PBE and F13E).
Figure 3.15: Effect of GnP on crystallization temperature for different PP samples [32].
Error! Use the Home tab to apply Naslov 1 to the text that you want to appear here.
38
Other authors such as Patnaik et al. [33] tested the composites of recycled polypropylene
with the incorporation of different concentration of 500 mesh and 30nm of diameter talc
nanofillers with boehmite alumina (BAL). These different concentrations (1%, 2%...) in
weight volumetric (%) proved that the higher concentration of nanocomposites had the
higher concentration of nuceating agents and the results, that are shown in Figure 3.16,
support the previous experiments as 𝑇𝑐 increased and 𝑇𝑚 decreased with the addition of the
aditives.
Figure 3.16: Effect of different concentration of talc nanocomposites on 𝑇𝑐(left) and 𝑇𝑚.(right)
[33]
Crystallinity is also affected by the addition of additives. Some experiments revealed that
the addition of nanofillers to the polymer increases crystallinity by acting as nucleating
agents. The crystallinity at lower concentrations is higher due to the nucleating agent effect
of the additive, letting microcrystals to grow in the molecules and also, because the higher
specific area of additive increases the crystallization in the nucleating stage. At higher
concentrations, the additive decreases the crystallinity due to a rise of the defects in the
macromolecular chains which reduces the crystal growth. Figure 3.17 reflects the results of
the experiment carried out by Gomes Simanke et al. [34], where polypropylene was tested
in addition of two different nucleating agents additives, 1,3:2,4-bis(3,4-
dimethylbenzylidene) sorbitol (Millad® 3988 from Milliken) (NA) and sodium benzoate
(NB). The first plot corresponds to the PP+NA mix, the content of the additive is represented
by an increasing scale of numbers, thus, NA 3 is the sample with the highest content of
additive and NA 1 the sample with the lowest concentration. The same criterium is applied
in the second plot that shows the PP+NB behaviour. These two substances explain perfectly
the influence of additives on crystallinity as the results of the PP + NA and PP + NB mix.
As it is presented in Figure 3.17A, the slope or crystallization rate, which is the time to
achieve a specific crystallinity degree, increases as the proportion of the additive increase in
the PP + NA samples. This leaded to the conclusion that some additives such as sorbitol
derivatives (NA) need a minimum concentration to act as a nucleating agent. On the other
hand, the crystallization rate decreases with the increase of the NB additive content. The
high concentration of NB leads to the agglomeration and the nucleating efficiency of
nucleating agent decreases.

Error! Use the Home tab to apply Naslov 1 to the text that you want to appear here.
39
Figure 3.17: Effect of additives on crystallization rate of PP with different additives (A and B)
and different concentrations (lowest corresponds 1 and highest 3) [34].
Thermal conductivity also increases with the increasing concentration of nanoparticles
and crystallinity level. This is because nanoparticles present high thermal conductivity and
when the fillers are in the polymer matrix they transfer the heat. In their study with recycled
PP (rPP) and virgin PP (vPP), Hadi and his coworkers [35] studied the influence of 𝐶𝑎𝐶𝑂3
on thermal conductivity. The results, shown in Figure 3.18, indicate, that the thermal
conductivity is higher with the increased addition of 𝐶𝑎𝐶𝑂3.

Error! Use the Home tab to apply Naslov 1 to the text that you want to appear here.
40
Figure 3.18: Effect of 𝐶𝑎𝐶𝑂3 in thermal conductivity of recycled PP (rPP) and virgin PP
(vPP) [35].
Thermal additives also help to postpone the onset of thermal degradation, as the additives
improve the thermal stability. Patknaik and his coworkers [33] proved that when they tested
three different concentration (1%, 3% and 5%) of boehmite alumina (BAL) in recycled
polypropylene. The results of the TGA are shown in Figure 3.19, where the addition of BAL
retarded the degradation temperature, with a 200 ºC difference between the recycled PP and
the recycled PP with 5% of BAL.
Figure 3.19: Effect of BAL additives on thermal degradation of recycled PP (rPP) [33].
0
0.05
0.1
0.15
0.2
0.25
0.3
0.35
0.4
0.45
0 2 4 6 8 10
Ther
mal
co
nd
uct
ivit
y (W
/mK
)
CaCO3 percentage (%)
vPP rPP
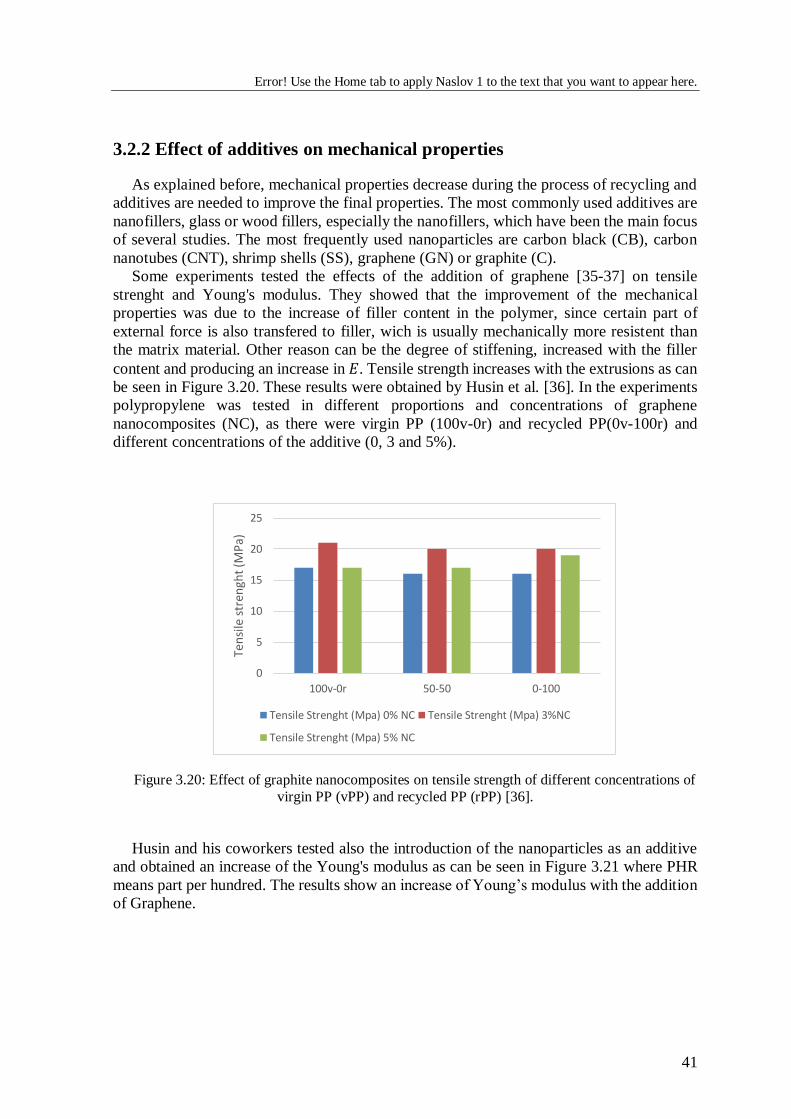
Error! Use the Home tab to apply Naslov 1 to the text that you want to appear here.
41
3.2.2 Effect of additives on mechanical properties
As explained before, mechanical properties decrease during the process of recycling and
additives are needed to improve the final properties. The most commonly used additives are
nanofillers, glass or wood fillers, especially the nanofillers, which have been the main focus
of several studies. The most frequently used nanoparticles are carbon black (CB), carbon
nanotubes (CNT), shrimp shells (SS), graphene (GN) or graphite (C).
Some experiments tested the effects of the addition of graphene [35-37] on tensile
strenght and Young's modulus. They showed that the improvement of the mechanical
properties was due to the increase of filler content in the polymer, since certain part of
external force is also transfered to filler, wich is usually mechanically more resistent than
the matrix material. Other reason can be the degree of stiffening, increased with the filler
content and producing an increase in 𝐸. Tensile strength increases with the extrusions as can
be seen in Figure 3.20. These results were obtained by Husin et al. [36]. In the experiments
polypropylene was tested in different proportions and concentrations of graphene
nanocomposites (NC), as there were virgin PP (100v-0r) and recycled PP(0v-100r) and
different concentrations of the additive (0, 3 and 5%).
Figure 3.20: Effect of graphite nanocomposites on tensile strength of different concentrations of
virgin PP (vPP) and recycled PP (rPP) [36].
Husin and his coworkers tested also the introduction of the nanoparticles as an additive
and obtained an increase of the Young's modulus as can be seen in Figure 3.21 where PHR
means part per hundred. The results show an increase of Young’s modulus with the addition
of Graphene.
0
5
10
15
20
25
100v-0r 50-50 0-100
Ten
sile
str
engh
t (M
Pa)
Tensile Strenght (Mpa) 0% NC Tensile Strenght (Mpa) 3%NC
Tensile Strenght (Mpa) 5% NC
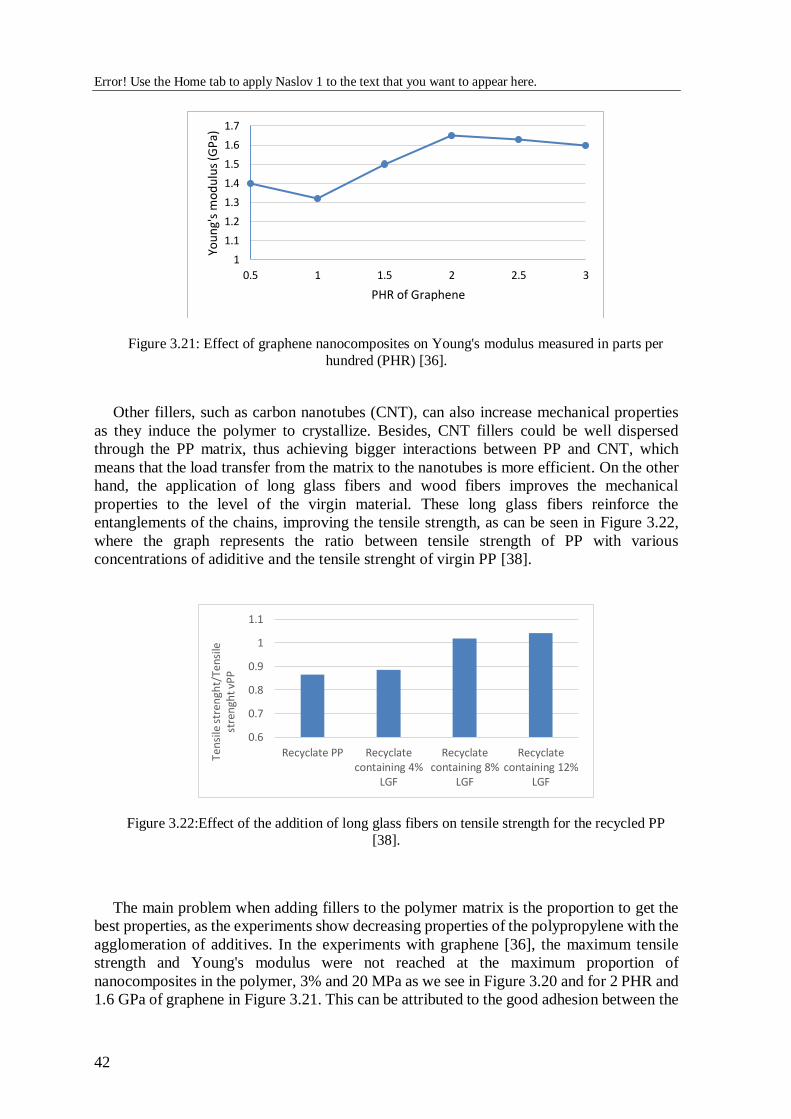
Error! Use the Home tab to apply Naslov 1 to the text that you want to appear here.
42
Figure 3.21: Effect of graphene nanocomposites on Young's modulus measured in parts per
hundred (PHR) [36].
Other fillers, such as carbon nanotubes (CNT), can also increase mechanical properties
as they induce the polymer to crystallize. Besides, CNT fillers could be well dispersed
through the PP matrix, thus achieving bigger interactions between PP and CNT, which
means that the load transfer from the matrix to the nanotubes is more efficient. On the other
hand, the application of long glass fibers and wood fibers improves the mechanical
properties to the level of the virgin material. These long glass fibers reinforce the
entanglements of the chains, improving the tensile strength, as can be seen in Figure 3.22,
where the graph represents the ratio between tensile strength of PP with various
concentrations of adiditive and the tensile strenght of virgin PP [38].
Figure 3.22:Effect of the addition of long glass fibers on tensile strength for the recycled PP
[38].
The main problem when adding fillers to the polymer matrix is the proportion to get the
best properties, as the experiments show decreasing properties of the polypropylene with the
agglomeration of additives. In the experiments with graphene [36], the maximum tensile
strength and Young's modulus were not reached at the maximum proportion of
nanocomposites in the polymer, 3% and 20 MPa as we see in Figure 3.20 and for 2 PHR and
1.6 GPa of graphene in Figure 3.21. This can be attributed to the good adhesion between the
1
1.1
1.2
1.3
1.4
1.5
1.6
1.7
0.5 1 1.5 2 2.5 3
You
ng'
s m
od
ulu
s (G
Pa)
PHR of Graphene
0.6
0.7
0.8
0.9
1
1.1
Recyclate PP Recyclatecontaining 4%
LGF
Recyclatecontaining 8%
LGF
Recyclatecontaining 12%
LGF
Te
nsi
le s
tre
ngh
t/Te
nsi
le
stre
ngh
t vP
P

Error! Use the Home tab to apply Naslov 1 to the text that you want to appear here.
43
nanoclay particles and the recycled polypropylene matrix, thus the mobility of the polymer
chains is restricted at higher concentrations. On the other hand, to get improved properties
with long glass fibers one needs to incorporate higher concentrations as can be seen in Figure
3.22.
However, the studies [35-38] revealed that increasing the concentration of nanofiller, the
tensile strength and Young's modulus decreases, this is due to non-uniformity of the
disperded nanofiller and consequently loss of surface area needed for load transfer between
filler and matrix material.
Glass fibers improve tensile strength. This happens because glass fibers adjust in the
structure and reinforce the entanglements. Moreover, the addition of virgin PP [39] was
studied as a reinforcer with three different polypropylene, recycled PP, virgin PP and
recycled PP with glass virgin fibres and the results are shown in Figure 3.23. Virgin PP
shows a bigger tensile strength and impact strength than recycled PP, but the results showed
that the reinforcement of virgin fibers into recycled polymers increased the impact strength.
Moreover, the reduction in elongation with the extrusions and the introduction of additives
was observed.
Figure 3.23: Stress-strain curves for different PP compositions [39].
This improvement of properties is a result of the decrease of the impact strenght or
toughness. This decrease with the addition of nanoparticles into the matrix happens because
of the agglomeration of the nanoparticles stiffening the polymer chains which results in a
less impact energy absorbed by the polymer and favoring the crack propagation. To solve
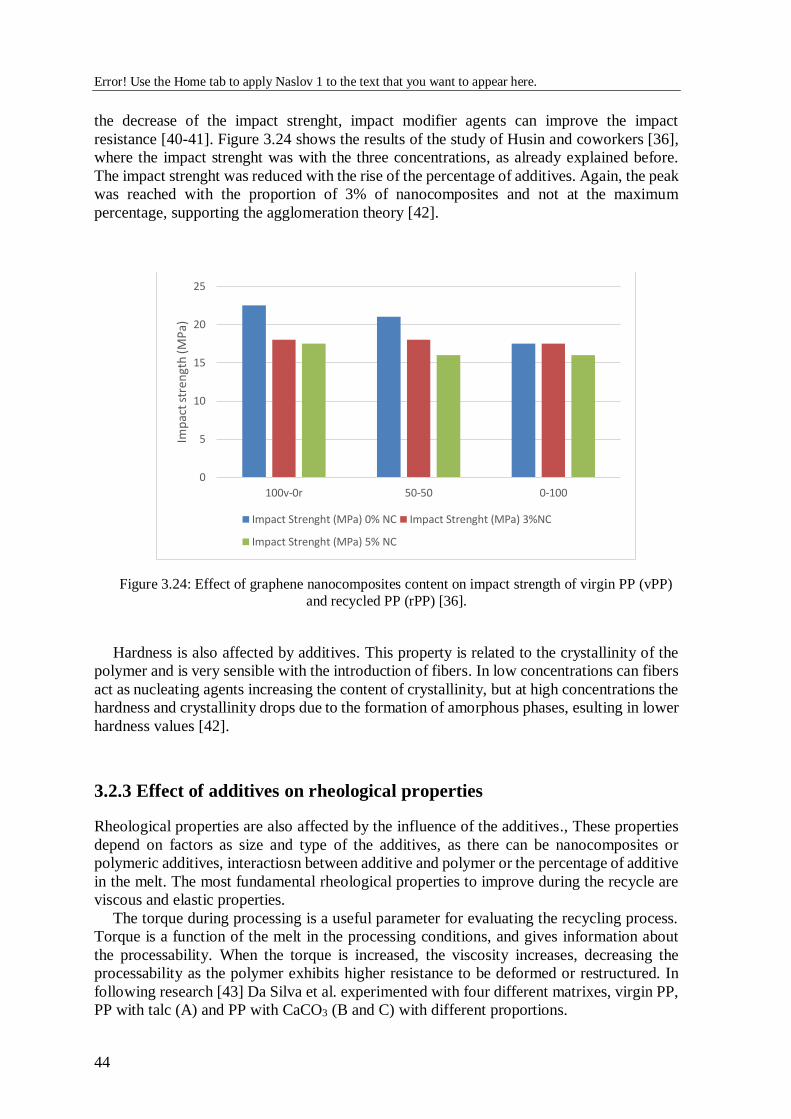
Error! Use the Home tab to apply Naslov 1 to the text that you want to appear here.
44
the decrease of the impact strenght, impact modifier agents can improve the impact
resistance [40-41]. Figure 3.24 shows the results of the study of Husin and coworkers [36],
where the impact strenght was with the three concentrations, as already explained before.
The impact strenght was reduced with the rise of the percentage of additives. Again, the peak
was reached with the proportion of 3% of nanocomposites and not at the maximum
percentage, supporting the agglomeration theory [42].
Figure 3.24: Effect of graphene nanocomposites content on impact strength of virgin PP (vPP)
and recycled PP (rPP) [36].
Hardness is also affected by additives. This property is related to the crystallinity of the
polymer and is very sensible with the introduction of fibers. In low concentrations can fibers
act as nucleating agents increasing the content of crystallinity, but at high concentrations the
hardness and crystallinity drops due to the formation of amorphous phases, esulting in lower
hardness values [42].
3.2.3 Effect of additives on rheological properties
Rheological properties are also affected by the influence of the additives., These properties
depend on factors as size and type of the additives, as there can be nanocomposites or
polymeric additives, interactiosn between additive and polymer or the percentage of additive
in the melt. The most fundamental rheological properties to improve during the recycle are
viscous and elastic properties.
The torque during processing is a useful parameter for evaluating the recycling process.
Torque is a function of the melt in the processing conditions, and gives information about
the processability. When the torque is increased, the viscosity increases, decreasing the
processability as the polymer exhibits higher resistance to be deformed or restructured. In
following research [43] Da Silva et al. experimented with four different matrixes, virgin PP,
PP with talc (A) and PP with CaCO3 (B and C) with different proportions.
0
5
10
15
20
25
100v-0r 50-50 0-100
Imp
act
stre
ngt
h (M
Pa)
Impact Strenght (MPa) 0% NC Impact Strenght (MPa) 3%NC
Impact Strenght (MPa) 5% NC
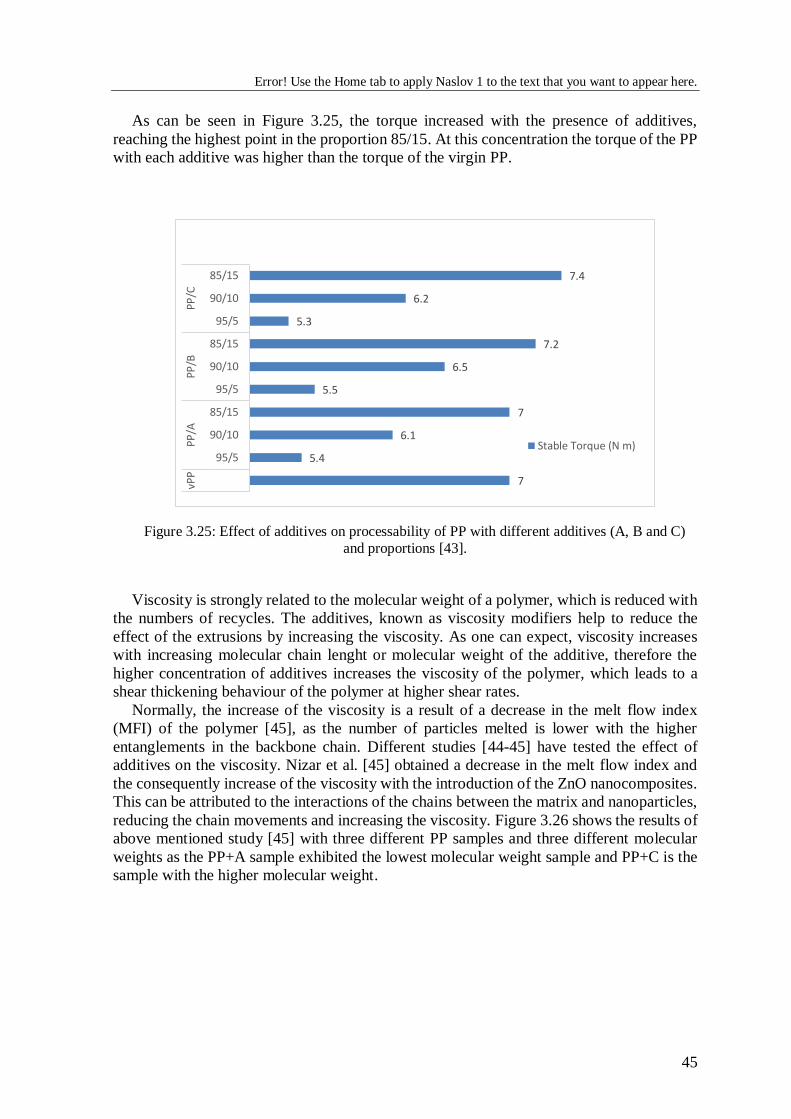
Error! Use the Home tab to apply Naslov 1 to the text that you want to appear here.
45
As can be seen in Figure 3.25, the torque increased with the presence of additives,
reaching the highest point in the proportion 85/15. At this concentration the torque of the PP
with each additive was higher than the torque of the virgin PP.
Figure 3.25: Effect of additives on processability of PP with different additives (A, B and C)
and proportions [43].
Viscosity is strongly related to the molecular weight of a polymer, which is reduced with
the numbers of recycles. The additives, known as viscosity modifiers help to reduce the
effect of the extrusions by increasing the viscosity. As one can expect, viscosity increases
with increasing molecular chain lenght or molecular weight of the additive, therefore the
higher concentration of additives increases the viscosity of the polymer, which leads to a
shear thickening behaviour of the polymer at higher shear rates.
Normally, the increase of the viscosity is a result of a decrease in the melt flow index
(MFI) of the polymer [45], as the number of particles melted is lower with the higher
entanglements in the backbone chain. Different studies [44-45] have tested the effect of
additives on the viscosity. Nizar et al. [45] obtained a decrease in the melt flow index and
the consequently increase of the viscosity with the introduction of the ZnO nanocomposites.
This can be attributed to the interactions of the chains between the matrix and nanoparticles,
reducing the chain movements and increasing the viscosity. Figure 3.26 shows the results of
above mentioned study [45] with three different PP samples and three different molecular
weights as the PP+A sample exhibited the lowest molecular weight sample and PP+C is the
sample with the higher molecular weight.
7
5.4
6.1
7
5.5
6.5
7.2
5.3
6.2
7.4
95/5
90/10
85/15
95/5
90/10
85/15
95/5
90/10
85/15
vPP
PP/A
PP/B
PP/C
Stable Torque (N m)
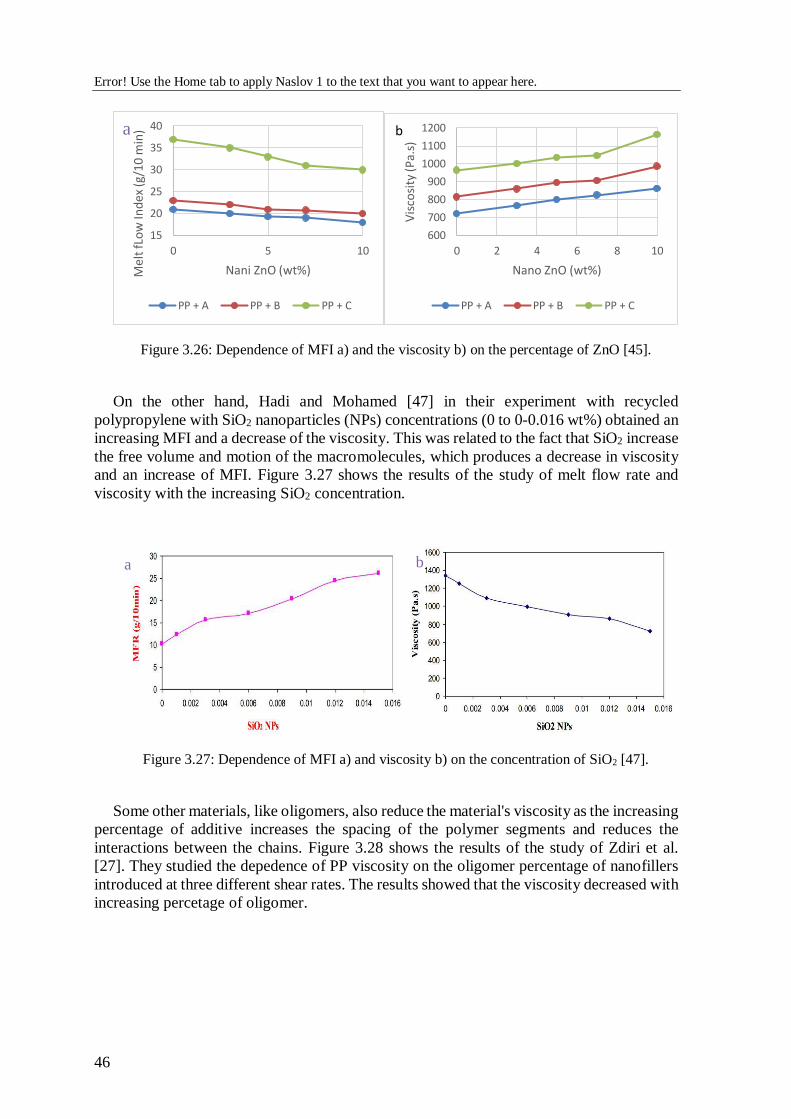
Error! Use the Home tab to apply Naslov 1 to the text that you want to appear here.
46
Figure 3.26: Dependence of MFI a) and the viscosity b) on the percentage of ZnO [45].
On the other hand, Hadi and Mohamed [47] in their experiment with recycled
polypropylene with SiO2 nanoparticles (NPs) concentrations (0 to 0-0.016 wt%) obtained an
increasing MFI and a decrease of the viscosity. This was related to the fact that SiO2 increase
the free volume and motion of the macromolecules, which produces a decrease in viscosity
and an increase of MFI. Figure 3.27 shows the results of the study of melt flow rate and
viscosity with the increasing SiO2 concentration.
Figure 3.27: Dependence of MFI a) and viscosity b) on the concentration of SiO2 [47].
Some other materials, like oligomers, also reduce the material's viscosity as the increasing
percentage of additive increases the spacing of the polymer segments and reduces the
interactions between the chains. Figure 3.28 shows the results of the study of Zdiri et al.
[27]. They studied the depedence of PP viscosity on the oligomer percentage of nanofillers
introduced at three different shear rates. The results showed that the viscosity decreased with
increasing percetage of oligomer.
15
20
25
30
35
40
0 5 10
Mel
t fL
ow
Ind
ex (g
/10
min
)
Nani ZnO (wt%)
PP + A PP + B PP + C
600
700
800
900
1000
1100
1200
0 2 4 6 8 10
Vis
cosi
ty (P
a.s)
Nano ZnO (wt%)
PP + A PP + B PP + C
ba
a b
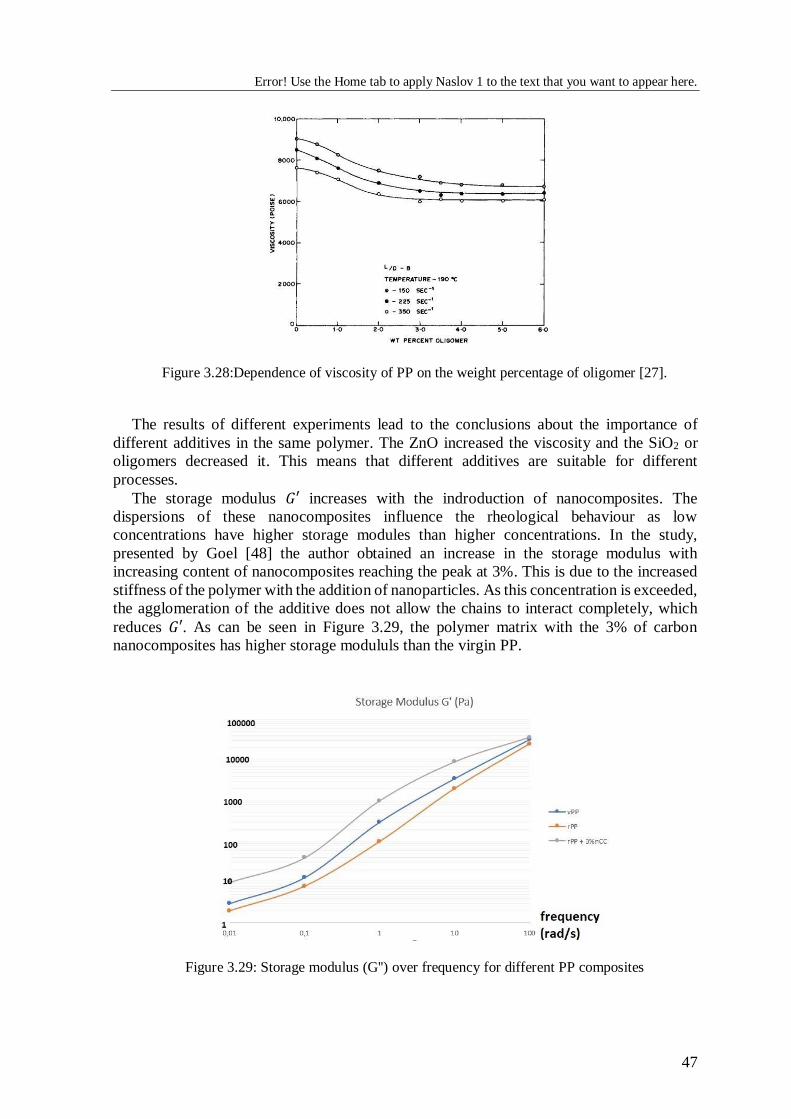
Error! Use the Home tab to apply Naslov 1 to the text that you want to appear here.
47
Figure 3.28:Dependence of viscosity of PP on the weight percentage of oligomer [27].
The results of different experiments lead to the conclusions about the importance of
different additives in the same polymer. The ZnO increased the viscosity and the SiO2 or
oligomers decreased it. This means that different additives are suitable for different
processes.
The storage modulus 𝐺′ increases with the indroduction of nanocomposites. The
dispersions of these nanocomposites influence the rheological behaviour as low
concentrations have higher storage modules than higher concentrations. In the study,
presented by Goel [48] the author obtained an increase in the storage modulus with
increasing content of nanocomposites reaching the peak at 3%. This is due to the increased
stiffness of the polymer with the addition of nanoparticles. As this concentration is exceeded,
the agglomeration of the additive does not allow the chains to interact completely, which
reduces 𝐺′. As can be seen in Figure 3.29, the polymer matrix with the 3% of carbon
nanocomposites has higher storage modululs than the virgin PP.
Figure 3.29: Storage modulus (G'') over frequency for different PP composites

Error! Use the Home tab to apply Naslov 1 to the text that you want to appear here.
48
The last parameter to study is the loss modulus 𝐺′′. This modulus is determined by viscous
flow. When the force on a particle reaches a certain value or a limit value, the particle will
move from its initial position to a more stable state. This movement from one place to
another produces the friction between particles with movement, which dissipates the energy.
The energy dissipation is bigger as the movement is increased. The particle cluster (small
grups of athoms) becomes larger with the increased concentration of additives. The larg
particle cluster result in bigger energy dissipation, which is directly related to the loss
modulus of a polymeric chain. This means that the increase of the concentration of additive
increases the loss modulus [49].
The experiment held by Xu et al. [50] with three different concentrations of silica and
PEG (Polyethylene glycol) fillers in polypropylene (1, 3 and 5%) and the recycled PP (0%)
without additives is presented in Figure 3.30. The results showed that the loss modulus
increased with increasing concentration of the additive, especially at high shear rates.
Moreover, it can be seen that at lower shear rates (< 20 s-1) the concentration of the additives
has no effect on the loss modulus.
Figure 3.30: Effect of silica and PEG additive on loss modulus of PP [50].
To conclude, the introduction of additives increases the storage and loss modulus.
Moreover, the viscosity is strongly related with the MFI. Some experiments noticed an
increase of the viscosity (ZnO), while other experiments showed an increase of MFI and
a decrease of viscosity (SiO2 and oligomers).
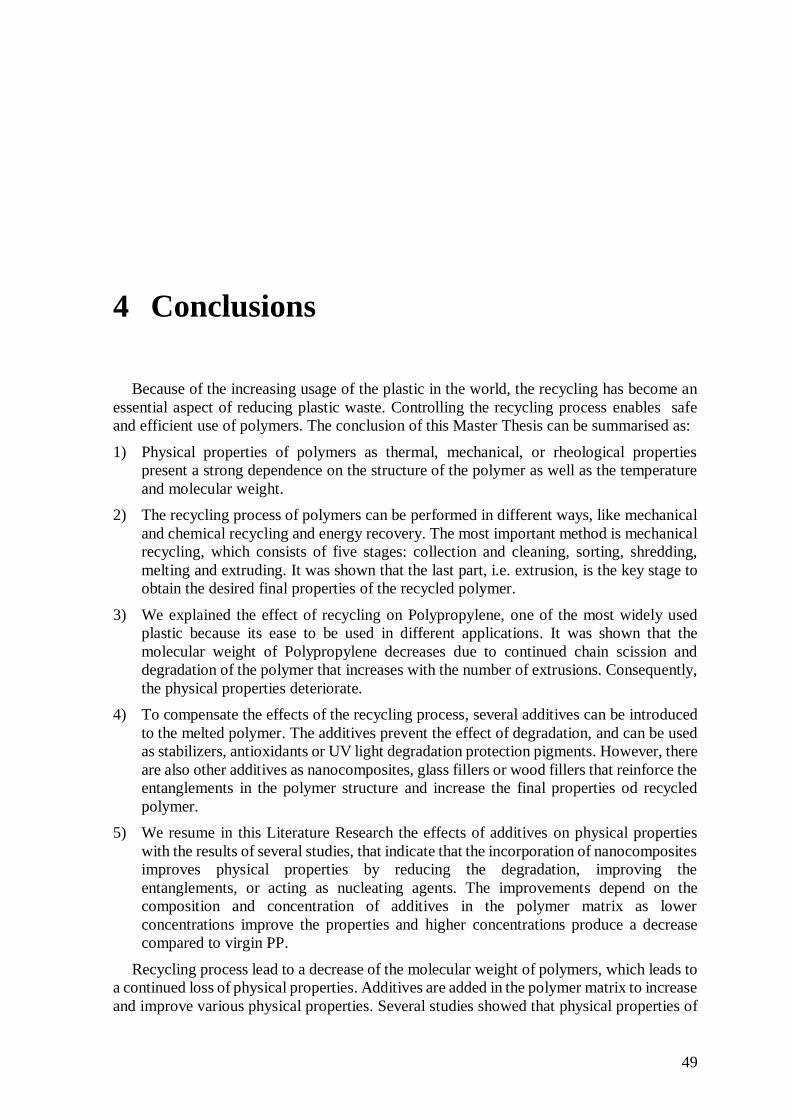
49
4 Conclusions
Because of the increasing usage of the plastic in the world, the recycling has become an
essential aspect of reducing plastic waste. Controlling the recycling process enables safe
and efficient use of polymers. The conclusion of this Master Thesis can be summarised as:
1) Physical properties of polymers as thermal, mechanical, or rheological properties
present a strong dependence on the structure of the polymer as well as the temperature
and molecular weight.
2) The recycling process of polymers can be performed in different ways, like mechanical
and chemical recycling and energy recovery. The most important method is mechanical
recycling, which consists of five stages: collection and cleaning, sorting, shredding,
melting and extruding. It was shown that the last part, i.e. extrusion, is the key stage to
obtain the desired final properties of the recycled polymer.
3) We explained the effect of recycling on Polypropylene, one of the most widely used
plastic because its ease to be used in different applications. It was shown that the
molecular weight of Polypropylene decreases due to continued chain scission and
degradation of the polymer that increases with the number of extrusions. Consequently,
the physical properties deteriorate.
4) To compensate the effects of the recycling process, several additives can be introduced
to the melted polymer. The additives prevent the effect of degradation, and can be used
as stabilizers, antioxidants or UV light degradation protection pigments. However, there
are also other additives as nanocomposites, glass fillers or wood fillers that reinforce the
entanglements in the polymer structure and increase the final properties od recycled
polymer.
5) We resume in this Literature Research the effects of additives on physical properties
with the results of several studies, that indicate that the incorporation of nanocomposites
improves physical properties by reducing the degradation, improving the
entanglements, or acting as nucleating agents. The improvements depend on the
composition and concentration of additives in the polymer matrix as lower
concentrations improve the properties and higher concentrations produce a decrease
compared to virgin PP.
Recycling process lead to a decrease of the molecular weight of polymers, which leads to
a continued loss of physical properties. Additives are added in the polymer matrix to increase
and improve various physical properties. Several studies showed that physical properties of
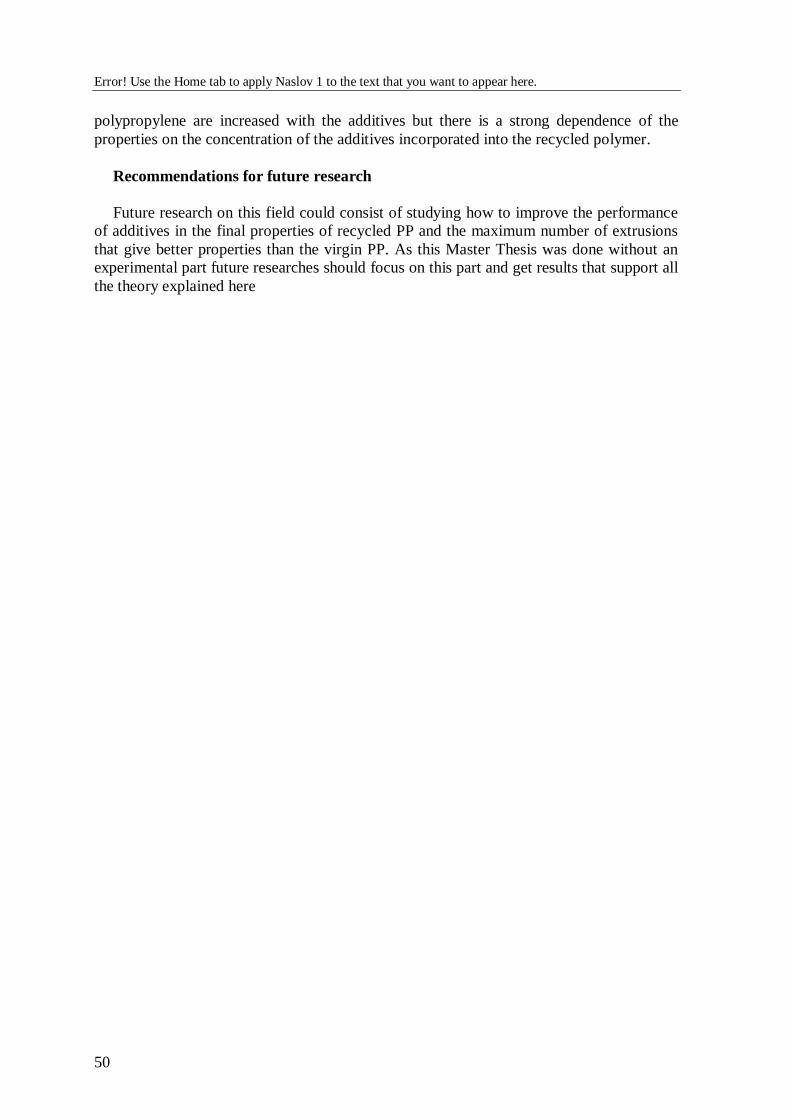
Error! Use the Home tab to apply Naslov 1 to the text that you want to appear here.
50
polypropylene are increased with the additives but there is a strong dependence of the
properties on the concentration of the additives incorporated into the recycled polymer.
Recommendations for future research
Future research on this field could consist of studying how to improve the performance
of additives in the final properties of recycled PP and the maximum number of extrusions
that give better properties than the virgin PP. As this Master Thesis was done without an
experimental part future researches should focus on this part and get results that support all
the theory explained here
51
5 Bibliography
[1] A. Oseli, A. Aulova, M. Gergesova, I. Emri, Encyclopedia of continuum mechanics:
Effect of temperature. Springer, Ljubljana, 2019
[2] Nicholas P. Cheremisinoff, Condenser Encyclopedia of Polymer Engineering Terms,
Butterworth Heinemann, Oxford, December 2012.
[3] M. Razavi-Nouri, Creep and Stress Relaxation Behavior of Polypropylene,
Metallocene-Prepared Polyethylene and their Blend; available at:
http://www.ijche.com/article_10247_6dc96c7d7c5769dc92a61def1a529ca7.pdf
[Accesed on 23 March 2020]
[4] Mariam AlMaadeed et al, Book-Polymer science and innovative applications 1st
edition. Elsevier, Qatar, 2020.
[5] Differential Scanning Calorimesty, In: Wikipedia. Available at:
https://en.wikipedia.org/wiki/Differential_scanning_calorimetry#/media/File:Therma
l_transitions_in_amorphous_and_semicrystalline_polymers.tif, [Accesed on 7 June
2020]
[6] Lalogeras, Ioannis M, Glass Transition Phenomena in Polymer Blends, Volume 3.
Wiley VCH Verlag Gmgb & Co, July 2016.
[7] Malvern Panalytical, Rheology 101 – Learning the Basics. 2019, September 03.
Available at: https://www.azom.com/article.aspx?ArticleID=16985. [Accesed on 12
June 2020]
[8] Polymer data base, Relaxation process In: Polymer data base online Available at:
https://polymerdatabase.com/polymer%20physics/Relaxation.html [Accesed on 13
March 2020]
[9] Jyoti Hundal & Pawan Singh Takhar Dynamic Viscoelastic Properties and Glass
Transition Behavior of Corn Kernels. Available at:
https://www.tandfonline.com/action/showCitFormats?doi=10.1080%2F1094291070
1687477 [Accesed on 12 June 2020]
[10] Aho J., Hvidt S., Baldursdottir S. Rheology in Pharmaceutical Sciences. Springer,
New York, 2016

Error! Use the Home tab to apply Naslov 1 to the text that you want to appear here.
52
[11] Tomas G Mezger: The Rheology Handbook: For Users of Rotational and Oscillatory
Rheometers, 4th edition, Vincentz, Germany 2002.
[12] Vlachopoulos, J., & Polychronopoulos, N. Basic Concepts in Polymer Melt Rheology
and Their Importance in Processing. Applied Polymer Rheology, Wiley, Greece 2011.
[13] Gaurav S. Kulkarni, Introduction to Polymer and Their Recycling Techniques, Martin
Luther University, Halle(Saale), Germany, 2018
[14] Plastic facts in Europe, Published on Sep 15, 2015 available at:
https://www.slideshare.net/Ouniyeh/plastics-facts-in-europe [Accesed on 13 June
2020]
[15] Plastic recycling, available at: https://biophysics.sbg.ac.at/waste/plastic.htm [Accesed
on 13 June 2020]
[16] Florence Dieval, Foued Khoffi, Riaz Mir, Walid Chaouch, Didier Le Nouen, Nabil
Chakfe and Bernard Durand, Long-Term Biostability of Pet Vascular Prostheses,
Hindawi publishing corporation, France 2012.
[17] Zeus Industrial Products, 2005. Appstate - Technical Whitepaper. [Online] Available
at:
http://www.appstate.edu/~clementsjs/polymerproperties/zeus_thermal_degradation.p
df [Accessed 14 June 2020]
[18] Torney N, Investigating the recyclability of Polypropylene, School of Engineering
Faculty of Computing and Engineering Ulster university 2017
[19] Vishnu Sankar, S., & Anil Kumar, S. Common Additives used in Recycling of
Polymers. Recycling of Polymers, p. 11–53. Wiley, Mahatma Ghandi university, 2016
[20] Luijsterburg, B. J. Mechanical Recycling of plastic packaging waste. Elvesier,
Eindhoven: Technische Universiteit Eindhoven 2015.
[21] Louis-Phplippe Blanchard, JH & Shadi Lal Malhotra Effect of Molecular Weight on
Glass Transition by Diflerential Scanning Calorimetry Chemestry department.
Science Faculty, University of Laval, Quevec 1974
[22] Mandelkern, L., Allou, A. L., & Gopalan, M. R.. Enthalpy of fusion of linear
polyethylene. The Journal of Physical Chemistry Department of Chemestry of Florida
University, Florida 1968
[23] Aumnate, Chuanchom; Spicker, Claudia; Kiesel, Raphael; Samadi, Majid Rudolph;
Natalie, Recycling of PP/LDPE Blend: Miscibility, Thermal Properties, Rheological
Behavior and Crystal Structure, University of Wisconsin 2016
[24] Oblak P, Gonzalez-Gutierrez J, Zupančič B, Aulova A, Emri I, Processability and
mechanical properties of extensively recycled high density polyethylene, Journal of
Polymer Degradation and Stability Volume 114, (2015) p. 133-145.
Error! Use the Home tab to apply Naslov 1 to the text that you want to appear here.
53
[25] Aurrekoetxea, J., Sarrionandia, M. A., Urrutibeascoa, I., & Maspoch, M. L. Journal
of Materials Science, Springer2001.
[26] Hammani, S., Moulai-Mostefa, N., Samyn, P., Bechelany, M., Dufresne, A., &
Barhoum, A. Morphology, Rheology and Crystallization in Relation to the Viscosity
Ratio of Polystyrene/Polypropylene Polymer Blends. Materials, Blida University,
Algeria, 2020
[27] Zdiri, K., Elamri, A., Hamdaoui, M., Harzallah, O., Khenoussi, N., & Brendlé, J.
Reinforcement of recycled PP polymers by nanoparticles incorporation, Taylos &
Francis, Green Chemistry Letters and Reviews 2018
[28] Li, Y., Jia, S., Du, S., Wang, Y., Lv, L., & Zhang, J. Improved properties of recycled
polypropylene by introducing the long chain branched structure through reactive
extrusion Elsevier, China 2018
[29] Zare, Y.; Garmabi, H. A developed model to assume the interphase properties in a
ternary polymer nanocomposite reinforced with two nanofillers. Compos. Part B:
Eng. Amirkabir University of Technology,Tehran, Iran 2016
[30] Elloumi, A.; Pimbert, S.; Bourmaud, A.; Bradai, C. Thermomechanical Properties
of Virgin and Recycled Polypropylene Impact
Copolymer/CaCO3 Nanocomposites. Polym. Eng. Sci. Bretagne Sud University,
France 2010,
[31] López, J.P.; Gironès, J.; Méndez, J.A.; El Mansouri, N.E.; Llop, M.; Mutjé, P.;
Vilaseca, F. Stone-groundwood pulp-reinforced polypropylene composites: Water
uptake and thermal properties. BioResources Lepamap, Girona 2012
[32] Ajorloo, M., Fasihi, M., Ohshima, M., & Taki, K. . How are the thermal properties
of polypropylene/graphene nanoplatelet composites affected by polymer chain
configuration and size of nanofiller? Materials & Design, Elsevier, Japan 2019
[33] Patnaik, K.S.K.R.K.; Devi, S.; Kumar, V. K.. Non-isothermal Crystallization
Kinetics of Polypropylene (PP) and Polypropylene (PP)/Talc
Nanocomposite. International Journal of Chemestry Engineering, Available at:
http://www.ijcea.org/papers/60-A550.pdf 2010 [Accesed on May 24th 2020]
[34] Simanke AG, de Azeredo AP, de Lemos C, Mauler RS Influence of nucleating agent
on the crystallization kinetics and morphology of polypropylene. University of POorto
Alegre, Brazil 2016
[35] Hadi, J.; Saad, N.A.; Mohamed, D.H. Thermal Behavior of Calcium Carbonate and
Zinc Oxide Nanoparticles Filled Polypropylene by Melt Compounding, Research Journal
of Applied Sciences. Eng. Technol. Maxwell Scientific Publication Corp, Babylon
University, Iraq 2016
Error! Use the Home tab to apply Naslov 1 to the text that you want to appear here.
54
[36] Husin, M. R.; Arsad, A.; Al-Othman, O. Effect of Graphene Loading on Mechanical
and Morphological Properties of Recycled Polypropylene/Polyaniline Nanocomposites,
MATEC Web of Conferences ,University Teknology Malaysia, Skudai, Malaysia 2015
[37] Yuan, Q.; Misra, R.D.K. Impact Fracture Behavior of Clay Reinforced Polypropylene
Nanocomposites. Polymer. Elsevier, Lafayette, Louisiana May 2006,
[38] Dong, Y.; Bhattacharyya, D. Effects of Clay Type, Clay/Compatibiliser Content and
Matrix Viscosity on the Mechanical Properties of Polypropylene/Organoclay
Nanocomposites. Elsevier, Auckland, New Zealand 2009
[39] Günter J, Möltgen B, Verfahren zur Wiederverwertung von Kunststoffabfällen oder
Kunststoffaltmaterial zur Herstellung von Kunststoffbauteilen und deren Verwendung,
German Patent, Germany 1993
[40] Yin Shi, Tuladhar R., Combe M., Collister T, Jacob M. Shanks A. R. Mechanical
properties of recycled plastic fibers for reinforcing concrete. Fibre concrete FC
Prague, Czech Republic 2013.
[41] Pfaendner, R. Additives to upgrade mechanically recycled plastic composites.
Management, Recycling and Reuse of Waste Ciba Lampertheim GmbH Germany
2010
[42] Zdiri, K., Elamri, A., & Hamdaoui, M. Advances in Thermal and Mechanical
Behaviors of PP/Clay Nanocomposites. Polymer-Plastics Technology and
Engineering (Online) Journal homepage: www.tandfonline.com/loi/lpte20, 2017
[43] Khanjanzadeh, H.; Tabarsa, T.; Shakeri, A.; Omidvar, A. Effect of Organoclay
Platelets on the Mechanical Properties of Wood Plastic Composites Formulated with
Virgin and Recycled Polypropylene. Wood Mater. Taylor & Francis, Gorgan, Iran
2011
[44] Da Silva, A. L. N., Rocha, M. C. G., Moraes, M. A. R., Valente, C. A. R., & Coutinho,
F. M. B. Mechanical and rheological properties of composites based on polyolefin
and mineral additives. Polymer Testing.Elsevier, Nova Friburgo, Brazil 2002
[45] Mantia, F. P. L., Morreale, M., & Ishak, Z. A. M. Processing and mechanical
properties of organic filler-polypropylene composites. Journal of Applied Polymer
Science, Wiley, Italy 2005
[46] Nizar, J. H.; Najim, A. S.; Dhey, J. M. Rheological Behavior of Waste Polypropylene
Reinforced with Zinc Oxide Nanoparticles. The Iraqi Journal For Mechanical And
Material Engineering. ,Special Volume, Babylon University Iraq 2016
[47] Hadi, N.J.; Mohamed, D.J. Study the Relation Between Flow, Thermal and
Mechanical Properties of Waste Polypropylene Filled Silica Nanoparticles Trans
Tech Publications India 2017
[48] Goel, D. C. . Effect of polymeric additives on the rheological properties of talc-filled
polypropylene. Polymer Engineering and Science, Wiley, India 1980
Error! Use the Home tab to apply Naslov 1 to the text that you want to appear here.
55
[49] Gabr, M. H., Okumura, W., Ueda, H., Kuriyama, W., Uzawa, K., & Kimpara, I. .
Mechanical and thermal properties of carbon fiber/polypropylene composite filled
with nano-clay. Composites Part B: Engineering, Elsevier, Japan 2015
[50] Xu, Y.L.; Gong, X.L.; Peng, C.; Sun, Y.Q.; Jiang, W.Q.; Zhang, Z. Shear thickening
fluids based on additives with different concentrations and molecular chain lengths.
Chinese Journal Chemical Physics, China 2016