Embed Size (px)
Citation preview
Effect of Quenching Variables on Distortion and Residual Stresses
D. Scott MacKenzie, PhD Houghton International, Valley Forge, PA USA
David Lambert, PhD Scientific Forming Technologies, Columbus, OH USA
Abstract Using DEFORM™ finite element analysis (FEA)
software, the effect of typical quenching processing variables on the hoop and radial residual stresses developed during quenching on a simple geometry (a cylinder). Process variables investigated included Racking, Quench Path, Slenderness, and Immersion Rate. Material properties evaluated include Martensite Start Temperature (MS). The results showed that the Martensite Start Temperature (MS) and racking were the predominate main effects in controlling residual hoop and radial stresses.
Introduction Regardless of the product, it is likely that it is heat-
treated and quenched. Engine components are heat treated for wear and durability. Aircraft components are heat treated for strength and fracture toughness. Even bicycle frames are heat-treated for strength, lightness and durability. To meet these needs, it is necessary to expand the knowledge of heat treating and quenching to consistently produce a quality product, capable of being manufactured in a cost-effective manner.
In metallurgy the definition of quenching is “the controlled extraction of heat”. The most important word in this definition is "controlled". The quenchant is any medium that extracts heat from the part. The quenchant can be a liquid, solid, or gas.
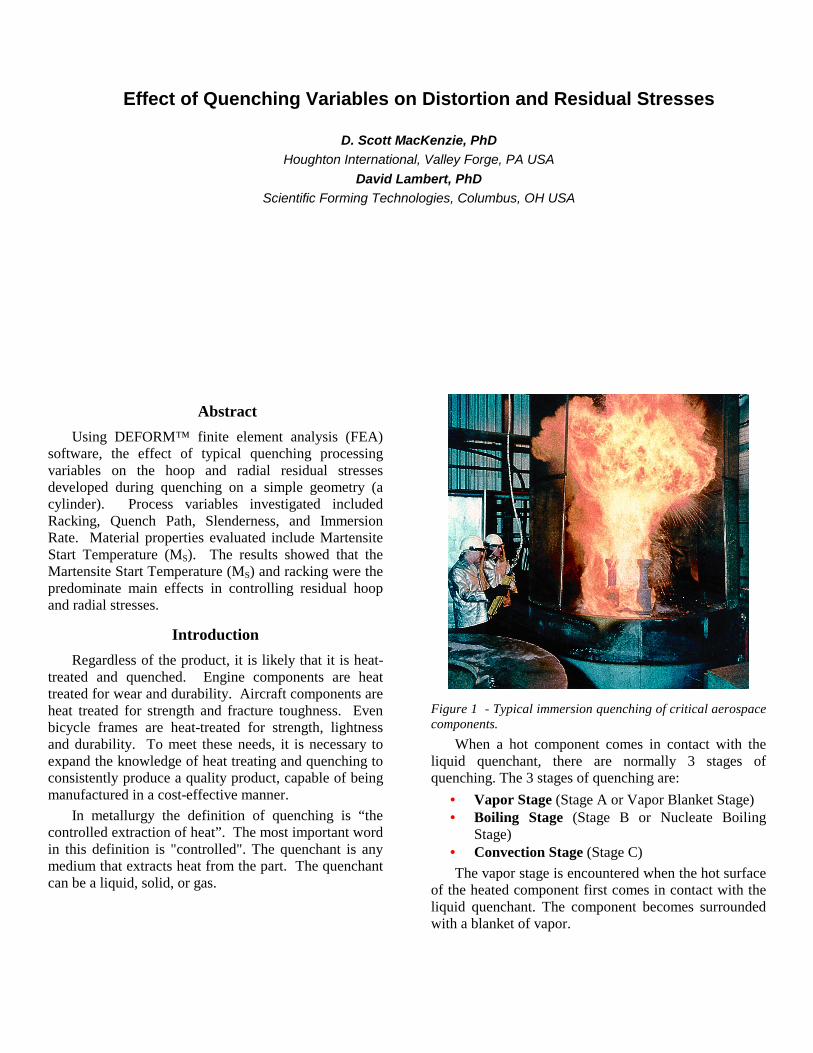
Figure 1 - Typical immersion quenching of critical aerospace components.
When a hot component comes in contact with the liquid quenchant, there are normally 3 stages of quenching. The 3 stages of quenching are:
• Vapor Stage (Stage A or Vapor Blanket Stage) • Boiling Stage (Stage B or Nucleate Boiling
Stage) • Convection Stage (Stage C) The vapor stage is encountered when the hot surface
of the heated component first comes in contact with the liquid quenchant. The component becomes surrounded with a blanket of vapor.
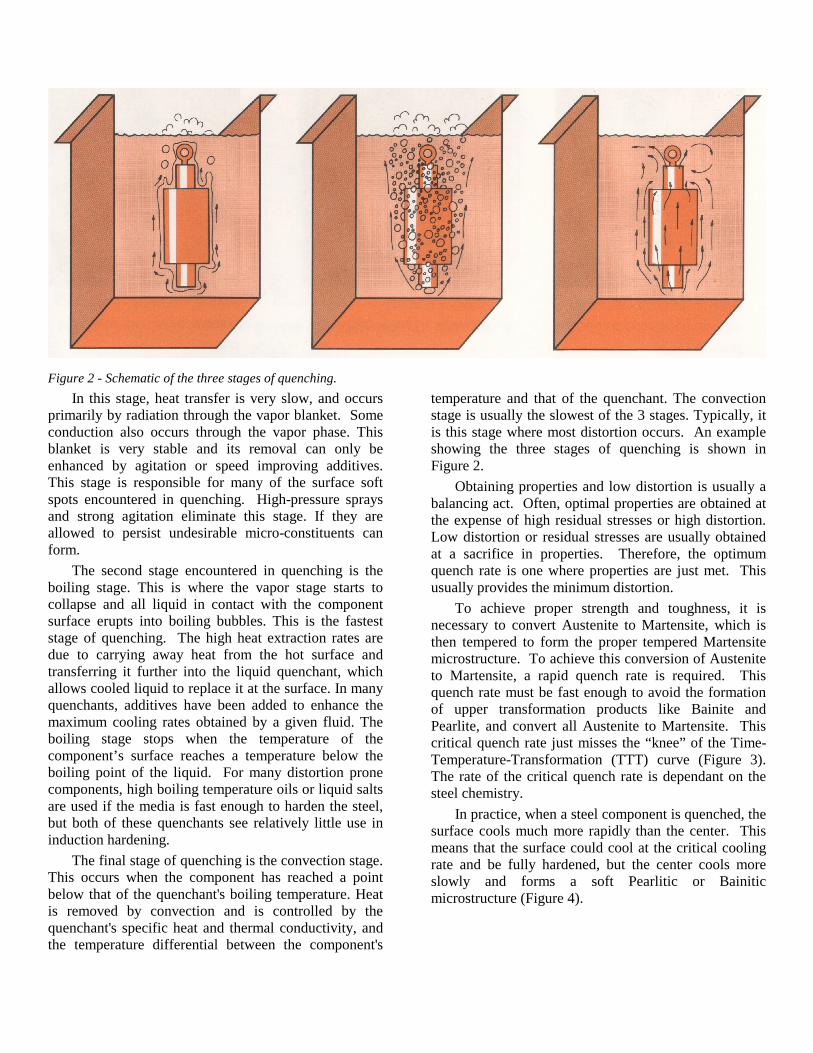
Figure 2 - Schematic of the three stages of quenching.
In this stage, heat transfer is very slow, and occurs primarily by radiation through the vapor blanket. Some conduction also occurs through the vapor phase. This blanket is very stable and its removal can only be enhanced by agitation or speed improving additives. This stage is responsible for many of the surface soft spots encountered in quenching. High-pressure sprays and strong agitation eliminate this stage. If they are allowed to persist undesirable micro-constituents can form.
The second stage encountered in quenching is the boiling stage. This is where the vapor stage starts to collapse and all liquid in contact with the component surface erupts into boiling bubbles. This is the fastest stage of quenching. The high heat extraction rates are due to carrying away heat from the hot surface and transferring it further into the liquid quenchant, which allows cooled liquid to replace it at the surface. In many quenchants, additives have been added to enhance the maximum cooling rates obtained by a given fluid. The boiling stage stops when the temperature of the component’s surface reaches a temperature below the boiling point of the liquid. For many distortion prone components, high boiling temperature oils or liquid salts are used if the media is fast enough to harden the steel, but both of these quenchants see relatively little use in induction hardening.
The final stage of quenching is the convection stage. This occurs when the component has reached a point below that of the quenchant's boiling temperature. Heat is removed by convection and is controlled by the quenchant's specific heat and thermal conductivity, and the temperature differential between the component's
temperature and that of the quenchant. The convection stage is usually the slowest of the 3 stages. Typically, it is this stage where most distortion occurs. An example showing the three stages of quenching is shown in Figure 2.
Obtaining properties and low distortion is usually a balancing act. Often, optimal properties are obtained at the expense of high residual stresses or high distortion. Low distortion or residual stresses are usually obtained at a sacrifice in properties. Therefore, the optimum quench rate is one where properties are just met. This usually provides the minimum distortion.
To achieve proper strength and toughness, it is necessary to convert Austenite to Martensite, which is then tempered to form the proper tempered Martensite microstructure. To achieve this conversion of Austenite to Martensite, a rapid quench rate is required. This quench rate must be fast enough to avoid the formation of upper transformation products like Bainite and Pearlite, and convert all Austenite to Martensite. This critical quench rate just misses the “knee” of the Time-Temperature-Transformation (TTT) curve (Figure 3). The rate of the critical quench rate is dependant on the steel chemistry.
In practice, when a steel component is quenched, the surface cools much more rapidly than the center. This means that the surface could cool at the critical cooling rate and be fully hardened, but the center cools more slowly and forms a soft Pearlitic or Bainitic microstructure (Figure 4).
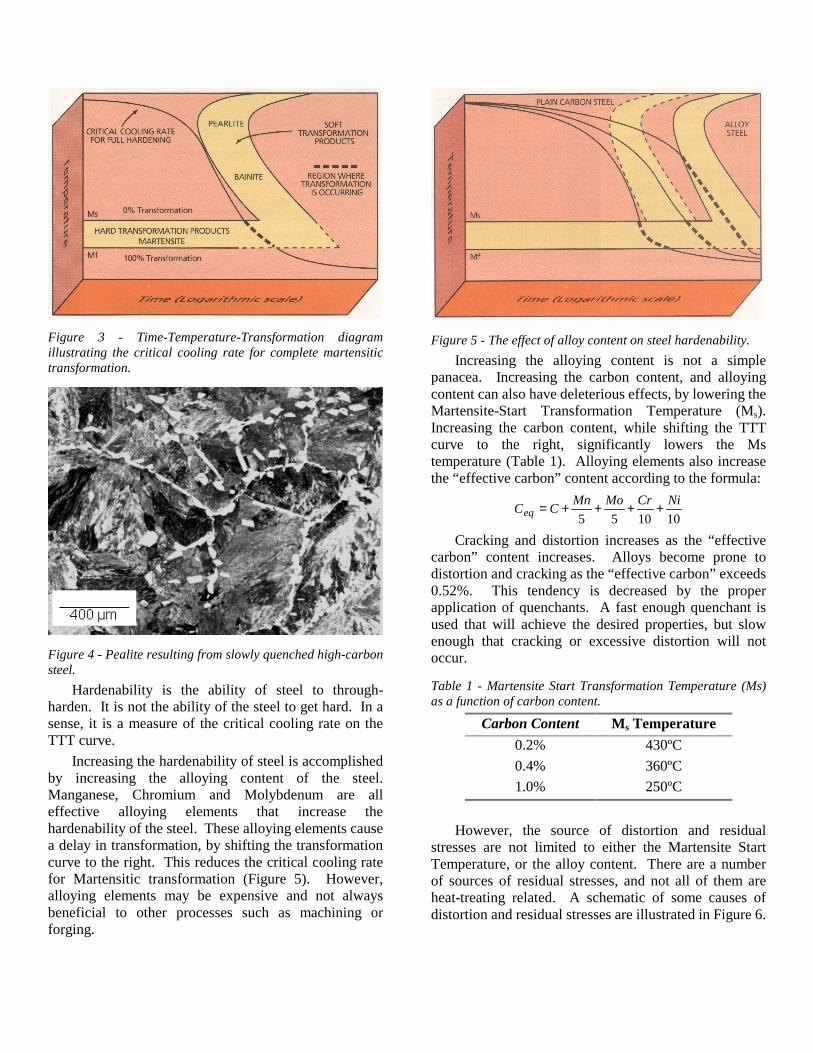
Figure 3 - Time-Temperature-Transformation diagram illustrating the critical cooling rate for complete martensitic transformation.
Figure 4 - Pealite resulting from slowly quenched high-carbon steel.
Hardenability is the ability of steel to through-harden. It is not the ability of the steel to get hard. In a sense, it is a measure of the critical cooling rate on the TTT curve.
Increasing the hardenability of steel is accomplished by increasing the alloying content of the steel. Manganese, Chromium and Molybdenum are all effective alloying elements that increase the hardenability of the steel. These alloying elements cause a delay in transformation, by shifting the transformation curve to the right. This reduces the critical cooling rate for Martensitic transformation (Figure 5). However, alloying elements may be expensive and not always beneficial to other processes such as machining or forging.
Figure 5 - The effect of alloy content on steel hardenability.
Increasing the alloying content is not a simple panacea. Increasing the carbon content, and alloying content can also have deleterious effects, by lowering the Martensite-Start Transformation Temperature (Ms). Increasing the carbon content, while shifting the TTT curve to the right, significantly lowers the Ms temperature (Table 1). Alloying elements also increase the “effective carbon” content according to the formula:
101055NiCrMoMnCCeq ++++=
Cracking and distortion increases as the “effective carbon” content increases. Alloys become prone to distortion and cracking as the “effective carbon” exceeds 0.52%. This tendency is decreased by the proper application of quenchants. A fast enough quenchant is used that will achieve the desired properties, but slow enough that cracking or excessive distortion will not occur.
Table 1 - Martensite Start Transformation Temperature (Ms) as a function of carbon content.
Carbon Content Ms Temperature 0.2% 430ºC 0.4% 360ºC 1.0% 250ºC
However, the source of distortion and residual
stresses are not limited to either the Martensite Start Temperature, or the alloy content. There are a number of sources of residual stresses, and not all of them are heat-treating related. A schematic of some causes of distortion and residual stresses are illustrated in Figure 6.
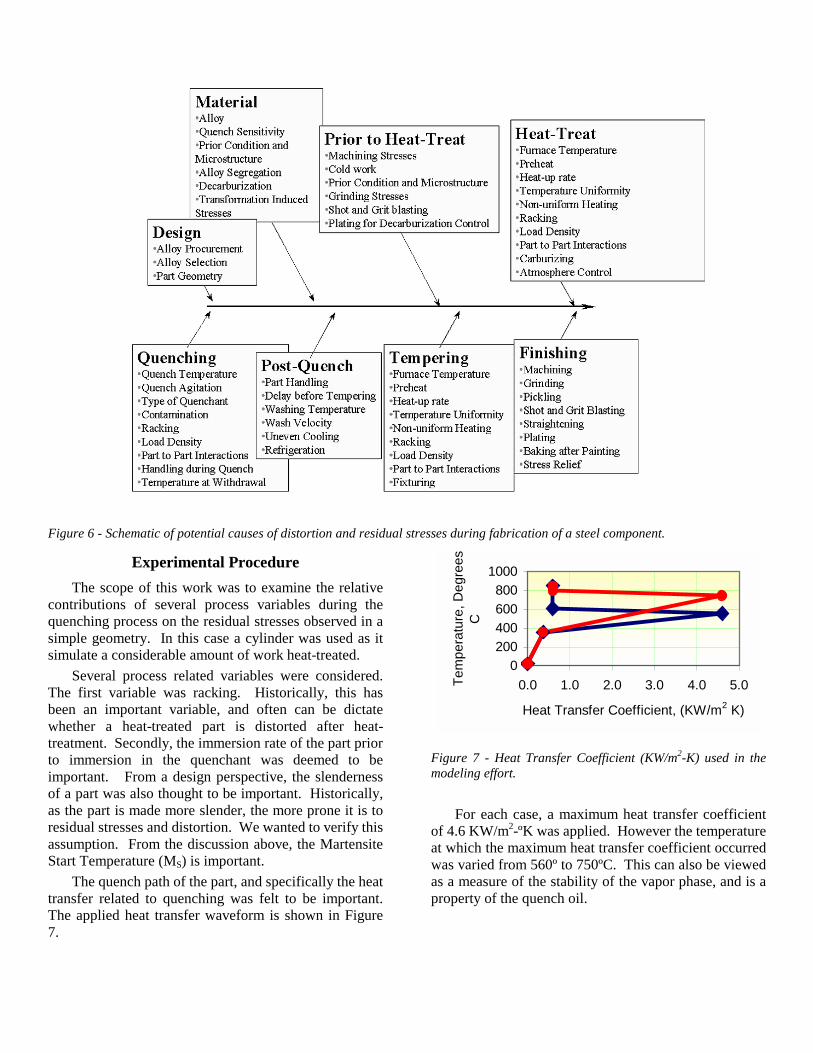
Figure 6 - Schematic of potential causes of distortion and residual stresses during fabrication of a steel component.
Experimental Procedure The scope of this work was to examine the relative
contributions of several process variables during the quenching process on the residual stresses observed in a simple geometry. In this case a cylinder was used as it simulate a considerable amount of work heat-treated.
Several process related variables were considered. The first variable was racking. Historically, this has been an important variable, and often can be dictate whether a heat-treated part is distorted after heat-treatment. Secondly, the immersion rate of the part prior to immersion in the quenchant was deemed to be important. From a design perspective, the slenderness of a part was also thought to be important. Historically, as the part is made more slender, the more prone it is to residual stresses and distortion. We wanted to verify this assumption. From the discussion above, the Martensite Start Temperature (MS) is important.
The quench path of the part, and specifically the heat transfer related to quenching was felt to be important. The applied heat transfer waveform is shown in Figure 7.
0200400600800
1000
0.0 1.0 2.0 3.0 4.0 5.0
Heat Transfer Coefficient, (KW/m2 K)
Tem
pera
ture
, Deg
rees
C
Figure 7 - Heat Transfer Coefficient (KW/m2-K) used in the modeling effort.
For each case, a maximum heat transfer coefficient
of 4.6 KW/m2-ºK was applied. However the temperature at which the maximum heat transfer coefficient occurred was varied from 560º to 750ºC. This can also be viewed as a measure of the stability of the vapor phase, and is a property of the quench oil.
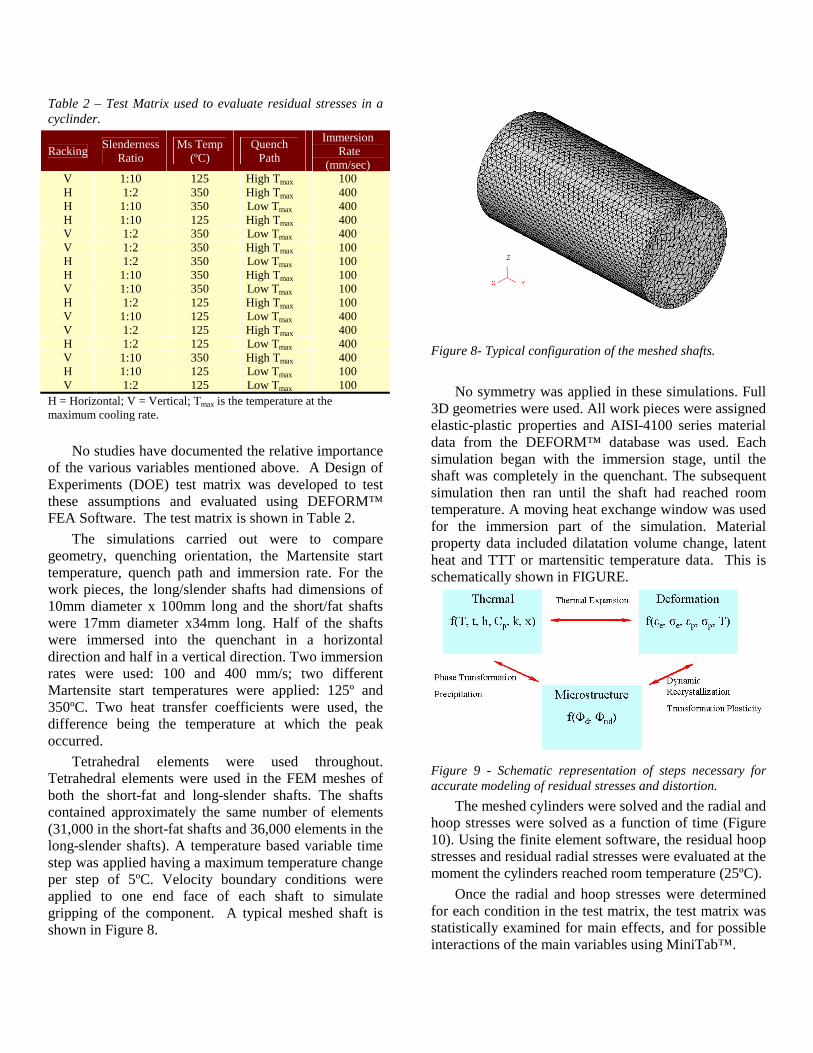
Table 2 – Test Matrix used to evaluate residual stresses in a cyclinder.
Racking Slenderness Ratio
Ms Temp (ºC)
Quench Path
Immersion Rate
(mm/sec) V 1:10 125 High Tmax 100 H 1:2 350 High Tmax 400 H 1:10 350 Low Tmax 400 H 1:10 125 High Tmax 400 V 1:2 350 Low Tmax 400 V 1:2 350 High Tmax 100 H 1:2 350 Low Tmax 100 H 1:10 350 High Tmax 100 V 1:10 350 Low Tmax 100 H 1:2 125 High Tmax 100 V 1:10 125 Low Tmax 400 V 1:2 125 High Tmax 400 H 1:2 125 Low Tmax 400 V 1:10 350 High Tmax 400 H 1:10 125 Low Tmax 100 V 1:2 125 Low Tmax 100
H = Horizontal; V = Vertical; Tmax is the temperature at the maximum cooling rate.
No studies have documented the relative importance
of the various variables mentioned above. A Design of Experiments (DOE) test matrix was developed to test these assumptions and evaluated using DEFORM™ FEA Software. The test matrix is shown in Table 2.
The simulations carried out were to compare geometry, quenching orientation, the Martensite start temperature, quench path and immersion rate. For the work pieces, the long/slender shafts had dimensions of 10mm diameter x 100mm long and the short/fat shafts were 17mm diameter x34mm long. Half of the shafts were immersed into the quenchant in a horizontal direction and half in a vertical direction. Two immersion rates were used: 100 and 400 mm/s; two different Martensite start temperatures were applied: 125º and 350ºC. Two heat transfer coefficients were used, the difference being the temperature at which the peak occurred.
Tetrahedral elements were used throughout. Tetrahedral elements were used in the FEM meshes of both the short-fat and long-slender shafts. The shafts contained approximately the same number of elements (31,000 in the short-fat shafts and 36,000 elements in the long-slender shafts). A temperature based variable time step was applied having a maximum temperature change per step of 5ºC. Velocity boundary conditions were applied to one end face of each shaft to simulate gripping of the component. A typical meshed shaft is shown in Figure 8.
Figure 8- Typical configuration of the meshed shafts.
No symmetry was applied in these simulations. Full
3D geometries were used. All work pieces were assigned elastic-plastic properties and AISI-4100 series material data from the DEFORM™ database was used. Each simulation began with the immersion stage, until the shaft was completely in the quenchant. The subsequent simulation then ran until the shaft had reached room temperature. A moving heat exchange window was used for the immersion part of the simulation. Material property data included dilatation volume change, latent heat and TTT or martensitic temperature data. This is schematically shown in FIGURE.
Figure 9 - Schematic representation of steps necessary for accurate modeling of residual stresses and distortion.
The meshed cylinders were solved and the radial and hoop stresses were solved as a function of time (Figure 10). Using the finite element software, the residual hoop stresses and residual radial stresses were evaluated at the moment the cylinders reached room temperature (25ºC).
Once the radial and hoop stresses were determined for each condition in the test matrix, the test matrix was statistically examined for main effects, and for possible interactions of the main variables using MiniTab™.
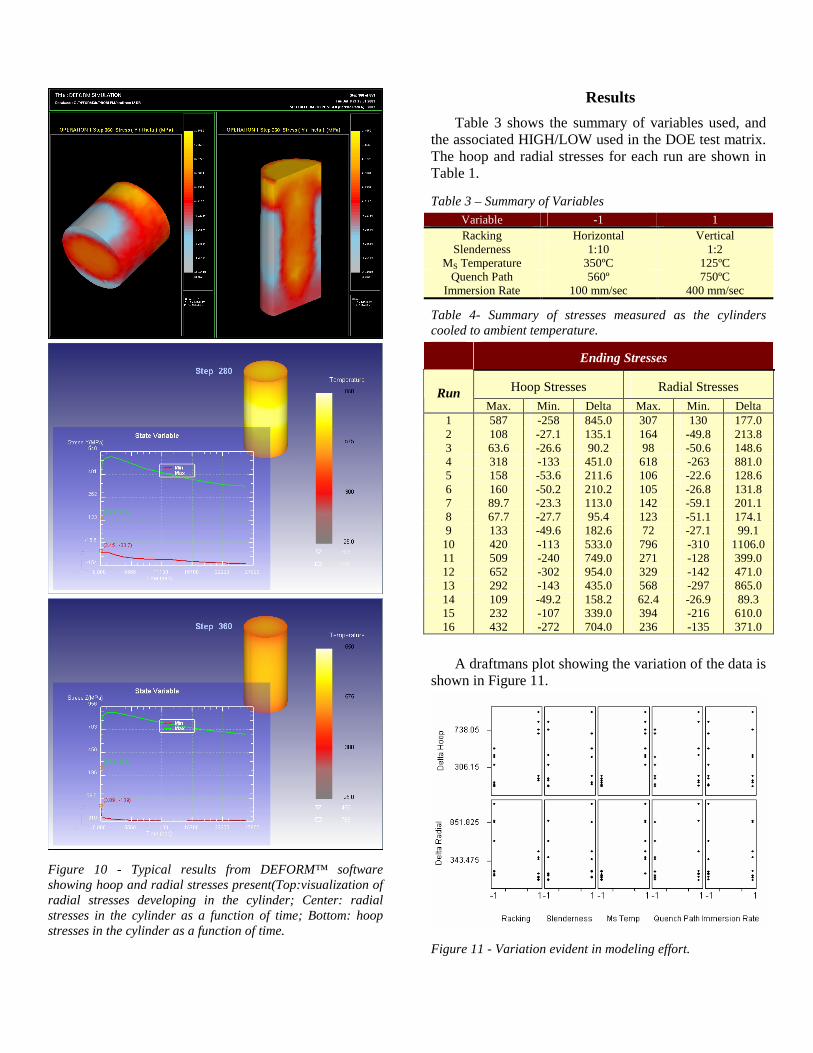
Figure 10 - Typical results from DEFORM™ software showing hoop and radial stresses present(Top:visualization of radial stresses developing in the cylinder; Center: radial stresses in the cylinder as a function of time; Bottom: hoop stresses in the cylinder as a function of time.
Results Table 3 shows the summary of variables used, and
the associated HIGH/LOW used in the DOE test matrix. The hoop and radial stresses for each run are shown in Table 1.
Table 3 – Summary of Variables Variable -1 1 Racking Horizontal Vertical
Slenderness 1:10 1:2 MS Temperature 350ºC 125ºC
Quench Path 560º 750ºC Immersion Rate 100 mm/sec 400 mm/sec
Table 4- Summary of stresses measured as the cylinders cooled to ambient temperature.
Ending Stresses
Hoop Stresses Radial Stresses Run Max. Min. Delta Max. Min. Delta
1 587 -258 845.0 307 130 177.0 2 108 -27.1 135.1 164 -49.8 213.8 3 63.6 -26.6 90.2 98 -50.6 148.6 4 318 -133 451.0 618 -263 881.0 5 158 -53.6 211.6 106 -22.6 128.6 6 160 -50.2 210.2 105 -26.8 131.8 7 89.7 -23.3 113.0 142 -59.1 201.1 8 67.7 -27.7 95.4 123 -51.1 174.1 9 133 -49.6 182.6 72 -27.1 99.1
10 420 -113 533.0 796 -310 1106.0 11 509 -240 749.0 271 -128 399.0 12 652 -302 954.0 329 -142 471.0 13 292 -143 435.0 568 -297 865.0 14 109 -49.2 158.2 62.4 -26.9 89.3 15 232 -107 339.0 394 -216 610.0 16 432 -272 704.0 236 -135 371.0
A draftmans plot showing the variation of the data is
shown in Figure 11.
Figure 11 - Variation evident in modeling effort.
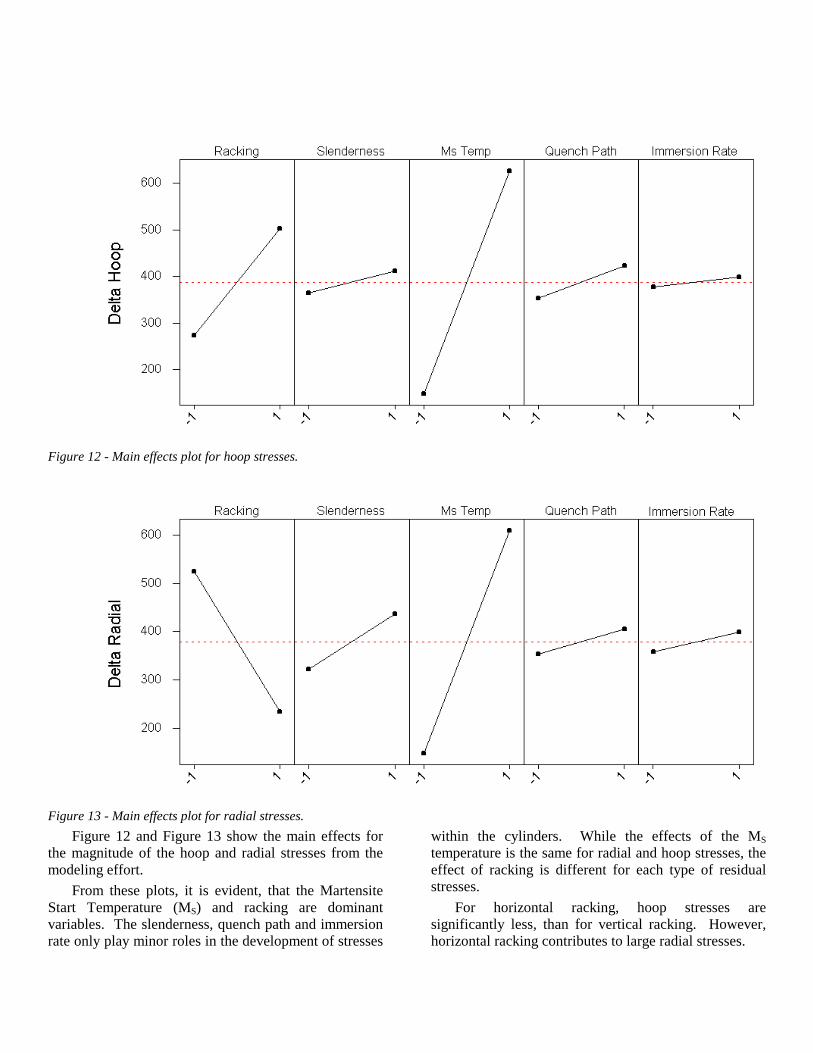
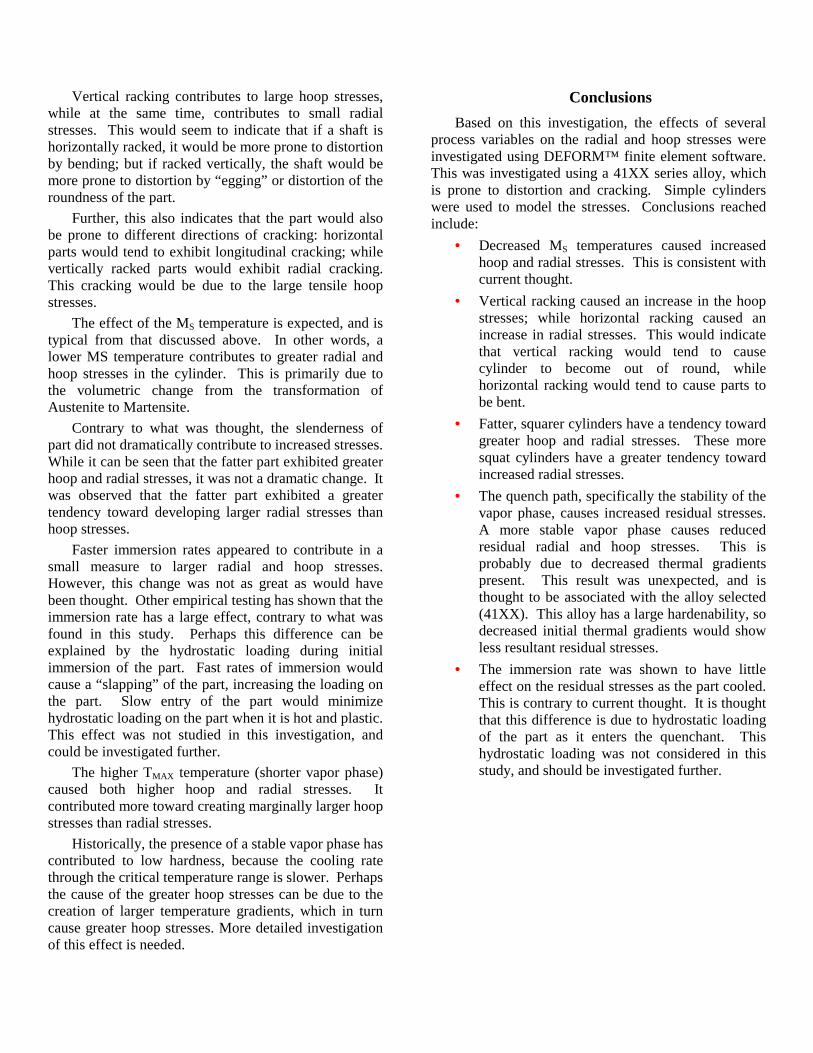
Figure 12 - Main effects plot for hoop stresses.
Figure 13 - Main effects plot for radial stresses.
Figure 12 and Figure 13 show the main effects for the magnitude of the hoop and radial stresses from the modeling effort.
From these plots, it is evident, that the Martensite Start Temperature (MS) and racking are dominant variables. The slenderness, quench path and immersion rate only play minor roles in the development of stresses
within the cylinders. While the effects of the MS temperature is the same for radial and hoop stresses, the effect of racking is different for each type of residual stresses.
For horizontal racking, hoop stresses are significantly less, than for vertical racking. However, horizontal racking contributes to large radial stresses.
Vertical racking contributes to large hoop stresses, while at the same time, contributes to small radial stresses. This would seem to indicate that if a shaft is horizontally racked, it would be more prone to distortion by bending; but if racked vertically, the shaft would be more prone to distortion by “egging” or distortion of the roundness of the part.
Further, this also indicates that the part would also be prone to different directions of cracking: horizontal parts would tend to exhibit longitudinal cracking; while vertically racked parts would exhibit radial cracking. This cracking would be due to the large tensile hoop stresses.
The effect of the MS temperature is expected, and is typical from that discussed above. In other words, a lower MS temperature contributes to greater radial and hoop stresses in the cylinder. This is primarily due to the volumetric change from the transformation of Austenite to Martensite.
Contrary to what was thought, the slenderness of part did not dramatically contribute to increased stresses. While it can be seen that the fatter part exhibited greater hoop and radial stresses, it was not a dramatic change. It was observed that the fatter part exhibited a greater tendency toward developing larger radial stresses than hoop stresses.
Faster immersion rates appeared to contribute in a small measure to larger radial and hoop stresses. However, this change was not as great as would have been thought. Other empirical testing has shown that the immersion rate has a large effect, contrary to what was found in this study. Perhaps this difference can be explained by the hydrostatic loading during initial immersion of the part. Fast rates of immersion would cause a “slapping” of the part, increasing the loading on the part. Slow entry of the part would minimize hydrostatic loading on the part when it is hot and plastic. This effect was not studied in this investigation, and could be investigated further.
The higher TMAX temperature (shorter vapor phase) caused both higher hoop and radial stresses. It contributed more toward creating marginally larger hoop stresses than radial stresses.
Historically, the presence of a stable vapor phase has contributed to low hardness, because the cooling rate through the critical temperature range is slower. Perhaps the cause of the greater hoop stresses can be due to the creation of larger temperature gradients, which in turn cause greater hoop stresses. More detailed investigation of this effect is needed.
Conclusions Based on this investigation, the effects of several
process variables on the radial and hoop stresses were investigated using DEFORM™ finite element software. This was investigated using a 41XX series alloy, which is prone to distortion and cracking. Simple cylinders were used to model the stresses. Conclusions reached include:
• Decreased MS temperatures caused increased hoop and radial stresses. This is consistent with current thought.
• Vertical racking caused an increase in the hoop stresses; while horizontal racking caused an increase in radial stresses. This would indicate that vertical racking would tend to cause cylinder to become out of round, while horizontal racking would tend to cause parts to be bent.
• Fatter, squarer cylinders have a tendency toward greater hoop and radial stresses. These more squat cylinders have a greater tendency toward increased radial stresses.
• The quench path, specifically the stability of the vapor phase, causes increased residual stresses. A more stable vapor phase causes reduced residual radial and hoop stresses. This is probably due to decreased thermal gradients present. This result was unexpected, and is thought to be associated with the alloy selected (41XX). This alloy has a large hardenability, so decreased initial thermal gradients would show less resultant residual stresses.
• The immersion rate was shown to have little effect on the residual stresses as the part cooled. This is contrary to current thought. It is thought that this difference is due to hydrostatic loading of the part as it enters the quenchant. This hydrostatic loading was not considered in this study, and should be investigated further.