Embed Size (px)
Citation preview

1
EFFECT OF PULSED ULTRAVIOLET LIGHT ON THE ANTIGENICITY OF WHOLE SHRIMP, HALF CUT SHRIMP, AND SHRIMP PROTEIN EXTRACT
By
SYED ALI SHAMIKH ABBAS
A THESIS PRESENTED TO THE GRADUATE SCHOOL OF THE UNIVERSITY OF FLORIDA IN PARTIAL FULFILLMENT
OF THE REQUIREMENTS FOR THE DEGREE OF MASTER OF SCIENCE
UNIVERSITY OF FLORIDA
2012
2
© 2012 Syed Ali Shamikh Abbas

3
To those that suffer from shrimp allergy
4
ACKNOWLEDGMENTS
Several people deserve recognition in helping me throughout graduate school and
offering suggestion and input along the way.
First, I would like to thank my major advisor, Dr. Weihua “Wade” Yang, for his
never-ending support. He introduced me to this field and provided valuable input from
the beginning. I would also like to thank my committee members, Dr. Melanie Correll
and Dr. Renee Goodrich-Schneider, for all of their helpful input and their time.
Second, I would like to acknowledge Xingyu “Charity” Zhao for her dedication and
commitment and many hours of sacrifice. I would also like to acknowledge my lab
mates for helping me from the beginning and always going over and beyond what one
would expect. I’d like to give my thanks to: Akshay Anugu, Tara Faidhalla, Senem
Guner, Ying “Kelsey” Guo, Bhaskar Janve, Yiqiao “Chelsey” Li, Braulio Marcias,
Jyotsna “Jyo” Nooji, Samet Ozturk, and Cheryl Rock.
Last, but not least, I would like to acknowledge my family consisting of Muzaffar
Abbas, my dad, and Tahseen Muzaffar, my mom, and my siblings Aleena Muzaffar,
Areesha Muzaffar, and Mohammad Ali Abbas, for all of their generous help and
guidance.
All of these individuals are fantastic individuals who made everything possible and
provided many memorable moments in graduate school.

5
TABLE OF CONTENTS page
ACKNOWLEDGMENTS .................................................................................................. 4
LIST OF TABLES ............................................................................................................ 7
LIST OF FIGURES .......................................................................................................... 8
LIST OF ABBREVIATIONS ........................................................................................... 11
CHAPTERS
1 INTRODUCTION .................................................................................................... 14
2 OBJECTIVES ......................................................................................................... 19
3 JUSTIFICATION ..................................................................................................... 20
4 LITERATURE REVIEW .......................................................................................... 21
Protein Biology and Chemistry ................................................................................ 22 Food Allergens ........................................................................................................ 23
Food Allergy ............................................................................................................ 24 Methods Used For Detecting Food Allergy ............................................................. 26
In Vivo Methods ................................................................................................ 26
Skin Prick Test (SPT) ................................................................................. 27
Oral Food Challenge (OFC) ....................................................................... 27 In Vitro Methods ............................................................................................... 28
RAST and EAST ........................................................................................ 28
ImmunoCAP ............................................................................................... 28 SDS-PAGE ................................................................................................ 28
Immunoblotting .......................................................................................... 29 ELISA ......................................................................................................... 30
Food Allergen Mitigation ......................................................................................... 31
Thermal Processing ......................................................................................... 31 Moist Heat .................................................................................................. 34 Dry Heat ..................................................................................................... 38
Non-Thermal Processing .................................................................................. 40
Pulsed Light ............................................................................................... 41 Gamma Irradiation ..................................................................................... 42 High Intensity Ultrasound ........................................................................... 44 High Pressure Processing.......................................................................... 45 Genetic Modification .................................................................................. 46

6
5 MATERIALS AND METHODS ................................................................................ 47
Human Plasma Samples ........................................................................................ 47 Preparation of Protein Extract ................................................................................. 47
Preparation of Whole Shrimp .................................................................................. 48 Preparation of Half-Cut Shrimp ............................................................................... 48 Pulsed Ultraviolet Light Treatment .......................................................................... 49 Temperature Measurement .................................................................................... 50 Post-Processing Preparation .................................................................................. 50
Protein Concentration Measurements..................................................................... 51 SDS-PAGE (sodium dodecyl sulfate polyacrylamide gel electrophoresis) .............. 51 Western Blot Analysis ............................................................................................. 52 Indirect ELISA ......................................................................................................... 54
Statistical Analysis .................................................................................................. 55
6 RESULTS AND DISCUSSION ............................................................................... 56
Protein Extracts ...................................................................................................... 56 SDS-PAGE Analysis of Protein Extracts .......................................................... 56
Western Blot for Protein Extracts ..................................................................... 57 Indirect ELISA for Protein Extracts ................................................................... 60
Whole Shrimp ......................................................................................................... 62
SDS-PAGE of Whole Shrimp ........................................................................... 62 Western Blot for Whole Shrimp ........................................................................ 64
Indirect ELISA for Whole Shrimp ...................................................................... 67 Sensory Remarks for Whole Shrimp ................................................................ 68
Half Cut Shrimp ...................................................................................................... 73 SDS-PAGE of Half Cut Shrimp ......................................................................... 73 Western Blot for Half Cut Shrimp ..................................................................... 75
Sensory Remarks for Half Cut Shrimp ............................................................. 76 Other Remarks ....................................................................................................... 80
Optimization of Pulsed Light Illumination .......................................................... 80 Temperature and Moisture Change .................................................................. 80 Antigenicity Variations Caused by Other Processing Methods on Shrimp ....... 82
7 CONCLUSIONS ..................................................................................................... 85
8 FUTURE WORK ..................................................................................................... 87
9 PRELIMINARY RESULTS ...................................................................................... 88
LIST OF REFERENCES ............................................................................................... 92
BIOGRAPHICAL SKETCH .......................................................................................... 102

7
LIST OF TABLES
Table page 6-1 Densimetric analysis of Western blot samples for protein extract from ImageJ
1.44 software (NIH). ........................................................................................... 60
6-2 Densimetric analysis of Western blot samples for whole shrimp from ImageJ 1.44 software (NIH). ........................................................................................... 67
6-3 Densimetric analysis of Western blot samples for half cut shrimp from ImageJ 1.44 software (NIH). ............................................................................... 76
6-4 Temperature measurements for whole shrimp samples. Each observation is a mean of three temperatures and the standard deviation. ................................ 81
6-5 Temperature measurements for half cut samples. Each observation is a mean of three temperatures and the standard deviation. ................................... 82
6-6 Representative moisture loss measurements for whole shrimp samples. Weight is measured in grams (g). ....................................................................... 82
6-7 Representative moisture loss measurements for half cut shrimp samples. Weight is measured in grams (g). ....................................................................... 82

8
LIST OF FIGURES
Figure page 5-1 Xenon PL processor (Model LHS40 LMP HSG). ................................................ 50
5-2 Summary of experimental design for protein extract, whole shrimp, and half cut shrimp. .......................................................................................................... 55
6-1 SDS-PAGE analysis of protein profile comparing 1) raw shrimp extract sample (R) and 2) pulsed light treated shrimp extract samples, with times of 2 min, 4 min, 5 min, 6 min, and 8 min. 15 uL was added to each well with concentrations of 1:50 for the R and 1:30 for the other samples. Molecular weight marker (M) is shown on the left. Tropomyosin is pointed as 37 kDa. ...... 57
6-2 Western blot analysis of protein extract samples including 1) raw sample (R) 2) boiled sample (B) 3) pulsed light treated sample with time points of 2 min, 4 min, 5 min, 6 min, and 8 min............................................................................ 59
6-3 Indirect ELISA illustrated the changes in IgE binding compared to untreated, boiled, PL-treated shrimp protein extracts using pooled human plasma containing IgE antibodies against shrimp. The times correspond to the treatment time and a control was used. A = absorbance of the sample; A0 = absorbance of untreated sample. Data are expressed as mean ± SEM (n = 5). Results are relative values, normalized to the untreated sample; untreated is standardized and set to 1. Values that are significantly different are analyze by statistical level α = 0.05. ................................................................... 61
6-4 SDS-PAGE analysis of protein profile of whole shrimp samples comparing 1) raw sample (R) 2) boiled sample, and 3) pulsed light treated whole shrimp samples, with times of 6 min, 8 min, 10 min, 12 min, and 15 min. These times correspond to pulsed light treatment on one side of whole shrimp, with their being an application of treatment of both sides. 15 uL was added to each well with concentrations of 1:50 for the R and 1:10 for the other samples. Molecular weight marker (M) is shown on the left. Tropomyosin is pointed as 37 kDa. ............................................................................................................... 64
6-5 Western blot analysis of whole shrimp samples including 1) raw sample (R) 2) boiled sample (B), 3) pulsed light treated sample with time points of 6 min, 8 min, 10 min, 12 min, and 15 min. These times correspond to pulsed light treatment on one side of whole shrimp, with their being an application of treatment of both sides. ...................................................................................... 66
6-6 Indirect ELISA illustrated the changes in IgE binding compared to untreated, boiled, PL-treated whole shrimp extracts using pooled human plasma containing IgE antibodies against shrimp. The times correspond to the treatment time and a control was used. A = absorbance of the sample; A0 = absorbance of untreated sample. Data are expressed as mean ± SEM (n =

9
5). Results are relative values, normalized to the untreated sample; untreated is standardized and set to 1. Values that are significantly different are analyze by statistical level α = 0.05. ................................................................... 68
6-7 Raw shrimp sample was taken as a control. This raw sample was applied in following experiments in SDS-PAGE, Western blot, and indirect ELISA. ........... 71
6-8 Boiled shrimp sample was considered as another control. This sample was prepared with a raw sample that was boiled in distilled water for 10 min. .......... 71
6-9 Whole shrimp sample was treated by pulsed light for 6 min on both sides for a total treatment of 12 min. ................................................................................. 71
6-10 Whole shrimp sample was treated by pulsed light for 8 min on both sides for a total treatment of 16 min. ................................................................................. 72
6-11 Whole shrimp sample was treated by pulsed light for 10 min on both sides for a total treatment of 20 min. ................................................................................. 72
6-12 Whole shrimp sample was treated by pulsed light for 12 min on both sides for a total treatment of 24 min. ................................................................................. 72
6-13 Whole shrimp sample was treated by pulsed light for 15 min on both sides for a total treatment of 30 min. ................................................................................. 73
6-14 SDS-PAGE analysis of protein profile of half cut shrimp comparing 1) raw shrimp (R), 2) Boiled shrimp (B), and 3) pulsed light treated shrimp samples, with times of 6 min, 8 min, 10 min, 12 min, and 15 min. These times correspond to pulsed light treatment on one side of whole shrimp, with their being an application of treatment of both sides. 15 uL was added to each well with concentrations of 1:50 for the R and 1:10 for the other samples. Molecular weight marker (Std) is shown on the left. Tropomyosin is pointed as 37 kDa. .......................................................................................................... 74
6-15 Western blot analysis of half cut shrimp samples including 1) raw sample (R), 2) boiled sample (B), and 3) pulsed light treated sample with time points of 6 min, 8 min, 10 min, 12 min, and 15 min. These times correspond to pulsed light treatment on one side of whole shrimp, with their being an application of treatment of both sides. ...................................................................................... 75
6-16 Raw shrimp sample for the half cut shrimp sample. This sample was used in SDS-PAGE and Western blot. ............................................................................ 78
6-17 Half cut shrimp was treated by pulsed light for 6 min on both sides for a total treatment of 12 min. ............................................................................................ 78
6-18 Half cut shrimp was treated by pulsed light for 8 min on both sides for a total treatment of 16 min. ............................................................................................ 78

10
6-19 Half cut shrimp sample was treated by pulsed light for 10 min on both sides for a total treatment of 20 min. ............................................................................ 79
6-20 Half cut shrimp sample was treated by pulsed light for 12 min on both sides for a total treatment of 24 min. ............................................................................ 79
6-21 Half cut shrimp sample was treated by pulsed light for 15 min on both sides for a total treatment of 30 min. ............................................................................ 79
9-1 SDS-PAGE of analysis of protein profile of ground shrimp samples comparing 1) raw sample (R), and 2) pulsed light treated ground shrimp samples, with times of 8 min, 10 min, 12 min, and 15 min. 15 uL was added to each well with concentrations of 1:50 for the R and 1:10 for the other samples. Molecular weight marker (M) is shown on the left. Tropomyosin is pointed as 37 kDa. .............................................................................................. 89
9-2 SDS-PAGE analysis of protein profile analysis of ground shrimp samples comparing 1) raw sample (R) and 2) pulsed light treated ground shrimp samples, with times of 8 min and 15 min. 15 uL was added to each well with concentrations of 1:50 for the R and 1:10 for the other samples. Molecular weight marker (M) is shown on the left. Tropomyosin is pointed as 37 kDa. ...... 90

11
LIST OF ABBREVIATIONS
BSA Bovine serum albumin
EIA Enzyme immunoassay
ELISA Enzyme-linked immunosorbent assay
IgE Immunoglobulin E
IgG Immunoglobulin G
OPD O-phenylenediamine dihydrochloride
PL Pulsed ultraviolet light
PVDF Polyvinylidene fluoride
SDS-PAGE Sodium dodecyl sulfate polyacrylamide electrophoresis

12
Abstract of Thesis Presented to the Graduate School of the University of Florida in Partial Fulfillment of the Requirements for the Degree of Master of Science
EFFECT OF PULSED ULTRAVIOLET LIGHT ON THE ANTIGENICITY OF WHOLE
SHRIMP, HALF CUT SHRIMP, AND SHRIMP PROTEIN EXTRACT
By
Syed Ali Shamikh Abbas
August 2012
Chair: Weihua “Wade” Yang Major: Food Science and Human Nutrition
Tropomyosin is responsible for triggering immune responses in individuals allergic
to shrimp. Although allergens can manifest themselves at an early age and continue to
adulthood, with sensitivity decreasing as one ages, there is no current cure for
individuals affected with shrimp allergy except total avoidance of the food. Current
developments in non-thermal processing, such as pulsed ultraviolet light (PL), show
promise as they have been found to reduce the tropomyosin antigenicity following
treatment. However, more research needs to be conducted to evaluate the potential PL
effect on shrimp. The main objective of this study is to examine the effect of PL on
tropomyosin antigenicity on shrimp native protein extract, whole shrimp and half-cut
shrimp. The samples were treated at a distance of 10 centimeters (cm) from the quartz
window of the Xenon PL processor (Model LHS40 LMP HSG). 10 milliliters (mL) of
protein extract was treated for 2, 4, 5, 6, and 8 minutes (min) and both whole shrimp
and half-cut shrimp were treated for 6, 8, 10, 12, and 15 min on both sides. SDS-PAGE
(sodium dodecyl sulfate polyacrylamide electrophoresis) was performed to illustrate the
electrophoretic profile of tropomyosin, which showed reduction in band intensity of
tropomyosin in the protein extract. However, there was no noticeable effect on

13
tropomyosin in whole shrimp and half-cut shrimp under the PL conditions treated in this
study. The antigenicity response is the same in Western blot and indirect ELISA
(enzyme-linked immunosorbent assay). The results demonstrate both the applicability
and limitation of PL in treating allergenic shrimp samples. Future work would be needed
to evaluate the commercial potentiality of this technology in developing hypoallergenic
shrimp products.

14
CHAPTER 1 INTRODUCTION
Allergies to food are a problem that affects millions of people worldwide when
certain foods containing allergens produce an adverse immune response once
consumed. Although the allergenic proteins are non-toxic, individuals that are allergic
produce high levels of antibodies, or immunoglobulins, that recognize the sites called
epitopes on these proteins and elicit an immunological reaction. Starting at birth, this
type of hypersensitivity can progress until adulthood, although sensitization can
decrease as the age increases (Ayuso and others 2010). The symptoms due to allergen
exposure can be minor and may include itching or coughing and possibly fatality, if
serious reactions like anaphylactic shock occur. For this reason, persons with food
allergies only have one method for dealing with this problem, and that is complete
avoidance of the allergenic food.
The fundamental mechanism behind the allergenic responses is that the body
contains immunoglobulins that function to bind and remove foreign matter.
Immunoglobulins are “Y-shaped” proteins that induce an immune response when a
specific protein sequence is present in the body. These protein sequences constitute
part of the protein in food and trigger antibodies in the body to recognize these
sequences as foreign and mediate an immune response, even though no harmful agent
enters the body. Several types of antibodies exist. These include Immunoglobulin E
(IgE), IgG, IgM, and IgA, of which all are present in both allergic and non-allergic
individuals (Daul and others 1990). However, the levels of IgE are much higher in
individuals exhibiting allergenic reactions, suggesting that IgE plays an important role
with respect to food hypersensitivity (Daul and others 1987).

15
Biological techniques as well as novel technologies are being developed which
include genetic modification of plant foods and the use of emerging technologies such
as irradiation and pulsed light (PL) that may be potentially used to eliminate or reduce
the target allergen in the food. One particular technology, and the focus of this research,
PL, refers to the light spectra ranging from 170 to 2600 nanometers (nm) (Fellows
2009). It comprises approximately 54% UV light, 26% visible light, and 20% infrared
when emitted (Oms-Oliu and others 2010). Within the UV light fraction of the PL, there
are further subdivisions of several spectra including UV-A, UV-B, and UV-C (200-280
nm). UV-C is the largest spectrum and constitutes a peak power of 254 nm. Several
studies have shown that PL can be used for different treatments, such as the
decontamination of foods (Gómez-López and others 2007) and also inactivation of
allergens in shrimp extract (Shriver and others 2011), egg proteins (Anugu and others
2010), and wheat gluten (Nooji and others 2010).
There are three main mechanisms proposed for PL interactions with foods: photo-
thermal, photo-chemical, and photo-physical effects (Gómez-López et al. 2007; Shriver
and Yang 2011; Shriver et al. 2011). In the photo-thermal effect, heat is generated from
both the infrared and the visible parts of the PL spectrum, which causes the top layer of
the food to heat if enough energy is emitted (Fellows 2009). However, this phenomenon
is not as effective as the photo-chemical or photo-physical effect when the treatment
time is relatively short (i.e. seconds) since it has been shown that inactivation of
microorganisms can occur without an increase in the temperature of the food. In the
photo-physical effect, microbial inactivation results from the rupture of the cell and
release of the cellular contents. Lastly, the photo-chemical effect has been reported to

16
initiate several modifications such as changing the structure of the allergenic proteins,
or creating pyrimidine dimers in DNA, which inhibits DNA replication, resulting in the
inactivation of microorganisms (Sizer and Balasubramaniam 1999)
In conventional equipment of generating continuous UV light, the light is
generated with a low-pressure mercury vapor lamp (Fellows 2009), whereas for PL,
electricity is stored in capacitors and then released in a shorter duration at thousandths
of a second into a lamp containing Xenon or Krypton inert gas (Gómez-López et al.
2007; Shriver et al. 2011). This allows the power of the light to intensify and so when the
light is emitted from the lamp, it is one of high energy and intensity. As an allergen
contains epitope sites for immunoglobulin binding, the PL can alter those sites through
mechanisms such as protein denaturation, modification of the protein structure, and
protein hydrolysis to change the IgE binding sites.
Currently, the Food and Drug Administration lists eight major allergenic foods,
which are soy, tree nut, peanut, milk, eggs, wheat, fish, and shellfish. Of these, shellfish
are the most common and also account for the most emergency visits (Clark and others
2004). Shellfish include arthropods like lobsters, shrimp, and crab, all of which have a
chitinous exoskeleton and dwell in aquatic environments (Nagpal and others 1989). In
shrimp, the major compound responsible for causing immunoreactivity in shrimp
sensitive individuals is a protein called tropomyosin (Shanti and others 1993). It can
also referred to as Pen a 1, Pen m 1, and Lit v 1 depending on the shrimp species
(Ayuso and others 2008). Other proteins are arginine kinase, myosin light chain, and
sarcoplasmic calcium-binding protein, which have been associated as shrimp allergens
(Ayuso et al. 2010). However, tropomyosin is regarded as the major protein responsible

17
for the majority of allergenic reactions (Ayuso et al. 2008). The weight of the protein is
34 to 38 kiloDaltons (kDa). It is also present in other species too. Therefore, cross-
reactivity can occur. For example, there is cross-reactivity between the shrimp
tropomyosin and the mite tropomyosin as the amino acid sequence between the two
proteins shares an 81% homologous sequence (Boquete and others 2011). This is a
problem as individuals that suffer from shrimp allergens also can exhibit symptoms due
to mites. Other species that contain tropomyosin are cockroaches and parasites (Yang
and others 2010a).
As a result, several studies have focused on changing the protein composition
through recombinant technology or altering the protein's structure using other food
processing methods, such as PL. Based on a previous study (Shriver et al. 2011), PL
light is shown to be effective in reducing the binding of the IgE antibody in shrimp
extracts. However, there is no reported research of PL light on whole shrimp. Due to the
proposed photo-thermal, photo-chemical, and photo-physical effects of PL, if the whole
shrimp, rather than shrimp extracts, could be cooked with the allergen minimized during
the PL treatment, it would have a significant impact on public health as well as the
technological development for PL. The PL technology for simultaneous cooking and
allergen reduction is desirable in the food industry, as shrimp is consumed mostly as
whole. Furthermore, further evaluation of the native tropomyosin protein has not been
conducted and is also important, as ongoing research demonstrates that PL is possibly
able to alter protein structure. And last, within the limitation of PL to only penetrate the
surface of foods, experiments were conducted to investigate PL’s efficacy on half cut
shrimp. All of these experiments will illustrate the interaction of PL technology on the

18
tropomyosin protein as it is available, either as a protein extract or in a natural state in
the different forms of the shrimp sample.
19
CHAPTER 2 OBJECTIVES
The overall objective of this research was to examine allergen reduction on the
native tropomyosin protein in shrimp treated with PL. As part of this objective, the
effects of PL to on allergen reduction for the whole shrimp and half-cut shrimp samples
were compared. This objective constitutes the foundation of this research and is
extended from previous studies on shrimp extracts (Shriver et al. 2011). This earlier
study had demonstrated that IgE binding to epitope sites decreased after PL treatment
on the shrimp protein. Other studies have also shown allergen reduction in other foods
such as milk (Anugu and others 2009), wheat gluten (Nooji et al. 2010), soybeans
(Yang and others 2010b), and peanuts (Shriver and Yang 2011). Therefore, this
research aims to conduct the treatment to the whole and half cut shrimp, along with
further assessment of the native tropomyosin protein extracts, to examine the
antigenicity of the shrimp samples of different forms after PL illumination. The shrimp
species used is the Litopenaeus setiferus, also known as the Atlantic white shrimp.
Antigenicity was measured through SDS-PAGE, Western blotting, and indirect ELISA,
where each analysis served the purpose of indicating protein separation, detecting
antibody reactivity with the major shrimp allergen, tropomyosin, and antibody reactivity
with all proteins, respectively. Different durations of PL were used to provide various
exposure times to PL to assess PL’s effect on shrimp antigenicity.

20
CHAPTER 3 JUSTIFICATION
According to the National Oceanic and Atmospheric Administration (NOAA),
shrimp is the most commonly consumed seafood. It is estimated that 4.1 pounds (lbs) of
shrimp are consumed per capita in the United States (NOAA 2010). Several varieties
are available and there is a large market for shrimp. Therefore, having a hypoallergenic
shrimp product would be very attractive to the seafood industry and could expand the
consumer options in food choices. Additionally, it would allow for novel food products to
be developed, since shrimp could be used as an ingredient in other food products.
Furthermore, 1 in 50 Americans are estimated to have shellfish allergy, most of which
are caused by prawns and shrimp (Ayuso et al. 2008). Although no treatment is
currently available for allergies, emerging technologies like PL have shown positive
outcomes for allergenic foods such as peanut and milk. Moreover, in a previous study
(Shriver et al. 2011) conducted in the Food Processing and Engineering Laboratory at
the University of Florida, the effects of PL on shrimp extracts gave positive results in
that pulsed light treatment could reduce the antigenicity of tropomyosin extract.
However, more research is required to illustrate and determine the applicability of PL to
creating a hypoallergenic shrimp product. This could translate into a multitude of
beneficial implications, economically and public health wise. With successful
development, this technology potentially could be used in commercial processing to
create hypoallergenic cooked shrimp.

21
CHAPTER 4 LITERATURE REVIEW
In order to better understand allergens and allergies, a literature review is
provided that describes the basics of allergens and allergic responses and the current
methods used to diagnose allergies and treatment of allergenic foods so that they
trigger a reduced allergen reactivity. This review is broken down into four parts. First, a
description of the biology and chemistry of the proteins is given to help clarify the
protein nature, with an emphasis on allergenic proteins. Second, the differences
between the terms allergen and allergy are defined. Third, the methods used for
detecting food allergens are mentioned. These methods include both in vivo and in vitro
testing. In vivo testing adverts to testing on a living organism while in vitro testing
concerns itself with testing outside a living organism, such as in an environment defined
by the researcher. The environment is designed so that it simulates the actual
component of the living organism. Last, a selective summary is provided that shows the
current research regarding the treatment of allergenic foods using both thermal and
non-thermal treatments. The purpose is to highlight the different treatments that exist
and also the variability of results from these different treatments. The results can
demonstrate either an increase or decrease in allergen reactivity or give mixed results
due to the complex food matrix and protein changes. Under the broader scope of
allergenic foods, different foods are mentioned, but emphasis is given to current shrimp
allergen treatments. In summary, this review will establish a background that will help
with understanding and analyzing food allergen research, especially for shrimp
allergens.
22
Protein Biology and Chemistry
Antigenic compounds are simply proteins. Proteins are made up of monomers of
compounds called amino acids. These monomers contain an amino group, an alpha
carbon that is bonded to a hydrogen atom and an R group, and a carboxyl group. The R
group can be any other compound that helps designate the amino acid, serving to
define its structure and function. Linked together through a condensation reaction that
removes a water molecule, these amino acids make up the polymeric protein. Such a
bond is called a peptide bond (Berg and others 2007).
As these amino acids combine together, the structure of the protein begins to
form. Four levels of structure exist. The primary structure refers to the order, or
sequence, of amino acids linked together. The secondary structure is the shape of the
sequence, which can either be an alpha helix or the beta-pleated sheet where the
sequence of amino acids folds on itself. Hydrogen bonds help to retain this structure.
Next, the tertiary structure is the 3D shape that the protein takes on. Many kinds of
interactions are present here, including hydrogen bonds, ionic bonds, van der Waals
interactions, and disulfide bridges. Last, if multiple polypeptides combine together, they
can form the quaternary structure to give a unique structure. This last level of structure
is not found in all proteins and similar interactions such as those for tertiary structure are
present (Berg et al. 2007).
Despite the chemical bonds holding a protein structure together, the protein can
be denatured, and go from a hierarchy of higher protein structures, such as quaternary
structures, down to “lower-level” structures, such as the primary structures, and even
more primitive structures such as short chains of amino acids. High temperatures, such
as those in boiling, can break down hydrogen bonds, acid-base reactions can disrupt
23
ionic bonds, and proteases, which are also proteins, can break down peptide bonds.
When the protein is denatured, this can result in several changes in that as solubility is
decreased, allergenic activity may be destroyed, created, or kept the same, thus
affecting digestibility (Berg et al. 2007).
Food Allergens
A food allergen is a protein found in the matrix of foods. Food allergens are also
known as antigens and elicit an abnormal autoimmune response in the body when
individuals that are sensitive to the protein ingest it. If the allergen is not denatured and
retains its form throughout digestion, antibodies in the body are produced to bind to the
allergen and trigger an immune response. Allergens are usually found as glycoproteins.
Their molecular weights range from 10 – 70 kDa and they are water-soluble (Ebo and
Stevens 2001).
In the human body there are several antibodies that can be produced, but the
antibody typically responsible for the majority of food allergies is an immunoglobulin
antibody called Immunoglobulin E, abbreviated IgE. When the antibody binds to the
antigen, it causes the release of an inflammatory response that releases mediators such
as histamines and cytokines (Kabourek and Taylor 2003). The region where the
allergen, or antigen, binds to the antibody is called the epitope. Epitopes are sequences
of amino acids that can either exist either in a linear fashion along the protein or be
found as conformational epitopes that exist when the protein folds into a 3-dimensional
shape (Tanabe 2007).
For an antibody to bind to these epitopes, the allergen must maintain the stability
of that linear or conformational epitope. However, linear epitopes can be modified
through fragmentation or genetic modification while conformational epitopes can be
24
modified through partial denaturation, crosslinking, chemical modification, or
aggregation. The former involves changes in the sequence of the amino acids while the
latter involves structural changes to the 3-dimensional protein (Sathe and others 2005).
Therefore, several methods have focused on changing the allergenic protein so that if
there is an inhibition of IgE binding, then that would lead to a reduced or eliminated
allergenic response.
Food Allergy
As for food allergies, in order to better understand them, it is better to define a few
terms. First, a food allergy falls under the broader scope of adverse food reactions. An
adverse food reaction is any abnormal response that results from consumption of a food
or food additive. The reaction can be toxic, such as poisoning, or non-toxic, where the
response is due to hypersensitivities or food intolerance, respectively. With respect to
hypersensitivities, the individual’s immune system mounts either an IgE-mediated or
non-IgE mediated response to the foreign antigen present in the body. On the other
hand, an individual with food intolerance is not able to properly digest the food because
of the body’s inability to break down some compounds inherent in the food. A common
example is the inability to break down the milk sugar lactose since some individuals do
not have the necessary lactase enzyme to break the sugar down, hence the term
lactose intolerant. For the purpose of this review, the focus is on food hypersensitivities
that are IgE-mediated since these are prevalent food allergies, are better understood,
and are relevant to the PL treatment on shrimp tropomyosin allergen.
In the human diet, there are several different foods that one can consume.
However, despite this, only a select few foods cause the majority of food-induced
allergies. These select few foods are the eight major allergenic foods: soy, tree nut,

25
peanut, milk, eggs, wheat, fish, and shellfish. For children, the common allergenic foods
are milk, eggs, peanuts, soy and wheat and cause 90% of the reactions. For adults, the
common culprits are peanuts, tree nuts, fish, and shellfish and cause 85% of the
reactions (Sampson 1999b; Sampson 1999a).
Starting at birth, infants are more predisposed to food allergies than adults.
Several factors such as diet, genetics, and early development are responsible for this
susceptibility. To elaborate, the gastrointestinal tract and lymphoid tissue found in the
gut is not fully formed and must respond to both pathogens and food components and
delineate what is harmful or not harmful for the body. Since the system is still immature,
it is not as efficient (Sampson 1999a). Therefore, by introducing antigens at an early
age, it can stimulate overproduction of IgE antibodies, especially in infants that are
genetically susceptible (Soothill and others 1976).
Several symptoms can develop upon ingestion of the allergenic protein. These
symptoms form as the gastrointestinal tract allow the passage of these proteins, or
antigens, into the body, which are then disseminated to different organs (Walzer 1942).
These symptoms can either occur immediately within minutes or may have a longer
onset, such as in hours. Furthermore, the severity of the symptoms can vary among
individual to individual. In order to separate the potpourri of symptoms, these symptoms
can be categorized into cutaneous disorders, respiratory disorders, gastrointestinal
disorders, and system-wide disorders such as anaphylactic shock. In cutaneous
disorders, it can lead to urticaria and angioedema; for gastrointestinal disorders,
symptoms include diarrhea, nausea, vomiting, abdominal pain and colic; for respiratory
disorders, individuals can suffer from asthma, rhinoconjunctivitis, and bronchospasm;

26
and lastly, there is anaphylactic shock (Sampson 1999a). The latter is the most lethal
and can lead to fatality. Anaphylactic shock is when a series of allergenic reactions can
occur throughout the body, from itchiness to breathing problems to shock to ultimately
death. In fact, more patients are admitted to hospitals for anaphylaxis that stem from
food allergies as opposed to other sources of anaphylaxis (Yocum and Khan 1994).
To treat these reactions, sensitized individuals can use injections of epinephrine,
antihistamines, or other treatments that help alleviate these symptoms (Clark et al.
2004). Devices such as EpiPen® or Twinject® offer portable injectors that can help
suppress these reactions. Immunotherapy is also an option. The individual is subjected
to increasing doses of the antigen over a period of several years in order to help the
body’s antibodies become accustomed to this antigen so that the immune response is
weaker with time. This however may not be effective for all individuals. Lastly, the best
way to avoid having an allergenic response is to completely avoid the food. However,
since every individual can respond different to an allergen, it is important that they
recognize the degree of their sensitivity to the allergen. Many foods contain trace
amounts of allergens either from their use as an ingredient or residue left behind from
lack of equipment sanitation. Therefore, people that are extremely sensitive to even
small amounts of an allergen should avoid labels that say “it may contain” since even
these minuscule amounts can trigger autoimmune reactions.
Methods Used For Detecting Food Allergy
In Vivo Methods
For in vivo detection, the skin prick test (SPT) and the oral food challenge (OFC)
are used.

27
Skin Prick Test (SPT)
Regarding the skin prick test, this test is used to determine whether a patient has
or does not have an allergy. First, the evaluator must prepare a pure extract of the
allergen of interest. That extract is then pricked into the patient’s skin through the use of
a needle or pin. If a small red circle called a wheal forms and its diameter is greater than
3 millimeters (mm) as compared to the control, the patient is considered positive for the
allergen. However, a rash, urticaria, or worse, anaphylaxis can form. Furthermore,
patients that have atopic dermatitis can give false-positive results and each evaluation
is not the same from one evaluator to the next due to subjective testing (Poulsen 2001).
Oral Food Challenge (OFC)
A more reliable method for detecting a food allergy is the oral food challenge. The
oral food challenge is considered to be the “gold standard” of food allergy tests.
Although not 100% reliable due to the occurrence of false-positives and false negatives
that may exist, the test is much more reliable than other diagnostic tests. The patient is
given a capsule of foods that cause allergy and placebos that don’t. The tests lasts for
several hours, or even days, and the patient is observed of any reactions during this
time. Patients that would suffer from anaphylaxis are excluded from these studies since
there is direct exposure to the allergen. However, at times, some patients may exert
serious reactions. That was tested by (Perry and others 2004) who found that in this
type of testing, 28% of those tested did give off serious reactions. Furthermore,
increasing dosages can be given to see if a reaction occurs after a certain threshold.
However, all this can be time-consuming, expensive, and require different types of
foods so they can be difficult to administer. A variation of the test is double-blind

28
placebo-controlled food challenge (DBPCFC) where both the researcher and the patient
do not know what is given.
In Vitro Methods
For the in vitro detection, RAST (radioallergosorbent test) and EAST (enzyme
allergosorbent test) are used along with ImmunoCAP testing. Furthermore, there is also
SDS-PAGE, immunoblotting, and ELISA. The last three were used in this experiment.
RAST and EAST
RAST and EAST stand for radio-allergosorbent and enzyme-allergosorbent tests,
respectively. RAST in vitro tests operate by quantifying the IgE in patient’s sera that is
incubated with the allergen bound to a solid phase (Besler 2001) A secondary antibody
is added to bind with the primary antibody. The secondary antibody is also bound to a
radioisotope like I125 and this helps to quantify the allergen by measuring radioactivity
through a standard curve (Falagiani and others 1994). With EAST, enzymes (i.e.
alkaline phosphatase) instead of radioisotopes are used and there is measurement of
enzyme activity instead.
ImmunoCAP
The ImmunoCAP test uses the same concept of RAST and EAST tests with a
few differences. First, a 3D solid phase is used to help prevent binding of non-specific
non-IgE antibodies. And second, these tests also include more conformational epitopes
(Hamilton and Williams 2010). These tests do not take much time and can be done in
20 minutes and they report their units in kilo units per liter (kU / L).
SDS-PAGE
SDS-PAGE stands for sodium dodecyl sulfate polyacrylamide gel
electrophoresis. The test detects which proteins are present in a sample by separating
29
them into a gel (Shapiro and others 1967). The limitations of SDS-PAGE are that large
proteins will not pass through the gel and small proteins, or small fragments of proteins
after treatment, will pass through the gel into the buffer without being detected.
Smeared bands can also form if protein cross-linking occurs, in which the proteins does
not pass through the gel in a linear matter because of the different proteins are attached
together (Taheri-Kafrani and others 2009). Although this test can separate the proteins
in a sample, it will not show if the allergens are reactive to the antibodies. All it can show
if the allergen of interest is present or not. To show if the allergens are reactive to the
antibodies, immunoblotting and ELISA methods are required.
Immunoblotting
Immunoblotting consists of the Western blotting and dot blotting (Towbin and
others 1979).
Western blotting
The first step to any immunoblotting is the gel electrophoresis. It is the same gel
electrophoresis used for SDS-PAGE. However, instead of staining it to see the visible
bands, the gel is taken instead and then the proteins are transferred to membrane made
of either polyvinylide fluoride (PVDF) or nitrocellulose. The protein on this membrane is
then incubated with the primary antibodies followed by the secondary antibodies. There
are several washes in between the loading of the primary and secondary antibodies.
After the incubation is over, the membrane is then put under X-ray analysis to show the
reaction of the antibody with the antigen. If the antigen was present on the membrane,
results can be seen. However, if the antigen is not present as a result of the same
limitations found in SDS-PAGE, such as having large proteins, small proteins, or protein
cross-linking, it will not show results. Another problem is that only linear epitopes are

30
usually tested as a result of heating the protein to denature it before gel electrophoresis,
so all the conformational epitopes may not be detected (Aalberse 2000).
Dot blotting
Dot blotting is similar to Western blotting in that it analyzes allergen reactivity by
binding the antibody to the antigen and then detecting it through the secondary antibody
(Besler 2001). However, some differences do exist. First, no denaturing is done and this
helps preserve the conformational epitopes. Second, there is no preliminary gel
electrophoresis step. The sample is spotted to a membrane that contains the antibodies
(Besler 2001). This means that total protein allergenicity is measured as opposed to
single protein allergenicity since there was no protein separation step, unless a single
isolated protein is analyzed. The material for the membrane can be made of
nitrocellulose or polyester cloth (Besler 2001; Singh 1985).
ELISA
The term ELISA stands for enzyme-linked immunosorbent assay. This assay is
similar to the other tests that involve a series of attachments between the surface, the
antigen, the primary antibody, and the secondary antibody. In indirect ELISA, the
antigen is first adsorbed to a solid phase such as a 96-well plate (Wachholz and others
2005; Kemeny and Chanter 1988). Then the primary antibody is added to bind to
protein followed by a secondary antibody that is marked by an enzyme. The better that
the binding occurs, the stronger the color reaction will be afterwards (Besler 2001).
Several types of ELISA tests exist and kits are available to detect whole protein extracts
or specific proteins (Taylor and Nordlee 1996). The types of ELISA tests include indirect
ELISA, competitive inhibition ELISA (ciELISA), and sandwich ELISA. However, some
downfalls of this method is that the protein may not fully adsorb to the plate due to

31
interactions that interfere with conformational epitopes and also linear epitopes will not
be detected if they are not present on the surface. It is also the case that protein
denaturation can occur if there is too strong of a binding between the surface material
and the protein (Butler and others 1997).
Food Allergen Mitigation
Thermal Processing
Thermal treatments can be separated into moist heat and dry heat treatments.
With moist heat, there is some level of moisture, as is implied in the name for the
treatment. The source of the moisture can be water or steam or any cooking oil, among
others. Boiling, frying, heat sterilization and extrusion are examples of moist heat
treatments. Heat transfer by moist heat happens either by conduction, where heat
moves through the molecules in the food, or by convection, where heat is transferred by
a movement of the molecules. The latter is seen more in gases and liquids as opposed
to solids where molecular movement is more flexible and the movement of the
molecules causes warmer and cooler regions to be cooler together as a result of density
changes. Furthermore, depending on the source used, heating is done either directly or
indirectly. With direct heating, the source comes into direct contact with the food. With
indirect heating, a heat exchanger is commonly used that separates the source of heat
and the food product, such as steaming over the oven (Fellows 2009).
On the opposite end, there is dry heat and it includes microwaving, baking, and
roasting. The principle of dry heat is that moisture is removed from the product while at
the same time heat is applied. In microwaving, electromagnetic waves pass through the
food and indirectly heat the food by converting the electromagnetic energy into heat
energy. This form of heat transfer is through radiation. For baking and roasting, these

32
are the same operation and involve the passage of heated air that goes through the
food by conduction. The two names just refer to the different target foods for each
treatment, such as baking for bread and roasting for meats (Fellows 2009).
Regardless of how the heat is applied, such changes can have numerable effects
on food. Microorganisms can be destroyed. There can be sensory changes from food
interactions happening at the molecular level. And most important, there can be
nutritional changes, from either protein modification to protein inactivation that affects
how the protein allergen of interest can be made available to the body. For this reason,
it was believed that thermal processing could be used to destroy allergenic proteins in
the food. If the temperature is high enough, it can destroy covalent or non-covalent
bonding. However, due to the complex chemical and physical changes that can take
place, allergenicity of the food may increase, decrease, or stay the same. Some
conformational changes may occur which can destroy epitopes, but other changes can
follow which can create new allergenic sites. These new sites are called neoantigens
(Davis and others 2001).
To better understand how these changes occur on the allergen and only the
allergen as opposed to changes in digestibility that can occur in the body, it is important
to mention the Maillard reaction. The Maillard reaction, also known as the browning
reaction since it is responsible for giving many foods their brown color, is an important
and common reaction that occurs during heating. Since the food can contain protein,
reducing carbohydrates, or sugars, and water, this reaction is made possible by the
addition of heat. The Maillard browning reaction is a non-enzymatic reaction that starts
by the reaction of the carbonyl carbon on the reducing sugar to the nitrogen located on

33
the amino acid and the removal of water to give a compound called a glycosamine. This
intermediate compound then goes what is called an Amadori rearrangement to give
another intermediate compound called a ketoamine, also known as an Amadori
compound (Bucala 1996). The Amadori compound can then enter multiple pathways to
give end products such as melanoidin pigments, 5-hydroxymethy furfural (HMF), or
reductones. Collectively, all these different end products that from their various
pathways are called advanced glycation end products (Davis et al. 2001).
Other changes can occur too. Reactions with oxidized lipids are possible and there
can be direct oxidation when oxygen intermediates form (Doke and others 1989; Kalluri
and others 2000). Since amino acids are used in this reaction, it may either lead to a
loss of amino acids or new neoantigens may form. What makes this critical is whether
the B-cell epitopes that result can be detected by the immune system, or in other words,
whether the allergen is intact and can be absorbed to stimulate IgE antibodies (Davis et
al. 2001). It is possible that while the patient may not react to the uncooked product, an
IgE-mediated response can occur once the product has been heated or cooked. This
will be demonstrated below along other select studies that survey thermal processing on
allergenic foods.
Nonetheless, the final result for the Maillard browning reaction is that there can
be a change in protein quality along with changes to the appearance and taste of the
food. While thermal processing can affect the allergenicity potency of the food, it is
important to consider that the ideal situation is to have higher temperatures that are
used for shorter times so that the food is edible (Fellows 2009).

34
Moist Heat
Foods that show allergen reduction when treated with moist heat are peanuts,
depending on how they are prepared. What makes peanuts interesting is the manner in
which they are treated. It is estimated that in the U.S., about 0.6% of the population
suffers from peanut allergy and it is on an upward trend (Sicherer and others 1999). In
boiling and frying peanuts, which is the Chinese method of cooking, allergenicity is
found to be less than the conventional method of roasting peanuts in the U.S. (Beyer
and others 2001). Furthermore, half of the peanut consumed in the United States is
consumed as peanut butter (Sanford 1998). The common varieties of peanut include
Runner and Valencia, both of which are consumed mostly in a roasted form (Beyer et
al. 2001).
In treating the two major peanut allergens Ara h1 and Ara h2 by roasting peanuts,
researchers found that on SDS-PAGE, there were bands that corresponded to Ara h1
(65kDa) and Ara h2 (isoforms of Ara h2 at 16kDa and 18kDa) and also a band for Ara
h1 (148 kDA, which represents the trimeric form of Ara h1) (Mondoulet and others
2005). However, these bands were not found in boiled and fried peanut preparations
(Beyer et al. 2001) . These trimers that form are stable and might explain why binding
increased for the roasted peanuts. Furthermore, it was also shown that purified Ara h1
and Ara h2 were bound by IgE antibodies the most when they came from roasted
peanut. On the other hand, other studies show that Ara h1 decreases in fried peanuts
(Beyer et al. 2001).
In fish, the major allergens are parvalbumins (PV), which are proteins that are
involved in the skeletal muscle of fish and help it function, along with binding free
calcium ions. Multiple forms of PV can exist in fish, ranging from two to eight forms, but

35
usually three to five forms are found. Furthermore, parvalbumins are also present in
frog and for that reason patients can cross react with frog PV because of similar IgE-
binding epitopes and the same isoform (Gillis 1985; Chikou and others 1997; Huriaux
and others 2002; Focant and others 2003; Arif and others 2007; Arif 2009) . However,
PV does maintain stability when heat treated. In a study (Arif 2010), by boiling three PV-
isoforms of Channa marulius for 90oC for 3 hours, researchers found that PVs were
able to resist the denaturation as these bands were still visible on SDS-PAGE at 10
kDa.
In egg, the major allergens are ovalbumin (45 kDa) and ovamucoid (28 kDa).
These make up either 54% or 11% of the protein in egg white, respectively. Egg, along
with some other allergenic foods, such as cow milk, soy, and wheat, is one of the
frequent foods implicated in food allergies in children (Worm and others 2009).
Fortunately, these allergies only persist in childhood and become transient as one ages
(Tryphonas and others 2003). In testing both ovalbumin and ovamucoid (Bernhisel-
Broadbent and others 1994), researchers found that most of the antibody response was
to ovamucoid as it demonstrated a greater IgE response when testing on humans and
mouse models. It was suggested that because ovamucoid has hardy physical
characteristics, it retains its potency and resides in the body for several years, helping
memory B cells recognize the antigen when it is ingested. These memory B cells are
responsible for helping trigger immune responses and the reason that these memory B
cells exist is because the antigen is present in the body for several years (Tew and
others 1990). Other egg allergens are lysozyme and ovamucin, but these are not as
prevalent.

36
Next, for soybean (Glycine max), the major allergen is called P34, or Gly m Bd
30K, or Gly m 1, even though there are a total of at least 21 identified allergens (Babiker
and others 1998). P34 is similar to one of peanut’s main allergen, Ara h1 and cow’s milk
main allergen, 2-S1-casein, because it shares a 70% homology and a 50-70%
homology, respectively. Soybean allergies affect 1 to 6% of the infant population
(Tryphonas et al. 2003), but like other common infant allergies, it can be outgrown when
the infant reaches 3 years of age (Kabourek and Taylor 2003). In soybean, the major
proteins are the 11S globulin unit, which contains glycinin, and the 7S globulin unit,
which contains conglycinin. Both glycinin and conglycinin have subunits that each
participate in some level of antibody response. However, the majority of the response
comes from the P34 glycoprotein. It consists of 257 amino acids that are attached to the
7S globulin protein by disulfide bonds (Wilson and others 2005). It is coded by a single
gene that comprises 2% - 3% of all protein and it is proposed that by removing that
gene, the nutritional value loss would be minimal (Babiker and others 2000; Helm and
others 1998; Ji and others 1998). 12 linear epitope regions have been considered to be
involved in IgE binding and it is proposed that there is a diversity of amino acids
present, which may contribute to P34’s stability. However, different experiments have
demonstrated different results. In one study, it was shown that by inserting an alanine
amino acid at an individual site by genetic modification, it is possible that allergenicity
may be reduced or even eliminated for in some patient’s sera (Helm and others 2000).
With respect to heat processing, the use of steam in autoclave treatment can cause P34
allergenicity to increase (Yamanishi and others 1995). Yet, when the soy is prepared as

37
a textured soy protein, there were reduced levels of allergenicity with extrusion at high
temperatures (Franck and others 2002).
Lastly, for milk, it is an allergenic food that is more common among infants than
adults, since this allergy can disappear for most children at around 4 years of age.
Since milk contains all the nutrients for a newborn and is the most appropriate food for
infants, it can be a problem when cow milk is substituted for human milk, which can lead
to nutritional and immunological problems (El-Agamy 2007). There can be an immediate
reaction within hours or a delayed reaction (can go from hours to days). As a result,
CMA is more serious in early infancy (Hill and Hosking 1996; Järvinen and others
2002). About 20 allergens have been found to cause allergies, but the main proteins are
casein and whey (Gjesing and others 1986; Cavagni 1994; Docena and others 1996).
From the casein side, there can be α, β, and k-casein while on the whey side, the
important allergen is β-lactoglobulin (β-lg). Other proteins are α-lactalbumin, bovine
serum albumin (BSA) and immunoglobulin (IGs). As a result of all these proteins,
different results can occur after heat treatment depending on what the milk protein is.
These proteins reflect different stabilities. BSA is the most heat labile milk protein, α-
casein is the most heat stable, and β-lg is comparatively heat stable (Bahna and Gandhi
1983). And despite casein being the most stable, heating milk at 120oC for 15 min did
not affect it (Hanson and MÅNsson 1961). However, the BSA and IGs milk proteins did
lose their antigenicity at 70oC – 80oC or at 100oC (Fiocchi and others 1998; Hanson and
MÅNsson 1961). However, it is important to consider the implications of these heat
treatments on milk, which can cause nutritional loss and an inferior product.

38
Dry Heat
Another common allergen which has been treated with moist thermal processing is
wheat. It is used in several ways, from making bread to pasta to dough, which can give
other kinds of products (Simonato and others 2001). In wheat, the proteins responsible
for the majority of allergenic responses are gluten proteins. These proteins are made up
of monomeric gliadins and polymeric glutenins. In one study (Pasini and others 2001),
the researchers evaluated the antigenicity of the wheat flour proteins. The sources for
the proteins were unheated wheat dough, bread crumb, and bread crust. For both the
crumb and the crust, two different heat treatments were applied, one at 100oC and one
at 180oC. The researchers discovered that after this heat treatment, these samples
were more easily digested using an in vitro system as compared to the unheated dough.
However, they also discovered in a previous study that antigenicity did increase as a
result of protein modification and browning reactions (Hansen 1975; Hansen 1979;
Pasini et al. 2001). Subsequently, lower weight proteins, such as those allergens at 16
kDa, were found to be digestable. These allergens play a role in bakers’ asthma that
happens after an individual breathes in flour particles (Gómez and others 1990). But, by
baking the bread, that 16 kDa allergen did disappear in crumb and crust samples.
Regarding tree nuts allergies, hazelnut allergy affects individuals who may also
be birch pollen allergic (Worm et al. 2009). Cor a 1.04 is the major pollen in hazelnut
and because it is part of the pathogenesis-related protein family 10, it shares a high
sequence with the allergen behind birch pollen, Bet v 1 (Kleine-Tebbe and others 2002;
Lüttkopf and others 2002; Worm et al. 2009). However, unlike the Bet v 1 birch pollen
allergen, which is labile to heat treatment, the food hazelnut allergen shows a spectrum
of heat tolerance (Vieths and others 1999). It may be that these allergens in hazelnut

39
belong to a more heat-resistant protein family or because of the different heat-tolerant
allergens. Unlike peanuts, who’s allergenicity increases with roasting, for hazelnut,
allergenicity decreases (Hansen and others 2003; Worm et al. 2009). Furthermore, in
another study (Worm et al. 2009), researchers also discovered that oral allergy
syndrome can occur from hazelnut digestion, or a systematic reaction, rather than just
by contact. By giving the patients capsules filled the antigen, it was postulated that
organ specific reactions could occur. Other allergens also present in hazelnut include
Cor a 2, Cor a 8, Cor a 9, Cor a 11, 2S albumin and a thaumatin-like protein (Ballmer-
Weber 2002; Beyer and others 2002; Pastorello and others 2002; Schocker and others
2004).
Finally, another tree nut, almond, is also a common allergenic food. The major
antigen is amandin, or almond major protein (AMP). This tree nut, like some other
allergens, also gives different results. When roasted or blanched (moist heat), there is
no elimination of the antigenicity (Roux and others 2001). However, when analysis is
extended to evaluate all the total allergens and more extreme treatments are used, the
results can be the opposite. Researchers tested different commercial processing
methods on the almond proteins (Prunus dulcis L.) (Venkatachalam and others 2002).
They found that microwaving at extreme conditions (3 min) caused a reduction in
antigenicity; roasting also decreased it (320oC for 20 and 30 min; and that blanching
decreased antigenicity too (2 – 10 min). The reason that these extreme conditions were
more effective is due to the protein structure. While heat can affect protein
conformation, reduction in antigenicity in these samples would result from changes in

40
linear epitopes. For standard commercial processing, the proteins from 39 kDa to 66
kDa, which are IgE-binding epitopes, were stable (Venkatachalam et al. 2002).
Non-Thermal Processing
Non-thermal processing methods include those that minimize the amount of heat
that is applied to the food. As mentioned earlier, heat can be a cooking method and is
necessary to prepare some food such as wheat and heat. It also can destroy
microorganisms and give food their final properties. Too much heat, however, can be
detrimental. It can lead to nutritional and sensory loss in the food. This kind of product is
not favored by consumers and is considered an inferior product.
To circumvent such potential issues, a trend towards non-thermal processing
methods is being investigated. Non-thermal processing refers to minimal application of
heat in order to give a food that is of high quality and also safe. Methods of non-thermal
processing include pulsed ultraviolet light (pulsed light), gamma irradiation, ultrasound,
high pressure processing, genetic modification, pulsed electric field, and oscillating
magnetic fields (Fellows 2009). Some of these technologies have also been discovered
to have an effect on proteins, including allergenic proteins, and show an inherent
capacity to mitigate food allergens in some samples. Antigenicity can increase or
decrease depending on the sample and treatment. Notwithstanding the results, these
technologies are still in development and while results do not always give good
prospects always, there is a possibility that in the future these technologies may play a
more dominant role in allergen reduction.
The technologies of pulsed light, gamma irradiation, ultrasound, high pressure
processing, and genetic modification are highlighted below to give an overview of the
use of these technologies on food allergens.

41
Pulsed Light
As described earlier, pulsed light is the application of the light spectrum from 170 –
2600 nm through a lamp filled with an inert gas, like Xenon, in short duration pulses. It is
also possible for ultraviolet light to be emitted as a continuous phase, but these
traditional systems lack the intensity of the pulsed light, which can be many thousand
times stronger (Dunn and others 1995). PL can cause photo-chemical, photo-thermal,
and photo-physical changes in the food because of its high energy and the application
of other waves such as visible waves and infrared waves.
Regarding PL treatment on food allergens, a previous study on shrimp extract
(Shriver et al. 2011) showed that protein extract after PL treatment of 4 - 6 minute
showed reduction of the major shrimp tropomyosin protein. In the SDS-PAGE, the
tropomyosin protein was not visible, which was also confirmed by Western blot analysis.
Shriver et al. then went to further test the 4 minute sample under different conditions.
This time point was chosen because it presented the ideal shrimp since the 5 minute
and 6 minute samples showed significant moisture loss. Having shrimp with high
moisture loss can make it unsuitable for consumption if the treatment ever was
translated into more commercial processing methods. Thus, by further testing only the 4
minute sample again with boiling, it showed that compared to the raw sample, the
pulsed and pulsed + boiling sample showed reduction while the boiled sample alone
showed no reduction. While tropomyosin is considered a highly resistant protein to
thermal treatment, it was suggested by Shriver and others that the high peak energy of
PL may have caused intense localized heating that could have denatured the protein.
Furthermore, other changes from protein cross-linking or protein fragmentation due to
the Maillard reaction or photo-chemical effects could also have caused these changes.
42
This is possible because other studies have shown that the Maillard reaction can reduce
tropomyosin activity in squid tropomyosin (Nakamura and others 2006), but another
study showed that it does not in scallop tropomyosin (Nakamura and others 2005).
To demonstrate another research utilizing pulsed light on food allergen, (Chung
and others 2008) treated peanut extracts and liquid peanut butter compared to boiled
samples. They found that the major allergens, Ara h1 (63 kDa) and Ara h3 (~50 kDa)
were not found in the PL treated samples while bands for 18 to 20 kDa, which
represented Ara h2, were visible in the peanut extracts. These proteins might either be
insoluble aggregates or precipitates. However, the boiled treated extract showed no
missing bands and was similar to the control. It showed the presence of the 50 kDa and
63 kDa proteins, indicating that the proteins after boiling were soluble non-aggregates.
In other words, reduction in peanut allergy could be attributed to the formation of
aggregates. As for the liquid peanut butter sample, it should no presence of the 50 kDa,
63 kDa, and 18 – 20 kDa proteins. For these samples, the same reasons were
proposed, in that the cause for this reduction in peanut allergens in liquid peanut butter
was attributed to insoluble protein aggregation.
Gamma Irradiation
Gamma irradiation refers to ionizing radiation from the gamma portion of the
electromagnetic spectrum. It can disrupt the chemical bonds in a food through free
radicals. There are different uses for gamma irradiation in food applications, including
food decontamination, optimization of yield, and other quality functions. With regard to
allergens, it has been found that irradiation can have varying results in shrimp
(Zhenxing and others 2007b). When working with the protein extract, the researchers
demonstrated gamma irradiation could decrease antigenicity. However, when scaled up
43
to the shrimp muscle, antigenicity increased up to a dosage of 5 kiloGrays (kGy), after
which it decreased when dosage levels exceeded 10 kGy. This however is the high limit
for safe human consumption. The researchers explained that the reason for shrimp
muscle being less susceptible to gamma irradiation could have been due to the
protection of tropomyosin from free radicals by other compounds such as lipids and that
as the radiation dose increased, reduction could be seen because of stronger radical
forces that were able to break the chemical linkages in proteins. Several reactions may
have taken place such as deamination, decarboxylation, and epitope breakage.
Furthermore, they also discovered that on the SDS-PAGE, a band of 45 kDA was
noticed at the 7 kGy and 10 kGy mark for the shrimp muscle. This new band may have
been the outcome of protein cross-linking or protein aggregation and shows the
disruptive effect of gamma irradiation.
In another study (Zhenxing and others 2007a), the researchers expanded the
treatment to include gamma irradiation and heat on peeled shrimp. Dosages from 1 –
15 kGy were applied and the heat source included blanching in boiling water for times of
5, 10, and 15 minutes. After extracting the protein, this combined treatment showed
better reduction than irradiated shrimp alone. There was a 5 to 30-fold decrease
compared with the untreated shrimp for the IC50 (half maximal inhibitory concentration)
value, which measures how effective a compound is at inhibition. The basis for an
increased reduction can be that radiation first destroyed or exposed the allergens
through its free radicals and then when heat treatment followed, this facilitated
destruction of those exposed epitope sites.

44
High Intensity Ultrasound
High intensity ultrasound, which is also known as power ultrasound, is a
technology that uses waves of ultrasound frequency from 20 – 100 (kilohertz) kHz with
high intensities of 10 – 1000 watt per square meter (W cm-2). The use of these high
intensity waves causes the waves to impact the food matrix and create cavitation
bubbles in the food. The cavitation bubbles are the result of opposite compression and
shearing waves. As these bubbles form and then eventually implode, it creates areas of
high localized pressure and heat that go up to 1000 atmospheric pressure (atm) and
5000 Kelvins (K), along with the formation of free radicals in the food, which
subsequently cause physical and chemical disruptions in the food structure.
Researchers (Zhenxing and others 2006) used ultrasound 30 hertz (Hz), 800 watts
(W) for 30 – 180 minutes on shrimp muscle and protein extract. They discovered that
ultrasound showed more reduction in the pure allergen as opposed to the shrimp
muscle, although the shrimp muscle itself did show allergen reduction. The explanation
for this difference was attributed to the other food components present in the shrimp
muscle, which would have created a layering effect. The researchers also went to
discover a proportional relationship between the treatment time and the amount of
reduction. One interesting observation was that immunoblotting results showed greater
reduction than ELISA results at the same treatment time. Two possible explanations
were given. First, there is the fact that immunological reactions can be different from
one patient to another and also the reactive antibodies differed too. Second, ultrasound
treatment of the samples causes some epitopes to be separated, which could only be
detected in ELISA and not immunoblotting.

45
High Pressure Processing
High pressure processing is the use of high pressures, from 100 megapascals
(MPa) to 1000 MPa. It has been found that by applying such high pressures on the food
for a time duration that can be from seconds to minutes, proteins can be inactivated.
Changes in the food may or may not occur depending in the amount of pressure
applied. Weak bonds in the protein can be disrupted while covalent bonds are not
disrupted (Fellows 2009) . This technology has been extended to food allergens too as
it can affect the tertiary and quaternary structures (Silva and others 2001).
In one study (Peñas and others 2011), researchers treated soybean seeds, tofu,
and sprouts at 300 MPa for 15 min at 40oC. They discovered that the treatment did
increase allergens in the soybean seeds and sprouts while nothing happened in the tofu
sample, as compared to each respective raw sample. In another study (Troszynska and
others 2007), the results were were the opposite , in which it was seen that soybean
allergenicity decreased when soybeans were germinated. This may be due to the
soybean species and also the conditions for germination. However, when those same
sprouts were treated with HHP, they did show reduction.
In another study, researchers looked at the application of high pressure on milk
proteins. It was shown that β-lactoglobulin and α-lactalbumin can be denatured if the
pressure ranges from 100 – 300 MPa, but the denaturation is reversible (Suzuki and
Taniguchi 1972). However, when 400 MPa is reached, the denaturation is irreversible.
Another study (Kleber and others 2007) showed that antigenicity of β-lactoglobulin
increased with increasing pressure and holding time, form 200 – 600 MPa. This was
explained by the weakening of the non-covalent bonds and this allowed better
accessibility of the antibodies.

46
Genetic Modification
Genetic modification refers to changes that occur at the genetic level in order to
elicit some desirable property in the food. While genetic engineering can be
controversial and consumers are unsure of its long-term safety, it does however
demonstrate potential. Gly m Bd 30 K, also known as P34, is the major
immunodominant allergen in soybean that affects over 65% of patients (Helm et al.
1998; Helm et al. 2000; Ogawa and others 1991; Ogawa and others 1993). By using
molecular techniques, the gene that codes for Gly m Bd 30 K was silenced through the
insertion of P34 complementary DNA (cDNA) that did not code for the P34 gene itself.
Genetic modification was necessary because no natural species of soybean plants was
found that lacked this gene (Yaklich and others 1999). No observable phenotypic
changes were present and no new protein bands were found in the gel electrophoresis
system. Only the P34 band was absent. This showed that removal of allergenic proteins
is possible. However, the researchers did not evaluate whether the food itself would be
deemed hypoallergenic to sensitive individuals.

47
CHAPTER 5 MATERIALS AND METHODS
Human Plasma Samples
Human plasma samples were provided by PlasmaLabs International (Everett,
WA, U.S.A). The samples were obtained as pooled plasma of three individuals having
specific IgE antibodies for major shrimp allergens, since every individual reacts
differently to an allergen. In addition, samples from three individuals that have no history
of shrimp hypersensitivity served as a control in distinguishing any false positive or
negative results. Therefore, a total of six individuals were included: half with and half
without a history of shrimp allergies, respectively. The concentration of the plasma was
measured at 76 kilounits per liter (kU / L), based on measurements from ImmunoCAP
testing (Phadia AB, Uppsala, Sweden). The plasma is used for immunoblotting in
Western blotting and testing with indirect ELISA.
Preparation of Protein Extract
Frozen whole shrimp (Atlantic white Shrimp) was purchased from Publix
Supermarkets (Gainesville FL, U.S.A). Prior to experimentation, the samples were
purchased de-headed and de-veined, thawed in a plastic zip bag in water at room
temperature for 1 hour (h), and de-shelled afterwards. In order to extract the protein,
shrimp were weighed out to 25 grams (g) and ground in a food processor at high speed
for 5 minutes (min) in a buffer of 0.6M KCL in 0.01M NaH2PO4 (pH of 7). Subsequently,
the ground shrimp mixture was homogenized using a BioSpec BioHomogenizer
(Bartlesville, OK, U.S.A.) at high speed for 5 min and aliquots were placed in 15 mL
Screw Cap Conical Bottom centrifuge tubes (Corning, Corning, NY, U.S.A.) for
centrifugation (Beckman Allegra X-15R, Beckman Coulter, Brea, CA, U.S.A.) at 5000

48
times gravity (x g) for 120 min. The supernatant obtained served as the reservoir for the
protein extract samples. 10 milliliters (mL) was added to aluminum weighing dishes
(Fisher Scientific, Pittsburg, PA, U.S.A.) and placed on ice in a Styrofoam cooler and
covered before treatment. The time points for the protein extract were raw (R), boiled
(B), 2, 4, 5, 6, and 8 min. For the boiled shrimp, 25 g of shrimp were boiled at 100oC for
10 min before the subsequent steps of grinding, centrifugation, and homogenization.
Preparation of Whole Shrimp
Whole shrimp samples were prepared exactly the same as the protein extract
samples, with few significant and noticeable differences. The shrimp was purchased
from Publix Supermarkets (Gainesville FL, U.S.A). Next, the shrimps were thawed by
transferring them into plastic plastic zip bags and placing them in water for 1 h before
use. The whole shrimp were de-headed, de-veined, and de-shelled. Afterwards, the
shrimps were weighed and placed on aluminum dishes and placed on ice in a
Styrofoam cooler and covered prior to treatment. A set of three shrimp were used for
each time point, which included raw, boiled, 6, 8, 10, 12, and 15 min for treatment on
each side. Therefore, the total exposure time to PL for the whole shrimp treated on both
sides totaled 12, 16, 20, 24, and 30 min, respectively. The boiled samples were boiled
at 100oC for 10 min.
Preparation of Half-Cut Shrimp
In the third experimental group, the half-cut shrimp were prepared similar to the
whole shrimp. After purchase of de-headed, de-veined, and de-shelled shrimp, plastic
bags were used to thaw the shrimp for 1 h by placing the bag in water. The shrimp were
removed from the bag and cut along the longitudinal axis from the head to the tail by
making the incision on the dorsal side, or back side, of the shrimp. A standard kitchen

49
knife was used and the cut went up to the surface of the ventral side, or belly of the
shrimp. Two symmetrical halves were formed and full separation did not occur since the
shrimp was still intact at the ventral end. In other words, the shrimp had been unfolded
from the back to reveal the interior muscle. Considered as one unit, three shrimps were
weighed together on aluminum dishes and stored and covered in a Styrofoam cooler
containing ice. Three shrimps were then treated for the same time duration used for the
whole shrimp experimental group. Treatment points were comprised of the points raw,
boiled, 6, 8, 10, 12, and 15 min. Also, coinciding with the whole shrimp samples, both
sides were treated to make the total exposure times for half-cut shrimp amount to 12,
16, 20, 24, and 30 min, respectively. The boiled samples were prepared exactly the
same as other boiled shrimp samples, at 100oC for 10 min.
Pulsed Ultraviolet Light Treatment
All the shrimp samples were treated with PL at a distance of 10 cm from the light
source on the aluminum dishes. Using the Xenon PL processor (Model LHS40 LMP
HSG) (Xenon Corp., Wilmington, MA, U.S.A) (Figure 5-1), treatment was carried out at
3 pulses / s with a width of 360 us in batch mode. For the protein extract, a single tray
was placed underneath the lamp for each time point. For the whole and half-cut shrimp,
three individual shrimp or shrimp units were placed together in three separate dishes for
each time point and flipped halfway to treat the other side. All the shrimp samples for
each group were treated together. In other words, whole shrimp samples for all the time
points were treated one after another and half cut shrimp samples for all of the
treatment times were treated one after another. This is the same for the protein extract
samples.

50
Figure 5-1. Xenon PL processor (Model LHS40 LMP HSG).
Temperature Measurement
A non-contact infrared thermometer (Omega OS423-LS, Omega Engineering, Inc.,
Stamford, CT, U.S.A.) was used to measure temperature of the PL treated shrimp
before and immediately after treatment. For the whole shrimp and half-cut shrimp, this
was also done prior to flipping the shrimp. We were not able to record the highest
temperature since that would have been during PL illumination. Instead, after a 5 – 10 s
delay in removing the samples from the PL processor, we recorded the highest
temperature reading available.
Post-Processing Preparation
In order to work with the samples after treatment, some post-processing
preparation was needed for the protein extract, whole shrimp, and half cut shrimp. For
the protein extract, the only post-processing step involved homogenization for 5 min
following treatment. For the whole shrimp and half cut shrimp, each group set of shrimp
for each time point were ground together in a food blender in a buffer of 0.6 KCL in
51
.01M NaH2PO4 (pH of 7) and then homogenized for 5 min at high speed. The mixture
for each group for each time point was used in subsequent testing.
Protein Concentration Measurements
After PL treatment, the samples were analyzed for protein concentration using
the Coomassie Plus (Bradford) protein assay kit (Pierce, Rockford, IL, U.S.A), using
bovine serum albumin protein (Pierce) as a standard (0 - 0.05 μg/mL). The supernatant
(protein extract), whole shrimp, and half cut shrimp mixture obtained from the post-
processing steps was appropriately diluted using PBS 1X buffer (Fisher Scientific
Phosphate Buffered Saline 10X Solution, distilled water). Then, 10 μL of the diluted
samples were added to a 96 clear-well plate (Fisher Scientific) in duplicates. The
dilutions used were: 1:50 for all raw samples in each experimental group; 1:30 for the
protein extract samples, including its boiled sample, and 1:10 for the whole shrimp and
half cut shrimp samples, including each of their boiled samples. This was followed then
by the addition of 300 uL of Coomassie Blue (Thermo Scientific, Rockford, IL, U.S.A.)
that had been previously warmed to room temperature. Protein concentration values
were then determined using a SpectraMax 340PC384 Absorbance Microplate Reader at
595 nm (Molecular Devices, Sunnyvale, CA, U.S.A.) and then diluted to 5 ug/uL using
PBS 1X for gel electrophoresis and 0.02 ug/100 uL for ELISA testing.
SDS-PAGE (sodium dodecyl sulfate polyacrylamide gel electrophoresis)
For the SDS-PAGE, all the concentrated shrimp samples after the protein
concentration measurements were prepared into a 1:1 ratio with 2X Laemmli sample
buffer (62.5 mM Tris-HCL, 2% SDS, 25% glycerol, 0.01% Bromophenol Blue, and
0.05% β-mercaptoethanol, pH 6.8) (BioRad Laboratories, Hercules, CA, U.S.A). The
samples were boiled for 10 min before being transferred to a pre-cast tris-glycine

52
minigel (4-20%) (Bio-Rad). The only exception to this was the treated protein extracts,
which were not boiled since the native tropomyosin protein was of interest. A Protein
Plus All Protein All Blue protein stain (Bio-Rad) was added and used as the standard.
All the samples were added in duplicates except for the marker, which had one well.
Next, the gels were placed in a Mini-PROTEAN Tetra Cell tank apparatus (Bio-Rad) to
begin gel electrophoresis. The settings used for protein separation were 150V for 1.5 hr
at room temperature.
Upon completion, the gel was removed from its casing and washed with distilled
water for 5 min on a rocker and then stained with GelCode Blue reagent (Pierce). The
gel was left overnight to facilitate adequate staining. Distilled water was used again to
remove any excess GelCode Blue reagent and the gels were then scanned with a
Canon Pixma MP160 scanner.
Western Blot Analysis
The Western blot procedure also follows the same procedure as SDS-PAGE
except that after gel electrophoresis, the gels are not stained to identify the protein
bands. Instead, the gels are similarly washed with distilled water for 5 min and then
transferred on to an Immobilon-P Transfer Membrane (Millipore Corporation, Bedford,
MA, U.S.A.) made of polyvinylidene fluoride (PVDF). The transfer procedure involves
cutting two Protean Extra Thick Blot Papers (Bio-Rad) and the transfer membrane to the
size of the gel. The size of the papers and the membrane must match or be similar to
the gel so that all the proteins can be transferred to it. Collectively, these materials are
then soaked in Transfer Buffer (Bio-Rad 10X TG, distilled water, ethanol) for 1 min.
Next, the transfer membrane is removed and covered with methanol on both sides.
Everything is then placed in a Trans-Blot SD Semi-Dry Transfer Cell (Bio-Rad). For the

53
placement order, starting from the bottom, it is: the blot paper (Protean Extra Thick Blot
Paper), the transfer membrane, the gel, and finally the second blot paper. All bubbles
were removed and a setting of 15V and 30 minutes was used.
Next, the blotting membrane, which is the transfer membrane that has had the
proteins transferred to it from the gel, was put in a small plastic container and washed
with distilled water for 5 min on the rocker. The distilled water was removed and
Ponceau S Solution (Sigma-Aldrich, St. Louis, MO, U.S.A.) was added for 5 min to give
a red indication to show if the proteins transferred properly. After this, the blotting
membrane was washed with TBS 1X (Fisher Scientific Tris Buffered Saline 10X
Solution, distilled water) for 10 min and then covered with StartingBlock T-20 Coating
Blocking Buffer (Pierce) for 1 hr. This would permit antibody specificity to the protein of
interest. Following this, the membrane was washed with TBST (TBS 1X, Fisher
Scientific Tween 20) for two times for 5 min each. Incubation with the anti-shrimp IgE
(primary antibody) (Phadia AB) followed at a dilution of 1:20, using PBS 1X as the
diluent. 10mL of the primary antibody was used and incubation lasted for 2 hrs.
Afterwards, subsequent washing continued with four washes of 5 min each using TBST.
The secondary antibody was added next. 10mL of mouse anti-human IgE-HRP
(Invitrogen, Carlsbad, CA, U.S.A) was added at a dilution of 1:1000, using PBS 1X for
the diluent. Incubation proceeded for 1 hr. Pursuant to this, another repeat of four
washes with TBST was done except this time for 10, 5, 5, and 5 min.
Finally, the transfer membrane was prepped for X-ray analysis. A 1:1 solution of
SuperSignal West Pico Chemiluminescent substrate (Thermo Fisher Scientific,
Rockford, IL, U.S.A.) was prepared as the enhanced chemiluminescence (ECL)
54
substrate. It was poured over the transfer membrane and allowed to stand for 5 min.
The mixture was then poured off and the transfer membrane placed inside an X-ray
cassette (Soyee Products, Thompson, CT, U.S.A.) and all the bubbles were removed.
Lastly, using Classic Blue Autoradiography Film (MIDSCI, St. Louis, MO, U.S.A.), the
film was developed using an X-ray machine (ImageWorks, Elmsford, NY, U.S.A.).
Exposure times are optimized to give the sharpest distinction among the bands and the
least visible background.
Indirect ELISA
For the ELISA, all the concentrated shrimp samples were placed into Costar EIA
polystyrene 96-well plates (Corning) at a dilution of 0.2 ug/100mL using PBS 1X to
dilute the mixture. 100 uL of each sample was added to each well and repeated three
times to give triplicates. Furthermore, in addition to the sample tests, a control sample
was used from the human plasma that comes from individuals who do not have any
shrimp allergies. The samples are then incubated at 37oC for 1 hr. Next, 200 uL of
StartingBlock T-20 Blocking Buffer (Pierce) was added and allowed to incubate the
samples for 1 hr. Following this, the wells were washed by flipping over the samples into
a sink and quickly adding PBST (PBS 1X, Tween 20) to each well. The PBST is also
poured out immediately and the 96-well plate is patted on brown napkins to dry. This is
repeated two more times with PBST.
The primary antibody (Phadia AB) is added next. The dilution used is 1:10 with
PBS 1X serving as the diluent. Incubation occurs for 1 hr followed by subsequent
washing with PBST for three times. A secondary antibody (Invitrogen) diluted to 1:3000
with PBS 1X is then added and incubation continues for another hour. After this, the
plate is washed again using the same methods from above and an OPD Solution

55
(Thermo Fisher Scientific) is added to each well. 100 uL is added and immediately
afterwards, the absorbance values are read at 490 nm using a Spectramax 340PC384
spectrophotometer (Molecular Devices).
Statistical Analysis
Densitometric analysis was performed on the samples in the Western blot to
quantify the binding and describe the changes using ImageJ 1.44 software (National
Institute of Health). In addition, one-way analysis of variance (ANOVA) was also
performed using SAS 9.2 software (Cary, N.C.) with significant differences between
means at α = 0.05.
Figure 5-2. Summary of experimental design for protein extract, whole shrimp, and half
cut shrimp.
Treatment Groups
Half Cut Shrimp
Raw (Control), Boiled, 6, 8,
10, 12, 15 min
SDS-PAGE, Western blot
Whole Shrimp
Raw (Control), boiled, 6, 8,
10, 12, 15 min
SDS-PAGE, Western blot,
and ELISA
Native Protein Extract
Raw (Control), Boiled, 2, 4, 5,
6, 8 min
SDS-PAGE, Western blot,
and ELISA

56
CHAPTER 6 RESULTS AND DISCUSSION
Even though shrimp samples are rich in different proteins, the protein of interest
that causes the majority of allergenic reactions is tropomyosin. It is responsible for more
than half of the auto-immune response in individuals. This heat-stable protein is
resistant to denaturation and can tolerant even extreme changes and therefore the
effects of pulsed light treatment have given mixed results depending on the sample.
Protein Extracts
SDS-PAGE Analysis of Protein Extracts
The SDS-PAGE for the native protein extracts (Figure 6-1) shows a total of 13
bands. The bands of interests are the tropomyosin bands as marked with a pointer at 37
kDa. From left to right, the bands are the standard marker, the raw (R) samples, 2 min,
4 min, 5 min, 6 min, and 8 min PL-treated samples. All the samples were added in
duplicates except for the standard marker. The boiled sample data are not shown.
SDS-PAGE is a technique for detecting protein profiles by separating those protein
samples into different bands. The protein bands can be differentiated by a protein
marker that has a known protein molecular weight. By being able to see and match the
proteins of interest to the standard marker, we can determine what proteins are present
in the sample, or those that exist in the gel electrophoresis system, and also which
bands are not present in the treated samples. As Figure 5-1 illustrates, the raw shrimp
samples have several different protein bands. These correspond to the proteins that
would be present in the raw sample. Unlike the pulsed light treated samples, which
show a reduction of the whole protein profile, more bands are present in the raw
samples and with greater protein presence.
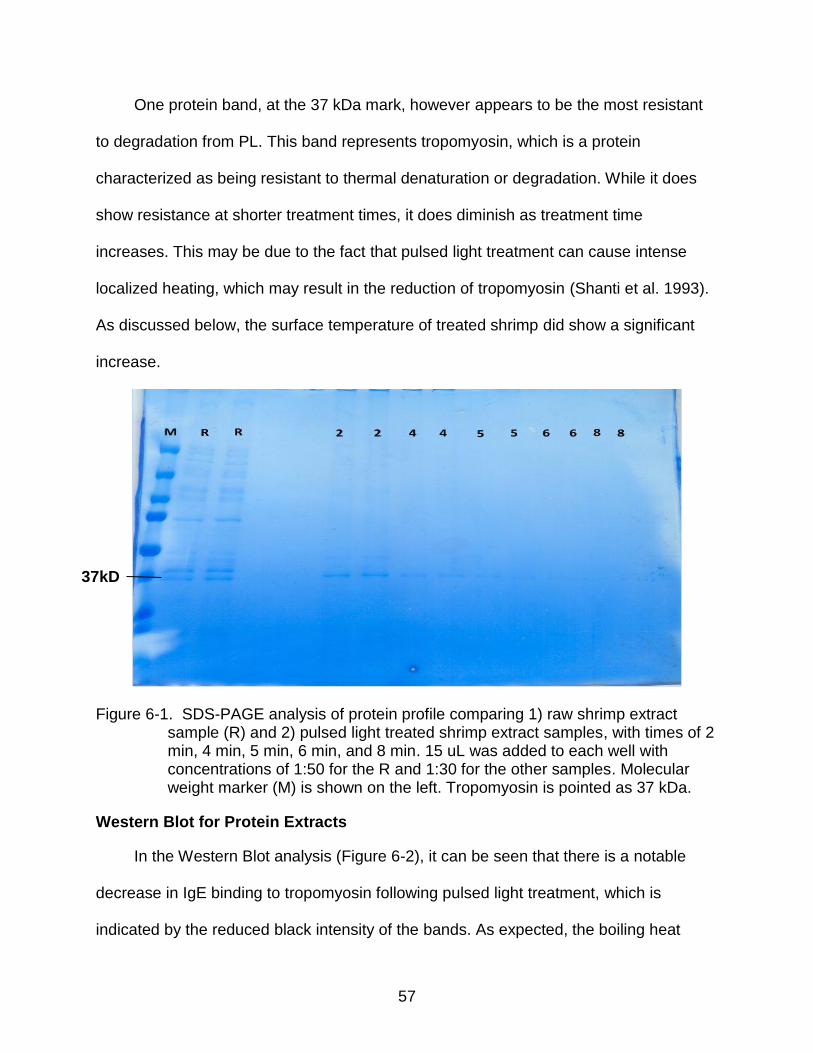
57
One protein band, at the 37 kDa mark, however appears to be the most resistant
to degradation from PL. This band represents tropomyosin, which is a protein
characterized as being resistant to thermal denaturation or degradation. While it does
show resistance at shorter treatment times, it does diminish as treatment time
increases. This may be due to the fact that pulsed light treatment can cause intense
localized heating, which may result in the reduction of tropomyosin (Shanti et al. 1993).
As discussed below, the surface temperature of treated shrimp did show a significant
increase.
Figure 6-1. SDS-PAGE analysis of protein profile comparing 1) raw shrimp extract sample (R) and 2) pulsed light treated shrimp extract samples, with times of 2 min, 4 min, 5 min, 6 min, and 8 min. 15 uL was added to each well with concentrations of 1:50 for the R and 1:30 for the other samples. Molecular weight marker (M) is shown on the left. Tropomyosin is pointed as 37 kDa.
Western Blot for Protein Extracts
In the Western Blot analysis (Figure 6-2), it can be seen that there is a notable
decrease in IgE binding to tropomyosin following pulsed light treatment, which is
indicated by the reduced black intensity of the bands. As expected, the boiling heat
37kD

58
treatment did not appear to affect tropomyosin IgE immunoreactivity. For the boiled
sample, IgE binding was similar to the raw sample (control). However, IgE binding to
tropomyosin was reduced in pulsed light treated samples as compared to the control
and boiled sample. The densimetric analysis for the protein extract samples is provided
in Error! Reference source not found.Table 6-1. ANOVA was applied for stastical
analysis. Results showed the significant reduction at 2min treatment compared to the
control.
Furthermore,the reduction of the bands density and IgE binding seen in the pulsed
light treated samples were not simply due to hydrothermal effects. Other changes such
as photo-chemical and photo-physical changes may also have caused protein property
variation. Pulsed light energy can cause protein modifications including protein
fragmentation, denaturation, or intra- or inter-molecular protein cross-linkage.
Fragmented protein sections that are smaller than the limit of the SDS-PAGE gel may
travel through the acrylamide pores more quickly than other protein molecules. On the
other end, those cross-linked proteins that are much larger than the native proteins can
be held on the top the gel, which means that they cannot run down the gel during gel
electrophoresis. This part of the protein cannot be detected in both the SDS-PAGE and
the Western blot. In addition, although this is not the case here, covalent proteins
formed by intramolecular crosslinking can migrate through polyacrylamide gels with
difficulty. Protein bands corresponding to modified proteins can cause a smear on the
Western blot analysis (Taheri-Kafrani et al. 2009). This indicates that the smearing of
allergens is formed because of the Maillard reaction and other non-enzymatic browning

59
reactions. However, these reactions can also play a role in reducing IgE binding
reactivity.
Such reactions like the Maillard reaction, which is a complex reaction between
carbohydrates and proteins, can cause the modification of these proteins so that upon
digestion, the IgE binding epitopes are not accessible or available to the antibodies. The
effects of the Maillard reaction appear to be dependent on the sample and the amount
and type of reducing sugars present. Furthermore, in shrimp, the concentration of
reducing sugars and amino acids are different among the various species and can
change in response to climate. For instance, the concentration of reducing sugars and
amino acids can increase during cold seasons (Karanova and Andreev 2010).
Subsequently, other non-enzymatic browning reactions can also be accelerated by
the increases in temperature with an extended pulsed light treatment. Thus,
modification of proteins via non-enzymatic browning could also explain the effect of
pulsed light on shrimp allergen IgE binding activity. In one study (Taheri-Kafrani et al.
2009), it was demonstrated that this phenomenon can cause smearing of modified milk
allergen reactivity in Western blot. Moreover, other previous studies also revealed that
the Maillard reaction in roasted peanuts and pulsed light treated peanuts could increase
the IgE immunoreactivity (Chung et al. 2008; Maleki and Hortense 2002).
Figure 6-2. Western blot analysis of protein extract samples including 1) raw sample (R) 2) boiled sample (B) 3) pulsed light treated sample with time points of 2 min, 4 min, 5 min, 6 min, and 8 min.

60
Table 6-1. Densimetric analysis of Western blot samples for protein extract from ImageJ 1.44 software (NIH).
Sample Mean Statistical Comparison
R 11141.9 A
B 7519.518 B
2 min 4225.18 C
4 min 3406.558 CD
5 min 2541.376 CDE
6 min 1691.42 DE
8 min 1167.305 E
Samples include 1) raw samples (R) 2) boiled samples (B), and 3) pulsed light treated sample with time points of 2 min, 4 min, 5 min, 6 min, and 8 min. Samples with the same letter are not significantly different (p ≤ 0.05).
Indirect ELISA for Protein Extracts
ELISA is one type of immunoassay that can be used to test single proteins or total
proteins in a sample, depending on the antibodies employed. To describe the technique
briefly, proteins are adsorbed on a surface of polystyrene 96-well plate and detected
with the appropriate antibodies (Wachholz et al. 2005). The limitation is that in some
cases, hydrophobic interactions, which are the main force that cause protein adhesion
to the plate, can interfere with or mask conformational epitopes of allergen proteins.
Nonetheless, these in vitro tests are more reliable than other tests and are commonly
used. In this experiment, indirect ELISA was applied to determine the reactivity of the
protein extracts.
The results from the ELISA (Figure 6-3) supported the Western blot analysis,
illustrating a decrease in IgE binding to pulsed light treated samples as compared to the
boiled and raw samples. Total reductions in IgE binding were likely explained by
changes in tropomyosin as seen in the Western blot. The boiled sample showed a
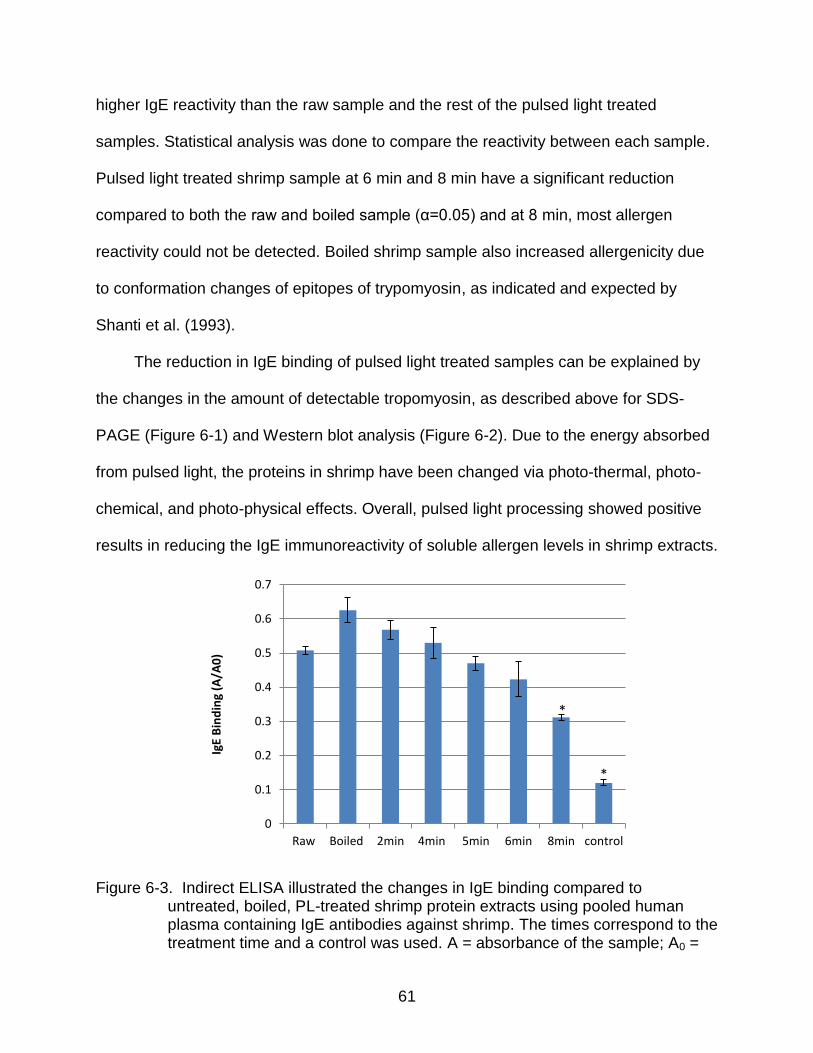
61
higher IgE reactivity than the raw sample and the rest of the pulsed light treated
samples. Statistical analysis was done to compare the reactivity between each sample.
Pulsed light treated shrimp sample at 6 min and 8 min have a significant reduction
compared to both the raw and boiled sample (α=0.05) and at 8 min, most allergen
reactivity could not be detected. Boiled shrimp sample also increased allergenicity due
to conformation changes of epitopes of trypomyosin, as indicated and expected by
Shanti et al. (1993).
The reduction in IgE binding of pulsed light treated samples can be explained by
the changes in the amount of detectable tropomyosin, as described above for SDS-
PAGE (Figure 6-1) and Western blot analysis (Figure 6-2). Due to the energy absorbed
from pulsed light, the proteins in shrimp have been changed via photo-thermal, photo-
chemical, and photo-physical effects. Overall, pulsed light processing showed positive
results in reducing the IgE immunoreactivity of soluble allergen levels in shrimp extracts.
Figure 6-3. Indirect ELISA illustrated the changes in IgE binding compared to untreated, boiled, PL-treated shrimp protein extracts using pooled human plasma containing IgE antibodies against shrimp. The times correspond to the treatment time and a control was used. A = absorbance of the sample; A0 =
0
0.1
0.2
0.3
0.4
0.5
0.6
0.7
Raw Boiled 2min 4min 5min 6min 8min control
IgE
Bin
din
g (A
/A0
)
*
*

62
absorbance of untreated sample. Data are expressed as mean ± SEM (n = 5). Results are relative values, normalized to the untreated sample; untreated is standardized and set to 1. Values that are significantly different are analyze by statistical level α = 0.05.
Whole Shrimp
Despite the fact that tropomyosin properties can be changed in shrimp extracts
after pulsed light treatment, further evidence was needed to evaluate pulsed light effects
on whole shrimp. The results from treatment of the whole shrimp are shown below. This
includes the SDS-PAGE, Western blot, and ELISA, each of which is shown in Figures 6-
1 to 6-3, respectively.
SDS-PAGE of Whole Shrimp
For the SDS-PAGE (Figure 6-4), there are a total of 15 bands. From left to right,
these are the standard marker, the raw samples, the boiled samples, and the treated
samples that range from 6 min, 8 min, 10 min, 12 min, and 15 min. More specifically,
the treated samples time points correspond to the treatment of one side of the whole
shrimp, so in effect, the total time point for each sample is double. For example, the 6
min sample was treated for a total of 12 min and the 15 min whole shrimp sample was
treated for a total of 30 min.
The bands for tropomyosin are marked and reflect protein bands found in the 34 –
38 kDA range. The intensity of the band visibility coincides with the effectiveness of
pulsed light to alter the structural properties of tropomyosin. Darker bands indicate
higher concentration levels of tropomyosin found in shrimp whereas the lighter bands
suggest that the levels have decreased.
As shown in the SDS-PAGE, the raw and boiled bands give the reference point for
which to compare the pulsed light treated samples. It is seen between the raw and

63
boiled samples that the bands for the boiled sample are much more prevalent. The
reason for the darker band intensity may be due to the conformational changes of
tropomyosin after boiling (Shanti et al. 1993). The raw sample may contain tropomyosin
in a native state and after boiling, the protein and its epitopes are more accessible. In
effect, the protein would form the nutritional and structural value of consumed whole
shrimp. Shrimp is high in protein content and since most of the consumed shrimp is
muscle, it would be expected to contain a high level of tropomyosin in the meat.
With respect to the treated samples, it can be seen that the tropomyosin band is
present up until the 15 min mark. Absolutely no effect can be observed for the 6 min to
12 min samples. The tropomyosin band for these treated samples resembles that of the
boiled sample, which as stated earlier, has a higher intensity than the raw sample.
Pulsed light technology, which contains a photo-thermal spectral component, may be
responsible for the heating that may have occurred during treatment from 6 min to 12
min. For the same reasons as stated earlier, this could have caused conformational
changes in the protein. As for the 15 min sample, it does show a reduced intensity
indicating that the allergenic protein concentration is lower. It would seem promising, but
the reality is that the shrimp sample itself is burnt and shows discoloration due to the
formation of white spots. Rather, this reduced intensity can be attributed to browning
reactions such as the Maillard reaction. As described in the shrimp extract results, the
Maillard reaction and other non-enzymatic reactions can cause browning. This is
evident in the 15 min treatment sample and can be seen in Figure 6-13. The sensory
remarks for each of these shrimp samples are described in the sensory remarks
section.

64
Figure 6-4. SDS-PAGE analysis of protein profile of whole shrimp samples comparing 1) raw sample (R) 2) boiled sample, and 3) pulsed light treated whole shrimp samples, with times of 6 min, 8 min, 10 min, 12 min, and 15 min. These times correspond to pulsed light treatment on one side of whole shrimp, with their being an application of treatment of both sides. 15 uL was added to each well with concentrations of 1:50 for the R and 1:10 for the other samples. Molecular weight marker (M) is shown on the left. Tropomyosin is pointed as 37 kDa.
Western Blot for Whole Shrimp
The results for the Western blot (Figure 6-5) for whole shrimp samples are shown
above. From left to right, the data points are in duplicates. These are raw, boiled, 6 min,
8 min, 10 min, 12 min, and 15 min samples. Once again, these points reflect pulsed
light treatment to a single side of the whole shrimp. The total time for each shrimp
sample is double the time shown in Figure 6-5. Furthermore, as mentioned previously,
the visibility of the bands represents the effectiveness of pulsed light to reduce the level
of tropomyosin. Only tropomyosin bands will be shown in the Western blot since the
purpose of Western blot is to separate the proteins in a sample during gel
electrophoresis and then isolate the protein of interest using antibodies.
Std Raw Boiled 6 min 8min 10min 12min 15min
37kD
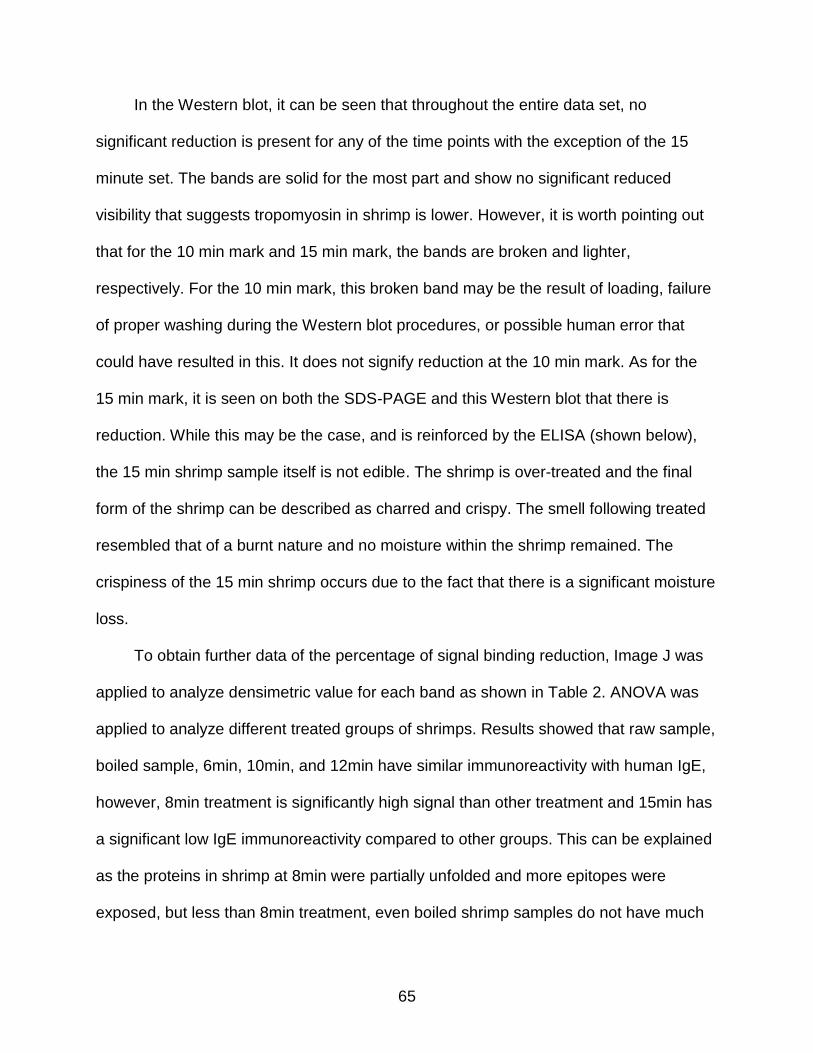
65
In the Western blot, it can be seen that throughout the entire data set, no
significant reduction is present for any of the time points with the exception of the 15
minute set. The bands are solid for the most part and show no significant reduced
visibility that suggests tropomyosin in shrimp is lower. However, it is worth pointing out
that for the 10 min mark and 15 min mark, the bands are broken and lighter,
respectively. For the 10 min mark, this broken band may be the result of loading, failure
of proper washing during the Western blot procedures, or possible human error that
could have resulted in this. It does not signify reduction at the 10 min mark. As for the
15 min mark, it is seen on both the SDS-PAGE and this Western blot that there is
reduction. While this may be the case, and is reinforced by the ELISA (shown below),
the 15 min shrimp sample itself is not edible. The shrimp is over-treated and the final
form of the shrimp can be described as charred and crispy. The smell following treated
resembled that of a burnt nature and no moisture within the shrimp remained. The
crispiness of the 15 min shrimp occurs due to the fact that there is a significant moisture
loss.
To obtain further data of the percentage of signal binding reduction, Image J was
applied to analyze densimetric value for each band as shown in Table 2. ANOVA was
applied to analyze different treated groups of shrimps. Results showed that raw sample,
boiled sample, 6min, 10min, and 12min have similar immunoreactivity with human IgE,
however, 8min treatment is significantly high signal than other treatment and 15min has
a significant low IgE immunoreactivity compared to other groups. This can be explained
as the proteins in shrimp at 8min were partially unfolded and more epitopes were
exposed, but less than 8min treatment, even boiled shrimp samples do not have much
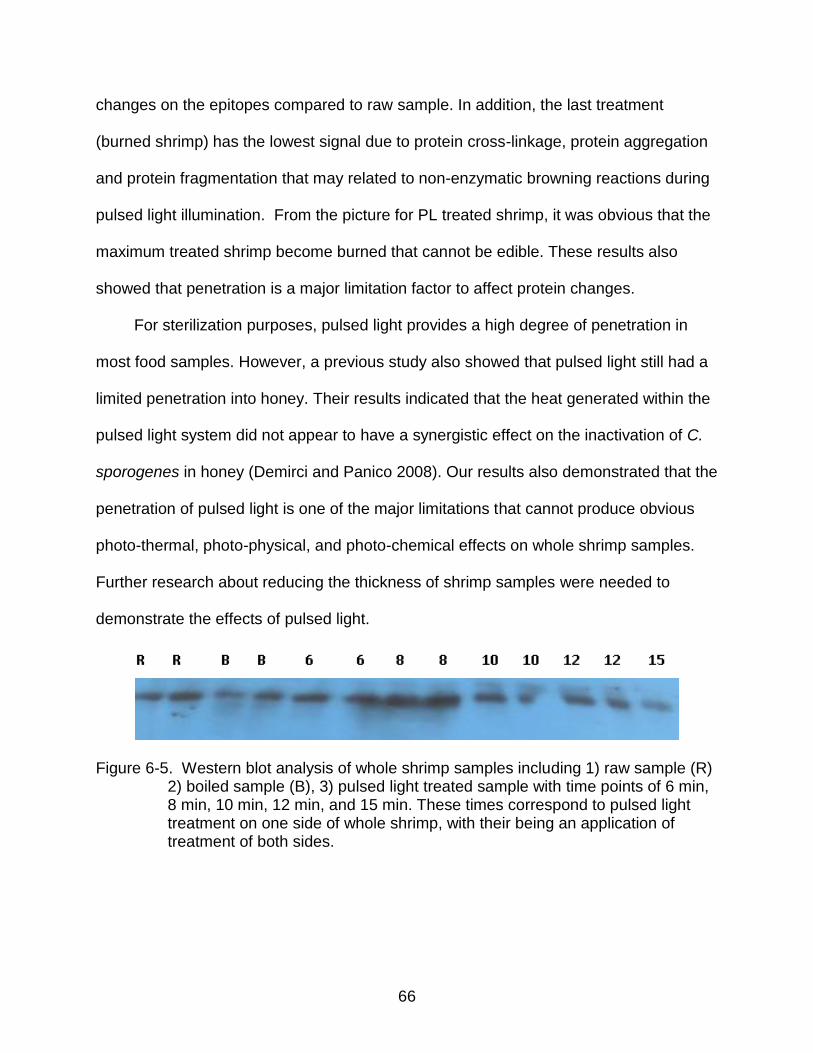
66
changes on the epitopes compared to raw sample. In addition, the last treatment
(burned shrimp) has the lowest signal due to protein cross-linkage, protein aggregation
and protein fragmentation that may related to non-enzymatic browning reactions during
pulsed light illumination. From the picture for PL treated shrimp, it was obvious that the
maximum treated shrimp become burned that cannot be edible. These results also
showed that penetration is a major limitation factor to affect protein changes.
For sterilization purposes, pulsed light provides a high degree of penetration in
most food samples. However, a previous study also showed that pulsed light still had a
limited penetration into honey. Their results indicated that the heat generated within the
pulsed light system did not appear to have a synergistic effect on the inactivation of C.
sporogenes in honey (Demirci and Panico 2008). Our results also demonstrated that the
penetration of pulsed light is one of the major limitations that cannot produce obvious
photo-thermal, photo-physical, and photo-chemical effects on whole shrimp samples.
Further research about reducing the thickness of shrimp samples were needed to
demonstrate the effects of pulsed light.
Figure 6-5. Western blot analysis of whole shrimp samples including 1) raw sample (R)
2) boiled sample (B), 3) pulsed light treated sample with time points of 6 min, 8 min, 10 min, 12 min, and 15 min. These times correspond to pulsed light treatment on one side of whole shrimp, with their being an application of treatment of both sides.
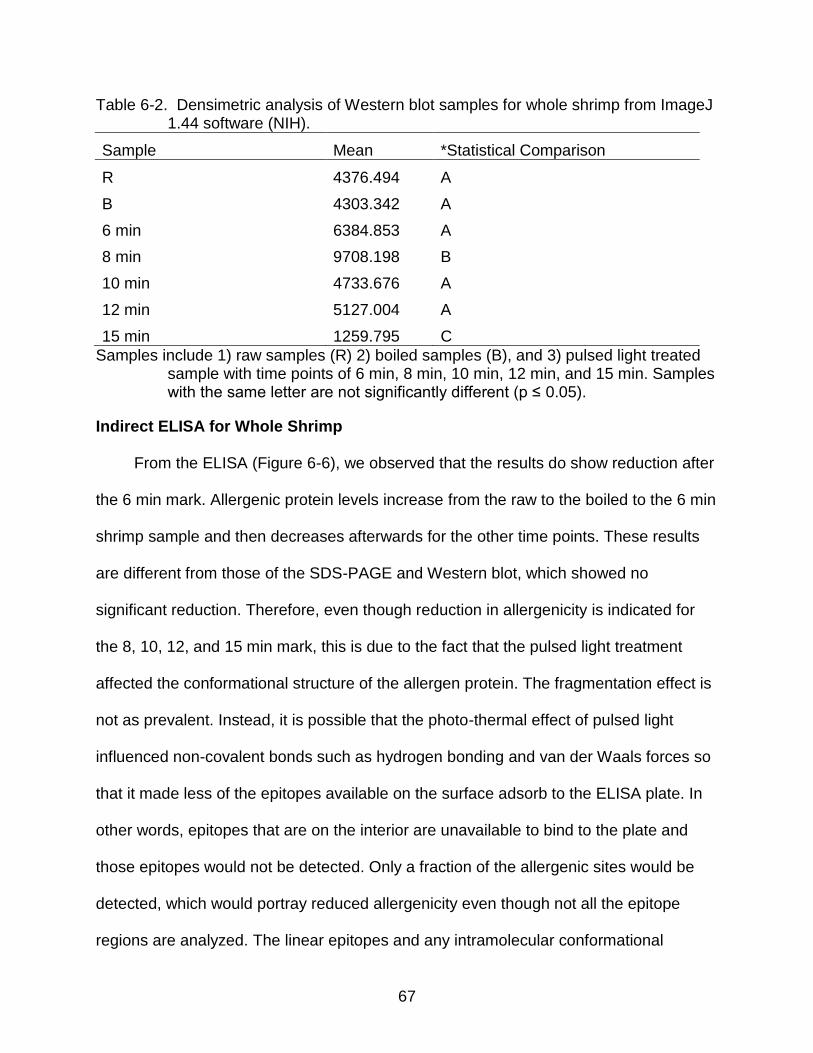
67
Table 6-2. Densimetric analysis of Western blot samples for whole shrimp from ImageJ 1.44 software (NIH).
Sample Mean *Statistical Comparison
R 4376.494 A
B 4303.342 A
6 min 6384.853 A
8 min 9708.198 B
10 min 4733.676 A
12 min 5127.004 A
15 min 1259.795 C
Samples include 1) raw samples (R) 2) boiled samples (B), and 3) pulsed light treated sample with time points of 6 min, 8 min, 10 min, 12 min, and 15 min. Samples with the same letter are not significantly different (p ≤ 0.05).
Indirect ELISA for Whole Shrimp
From the ELISA (Figure 6-6), we observed that the results do show reduction after
the 6 min mark. Allergenic protein levels increase from the raw to the boiled to the 6 min
shrimp sample and then decreases afterwards for the other time points. These results
are different from those of the SDS-PAGE and Western blot, which showed no
significant reduction. Therefore, even though reduction in allergenicity is indicated for
the 8, 10, 12, and 15 min mark, this is due to the fact that the pulsed light treatment
affected the conformational structure of the allergen protein. The fragmentation effect is
not as prevalent. Instead, it is possible that the photo-thermal effect of pulsed light
influenced non-covalent bonds such as hydrogen bonding and van der Waals forces so
that it made less of the epitopes available on the surface adsorb to the ELISA plate. In
other words, epitopes that are on the interior are unavailable to bind to the plate and
those epitopes would not be detected. Only a fraction of the allergenic sites would be
detected, which would portray reduced allergenicity even though not all the epitope
regions are analyzed. The linear epitopes and any intramolecular conformational
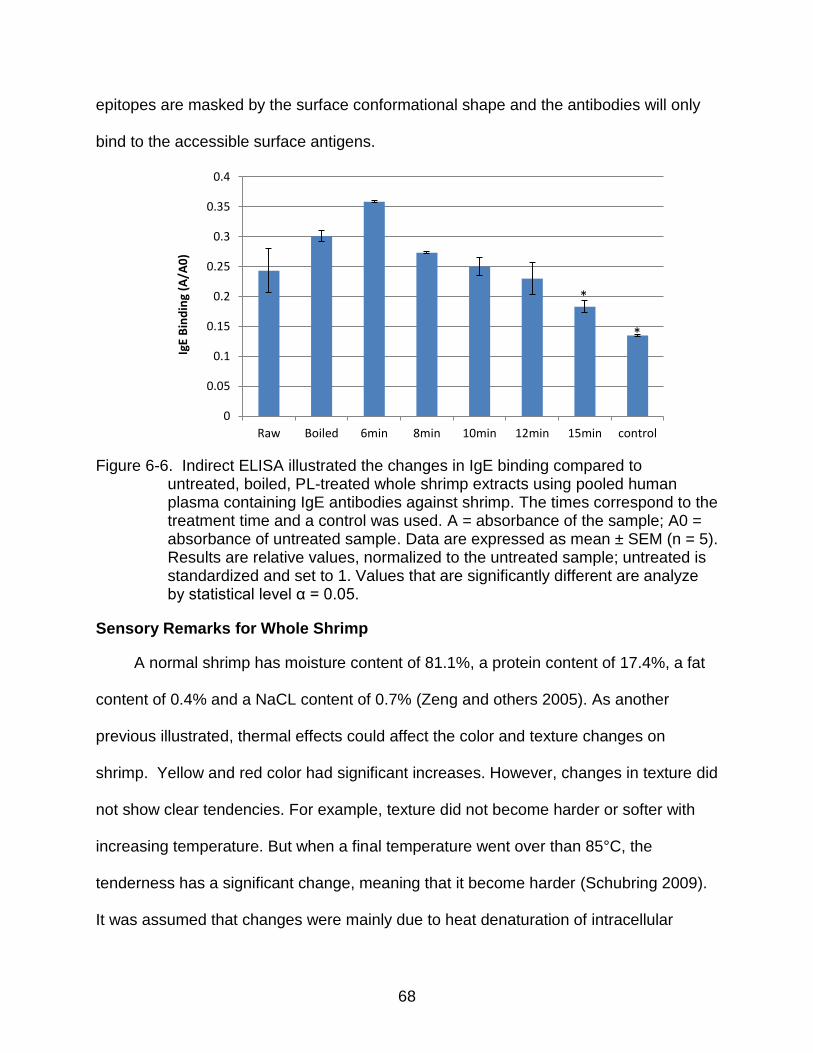
68
epitopes are masked by the surface conformational shape and the antibodies will only
bind to the accessible surface antigens.
Figure 6-6. Indirect ELISA illustrated the changes in IgE binding compared to
untreated, boiled, PL-treated whole shrimp extracts using pooled human plasma containing IgE antibodies against shrimp. The times correspond to the treatment time and a control was used. A = absorbance of the sample; A0 = absorbance of untreated sample. Data are expressed as mean ± SEM (n = 5). Results are relative values, normalized to the untreated sample; untreated is standardized and set to 1. Values that are significantly different are analyze by statistical level α = 0.05.
Sensory Remarks for Whole Shrimp
A normal shrimp has moisture content of 81.1%, a protein content of 17.4%, a fat
content of 0.4% and a NaCL content of 0.7% (Zeng and others 2005). As another
previous illustrated, thermal effects could affect the color and texture changes on
shrimp. Yellow and red color had significant increases. However, changes in texture did
not show clear tendencies. For example, texture did not become harder or softer with
increasing temperature. But when a final temperature went over than 85°C, the
tenderness has a significant change, meaning that it become harder (Schubring 2009).
It was assumed that changes were mainly due to heat denaturation of intracellular
0
0.05
0.1
0.15
0.2
0.25
0.3
0.35
0.4
Raw Boiled 6min 8min 10min 12min 15min control
IgE
Bin
din
g (A
/A0
)
*
*

69
proteins, which developed gradually from 30°C to higher temperature. Above 70°C, the
denaturation occurred so intensely that the muscle meat shows a heavy shrinkage
(Mizuta and others 1999).
Traditional roasted shrimps are specially used as an ingredient for tempura, sushi
and rice snacks. Roasted shrimp emanates an aroma which is strong and pleasant to
the Japanese consumer. Pulsed light as a novel processing technology has a strong
thermal effects as treatment time increases and thus this technology can be considered
as a parallel to traditional roasting technology. As both of these two technologies
produce the similar sensory properties on shrimp, special aromas are produced due to
the Maillard reaction during the process (Tachihara and others 2004). The color
changes on the surface are always caused by a non-enzymatic browning reaction or
Maillard reaction. The acceptability of pulsed treated shrimp at each time point needs to
be optimized.
The observations from our experiments are as follows. After the first treatment,
there is a good color development for the 6-min shrimp. The shrimp looks good, but has
a repulsive smell. The top is dry, but moist on the bottom and center. Following the
second treatment, the underside shows some burnt orange skin. The smell is still the
same. However, the feel is soft and squishy and some darker color has developed.
The first treatment for the 8 min shrimp gives off a smell that is repulsive, but less
than the first treatment for the 6 min shrimp. There is a squishy feel and the shrimp
seems edible. The underside is more burnt than the top. The surface is not as moist.
Next, the second treatment gives a shrimp where there is a reduction in size, a foul

70
smell, and hardness of the shrimp with some moisture in the middle. The tail appears
crunchy and the body is hard on the surface with some softness inside.
For the 10-min shrimp sample, the top is white and pink on the bottom. There is a
faint smell that is not foul, but shrimp-like. The shrimp also looks more treated and
seems edible. Coincidently, the shrimp treated time for the pulsed light treatment is the
same as that for a 10 min boiling time for shrimp. It feels soft and squishy. These
observations were for the first treatment. For the second treatment, giving a total time of
20 min, changes in shrimp were that the underside is more burnt than before and the
top is pink-like with a white surface. The smell also is more foul. The tail is crunchy and
appears that it will break under pressure and there is some moisture in the middle.
Moving on to the next time point, the 12 min shrimp after the first treatment has a
white color on the top and the underside is burnt orange. The smell is foul, but not so
strong. Also, the shrimp feels less soft than the shorter time treated shrimps for the first
treatment. After the second treatment, there are some white spots, size reduction is
present, and the center is moist. Burnt color is visible on both sides, the smell is faint,
and the shrimp feels crunchy on the surface.
For the last sample for 15 min shrimp, the first treatment gives an underside that
is burnt orange. The smell also is the most foul here. The skin is flaky and there is a
softness feel in the center and also moisture in the middle. On the top, the color is white
with some flour spots. The shrimp is not edible at all and has been destroyed by the
pulsed light treatment.

71
Figure 6-7. Raw shrimp sample was taken as a control. This raw sample was applied in following experiments in SDS-PAGE, Western blot, and indirect ELISA.
Figure 6-8. Boiled shrimp sample was considered as another control. This sample was prepared with a raw sample that was boiled in distilled water for 10 min.
Figure 6-9. Whole shrimp sample was treated by pulsed light for 6 min on both sides for a total treatment of 12 min.

72
Figure 6-10. Whole shrimp sample was treated by pulsed light for 8 min on both sides for a total treatment of 16 min.
Figure 6-11. Whole shrimp sample was treated by pulsed light for 10 min on both sides for a total treatment of 20 min.
Figure 6-12. Whole shrimp sample was treated by pulsed light for 12 min on both sides for a total treatment of 24 min.

73
Figure 6-13. Whole shrimp sample was treated by pulsed light for 15 min on both sides for a total treatment of 30 min.
Half Cut Shrimp
SDS-PAGE of Half Cut Shrimp
For the half cut shrimp SDS-PAGE (Figure 6-14), the bands are loaded, in order
from left to right, with the standard marker first, then the raw and boiled shrimp samples
second, and finally followed by 6, 8, 10, 12, and 15 min shrimp samples. With the
exception of the standard marker, all other samples were loaded in duplicates. The
times are also parallel to that for whole shrimp samples. Maximum treatment time for
the treated samples is 12, 16, 20, 24, and 30 min, respectively.
As can be seen by the area marked as 34 - 38 kDA, to represent the tropomyosin
protein again, it can be noticed that the visibility of the bands continues to remain the
same. The boiled protein shows greater intensity as a result of cooking shrimp.
However, the other shrimp samples also show an increased intensity up until the 10 min
sample, after which a significant reduction can be observed at the 15 min mark. All this
suggests that the concentration of tropomyosin at that time point decreases. This is
exactly the same trend for the whole shrimp sample. At longer duration times, the band
for the 15 min tropomyosin decreases. However, like the whole shrimp sample, the

74
wholesomeness of the shrimp is, without doubt, inedible. The entire sample is charred
and burnt. It cannot be consumed and is covered in flour spots. Therefore, the possible
explanation for the reduction of the tropomyosin protein is that the high treatment
“overcooked” and “over-treated” the sample. This demonstrates the potential of PL
heating, but also the limitation that exists of PL penetration not being deep enough to
destroy the protein without destroying the sample first. And despite slicing the shrimp in
half, the sample itself is still too thick because it has similar results with the whole
shrimp sample. The same reasons for whole shrimp samples are cited to explain the
same outcome pattern in half shrimp, in that PL penetration may not be deep enough
and the role of the Maillard reaction and non-enzymatic reactions in causing shrimp
browning.
Figure 6-14. SDS-PAGE analysis of protein profile of half cut shrimp comparing 1) raw shrimp (R), 2) Boiled shrimp (B), and 3) pulsed light treated shrimp samples, with times of 6 min, 8 min, 10 min, 12 min, and 15 min. These times correspond to pulsed light treatment on one side of whole shrimp, with their being an application of treatment of both sides. 15 uL was added to each well with concentrations of 1:50 for the R and 1:10 for the other samples. Molecular weight marker (Std) is shown on the left. Tropomyosin is pointed as 37 kDa.
37kD

75
Western Blot for Half Cut Shrimp
The results for the Western blot analysis (Figure 6-14) coincide with the SDS-
PAGE (Figure 6-13). The bands are loaded, from left to right: standard marker, raw (R),
boiled (B), 6, 8, 10, 12, and 15 min. While the SDS-PAGE showed reduction at the 15
min point, this is not visible in the Western blot. Densimetric analysis is shown in Error!
Reference source not found.. ANOVA was applied for stastical analysis. For all the
data points, no reduction is present. Since we did not see any significant reduction in
whole shrimp, this half shrimp study was based on previous whole shrimp to investigate
the effects of pulsed light. Results showed that, the penetration was still a limitation
factor for shrimp sample. No indirect ELISA was done for this experiment as the
purpose of the half cut shrimp was to assess further treatment of pulsed light on a
thinner sample. More optimizations of distance and time were recommended for further
study, such as choosing lower distances. For example, distances of 7 cm or 5 cm can
be used. This would bring the shrimp samples closer to the pulsed light source. In
addition, times could also have to be evaluated relative to these distance changes.
These time changes can be similar to the ones used or different times.
Figure 6-15. Western blot analysis of half cut shrimp samples including 1) raw sample
(R), 2) boiled sample (B), and 3) pulsed light treated sample with time points of 6 min, 8 min, 10 min, 12 min, and 15 min. These times correspond to pulsed light treatment on one side of whole shrimp, with their being an application of treatment of both sides.

76
Table 6-3. Densimetric analysis of Western blot samples for half cut shrimp from ImageJ 1.44 software (NIH).
Sample Mean Statistical Comparison
R 8331.258 A
B 9312.785 A
6 min 9713.371 A
8 min 6046.371 A
10 min 9530.451 A
12 min 10123.87 A
15 min 9535.167 A
Samples include 1) raw samples (R) 2) boiled samples (B), and 3) pulsed light treated sample with time points of 6 min, 8 min, 10 min, 12 min, and 15 min. Samples with the same letter are not significantly different (p ≤ 0.05).
Sensory Remarks for Half Cut Shrimp
Sensory observations were also done for the half cut shrimp. For the 6 min shrimp,
treatment of the first half showed that the shrimp is dry on the top and the underside is
still moist. The shrimp is kind of soft and has a foul-like smell. After the second
treatment, it is dry on both sides, still soft-like, and the foul smell of the shrimp has
increased. The top is burnt and some of the skin sticks to the plate. The color is faded
white with orange burnt spots and orange skin lines.
The 8 min shrimp shows burnt sides on both sides of the shrimp, it is squishy,
and the smell is not strong. At the end of the second half of the treatment, the shrimp is
still soft and squishy, burnt on both sides, and there is an internal pink color visible on
some areas while the top of the shrimp is faded white. A huge size reduction is also
visible and the smell is not as strong.
The first treatment for the 10 min shrimp gives off a foul shrimp smell and size
reduction is present. The shrimp feels somewhere between soft and hard and the
bottom shows some moisture. The second treatment gives more size reduction and the
loss of some parts which were hard. The shrimp smell is also not as strong so it is
77
tolerable. There is some pink on the inside at the bottom and the color is faded white.
There are also some flour spots that are visible and the shrimp is hard with crunchy
spots.
Next, the 12 min shrimp sample was burnt on the bottom following the first
treatment. The surface is dry and the feel is soft with a faint shrimp smell. Although the
faint smell is not a repulsive smell, in this instance the smell resembles more of raw
shrimp rather than spoiled shrimp. Following the second treatment, several parts have
been burnt and are charred. The shrimp has become stiffer. Parts of the shrimp have
folded and some parts stick to the tray. The smell is the same as before although it
lingers more as an after-smell.
Lastly, the 15 min shrimp after the first treatment shows many changes. There
was size reduction, folding of the shrimp, and the shrimp was burnt on some parts. The
smell was very, very foul. As for the feel, it was soft, but the texture of the surface was
very dry and rough-like. This would be the expected results from the longer treatment of
the pulsed light. Specifically, the photothermal effect of pulsed light would be
responsible for the dryness and moisture loss that is present. The color was faded with
some visible pink on the bottom underside. The second treatment continued this trend.
The end shrimp is charred on some parts and other parts show an orange crispiness.
The smell resembles a burnt sample. A huge size reduction can be seen along with the
addition of shrimp folding inward. White flour spots have also formed. In addition, some
parts can also be seen to have fallen off on the tray. These can be due either during the
flipping of the shrimp sample or from the fragileness of the burnt and crispy sample.

78
Figure 6-16. Raw shrimp sample for the half cut shrimp sample. This sample was used in SDS-PAGE and Western blot.
Figure 6-17. Half cut shrimp was treated by pulsed light for 6 min on both sides for a total treatment of 12 min.
Figure 6-18. Half cut shrimp was treated by pulsed light for 8 min on both sides for a total treatment of 16 min.

79
Figure 6-19. Half cut shrimp sample was treated by pulsed light for 10 min on both sides for a total treatment of 20 min.
Figure 6-20. Half cut shrimp sample was treated by pulsed light for 12 min on both sides for a total treatment of 24 min.
Figure 6-21. Half cut shrimp sample was treated by pulsed light for 15 min on both sides for a total treatment of 30 min.

80
Other Remarks
Optimization of Pulsed Light Illumination
Based on a previous study of the effect of pulsed light illumination on shrimp
allergen protein (36kD) (Shriver et al. 2011), this study attempted to establish a series of
proper durations and a proper distance for shrimp extracts, whole shrimp samples and
half cut samples. In the previous study, researchers investigated durations at 0
(control), 1, 2, 3, 4, 5, and 6 min. It was found that the reduction of IgE immunoreactivity
of tropomyosin can be clearly found at 4 to 6 min. This study continued to investigate
extended durations on shrimp extract, but by using a crude protein extract in its native
form. The parameters selected were 3 pulses / s for the PL treatment and a distance of
10 cm from the light source. The maximum treatment time was selected at 8 min.
Changes in the reactivity of tropomyosin at each time point were detected via
Western blot analysis. Figure 6-3 indicates that IgE binding to tropomyosin was reduced
from 4 min to 8 min. Moreover, at the 8 min mark, the signal of IgE reactivity was hardly
detected.
Temperature and Moisture Change
As a previous study reported (Keklik and others 2009), the temperature can
increase significantly as treatment time increases. The surface temperatures of the
shrimp extracts can attain measurements up to 80°C. It is worth mentioning that
instantaneous temperatures may be higher during the treatment, but we did not detect
this kind of temperature. Temperature measurements are given in Table 6-3 and Table
6-4 below. Furthermore, based on the previous report, it was shown that color changes
of shrimp could be detected as high as 120oC, indicating that temperature changes

81
were present. From this, we can conclude that the instantaneous temperatures of the
treated shrimp could be higher than 120oC (Keklik et al. 2009).
Moisture loss was higher in the pulsed light treated samples because the samples
were not enclosed during the pulsed light treatment and heat evaporation was also
present. (Chung et al. 2008) also indicated that around 40% volume reductions can be
found after pulsed light treatments. In our experiments, we can see moisture losses that
exceed 40% and go up to roughly 76%. More moisture loss can be see in the thinner
samples and these can be due to the pulsed light being able to have more of a surface
area to treat and penetrating more on the surface. A closed system may be beneficial
for preventing moisture loss. However, the pulsed light penetration into the sample
might be compromised. Another solution would be to fit the pulsed light equipment with
a cooling system to absorb the heat produced during the whole treatment. This
phenomenon was also found in extended treatment of shrimp samples. Moisture loss
can be achieved to 50% of total sample for the longer treated samples. The moisture
loss is given in Table 6-5 and Table 6-6.
Table 6-4. Temperature measurements for whole shrimp samples. Each observation is a mean of three temperatures and the standard deviation.
Sample Initial Temperature
Mean±SD First Treatment
Mean±SD Second Treatment
Mean±SD
Raw 20.57 6 Min 20.67±0.60 56.63±7.07 57.13±5.52
8 Min 19.13±1.30 44.27±0.85 62.17±3.36
10 Min 19.63±0.55 71.50±1.57 46.83±5.09
12 Min 20.20±0.78 60.70±0.56 35.53±0.95
15 Min 19.83±0.64 54.03±4.09 44.37±14.91
The samples include 1) raw samples (R), and 2) pulsed light treated samples with time points of 6 min, 8 min, 10 min, 12 min, and 15 min.

82
Table 6-5. Temperature measurements for half cut samples. Each observation is a mean of three temperatures and the standard deviation.
Sample Initial Temperature
Mean±SD First Treatment
Mean±SD Second Treatment
Mean±SD
Raw 20.13±0.21 6 Min 20.17±0.12 45.67±9.25 60.90±2.55
8 Min 20.10±0.44 44.33±4.74 51.50±5.29
10 Min 19.97±1.17 54.63±10.00 48.10±0.76
12 Min 20.83±0.51 83.13±4.37 57.30±2.61
15 Min 20.60±0.70 71.20±1.18 82.20±0.17
The samples include 1) raw samples (R), 2) pulsed light treated sample with time points of 6 min, 8 min, 10 min, 12 min, and 15 min. Table 6-6. Representative moisture loss measurements for whole shrimp samples.
Weight is measured in grams (g).
Treatment Initial Weight (g) Final Weight (g) Percent Loss (%)
R 18.89
0
B 21.68 16.48 23.99
6 min 20.49 14.00 31.67
8 min 19.71 11.74 40.46
10 min 18.96 10.61 44.04
12 min 20.68 9.28 55.13
15 min 20.51 7.44 63.71
The samples include 1) raw samples (R) 2) boiled samples (B), and 3) pulsed light treated sample with time points of 6 min, 8 min, 10 min, 12 min, and 15 min. Table 6-7. Representative moisture loss measurements for half cut shrimp samples.
Weight is measured in grams (g).
Treatment Initial Weight (g) Final Weight (g) Percent Loss (%)
R 18.41
0
B 22.95 16.96 26.11
6 min 20.62 12.43 39.75
8 min 21.32 10.99 48.45
10 min 20.34 8.48 58.34
12 min 20.74 7.82 62.30
15 min 18.87 4.52 76.03
The samples include 1) raw samples (R) 2) boiled samples (B), and 3) pulsed light treated sample with time points of 6 min, 8 min, 10 min, 12 min, and 15 min.

83
Antigenicity Variations Caused by Other Processing Methods on Shrimp
Tropomyosin is considered a thermal stable protein in shrimp. However, previous
studies reported that shrimp allergen was liable to enzyme hydrolysis (Shimakura and
others 2005). High intensity ultrasound is also an effective processing method that could
significantly reduce the allergen reactivity. Immunoblot and ELISA results showed
decreased allergenicity in ultrasound treated shrimp samples (Zhenxing et al. 2006).
Furthermore, the same group also demonstrated the allergenic potency was greatly
lowered after a combined irradiation and heat treatment as compared to the raw sample
(Zhenxing et al. 2007a). In contrast, it is interesting to note that allergenicity of irradiated
shrimp was increased up to 10 kGy and then decreased after 15 kGy (Zhenxing et al.
2007b). Combined with our research, pulsed light could significantly reduce the
allergenicity of tropomyosin in shrimp extracts after a 4 min treatment under a 10 cm
distance from the lamp. However, it did not show the obvious reduction in whole shrimp
and half cut shrimp. Penetration of pulsed light on the surface of shrimp samples was
considered as one major reason to prevent further protein inactivation. It is obvious from
Figure 6-13 (15 min whole shrimp) and Figure 6-21 (15 min half cut shrimp) that
shrimps were burned after extended treatment, especially on the surface, which has a
roasted orange-red color. The smell of the pulsed light treated shrimps was so strong
that it had similar smells with that of traditional roasted shrimps.
The major allergen of shellfish, tropomyosin, has a molecular weight estimated to
be from 34 – 38 kDa. A number of IgE binding epitopes have been identified in this
protein molecule, though they may vary from one shrimp species to another. Processing
by cooking may destroy existing epitopes on a protein or may generate new epitopes as

84
a result of changes in the protein conformation (Maleki 2003). In a study that looked at
the effect of boiling on these epitopes, the boiling shrimp extracts showed lower IgE
binding than the raw shrimp samples. However, the IgE binding activity of tropomyosin
increased in response to longer boiling times. It was proposed that the boiled
tropomyosin may form protein-protein interactions during boiling, which may cause the
increase in allergenicity (Liu and others 2010).
Lastly, another reason that could explain pulsed light effects on the whole shrimp
and half cut shrimp and why the antigenicity did not change as much for SDS-PAGE
and Western blotting results, it may be due to the presence of other compounds. Since
shrimp is seafood high in water content, that may have caused a lower temperature
increase and therefore the structure of tropomyosin did not change enough to destroy
those conformational epitopes. The linear epitopes on the protein chain could also have
not been destroyed to achieve a reduction in allergenicity. With regard to the study on
gamma irradiation treatment on shrimp (Zhenxing et al. 2007b), the resistance of
proteins at low dosage levels to denature was suggested to be due to layers of lipids
that protect the protein from free radical damage.

85
CHAPTER 7 CONCLUSIONS
In conclusion, we discovered that the effect of PL treatment on native shrimp
protein extract, whole shrimp samples, and half cut shrimp samples could give different
results due to the physical and chemical changes that occurred at the molecular level of
proteins. While the native shrimp protein extract elicited reduced tropomyosin
antigenicity, as indicated by SDS-PAGE, Western blotting, and ELISA, the whole shrimp
and half cut shrimp did not give significant results elsewise under the current conditions
tested. Protein modification involving protein aggregation and the Maillard reaction,
along with other non-enzymatic browning reactions are suggested to play an important
role in the availability of epitope regions to the IgE antibodies. In treating whole shrimp
and half cut shrimp samples, it is suggested that linear epitopes and conformational
epitopes could be made more accessible and that the browning discoloration that
occurred in the longer treated samples could be attributed to the non-enzymatic type
reactions. PL penetration would also be a factor, as PL technology is regarded as a
surface treatment and would not be able to affect the tropomyosin protein that
comprises a good portion of the shrimp muscle.
On the other hand, for the protein extract, these same changes would give the
opposite effect. Not only does the native shrimp protein extract remove the layering
effect, in which other compounds that might protect tropomyosin from PL, it also can be
subjected to the photo-thermal and photo-chemical effects of PL to a greater extent.
Although we did not elucidate the molecular mechanisms, it is suggested that protein
modifications could have resulted in modifying the allergenic sites such that protein

86
denaturation, fragmentation, and cross-linking could have resulted in reducing binding
of antibodies to the antigens.

87
CHAPTER 8 FUTURE WORK
Regarding future work, more research would need to be done to support the
pulsed light effects on the allergen levels of the whole shrimp with respect to
optimization of distance of light from the sample and the time of treatment. A decrease
in distance is suggested to determine the effects of pulsed light on allergen changes
when the lamp source is closer. PL penetration is only on the surface and is a limitation
of the technology. It would also indicate that thinner samples, with a thickness in
probably millimeters, might give different results as a thinner sample would be used.
The half cut shrimp results were similar to the whole shrimp samples. A sample thinner
than half cut shrimp would push the boundary for new product development, as shrimp
would be prepared in a newer form. A preliminary study was done to investigate the
effect of pulsed light on ground shrimp at different volumes. The ground shrimp samples
were thinner than the half cut shrimp samples and are discussed below. Furthermore,
other future work would involve in vitro digestion research, which could also be used to
detect tropomyosin allergenicity after digestion. If a hypoallergenic food is possible, it
could be transitioned over to in vivo testing in animals and eventually humans. Sensory
testing would also have to be done to evaluate the organoleptic properties and also
whether such foods would be considered acceptable for consumers. Lastly, for human
subject studies in sensitized individuals, other early studies could focus on skin prick
tests with an extract and later studies could focus on food consumption by such
individuals.

88
CHAPTER 9 PRELIMINARY RESULTS
Following are some preliminary results that were done to simply evaluate the
application of pulsed light technology on ground shrimp samples. Ground shrimp
samples are shrimp that are prepared exactly the same way as protein extract samples
with the exclusion of the centrifuge step. The shrimp is purchased de-headed and de-
veined. After thawing in a plastic zip bag under water for 1 h, the shrimp is de-shelled
and then ground in a food processor and homogenized afterwards. The shrimp is
ground for 10 min at high speed using 0.6M KCL in 0.01M NaH2PO4 (pH of 7) buffer
and homogenized for 10 minutes with a BioSpec BioHomogenizer (Bartlesville, OK,
U.S.A.). This ground mixture is then added in different volumes to aluminum plates, 20
mL and 10 mL. The purpose of using ground shrimp was to evaluate the effects of
pulsed light on thinner samples. Whole shrimp and half cut shrimp did not show any
noticeable reduction, which is due to penetration limitation of pulsed light, and therefore
thinner samples in the form of ground shrimp were used. In another study that
evaluated shrimp allergy (Zhenxing et al. 2007b), the researchers found that irradiated
shrimp showed an increase in antigenicity at low dosages, but when dosages reached
to 10 kGy, antigenicity decreased. This was done on shrimp muscle that had been
sliced down to 2 millimeters (mm). Our whole shrimp and half cut shrimp sample
however was much thicker than 2 mm. Therefore, ground shrimp was prepared and
added in small volumes to the aluminum plates and then placed underneath the pulsed
light for treatment. 20 mL and 10 mL volumes corresponded to a thickness of 2 mm and
1 mm in the aluminum plate. The samples were treated for 8, 10, 12, and 15 min for the
20 mL sample and 8 and 15 minute for the 10 mL sample. This refers to a single

89
treatment and not treatment on both sides, as was the case for whole shrimp and half
cut shrimp. After treatment, the treated samples were analyzed by SDS-PAGE. The
SDS-PAGE technique is exactly the same as the SDS-PAGE for the protein extract,
whole shrimp, and half cut shrimp samples. Samples were prepared to a 1:1 ratio using
2X Laemmli sample buffer, boiled for 10 minutes, and then loaded into the 4-20% Tris-
glycine minigels. The standard marker was used was Protein Plus All Protein All Blue
protein stain. This would help identify the protein of interest. For the loading, 15 uL of
each sample and the standard was added to each well. The concentration that was
used for all of the proteins was 1:50 for the R and 1:10 for all of the PL-treated samples
and prepared using PBS 1X buffer.
Figure 9-1. SDS-PAGE of analysis of protein profile of ground shrimp samples comparing 1) raw sample (R), and 2) pulsed light treated ground shrimp samples, with times of 8 min, 10 min, 12 min, and 15 min. 15 uL was added to each well with concentrations of 1:50 for the R and 1:10 for the other samples. Molecular weight marker (M) is shown on the left. Tropomyosin is pointed as 37 kDa.
M R R 8 8 10 10 12 12 15 15
37kD

90
Figure 9-2. SDS-PAGE analysis of protein profile analysis of ground shrimp samples comparing 1) raw sample (R) and 2) pulsed light treated ground shrimp samples, with times of 8 min and 15 min. 15 uL was added to each well with concentrations of 1:50 for the R and 1:10 for the other samples. Molecular weight marker (M) is shown on the left. Tropomyosin is pointed as 37 kDa.
Based on the SDS-PAGE, no noticeable reduction can be seen on the
tropomyosin protein for the 20 mL sample for all the treatment times. On the other hand,
based on the SDS-PAGE, the 10 mL treated sample does suggest noticeable reduction
of the tropomyosin protein at the 15 min mark. The 10 mL is thinner than the 20 mL
sample and measures at 1 mm, a full millimeter below the 2 mm sample that was used
for the gamma irradiated shrimp. While at 2 mm, gamma irradiation was able to give
reduction of shrimp allergen, reduction was not present for pulsed light until a thickness
of 1 mm was used. This may be due to the fact that pulsed light measures at a lower
frequency than gamma irradiation, where the latter can modify compounds at a more
sub-cellular level (Fellows 2009). The 20 mL sample may be too thick to allow enough
pulsed penetration and other compounds such as lipids or stronger protein linkages
may prevent tropomyosin from being modified (Zhenxing et al. 2007b). While these
M M R R 8 8 15 15
37kD

91
results are preliminary, these conditions do suggest that future work would have to be
done to evaluate the potential of pulsed light technology on ground shrimp.

92
LIST OF REFERENCES
Aalberse RC. 2000. Structural biology of allergens. Journal of Allergy and Clinical Immunology 106(2):228-238.
Anugu A, Yang W & Krishnamurthy K. 2009. Efficacy of pulsed ultraviolet light for reduction of allergenicity in isolated milk proteins. Institute of Food Technologists Annual Meeting and Food Expo. Anaheim, CA, U.S.A.
Anugu A, Yang W, Shriver SK, Chung SY & Percival SS. 2010. Efficacy of pulsed ultraviolet light on reducing the allergenicity of isolated egg proteins. Institute of Food Technologists Annual Meeting and Food Expo. Chicago, IL, U.S.A.
Arif SH. 2009. A Ca2+-binding protein with numerous roles and uses: parvalbumin in molecular biology and physiology. BioEssays 31(4):410-421.
Arif SH. 2010. A major cross-reactive fish allergen with exceptional stability: Parvalbumin. African journal of food science 4(3):109.
Arif SH, Jabeen M & Hasnain A-U. 2007. Biochemical Characterization and Thermostable Capacity of Parvalbumins: The Major Fish-Food Allergens. Journal of Food Biochemistry 31(1):121-137.
Ayuso R, Grishina G, Bardina L, Carrillo T, Blanco C, Ibáñez MD, Sampson HA & Beyer K. 2008. Myosin light chain is a novel shrimp allergen, Lit v 3. Journal of Allergy and Clinical Immunology 122(4):795-802.
Ayuso R, Sánchez-Garcia S, Lin J, Fu Z, Ibáñez MD, Carrillo T, Blanco C, Goldis M, Bardina L, Sastre J & Sampson HA. 2010. Greater epitope recognition of shrimp allergens by children than by adults suggests that shrimp sensitization decreases with age. Journal of Allergy and Clinical Immunology 125(6):1286-1293.e1283.
Babiker EE, Azakami H, Ogawa T & Kato A. 2000. Immunological Characterization of Recombinant Soy Protein Allergen Produced by Escherichia coli Expression System. Journal of agricultural and food chemistry 48(2):571-575.
Babiker EfE, Hiroyuki A, Matsudomi N, Iwata H, Ogawa T, Bando N & Kato A. 1998. Effect of Polysaccharide Conjugation or Transglutaminase Treatment on the Allergenicity and Functional Properties of Soy Protein. Journal of agricultural and food chemistry 46(3):866-871.
Bahna SL & Gandhi MD. 1983. Milk hypersensitivity. II. Practical aspects of diagnosis, treatment and prevention. Annals of allergy 50(5):295-301.
Ballmer-Weber BK. 2002. Lipid transfer protein as a potential panallergen? Allergy 57(10):873-875.
93
Berg J, Tymoczko J & Stryer L. 2007. Biochemistry,6th ed. New York, NY 10010: W.H. Freeman and Company.
Bernhisel-Broadbent J, Dintzis HM, Dintzis RZ & Sampson HA. 1994. Allergenicity and antigenicity of chicken egg ovomucoid (Gal d III) compared with ovalbumin (Gal d I) in children with egg allergy and in mice. Journal of Allergy and Clinical Immunology 93(6):1047-1059.
Besler M. 2001. Determination of allergens in foods. TrAC Trends in Analytical Chemistry 20(11):662-672.
Beyer K, Grishina G, Bardina L, Grishin A & Sampson HA. 2002. Identification of an 11S globulin as a major hazelnut food allergen in hazelnut-induced systemic reactions. Journal of Allergy and Clinical Immunology 110(3):517-523.
Beyer K, Morrowa E, Li X-M, Bardina L, Bannon GA, Burks AW & Sampson HA. 2001. Effects of cooking methods on peanut allergenicity. Journal of Allergy and Clinical Immunology 107(6):1077-1081.
Boquete M, Iraola V, Morales M, Pinto H, Francisco C, Carballás C & Carnés J. 2011. Seafood hypersensitivity in mite sensitized individuals: is tropomyosin the only responsible allergen? Annals of Allergy, Asthma & Immunology 106(3):223-229.
Bucala R. 1996. Laboratory evaluation of advanced glycosylation end products: relevance to diabetes, aging, and renal failure. Diag Endocrin Metab (1).
Butler JE, Navarro P & Sun J. 1997. Adsorption-Induced Antigenic Changes and Their Significance in Elisa and Immunological Disorders. Immunological Investigations 26(1-2):39-54.
Cavagni G. 1994. Allergy to cow's milk proteins in childhood: the authors' personal experience and new diagnostic and therapeutic proposals. La Pediatria medica e chirurgica : Medical and surgical pediatrics 16(5):413-419.
Chikou A, Huriaux F, Laleye P, Vandewalle P & Focant B. 1997. Isoform Distribution of Parvalbumins and of some Myofibrillar Proteins in Adult and Developing Chrysichthys auratus (Geoffroy St. Hilaire, 1808) (Pisces, Claroteidae). Archives Of Physiology And Biochemistry 105(6):611-617.
Chung SY, Yang W & Krishnamurthy K. 2008. Effects of Pulsed UV-Light on Peanut Allergens in Extracts and Liquid Peanut Butter. Journal of Food Science 73(5):C400-C404.
Clark S, Bock SA, Gaeta TJ, Brenner BE, Cydulka RK & Camargo CA. 2004. Multicenter study of emergency department visits for food allergies. Journal of Allergy and Clinical Immunology 113(2):347-352.

94
Daul CB, Morgan JE & Lehrer SB. 1990. The natural history of shrimp hypersensitivity. Journal of Allergy and Clinical Immunology 86(1):88-93.
Daul CB, Morgan JE, Waring N-P, McCants ML, Hughes J & Lehrer SB. 1987. Immunologic evaluation of shrimp-allergic individuals. Journal of Allergy and Clinical Immunology 80(5):716-722.
Davis PJ, Smales CM & James DC. 2001. How can thermal processing modify the antigenicity of proteins? Allergy 56:56-60.
Docena GH, Fernandez R, Chirdo FG & Fossati CA. 1996. Identification of casein as the major allergenic and antigenic protein of cow's milk. Allergy 51(6):412-416.
Doke S, Nakamura R & Tori iS. 1989. Allergenicity of food proteins interacted with oxidized lipids in soybean-sensitive individuals. Tokyo, Japan: Agricultural Chemical Society of Japan.
Dunn J, Ott T & Clark W. 1995. Pulsed-light treatment of food and packaging. Chicago, IL, ETATS-UNIS: Institute of Food Technologists.
Ebo DG & Stevens WJ. 2001. IgE-mediated food allergy--extensive review of the literature. Acta clinica Belgica 56(4):234-247.
El-Agamy EI. 2007. The challenge of cow milk protein allergy. Small Ruminant Research 68(1–2):64-72.
Falagiani P, Mistrello G, Rapisarda G, Festa A, Cislaghi C & Zanoni D. 1994. Evaluation of allergenic potency by REAST inhibition. A new tool for the standardization of allergenic extracts. Journal of Immunological Methods 173(2):181-190.
Fellows PJ. 2009. Food Processing Technology - Principles and Practice (3rd Edition). Woodhead Publishing.
Fiocchi A, Restani P, Riva E, Mirri GP, Santini I, Bernardo L & Galli CL. 1998. Heat treatment modifies the allergenicity of beef and bovine serum albumin. Allergy 53(8):798-802.
Focant B, Vandewalle P & Huriaux F. 2003. Expression of myofibrillar proteins and parvalbumin isoforms during the development of a flatfish, the common sole Solea solea: comparison with the turbot Scophthalmus maximus. Comparative Biochemistry and Physiology Part B: Biochemistry and Molecular Biology 135(3):493-502.
Franck P, Moneret Vautrin DA, Dousset B, Kanny G, Nabet P, Guenard-Bilbaut L & Parisot L. 2002. The allergenicity of soybean-based products is modified by food technologies. Basel, SUISSE: Karger.

95
Gillis JM. 1985. Relaxation of Vertebrate Skeletal-muscle-a Synthesis of the Biochemical and Physiological Approaches. Biochimica et biophysica acta 811(2):97.
Gjesing B, ØSterballe O, Schwartz B, Wahn U & Lowenstein H. 1986. Allergen-Specific IgE Antibodies against Antigenic Components in Cow Milk and Milk Substitutes. Allergy 41(1):51-56.
Gómez-López VM, Ragaert P, Debevere J & Devlieghere F. 2007. Pulsed light for food decontamination: a review. Trends in Food Science & Technology 18(9):464-473.
Gómez L, Martin E, Hernández D, Sánchez-Monge R, Barber D, del Pozo V, de Andres B, Armentia A, Lahoz C, Salced G & Palomino F. 1990. Members of the α-amylase inhibitors family from wheat endosperm are major allergens associated with baker's asthma. FEBS Letters 261(1):85-88.
Hamilton RG & Williams PB. 2010. Human IgE antibody serology: A primer for the practicing North American allergist/immunologist. Journal of Allergy and Clinical Immunology 126(1):33-38.
Hansen KS, Ballmer-Weber BK, Lüttkopf D, Skov PS, Wüthrich B, Bindslev-Jensen C, Vieths S & Poulsen LK. 2003. Roasted hazelnuts – allergenic activity evaluated by double-blind, placebo-controlled food challenge. Allergy 58(2):132-138.
Hansen LP. 1975. Heat-moisture effects on wheat flour. I. Physical-chemical changes of flour proteins resulting from thermal processing. Cereal chemistry 52(4):459.
Hansen LP. 1979. Blockage of Protein Enzymatic Digestion (Carboxypeptidase-B) by Heat-Induced Sugar-Lysine Reactions. Journal of Food Science 44(4):1173-1177.
Hanson LÅ & MÅNsson I. 1961. Immune Electrophoretic Studies of Bovine Milk and Milk Products. Acta Pædiatrica 50(5):484-490.
Helm R, Cockrell G, Herman E, Burks A, Sampson H & Bannon G. 1998. Cellular and molecular characterization of a major soybean allergen. International archives of allergy and immunology 117(1):29-37.
Helm RM, Cockrell G, Connaughton C, West CM, Herman E, Sampson HA, Bannon GA & Burks AW. 2000. Mutational analysis of the IgE-binding epitopes of P34/Gly m Bd 30K. Journal of Allergy and Clinical Immunology 105(2, Part 1):378-384.
Hill DJ & Hosking CS. 1996. Cow milk allergy in infancy and early childhood. Clinical & Experimental Allergy 26(3):243-246.
Huriaux F, Vandewalle P & Focant B. 2002. Immunological study of muscle parvalbumin isotypes in three African catfish during development. Comparative Biochemistry and Physiology Part B: Biochemistry and Molecular Biology 132(3):579-584.
96
Järvinen K-M, Beyer K, Vila L, Chatchatee P, Busse PJ & Sampson HA. 2002. B-cell epitopes as a screening instrument for persistent cow's milk allergy. Journal of Allergy and Clinical Immunology 110(2):293-297.
Ji C, Boyd C, Slaymaker D, Okinaka Y, Takeuchi Y, Midland SL, Sims JJ, Herman E & Keen N. 1998. Characterization of a 34-kDa soybean binding protein for the syringolide elicitors. Proceedings of the National Academy of Sciences 95(6):3306-3311.
Kabourek JL & Taylor SL. 2003. Soyfoods and Allergies: Separating Fact From Fiction. The Soy Connection. United Soybean Board. p. 1-7.
Kalluri R, Cantley LG, Kerjaschki D & Neilson EG. 2000. Reactive Oxygen Species Expose Cryptic Epitopes Associated with Autoimmune Goodpasture Syndrome. Journal of Biological Chemistry 275(26):20027-20032.
Karanova M & Andreev A. 2010. Free amino acids and reducing sugars in the freshwater shrimp <i>Gammarus lacustris (Crustacea, Amphipoda) at the initial stage of preparation to winter season. Journal of Evolutionary Biochemistry and Physiology 46(4):335-340.
Keklik NM, Demirci A & Puri VM. 2009. Inactivation of Listeria monocytogenes on Unpackaged and Vacuum-Packaged Chicken Frankfurters Using Pulsed UV-Light. Journal of Food Science 74(8):M431-M439.
Kemeny D & Chanter S. 1988. An Introduction to ELISA. In: Kemeny, D. & Challacombe, S., editors. ELISA and Other Solid Phase Immunoassays: Theoretical and Practical Aspects. Bognor Regis, West Sussex, U.K.: John Wiley & Sons Inc.
Kleber N, Maier S & Hinrichs J. 2007. Antigenic response of bovine β-lactoglobulin influenced by ultra-high pressure treatment and temperature. Innovative Food Science & Emerging Technologies 8(1):39-45.
Kleine-Tebbe J, Wangorsch A, Vogel L, Crowell DN, Haustein U-F & Vieths S. 2002. Severe oral allergy syndrome and anaphylactic reactions caused by a Bet v 1– related PR-10 protein in soybean, SAM22. Journal of Allergy and Clinical Immunology 110(5):797-804.
Liu G-M, Cheng H, Nesbit JB, Su W-J, Cao M-J & Maleki SJ. 2010. Effects of Boiling on the IgE-Binding Properties of Tropomyosin of Shrimp (Litopenaeus vannamei ). Journal of Food Science 75(1):T1-T5.
Lüttkopf D, Müller U, Skov PS, Ballmer-Weber BK, Wüthrich B, Skamstrup Hansen K, Poulsen LK, Kästner M, Haustein D & Vieths S. 2002. Comparison of four variants of a major allergen in hazelnut (Corylus avellana) Cor a 1.04 with the major hazel pollen allergen Cor a 1.01. Molecular Immunology 38(7):515-525.

97
Maleki SJ. 2003. Effects of processing on the structure, function, and allergenic properties of peanut proteins. p. U82-U82.
Maleki SJ & Hortense D. 2002. The changes in structure and function of peanut allergens after roasting. 4 ed. p. A551-A551.
Mizuta S, Yamada Y, Miyagi T & Yoshinaka R. 1999. Histological Changes in Collagen Related to Textural Development of Prawn Meat During Heat Processing. Journal of Food Science 64(6):991-995.
Mondoulet L, Paty E, Drumare MF, Ah-Leung S, Scheinmann P, Willemot RM, Wal JM & Bernard H. 2005. Influence of thermal processing on the allergenicity of peanut proteins. Journal of agricultural and food chemistry 53(11):4547-4553.
Nagpal S, Rajappa L, Metcalfe DD & Subba Rao PV. 1989. Isolation and characterization of heat-stable allergens from shrimp (Penaeus indicus). Journal of Allergy and Clinical Immunology 83(1):26-36.
Nakamura A, Sasaki F, Watanabe K, Ojima T, Ahn D-H & Saeki H. 2006. Changes in Allergenicity and Digestibility of Squid Tropomyosin during the Maillard Reaction with Ribose. Journal of agricultural and food chemistry 54(25):9529-9534.
Nakamura A, Watanabe K, Ojima T, Ahn D-H & Saeki H. 2005. Effect of Maillard Reaction on Allergenicity of Scallop Tropomyosin. Journal of agricultural and food chemistry 53(19):7559-7564.
Nooji J, Yang W, Shriver S, Anugu A & Chung S. 2010. Pulsed ultraviolet light reduces the allergenicity of wheat gluten. Institute of Food Technologists Annual Meeting and Food Expo. Chicago, IL, U.S.A.
Ogawa T, Bando N, Tsuji H, Okajima H, Nishikawa K & Sasaoka K. 1991. Investigation of the IgE-binding proteins in soybeans by immunoblotting with the sera of the soybean-sensitive patients with atopic dermatitis. Journal of nutritional science and vitaminology 37(6):555-565.
Ogawa T, Tsuji H, Bando N, Kitamura K, Zhu YL, Hirano H & Nishikawa K. 1993. Identification of the soybean allergenic protein, Gly m Bd 30K, with the soybean seed 34-kDa oil-body-associated protein. Bioscience, biotechnology, and biochemistry 57(6):1030-1033.
Oms-Oliu G, Martín-Belloso O & Soliva-Fortuny R. 2010. Pulsed Light Treatments for Food Preservation. A Review. Food and Bioprocess Technology 3(1):13-23.
Pasini G, Simonato B, Giannattasio M, Peruffo ADB & Curioni A. 2001. Modifications of Wheat Flour Proteins during in Vitro Digestion of Bread Dough, Crumb, and Crust: An Electrophoretic and Immunological Study. Journal of agricultural and food chemistry 49(5):2254-2261.

98
Pastorello EA, Vieths S, Pravettoni V, Farioli L, Trambaioli C, Fortunato D, Lüttkopf D, Calamari M, Ansaloni R, Scibilia J, Ballmer-Weber BK, Poulsen LK, Wütrich B, Hansen KS, Robino AM, Ortolani C & Conti A. 2002. Identification of hazelnut major allergens in sensitive patients with positive double-blind, placebo-controlled food challenge results. Journal of Allergy and Clinical Immunology 109(3):563-570.
Peñas E, Gomez R, Frias J, Baeza ML & Vidal-Valverde C. 2011. High hydrostatic pressure effects on immunoreactivity and nutritional quality of soybean products. Food Chemistry 125(2):423-429.
Perry TT, Matsui EC, Conover-Walker MK & Wood RA. 2004. Risk of oral food challenges. Journal of Allergy and Clinical Immunology 114(5):1164-1168.
Poulsen LK. 2001. In vivo and in vitro techniques to determine the biological activity of food allergens. Journal of Chromatography B: Biomedical Sciences and Applications 756(1–2):41-55.
Roux KH, Teuber SS, Robotham JM & Sathe SK. 2001. Detection and Stability of the Major Almond Allergen in Foods. Journal of agricultural and food chemistry 49(5):2131-2136.
Sampson HA. 1999a. Food allergy. Part 1: Immunopathogenesis and clinical disorders. Journal of Allergy and Clinical Immunology 103(5):717-728.
Sampson HA. 1999b. Food allergy. Part 2: Diagnosis and management. Journal of Allergy and Clinical Immunology 103(6):981-989.
Sanford S. 1998. U.S. Peanut Consumption Rebounds. Agricultural Outlook. December ed.: Economic Research Service, U.S. Department of Agriculture. p. 3.
Sathe SK, Teuber SS & Roux KH. 2005. Effects of food processing on the stability of food allergens. Biotechnology Advances 23(6):423-429.
Schocker F, Lüttkopf D, Scheurer S, Petersen A, Cisteró-Bahima A, Enrique E, San Miguel-Moncín M, Akkerdaas J, van Ree R, Vieths S & Becker W-M. 2004. Recombinant lipid transfer protein Cor a 8 from hazelnut: A new tool for in vitro diagnosis of potentially severe hazelnut allergy. Journal of Allergy and Clinical Immunology 113(1):141-147.
Schubring R. 2009. Comparative study of DSC pattern, colour and texture of shrimps during heating. Journal of Thermal Analysis and Calorimetry 95(3):749-757.
Shanti KN, Martin BM, Nagpal S, Metcalfe DD & Rao PV. 1993. Identification of tropomyosin as the major shrimp allergen and characterization of its IgE-binding epitopes. The Journal of Immunology 151(10):5354-5363.

99
Shapiro AL, Viñuela E & V. Maizel Jr J. 1967. Molecular weight estimation of polypeptide chains by electrophoresis in SDS-polyacrylamide gels. Biochemical and Biophysical Research Communications 28(5):815-820.
Shimakura K, Tonomura Y, Hamada Y, Nagashima Y & Shiomi K. 2005. Allergenicity of crustacean extractives and its reduction by protease digestion. Food Chemistry 91(2):247-253.
Shriver S & Yang W. 2011. Thermal and Nonthermal Methods for Food Allergen Control. Food Engineering Reviews 3(1):26-43.
Shriver S, Yang W, Chung S-Y & Percival S. 2011. Pulsed Ultraviolet Light Reduces Immunoglobulin E Binding to Atlantic White Shrimp (Litopenaeus setiferus) Extract. International Journal of Environmental Research and Public Health 8(7):2569-2583.
Sicherer SH, Muñoz-Furlong A, Burks AW & Sampson HA. 1999. Prevalence of peanut and tree nut allergy in the US determined by a random digit dial telephone survey. Journal of Allergy and Clinical Immunology 103(4):559-562.
Silva JL, Foguel D & Royer CA. 2001. Pressure provides new insights into protein folding, dynamics and structure. Trends in Biochemical Sciences 26(10):612-618.
Simonato B, Pasini G, Giannattasio M, Peruffo ADB, De Lazzari F & Curioni A. 2001. Food Allergy to Wheat Products: The Effect of Bread Baking and in Vitro Digestion on Wheat Allergenic Proteins. A Study with Bread Dough, Crumb, and Crust. Journal of agricultural and food chemistry 49(11):5668-5673.
Singh MB. 1985. Grass pollen allergens: antigenic relationships detected using monoclonal antibodies and dot blotting immunoassay. International archives of allergy and immunology 78(3):300.
Sizer CE & Balasubramaniam VM. 1999. New intervention processes for minimally processed juices. Chicago, IL, ETATS-UNIS: Institute of Food Technologists.
Soothill JF, Stokes CR, Turner MW, Norman AP & Taylor B. 1976. Predisposing factors and the development of reaginic allergy in infancy. Clinical & Experimental Allergy 6(4):305-319.
Suzuki K & Taniguchi Y. 1972. Effect of high pressure on biopolymers and model systems. In: M.A., S. & A.G., M., editors. Effect of pressure on organism. Cambridge University Press. p. 103-124.
Tachihara T, Ishizaki S, Ishikawa M & Kitahara T. 2004. Studies on the Volatile Compounds of Roasted Spotted Shrimp. Chemistry & Biodiversity 1(12):2024-2033.

100
Taheri-Kafrani A, Gaudin J-C, Rabesona H, Nioi C, Agarwal D, Drouet M, Chobert J-M, Bordbar A-K & Haertle T. 2009. Effects of Heating and Glycation of β-Lactoglobulin on Its Recognition by IgE of Sera from Cow Milk Allergy Patients. Journal of agricultural and food chemistry 57(11):4974-4982.
Tanabe S. 2007. Epitope Peptides and Immunotherapy. Current protein & peptide science 8(1):109-118.
Taylor SL & Nordlee JA. 1996. Detection of food allergens. Food Technology 50(5):231-234.
Tew JG, Kosco MH, Burton GF & Szakal AK. 1990. Follicular Dendritic Cells as Accessory Cells. Immunological Reviews 117(1):185-211.
Towbin H, Staehelin T & Gordon J. 1979. Electrophoretic transfer of proteins from polyacrylamide gels to nitrocellulose sheets: procedure and some applications. Proceedings of the National Academy of Sciences 76(9):4350-4354.
Troszynska A, Szymkiewicz A & WoŁEjszo A. 2007. The Effects of Germination on the Sensory Quality and Immunoreactive Properties of Pea (Pisum sativum L.) and Soybean (Glycine Max). Journal of Food Quality 30(6):1083-1100.
Tryphonas H, Arvanitakis G, Vavasour E & Bondy G. 2003. Animal Models to Detect Allergenicity to Foods and Genetically Modified Products: Workshop Summary. Environmental Health Perspectives 111(2):221-222.
Venkatachalam M, Teuber SS, Roux KH & Sathe SK. 2002. Effects of Roasting, Blanching, Autoclaving, and Microwave Heating on Antigenicity of Almond (Prunus dulcis L.) Proteins. Journal of agricultural and food chemistry 50(12):3544-3548.
Vieths S, Reindl J, Müller U, Hoffmann A & Haustein D. 1999. Digestibility of peanut and hazelnut allergens investigated by a simple in vitro procedure. European Food Research and Technology 209(6):379-388.
Wachholz PA, Dearman RJ & Kimber I. 2005. Detection of Allergen-Specific IgE Antibody Responses. Journal of Immunotoxicology 1(3-4):189-199.
Walzer M. 1942. Absorption of allergens* 1:: Presidential address. Journal of allergy 13(6):554.
Wilson S, Blaschek K & de Mejia EG. 2005. Allergenic Proteins in Soybean: Processing and Reduction of P34 Allergenicity. Nutrition Reviews 63(2):47-58.
Worm M, Hompes S, Fiedler EM, Illner AK, Zuberbier T & Vieths S. 2009. Impact of native, heat-processed and encapsulated hazelnuts on the allergic response in hazelnut-allergic patients. Clinical & Experimental Allergy 39(1):159-166.

101
Yaklich RW, Helm RM, Cockrell G & Herman EM. 1999. Analysis of the Distribution of the Major Soybean Seed Allergens in a Core Collection of Accessions. Crop Sci. 39(5):1444-1447.
Yamanishi R, Huang T, Tsuji H, Bando N & Ogawa T. 1995. Reduction of the Soybean Allergenicity by the Fermentation with <I>Bacillus natto</I>. Food Science and Technology International, Tokyo 1(1):14-17.
Yang AC, Arruda LK, Santos ABR, Barbosa MCR, Chapman MD, Galvão CES, Kalil J & Morato-Castro FF. 2010a. Measurement of IgE antibodies to shrimp tropomyosin is superior to skin prick testing with commercial extract and measurement of IgE to shrimp for predicting clinically relevant allergic reactions after shrimp ingestion. Journal of Allergy and Clinical Immunology 125(4):872-878.
Yang WW, Chung S-Y, Ajayi O, Krishnamurthy K, Konan K & Goodrich-Schneider R. 2010b. Use of Pulsed Ultraviolet Light to Reduce the Allergenic Potency of Soybean Extracts. The Berkeley Electronic Press.
Yocum MW & Khan DA. 1994. Assessment of patients who have experienced anaphylaxis: a 3-year survey. Mayo Clinic proceedings 69(1):16-23.
Zeng QZ, Thorarinsdottir KA & Olafsdottir G. 2005. Quality Changes of Shrimp (Pandalus borealis) Stored under Different Cooling Conditions. Journal of Food Science 70(7):s459-s466.
Zhenxing L, Hong L, Li-min C & Khalid J. 2006. Effect of high intensity ultrasound on the allergenicity of shrimp. Journal of Zhejiang University - Science B 7(4):251-256.
Zhenxing L, Hong L, Limin C & Jamil K. 2007a. Impact of irradiation and thermal processing on the immunoreactivity of shrimp (Penaeus vannamei) proteins. Journal of the Science of Food and Agriculture 87(6):951-956.
Zhenxing L, Hong L, Limin C & Jamil K. 2007b. The influence of gamma irradiation on the allergenicity of shrimp (Penaeus vannamei). Journal of Food Engineering 79(3):945-949.

102
BIOGRAPHICAL SKETCH
Syed Ali Shamikh Abbas was born in Karachi, Pakistan in 1986. He graduated
from the University of Florida in 2008 with a bachelor’s in biology. Afterwards, he took a
year off, working and gaining real world experience, before discovering the field of food
science. After realizing his passion for the field, he entered the academic arena again
and chose to pursue a master’s in food science. He was accepted into the University of
Florida Food Science and Human Nutrition Department, after which he did research on
shrimp allergens, particularly the major shrimp allergen, tropomyosin.
He was an active member in the FSHN Club and also the FSHN Graduate Student
Association. He received an assistantship from his major professor, volunteered with
the Institute of Food Technologists (IFT) and helped to present at the IFT Annual
Meeting and Food Expo 2011 and 2012. He graduated in August 2012 and is now
pursing law school at Stetson University to combine his knowledge of food science with
a legal career.