Embed Size (px)
Citation preview
International Journal of Applied Engineering Research ISSN 0973-4562 Volume 13, Number 4 (2018) pp. 2046-2054
© Research India Publications. http://www.ripublication.com
2046
Effect of Process Parameters in MIG Welding on Mild Steel IS 2062
R.SUDARSHAN1, Dr. M.Devaiah2, 1, 2Geethanjali College of Engineering and Technology, Cheeryal (V), Keesara (M), Medchal, Telangana, India.
Corresponding Author
Abstract
The main objective of this paper is to predict and optimize
MIG welding of some economically important similar
materials or dissimilar materials in industry through applying
a statistical approach to SPSS software, develop mathematical
models and optimize the welding operation. This was
achieved by controlling selected welding parameters; V-butt
angles, welding current and welding voltage position, to relate
the ultimate tensile strength to the selected input welding
parameters. The materials studied in this work are Mild steel
IS2062.
The experimental results which are obtain corresponding to
the effect of different V-angles such as 300, 450 and 600 at,
different welding current such as 80 Amp, 100 Amp and 110
Amp and various welding voltage 17 Volt, 19 Volt and 20
Volt on ultimate tensile strength of welding of Mild Steel
IS2062, are used to find out the significance of input
parameter on output by using SPSS and ANSYS method,
static analysis and thermal analysis.
This result shows better ultimate tensile strength prediction
capability and applicability to such industrial MIG welding
leading to effective selection of machining parameter for
better ultimate tensile strength.
Keywords: Ultimate tensile strength, Analysis of object
(ANSYS), Modelling in Pro-E, Metal inert gas (MIG)
welding, SPSS Software.
INTRODUCTION
Welding is a manufacturing process of creating a permanent
joint obtained by the fusion of the surface of the parts to be
joined together, with or without the application of pressure
and a filler material. The materials to be joined may be
similar or dissimilar to each other. The heat required for the
fusion of the material may be obtained by burning of gas or
by an electric arc. The latter method is more extensively used
because of greater welding speed.
Welding is extensively used in fabrication as an alternative
method for casting or forging and as a replacement for bolted
and riveted joints. It is also used as a repair medium e.g. to
reunite a metal at a crack or to build up a small part that has
broken off such as a gear tooth or to repair a worn surface
such as a bearing surface.
MonikaK.et al. [1], analyzed the Mechanical Properties of
MIG Welded Dissimilar Joints under the effect of heat input.
Welding current, voltage and speed of wire determines the
heat input. The IS2062, IS45C8, IS103Cr1 were used as a
base material. 1.2 mm diameter copper coated mild steel was
used as a filler wire. The both joints (IS2062 & IS45C8) and
(IS2062 & IS103Cr1) increased the tensile strength when
increased with the heat input and also increased the hardness
value when decreased with the heat input. M.Aghakhani et al. [2] have done work on optimization of gas metal arc welding
process parameter for increase quality and productivity of
weldment. In this research work for increasing quality and
productivity of weldment they have considered weld dilution
as output parameter and effect of input parameter wire feed
rate (W), welding voltage (V), nozzle-to-plate distance (N),
welding speed (S)and gas flow rate (G)was found on it. The
base material use for experiment is ST-37 steel plate and the
mixture of 80% argon and 20% CO2 is use as shielding gas.
The experiment was designed by Taguchi's L25 orthogonal
array and analysis was carried out by ANOVA method also
they develop mathematical model for weld dilution. From the
experimental result they found that the wire feed rate has the
most significant effect on the weld dilution while gas flow
rate has no effect on weld dilution. C. N. Patel et al. [3]
evaluated the parameters; welding current, wire diameter and
wire feed rate to investigate their influence on weld bead
hardness for MIG welding and TIG welding by Taguchi’s
method and Grey Relational Analysis (GRA). From the study
it was concluded that the welding current was most significant
parameter for MIG and TIG welding. By use of GRA
optimization technique the optimal parameter combination
was found to be welding current, 100 Amp; wire diameter 1.2
mm and wire feed rate, 3m/min for MIG welding.
EXPERIMENTAL WORK
The machine use for performing the experiment is
AUTOK600 SYNERGIC, manufactured by ESAB India
Limited in Gujarat Apollo Equipments Ltd.
Work piece material
From the literature survey of past researchers it is show that
the material selection in manufacturing process is most
important think as per process availability and customer’s
requirement. There is number of material used in modern
International Journal of Applied Engineering Research ISSN 0973-4562 Volume 13, Number 4 (2018) pp. 2046-2054
© Research India Publications. http://www.ripublication.com
2047
industry but steel have corrosion resistive property and IS
2062 steel are shown in table 3.2 to 3.3
IS: 2062 Specification of Structural Steel for Fabrication
Chemical Composition of IS 2062 steel
Grade C % Mn % S % P % Si C. E.
%
Max. Max. Max. Max. Max. Max.
A 0.23 1.5 0.05 0.05 - 0.42
B 0.22 1.5 0.045 0.045 0.04 0.41
C 0.2 1.5 0.04 0.04 0.4 0.39
Mechanical Properties IS 2062 steel
Grade UTS
(MPA)
Y.S.(MPA) Min. EI. %
Min
Bend
A Min. < 20 mm 20-40 mm >
40 mm
5.65 So Test
B 410 250 240 230 23 3T
C 410 250 240 230 23 2T &
3T*
* 2T - Less than 25 mm.
* 3T - More than 25 mm.
Filler metal
The filler material use for the experiment is copper coated MS
material electrodes with size of 1.20 mm diameter.
Shielding Gas
A shielding gas mixture is selected for the experiments. It
contains 20%CO2 and 80% Argon.
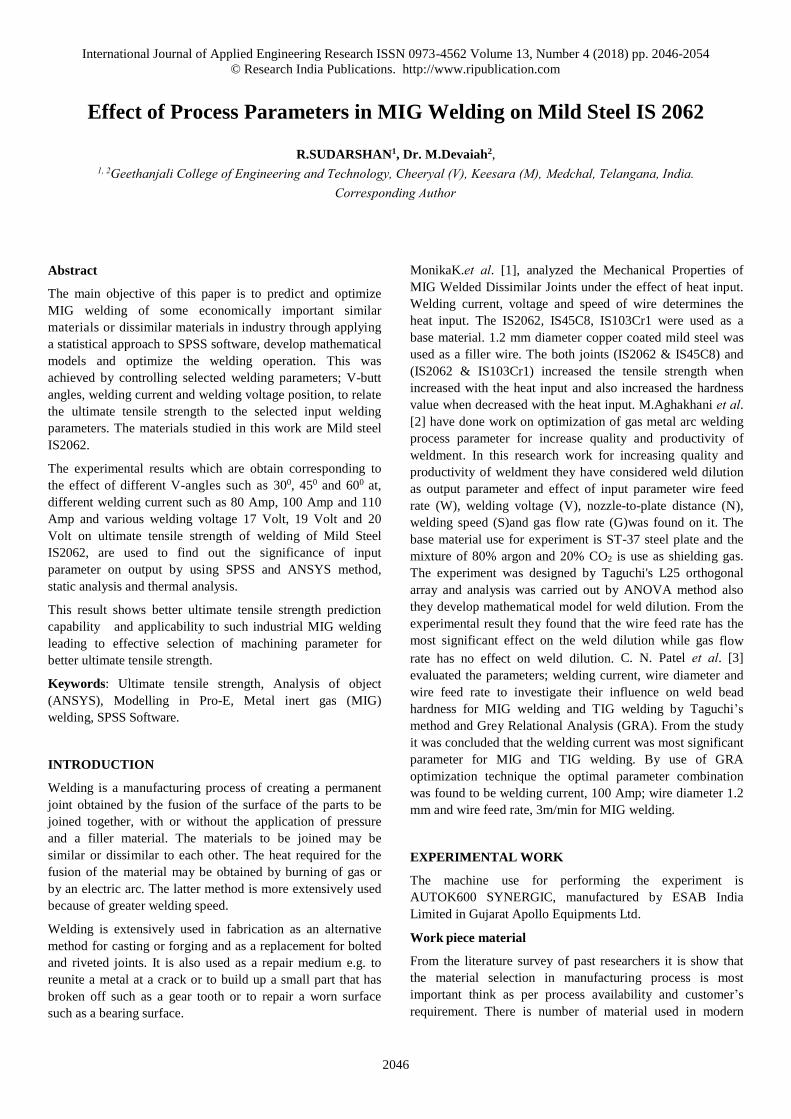
Sample Preparation
Mild steel IS 2062 plates with the dimensions of 120 x 50 x 8
mm are prepared with the bevel angle of 300, 450 and 600.
These specimens are then welded with a root gap distance 1
mm. Figure shows the single V groove butt joint preparations.
Material Mild Steel
Grade IS2062
Width 50 mm
Length 120 mm
Thickness 8 mm
Figure 1: Schematic view of samples used for testing
Input Parameter Level and Value
Parameter
Level
Gas Pressure
(Psi)
Current
(Amp)
Voltage
(Volt) Angles
(A) (B) (C) (D)
1 100 80 17 30
2 100 100 19 45
3 100 110 20 60
Parameter considered for experiment
Input Parameters
1 Angles 300, 450 and 600
2 Current (Amp)
3 Voltage (V)
Constant Parameters
1 Electrode size
2 Shielded Gas
3 Gas Pressure (Psi)
Output Parameter
1 Ultimate strength (KN)
2 Yield strength (KN)
International Journal of Applied Engineering Research ISSN 0973-4562 Volume 13, Number 4 (2018) pp. 2046-2054
© Research India Publications. http://www.ripublication.com
2048
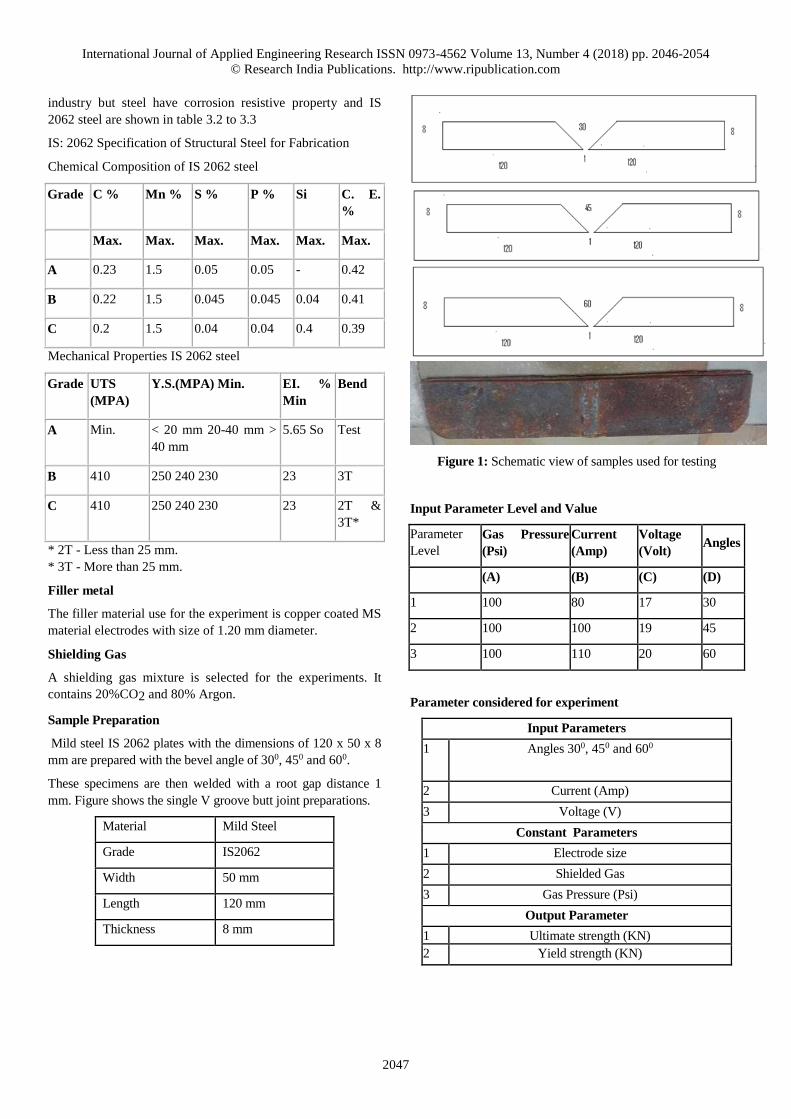
UTM Machine frame
Figure 2: Schematic view of UTM and tensile test
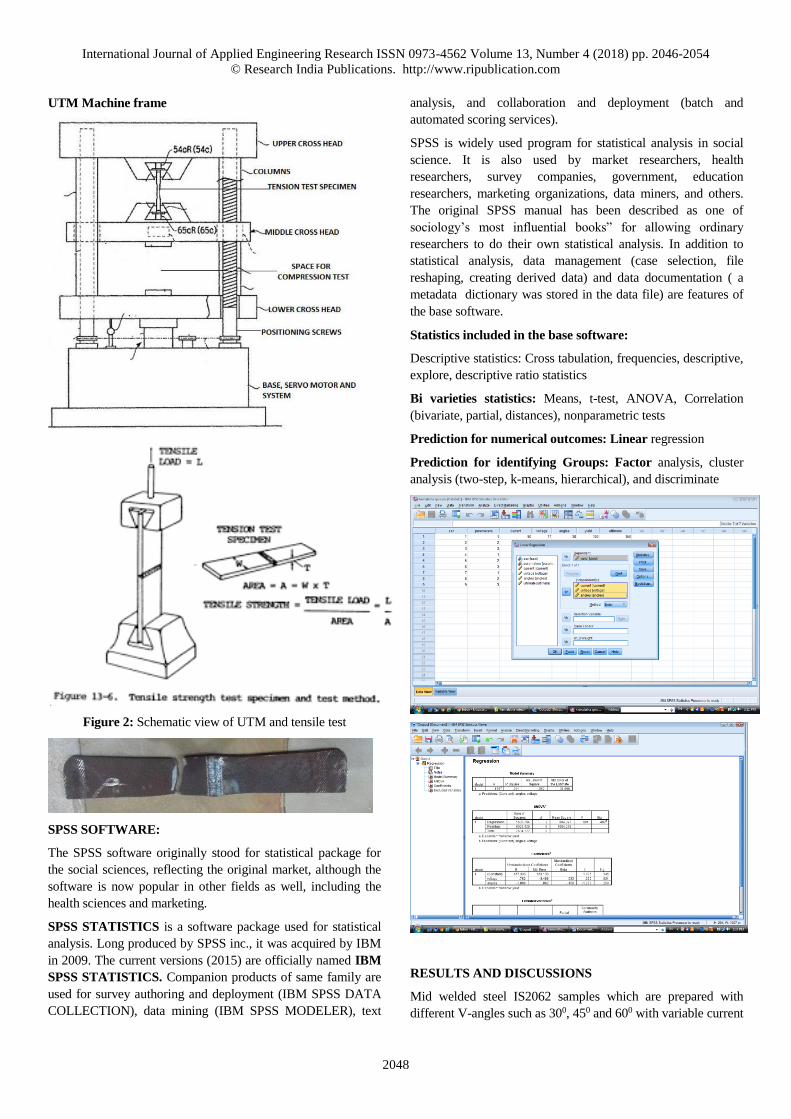
SPSS SOFTWARE:
The SPSS software originally stood for statistical package for
the social sciences, reflecting the original market, although the
software is now popular in other fields as well, including the
health sciences and marketing.
SPSS STATISTICS is a software package used for statistical
analysis. Long produced by SPSS inc., it was acquired by IBM
in 2009. The current versions (2015) are officially named IBM
SPSS STATISTICS. Companion products of same family are
used for survey authoring and deployment (IBM SPSS DATA
COLLECTION), data mining (IBM SPSS MODELER), text
analysis, and collaboration and deployment (batch and
automated scoring services).
SPSS is widely used program for statistical analysis in social
science. It is also used by market researchers, health
researchers, survey companies, government, education
researchers, marketing organizations, data miners, and others.
The original SPSS manual has been described as one of
sociology’s most influential books” for allowing ordinary
researchers to do their own statistical analysis. In addition to
statistical analysis, data management (case selection, file
reshaping, creating derived data) and data documentation ( a
metadata dictionary was stored in the data file) are features of
the base software.
Statistics included in the base software:
Descriptive statistics: Cross tabulation, frequencies, descriptive,
explore, descriptive ratio statistics
Bi varieties statistics: Means, t-test, ANOVA, Correlation
(bivariate, partial, distances), nonparametric tests
Prediction for numerical outcomes: Linear regression
Prediction for identifying Groups: Factor analysis, cluster
analysis (two-step, k-means, hierarchical), and discriminate
RESULTS AND DISCUSSIONS
Mid welded steel IS2062 samples which are prepared with
different V-angles such as 300, 450 and 600 with variable current
International Journal of Applied Engineering Research ISSN 0973-4562 Volume 13, Number 4 (2018) pp. 2046-2054
© Research India Publications. http://www.ripublication.com
2049
and voltage by using Universal Testing Machine (UTM) model
UTS -100. The test results such as Ultimate Strength and Yield
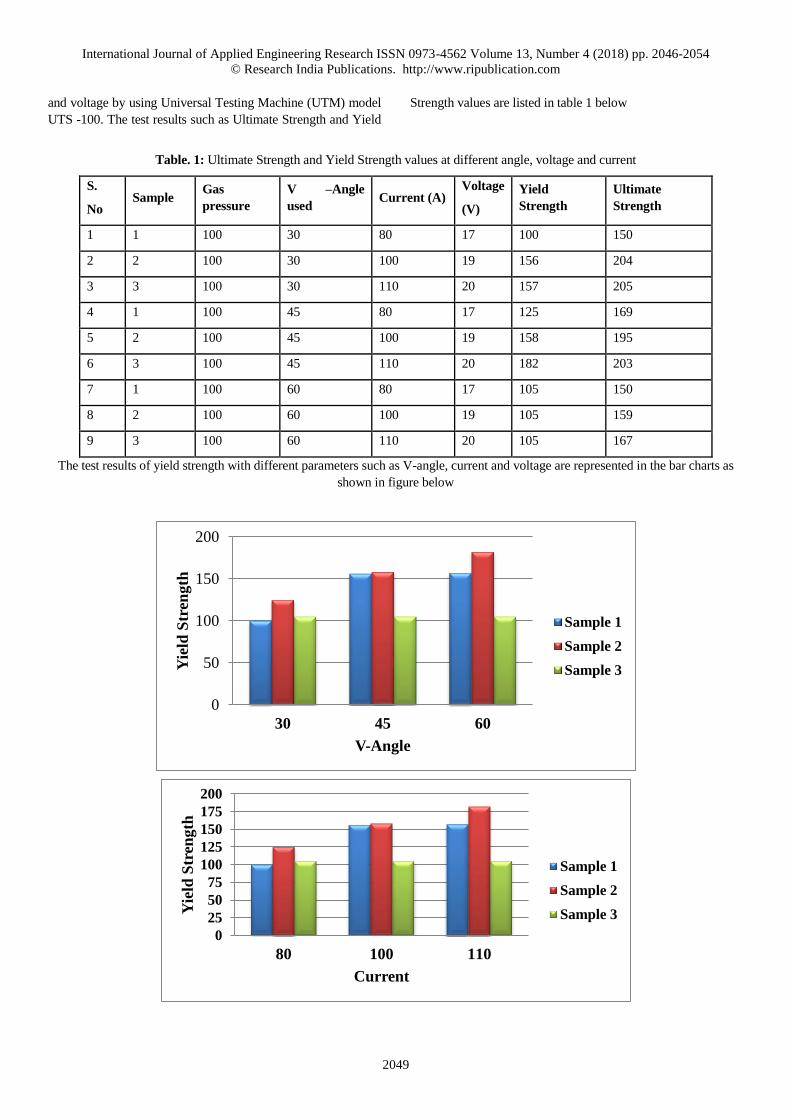
Strength values are listed in table 1 below
Table. 1: Ultimate Strength and Yield Strength values at different angle, voltage and current
S.
No Sample
Gas
pressure
V –Angle
used Current (A)
Voltage
(V)
Yield
Strength
Ultimate
Strength
1 1 100 30 80 17 100 150
2 2 100 30 100 19 156 204
3 3 100 30 110 20 157 205
4 1 100 45 80 17 125 169
5 2 100 45 100 19 158 195
6 3 100 45 110 20 182 203
7 1 100 60 80 17 105 150
8 2 100 60 100 19 105 159
9 3 100 60 110 20 105 167
The test results of yield strength with different parameters such as V-angle, current and voltage are represented in the bar charts as
shown in figure below
0
50
100
150
200
30 45 60
Yie
ld S
tren
gth
V-Angle
Sample 1
Sample 2
Sample 3
0
25
50
75
100
125
150
175
200
80 100 110
Yie
ld S
tren
gth
Current
Sample 1
Sample 2
Sample 3
International Journal of Applied Engineering Research ISSN 0973-4562 Volume 13, Number 4 (2018) pp. 2046-2054
© Research India Publications. http://www.ripublication.com
2050
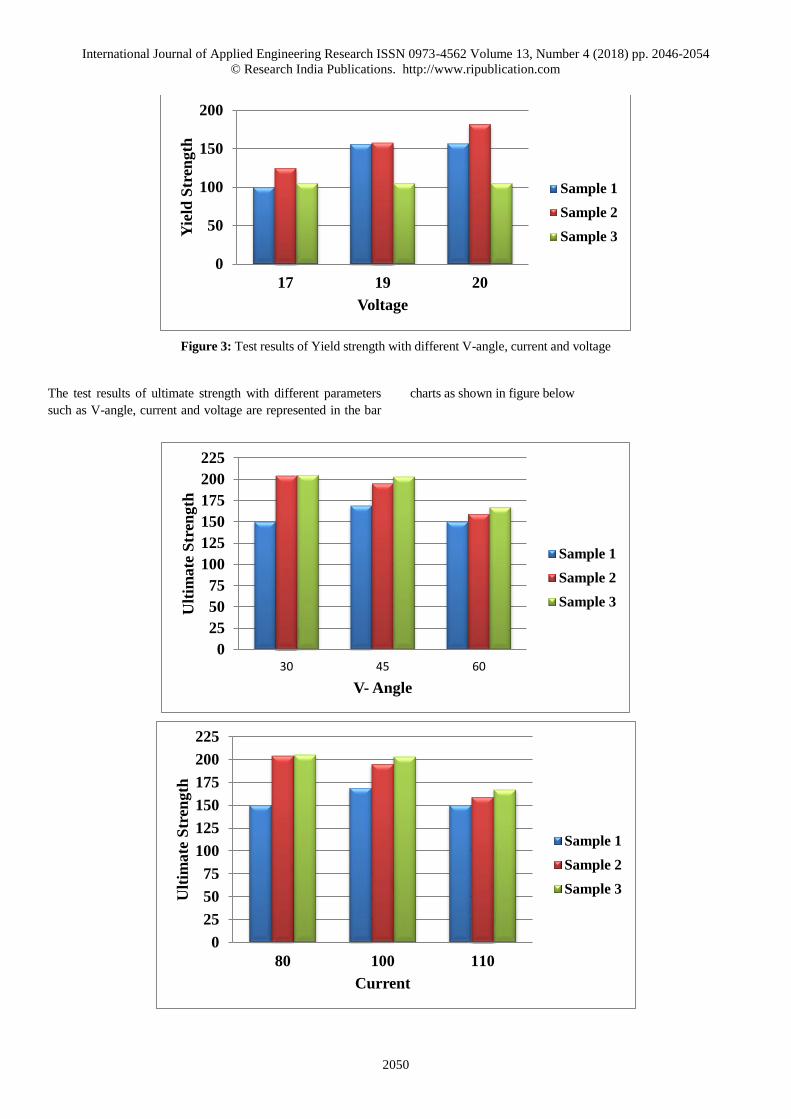
Figure 3: Test results of Yield strength with different V-angle, current and voltage
The test results of ultimate strength with different parameters
such as V-angle, current and voltage are represented in the bar
charts as shown in figure below
0
50
100
150
200
17 19 20
Yie
ld S
tren
gth
Voltage
Sample 1
Sample 2
Sample 3
0
25
50
75
100
125
150
175
200
225
30 45 60
Ult
imate
Str
ength
V- Angle
Sample 1
Sample 2
Sample 3
0
25
50
75
100
125
150
175
200
225
80 100 110
Ult
imate
Str
ength
Current
Sample 1
Sample 2
Sample 3
International Journal of Applied Engineering Research ISSN 0973-4562 Volume 13, Number 4 (2018) pp. 2046-2054
© Research India Publications. http://www.ripublication.com
2051
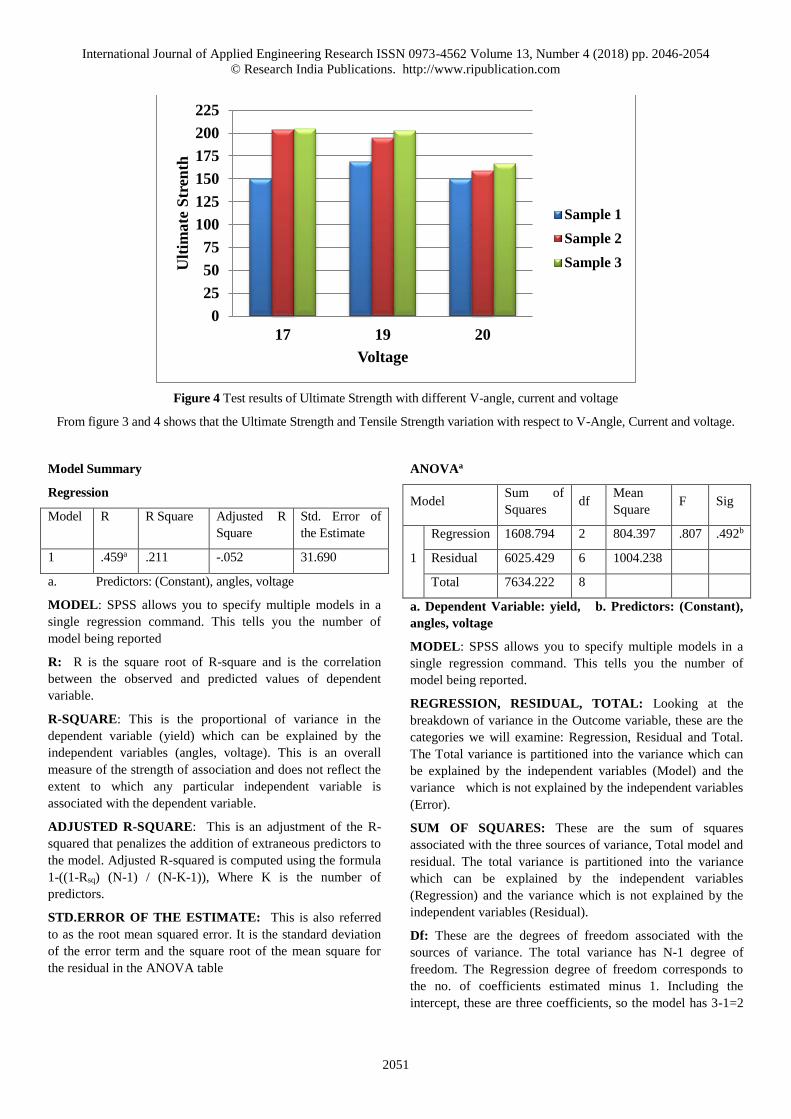
Figure 4 Test results of Ultimate Strength with different V-angle, current and voltage
From figure 3 and 4 shows that the Ultimate Strength and Tensile Strength variation with respect to V-Angle, Current and voltage.
Model Summary
Regression
Model R R Square Adjusted R
Square
Std. Error of
the Estimate
1 .459a .211 -.052 31.690
a. Predictors: (Constant), angles, voltage
MODEL: SPSS allows you to specify multiple models in a
single regression command. This tells you the number of
model being reported
R: R is the square root of R-square and is the correlation
between the observed and predicted values of dependent
variable.
R-SQUARE: This is the proportional of variance in the
dependent variable (yield) which can be explained by the
independent variables (angles, voltage). This is an overall
measure of the strength of association and does not reflect the
extent to which any particular independent variable is
associated with the dependent variable.
ADJUSTED R-SQUARE: This is an adjustment of the R-
squared that penalizes the addition of extraneous predictors to
the model. Adjusted R-squared is computed using the formula
1-((1-Rsq) (N-1) / (N-K-1)), Where K is the number of
predictors.
STD.ERROR OF THE ESTIMATE: This is also referred
to as the root mean squared error. It is the standard deviation
of the error term and the square root of the mean square for
the residual in the ANOVA table
ANOVAa
Model Sum of
Squares df
Mean
Square F Sig
1
Regression 1608.794 2 804.397 .807 .492b
Residual 6025.429 6 1004.238
Total 7634.222 8
a. Dependent Variable: yield, b. Predictors: (Constant),
angles, voltage
MODEL: SPSS allows you to specify multiple models in a
single regression command. This tells you the number of
model being reported.
REGRESSION, RESIDUAL, TOTAL: Looking at the
breakdown of variance in the Outcome variable, these are the
categories we will examine: Regression, Residual and Total.
The Total variance is partitioned into the variance which can
be explained by the independent variables (Model) and the
variance which is not explained by the independent variables
(Error).
SUM OF SQUARES: These are the sum of squares
associated with the three sources of variance, Total model and
residual. The total variance is partitioned into the variance
which can be explained by the independent variables
(Regression) and the variance which is not explained by the
independent variables (Residual).
Df: These are the degrees of freedom associated with the
sources of variance. The total variance has N-1 degree of
freedom. The Regression degree of freedom corresponds to
the no. of coefficients estimated minus 1. Including the
intercept, these are three coefficients, so the model has 3-1=2
0
25
50
75
100
125
150
175
200
225
17 19 20
Ult
imate
Str
enth
Voltage
Sample 1
Sample 2
Sample 3
International Journal of Applied Engineering Research ISSN 0973-4562 Volume 13, Number 4 (2018) pp. 2046-2054
© Research India Publications. http://www.ripublication.com
2052
D.o.f. The error d.o.f is the Df total minus the DFmodel, 6.
F AND SIG. : This is the F-statistic the P-value associated
with it. The f-statistic is the mean square (Regression )
divided by the mean square (Residual ).The P-value is
compared to some alpha level in testing the null hypothesis
that all of model coefficients are 0.492
Coefficients
Model Unstandardized Coefficients Standardized
Coefficients t Sig.
B Std. Error Beta
1
(Constant) 167.333 163.133 1.026 .345
voltage .762 8.469 .033 .090 .931
angles -1.089 .862 -.458 -1.263 .254
a. Dependent Variable: yield, b. Predictors in the Model:
(Constant), angles, voltage
MODEL: SPSS allows you to specify multiple models in a
single regression command. This tells you the number of
model being reported.
B: These are the value for the regression equation for
predicting the dependent variable from the independent
variable. The regression equation is presented in many
different ways.
Ypredicted = b0+b1**1+b2**2+b3**3+b4**4.
Voltage: The coefficient of voltage is 0.762
Angles: The coefficient of angles is -1.089.
STD.ERROR: These are the standard errors associated with
the coefficients.
BETA: These are the standardized coefficients. These are the
coefficients that you would obtain if you standardized all of
the variables in the regression, including the dependent and all
of the independent variables and ran the regression. By
standardizing the variables before running the regression, you
have put all of the variables on the same scale, and you can
compare the magnitude of the coefficients to see which one
has more of an effect. You will also notice that the larger
betas are associated with the larger t-values and lower p-
values.
T AND SIG.: These are the t-statistics and their associated 2-
tailed p-values used in testing whether a given coefficients is
significantly different from zero.
y= A+B*x1+c*x2
Model Summary
Regression
Model R R Square Adjusted R
Square
Std. Error of
the Estimate
1 .612a .374 .165 21.547
a. Predictors: (Constant), angles, voltage
ANOVAa
Model Sum of
Squares df
Mean
Square F Sig
1
Regression 1664.238 2 832.119 1.792 .245b
Residual 2785.762 6 464.294
Total 4450.000 8
a. Dependent Variable: ultimate, b. Predictors:
(Constant), angles, voltage
Coefficients
Model Unstandardized Coefficients Standardized
Coefficients t Sig.
B Std. Error Beta
1
(Constant) 106.167 110.922 .957 .375
voltage 6.071 5.759 .341 1.054 .332
angles -.922 .586 -.508 -1.573 .167
a. Dependent Variable: ultimate,
Excluded Variablesa
Model Beta
In
t Sig. Partial
Correlation
Collinearity
Statistics
Tolerance
1 current .b . . . .000
a. Dependent Variable: ultimate, b. Predictors in the
Model: (Constant), angles, voltage
MODEL: SPSS allows you to specify multiple models in a
single regression command. This tells you the number of
model being reported.
R: R is the square root of R-square and is the correlation
between the observed and predicted values of dependent
International Journal of Applied Engineering Research ISSN 0973-4562 Volume 13, Number 4 (2018) pp. 2046-2054
© Research India Publications. http://www.ripublication.com
2053
variable.
R-SQUARE: This is the proportional of variance in the
dependent variable (yield) which can be explained by the
independent variables (angles, voltage). This is an overall
measure of the strength of association and does not reflect the
extent to which any particular independent variable is
associated with the dependent variable.
ADJUSTED R-SQUARE: This is an adjustment of the R-
squared that penalizes the addition of extraneous predictors to
the model. Adjusted R-squared is computed using the formula
1-((1-Rsq) (N-1) / (N-K-1)), Where K is the number of
predictors.
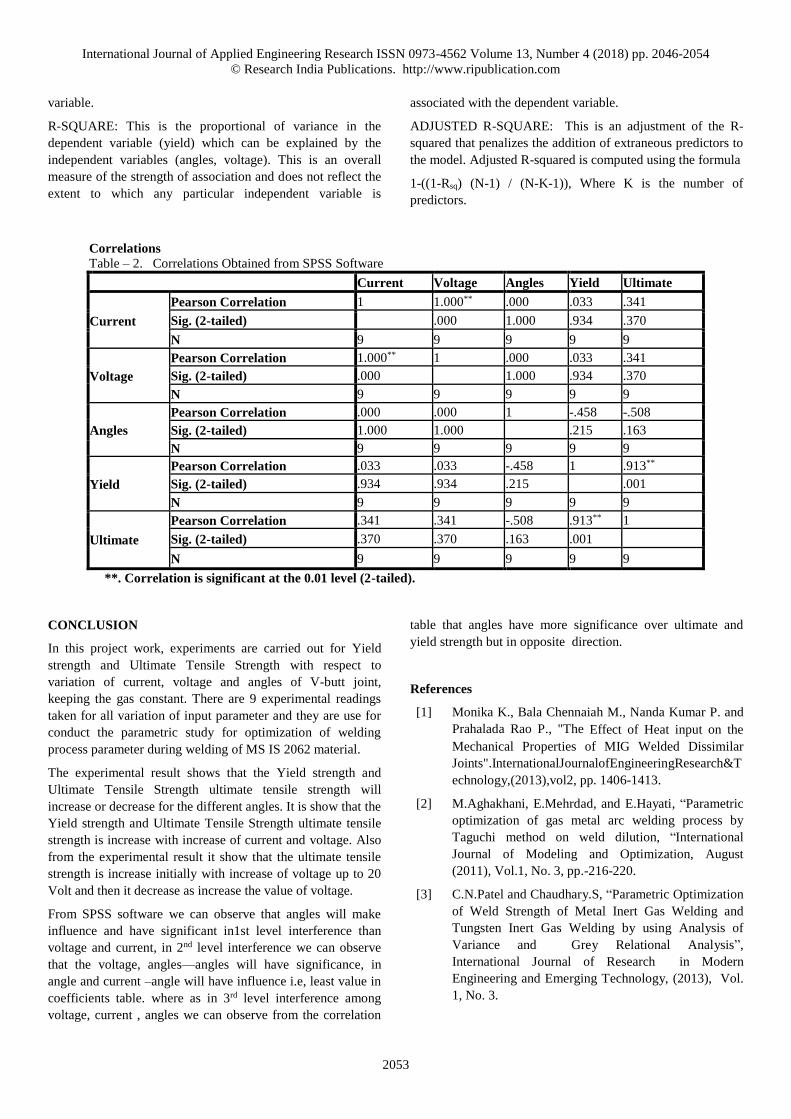
Correlations
Table – 2. Correlations Obtained from SPSS Software
Current Voltage Angles Yield Ultimate
Current
Pearson Correlation 1 1.000** .000 .033 .341
Sig. (2-tailed) .000 1.000 .934 .370
N 9 9 9 9 9
Voltage
Pearson Correlation 1.000** 1 .000 .033 .341
Sig. (2-tailed) .000 1.000 .934 .370
N 9 9 9 9 9
Angles
Pearson Correlation .000 .000 1 -.458 -.508
Sig. (2-tailed) 1.000 1.000 .215 .163
N 9 9 9 9 9
Yield
Pearson Correlation .033 .033 -.458 1 .913**
Sig. (2-tailed) .934 .934 .215 .001
N 9 9 9 9 9
Ultimate
Pearson Correlation .341 .341 -.508 .913** 1
Sig. (2-tailed) .370 .370 .163 .001
N 9 9 9 9 9
**. Correlation is significant at the 0.01 level (2-tailed).
CONCLUSION
In this project work, experiments are carried out for Yield
strength and Ultimate Tensile Strength with respect to
variation of current, voltage and angles of V-butt joint,
keeping the gas constant. There are 9 experimental readings
taken for all variation of input parameter and they are use for
conduct the parametric study for optimization of welding
process parameter during welding of MS IS 2062 material.
The experimental result shows that the Yield strength and
Ultimate Tensile Strength ultimate tensile strength will
increase or decrease for the different angles. It is show that the
Yield strength and Ultimate Tensile Strength ultimate tensile
strength is increase with increase of current and voltage. Also
from the experimental result it show that the ultimate tensile
strength is increase initially with increase of voltage up to 20
Volt and then it decrease as increase the value of voltage.
From SPSS software we can observe that angles will make
influence and have significant in1st level interference than
voltage and current, in 2nd level interference we can observe
that the voltage, angles—angles will have significance, in
angle and current –angle will have influence i.e, least value in
coefficients table. where as in 3rd level interference among
voltage, current , angles we can observe from the correlation
table that angles have more significance over ultimate and
yield strength but in opposite direction.
References
[1] Monika K., Bala Chennaiah M., Nanda Kumar P. and
Prahalada Rao P., "The Effect of Heat input on the
Mechanical Properties of MIG Welded Dissimilar
Joints".InternationalJournalofEngineeringResearch&T
echnology,(2013),vol2, pp. 1406-1413.
[2] M.Aghakhani, E.Mehrdad, and E.Hayati, “Parametric
optimization of gas metal arc welding process by
Taguchi method on weld dilution, “International
Journal of Modeling and Optimization, August
(2011), Vol.1, No. 3, pp.-216-220.
[3] C.N.Patel and Chaudhary.S, “Parametric Optimization
of Weld Strength of Metal Inert Gas Welding and
Tungsten Inert Gas Welding by using Analysis of
Variance and Grey Relational Analysis”,
International Journal of Research in Modern
Engineering and Emerging Technology, (2013), Vol.
1, No. 3.
International Journal of Applied Engineering Research ISSN 0973-4562 Volume 13, Number 4 (2018) pp. 2046-2054
© Research India Publications. http://www.ripublication.com
2054
[4] Sheikh Irfan and Prof. Vishal Achwal, “An
experimental study on the effect of MIG welding
parameters on the weldability of galvenize steel”,
International Journal on Emerging Technologies 5 (1),
June (2014), pp.-146-152.
[5] Ghazvin loo H.R., Honarbakhsh-Raouf A.and Shadfar
N.," Effect of arc voltage, welding current and
welding speed on fatigue life, impact energy and bead
penetrationofAA6061jointsproducedbyroboticMIGwe
lding".IndianJournal of Science and Technology,
(2010), Vol 3.
[6] Pawan Kumar, Dr.B.K.Roy and Nishant, “Parameters
optimization for gas metal arc welding of austenitic
stainless steel (AISI304) & low carbon steel using
Taguchi’s technique,” International journal of
engineering and management research, August
(2013),pp.-18-22.
[7] S. W. Campbell, A. M. Galloway, and N. A.
Mcpherson, “Artificial neural network prediction of
weld geometry performed using GMAW with
alternating shielding gases”, Welding journal, June
(2012), Vol.91, pp.-174-181.
[8] Tewari, S.P.,Gupta, A. and Prakash,J.,“Effect of
Welding Parameters on the Weldability of Material
”,International Journal of Engineering Science and
Technology, (2010),Vol. 2, No. 4, pp. 512–516.