Embed Size (px)
Citation preview

EFFECT OF PINK SALMON INCUBATION
AND REARING TECHNIQUES ON HATCHERY AND MARINE SURVIVAL FOR THE 1978
KITOI BAY HATCHERY BROOD by
Tim R. McDaniel and
Jean Collins Number 40

EFFECT OF PINK SALMON INCUBATION AND REARING TECHNIQUES ON HATCHERY AND MARINE SURVIVAL FOR THE 1 9 7 8
KIT01 BAY HATCHERY BROOD by
Tim R. McDaniel and
Jean Collins Nurnber 40
Alaska Department of Fish and Game
Division of Fisheries Rehabilitation,
Enhancement, and Development
Don W. Collinswarth
Commissioner
Stanley A. Moberly
Director
P.O. Box 3 - 2 0 0 0
Juneau, Alaska 9 9 8 0 2
June 1 9 8 4

TABLE OF CONTENTS
Section Page
ABSTRACT . . . . . . . . . . . . . . . . . . . . . . . . . . . . . . . . . . . . . . . . . . . . . . 1
INTRODUCTION
. . . . . . . . . . . . . . . . . . . . . . . . . . . . . . . Project Background 2
Study Site . . . . . . . . . . . . . . . . . . . . . . . . . . . . . . . . . . . . . . . 4
. . . . . . . . . . . . . . . . . . . . . . . . . . . . . . . . . METHODS AND MATERIALS 5
. . . . . . . . . . . . . . . . . . . . . . . . . . . . . . . Incubation Studies 5
Egg Sources and Treatment ................... 5 Incubator Design . . . . . . . . . . . . . . . . . . . . . . . . . . . . 6 Egg Incubation . . . . . . . . . . . . . . . . . . . . . . . . . . . . . . 6
. . . . . . . . . . . . . . . Fry Emergence and Enumeration 7
Fry Quality Samples . . . . . . . . . . . . . . . . . . . . . . . . . 7 Fry Marking and Release . . . . . . . . . . . . . . . . . . . . . 9
. . . . . . . . . . . . . . . . . . . . Rearing and Estuarine Studies 11
. . . . . . . . . . . . . . . . . . . . . . . . . . . Saltwater Rearing 11
Estuarine Studies . . . . . . . . . . . . . . . . . . . . . . . . . . . 12 . . . . . . . . . . . . . . . Evaluation of Adult Salmon Returns 13
. . . . . . . . . . . . . . . . . . . Commercial Catch Sampling 13 ....... Marked Adult Recovery at the Hatchery 15
. . . . . . . . . . . . . . . . . . . . . . . . . . . . . . . . . . . . . . . . . . . . . . . RESULTS 15
. . . . . . . . . . . . . . . . . . . . . Incubation and Water Quality 15
. . . . . . . . . . . . . . . . . . . . . . . Fry Emergence and Survival 17
. . . . . . . . . . . . . . . . . . . . . . . . . Fry Size and Development 17
. . . . . . . . . . . . . . . . . . . . . . . . . . . . . . . . Saltwater Rearing 22
. . . . . . . . . . . . . . . . . . . . . . . . . . . . . . . . . . Marine Plankton 22
. . . . . . . . . . . . . . . . . Ocean Survival and Adult Returns 25

T A B L E O F C O N T E N T S
( C o n t i n u e d )
S e c t i o n Page
D I S C U S S I O N ............................................ 2 8
...................................... ACKNOWLEDGEMENTS 3 3
R E F E R E N C E S ............................................ 3 4
............................................ A P P E N D I X A 38
............................................ A P P E N D I X B 4 7

LIST OF TABLES
Table Page
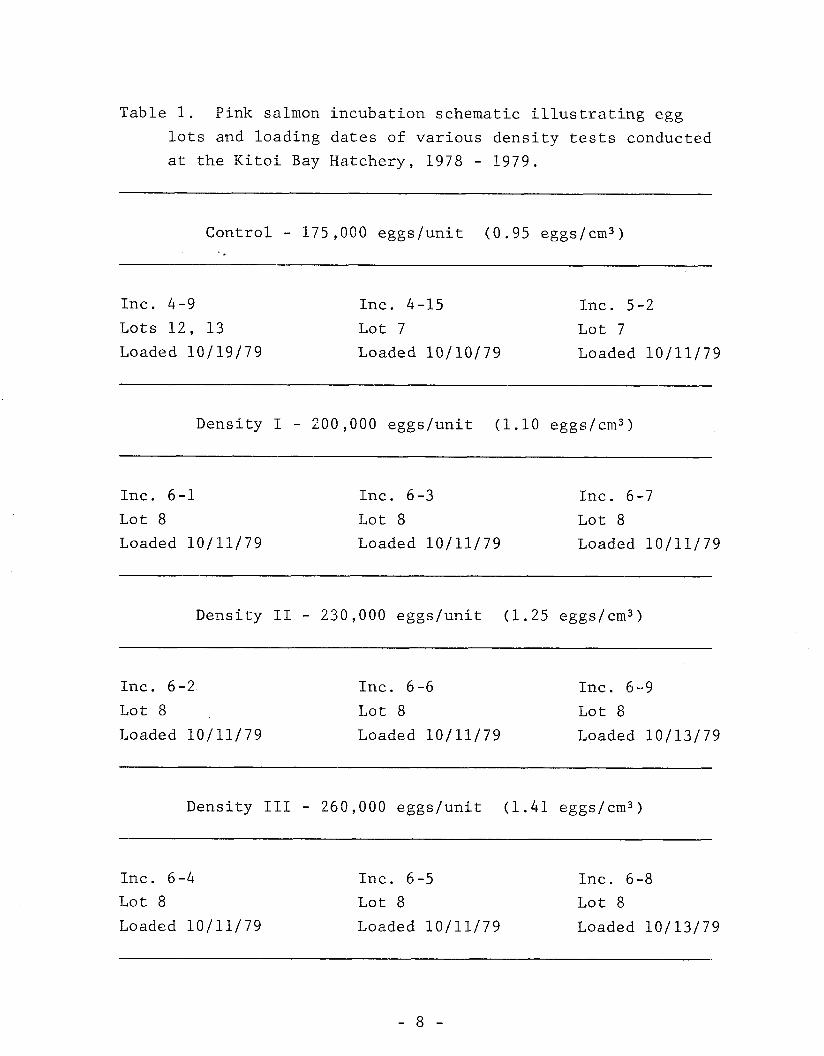
1. Pink salmon incubation schematic illustrating egg
lots and loading dates of various density tests
conducted at the Kitoi Bay Hatchery, 1978 - 1979.. 8
2. Pink salmon fry marking design for evaluating
ocean survival of fry released from the Kitoi
................................ Bay Hatchery, 1979 10
3. Marked and unmarked pink salmon fry releases from
. . . . . . Kitoi Bay Hatchery and Big Kitoi Creek, 1979 19
4. Grand means of lengths, weights, and development
indices (K ) of pink salmori fry samples from Big D . . . Kitoi Creek and hatchery incubation tests, 1979 21
5 . Summary of Kitoi Bay Hatchery and Big Kitoi Creek
pink salmon production, commercial catch
contribution, and return to the facility,
1978 brood . . . . . . . . . . . . . . . . . . . . . . . . . . . . . . . . . . . . . . . . 26
6 . Estimated ocean survival of various groups of pink
salmon fry released from the Kitoi Bay Hatchery
and Big Kitoi Creek, 1979 ......................... 27
7. Summary of chi-square calculations to test for
significant differences in marine survival for
three pink salmon fry release experiments, Kitoi
. . . . . . . . . . . . . . . . . . . . . . . . . . . . . . . . Bay Hatchery, 1979 29
8. Mean lengths and weights of marked adult pink
salmon recovered from commercial catches and
hatchery brood-stock, Kitoi Bay, 1980 . , . . . . . . . . . . . 30

Figure
LIST OF FIGURES
Page
1. Location of Big Kitoi Creek and the Kitoi Bay
Hatchery on Afognak Island. Plankton sampling
stations in Kitoi Bay are listed as
P.l through P.4 ................................... 3
2. Pink Salmon commercial catch sampling locations
where interception of hatchery produced salmon
. . . . . . . . . . . . . . . . . . . . . . . . . . . . . . . . . . occurred in 1980 14
3. Kitoi Bay Hatchery water temperatures (1978-1979)
and time lines of pink salmon egg and alevin
. . . . . . . . . . . . . . . . . . . . . . . . . . . . . . . . . . . . . . . development 16
4. Pink salmon fry emergence timing and eyed-egg to
fry survival of four incubation density test
groups at the Kitoi Bay Hatchery, 1978-1979 . . . . . . . 18
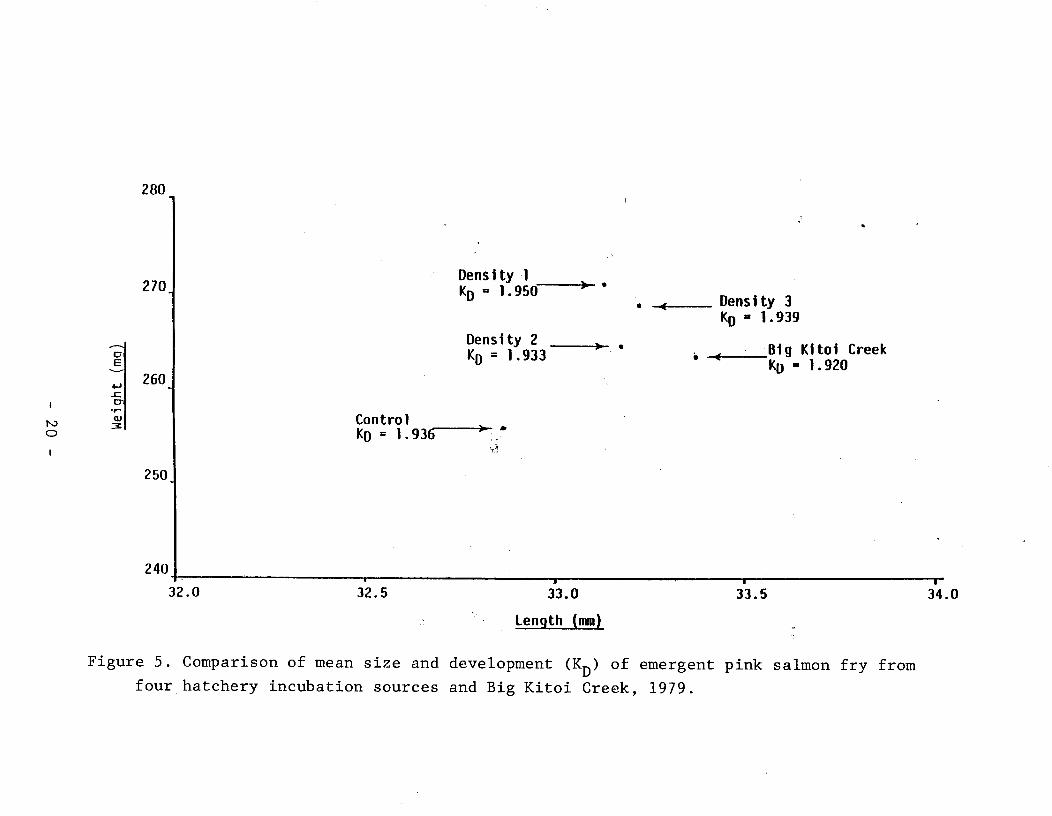
5. Comparison of mean size and development (K ) of D emergent pink salmon fry from four hatchery
incubation sources and Big Kitoi Creek, 1979 . . . . . . 20
6. Marine plankton densities and seawater
temperatures in Kitoi Bay, 15 April through
30 May, 1979 . . . . . . . . . . . . . . . . . . . . . . . . . . . . . . . . . . . . . . 23

ABSTRACT
Hatchery t e c h n i q u e s i n v o l v i n g t h e i n c u b a t i o n and r e a r i n g o f
p i n k salmon (Oncorhynchus gorbuscha) f r y were t e s t e d t o
e v a l u a t e methods o f i n c r e a s i n g t h e mar ine s u r v i v a l o f
ha tchery-produced f r y . K i t o i i n c u b a t i o n u n i t s ( v e r t i c a l
u p w e l l i n g i n c u b a t o r s w i t h a s u b s t r a t e volume of 184,500 c m 3 )
were seeded w i t h eyed-egg d e n s i t i e s of 1 . 1 0 eggs/cm3 (200,000
e g g s / u n i t ) , 1.25 eggs/cm3 (230,000 e g g s / u n i t ) , and 1 . 4 1
eggs/cm3 (260,000 e g g s / u n i t ) . Eyed-egg t o emergent f r y
s u r v i v a l and f r y development f o r each t e s t u n i t w e r e compared
t o c o n t r o l u n i t s seeded a t a d e n s i t y of 0.95 eggs/cm3 (175,000
e g g s / u n i t ) . Mean eyed-egg t o f r y s u r v i v a l ranged from 94% t o
95.2% f o r t h e t e s t u n i t s and 85.16% f o r t h e c o n t r o l u n i t s .
Emergent f r y development , a s measured by t h e r a t i o o f we igh t
t o l e n g t h , was s i m i l a r f o r a l l s o u r c e s .
S i x g roups o f marked f r y were r e l e a s e d t o compare ocean
s u r v i v a l o f (1) s h o r t - t e r m r e a r e d f r y v e r s u s f r y r e l e a s e d
v o l i t i o n a l l y and unfed , ( 2 ) emergent f r y from t h e 1 . 4 1
eggs/cm3 d e n s i t y i n c u b a t i o n v e r s u s emergent f r y from t h e
c o n t r o l , and ( 3 ) w i l d f r y from Big K i t o i Creek v e r s u s f r y
r e l e a s e d v o l i t i o n a l l y and unfed . Commercial c a t c h e s and
h a t c h e r y brood s t o c k were sampled t o r e c o v e r marked a d u l t s .
Marine s u r v i v a l was e s t i m a t e d a t 2.81% f o r t h e r e a r e d g roup
v e r s u s 1.62% f o r t h e unfed r e l e a s e group. F ry from t h e
d e n s i t y t e s t w e r e e s t i m a t e d t o have s u r v i v e d t o a d u l t a t a
h i g h e r r a t e (2 .61%) t h a n f r y from t h e cor respond ing c o n t r o l
group ( 1 . 6 2 % ) . Es t ima ted ocean s u r v i v a l o f w i l d f r y from Big
K i t o i Creek was h i g h e r (2 .71%) t h a n a l l g roups of u n f e d ,
v o l i t i o n a l l y r e l e a s e d h a t c h e r y f r y .
C o n t r i b u t i o n s of ha tchery-produced p ink salmon t o commercial
c a t c h e s were e s t i m a t e d from mark recovery d a t a . An e s t i m a t e d
360,000 hatchery-produced p i n k salmon were ta-ken i n commercial

catches in the Kitoi Bay area. Hatchery production accounted
for approximately 52% of the commercial catches in the east
Afognak district.
Keywords: Oncorhynchus gorbuscha, pink salmon, incubation
techniques, short-term rearing, marine survival.
INTRODUCTION
Methods of increasing Pacific salmon (Oncorhynchus spp.)
survival and production are currently being tested at hatchery
facilities throughout the state of Alaska. Kitoi Bay Hatchery
is a pink salmon (Oncorhynchus gorbuscha) production facility
on Afognak Island near Kodiak (Figure 1). Experimentation
there has addressed two major goals. The first goal was to
define the optimal loading density (eggs per unit volume) of
Kitoi incubation units. The criteria were to maintain a high
level of eyed-egg to fry survival and to produce fry
comparable to those produced naturally. The second goal was
to determine the effects of short-term saltwater rearing and
release timing on the ocean survival of hatchery-produced pink
salmon.
This report presents the results of studies involving the
release of 1978 brood pink salmon fry from the Kitoi Bay
Hatchery and the subsequent adult return.
Proj ect Background
The incubation studies at the Kitoi Bay Hatchery are a
continuation of pilot projects designed to evaluate the
feasibility of crushed rock incubation systems for salmon
enhancement in Alaska (Blackett 1974; Bailey 1972, 1973).
Development of incubation technology has led to the widespread
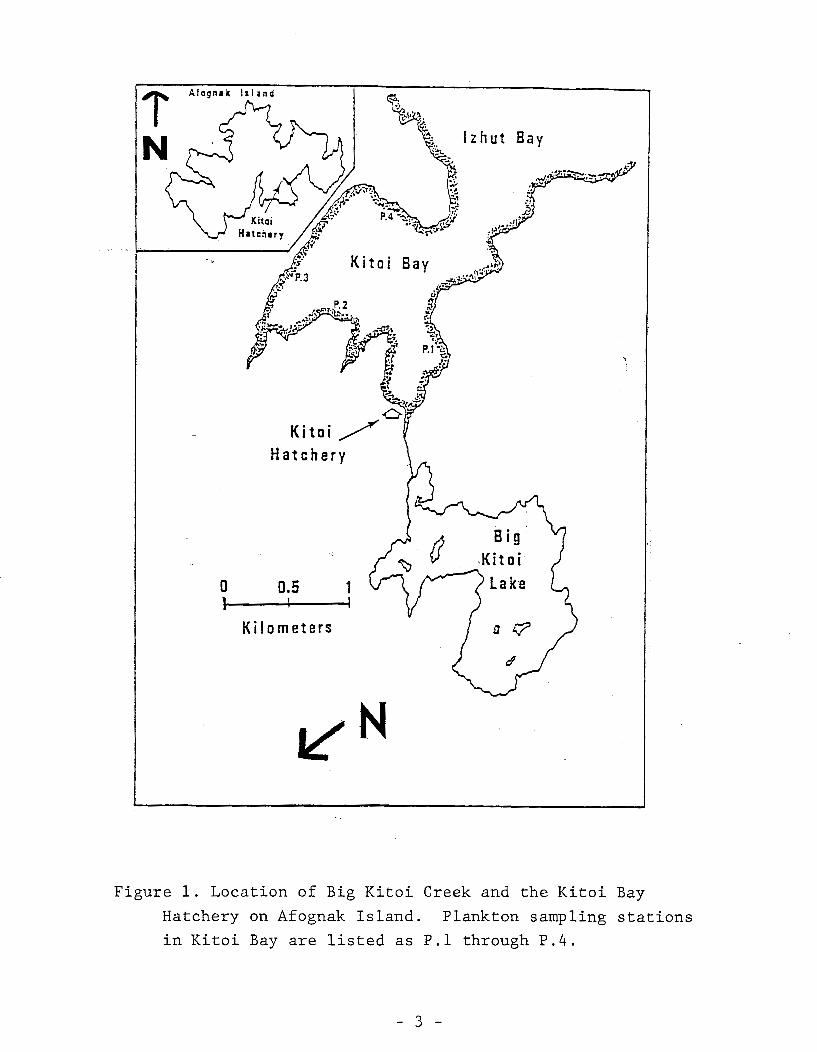
Figure 1. Location of Big K i t o i Creek and t h e K i t o i Bay
Hatchery on Afognak I s l a n d . Plankton sampling s t a t i o n s
i n K i t o i Bay a r e l i s t e d a s P . l through P . 4 .

use of a light, plastic, artificial substrate (Intalox
saddles) in. production hatcheries as described by Leon (1975).
The use of this substrate eliminates the problems associated
with moving large quantities of crushed rock for production
incubation systems and supplies a more uniform matrix with
greater alevin-loading capacity.
During incubation testing, Intalox saddles were used as a
substrate in the incubation units. These units were loaded at
various egg densities and were evaluated in terms of the
relative difference in eyed-egg to fry survival, emergent fry
quality, and fry to adult survival.
Studies dealing with pen culture of emergent pink salmon fry
indicate that ocean survival can be increased by short-term
saltwater rearing (Martin et al. 1981; Dudiak and Quimby
1979).
Heard (1978) states that survival of pink salmon should
theoretically be improved if fry were raised to a larger size
in a protected estuarine environment and released in a manner
that does not disrupt the migration timing and internal clock
during their ocean life. Short-term rearing may mitigate
early estuarine mortality of migrant pink salmon fry and allow
a delayed release of fry into marine nursery areas when
natural feeding conditions are near optimal levels.
Preliminary results of rearing studies at the Kitoi Bay
Hatchery indicate an increase in ocean survival of reared pink
salmon fry compared to unfed, volitionally released hatchery
fry (MeDaniel 1980).
Study Site
Big Kitoi Creek, adjacent to Kitoi Hatchery at Kitoi Bay,
Afognak Island (Figure 11, has a native stock of pink salmon
that spawns in the intertidal area to 120 m upstream. A falls

prevents fish passage further upstream. A spawning area of
approximately 2,500 m2 has produced estimated adult returns of
up to 35,000 fish; however, annual returns usually range from
4,000 to 8,000 pink salmon (Blackett 1974).
Big Kitoi Lake, at an elevation of 30.5 m above sea level, is
the source-sf water for both the hatchery and the creek. A
steel pipe, 35.6 cm in diameter and approximately 0.5 km in
length, transports water by gravity flow from a dam at the
lake outlet to the hatchery (Blackett 1974).
Hatchery incubation of pink salmon began in 1972 with a
limited number of pink salmon eggs taken on a yearly basis for
experimental purposes. In 1976 the hatchery incubation system
was rebuilt with 160 "Kitoi" incubation units for pink salmon
production. Adult salmon returns produced by the hatchery
have resulted in increased commercial fishing activity and
pink salmon catches in outer Izhut Bay. Special fishery
openings inside Kitoi Bay have also been necessary to harvest
the pink salmon in excess of hatchery brood stock and
escapement requirements.
METHODS AND MATERIALS
Incubation Studies
Egg Sources and Treatment:
Pink salmon eggs were obtained from hatchery brood stock in 13
separate lots between 1 September and 19 September. Eggs were
removed from females by incision and placed in plastic
spawning buckets. The milt from one male was added to the
eggs from three females. This procedure was repeated until
the eggs from 15 females and the milt from five males were

added t o each b u c k e t . The eggs w e r e t r a n s p o r t e d t o t h e
h a t c h e r y b u ' i l d i n g , and a s m a l l amount o f w a t e r was added t o
a i d f e r t i l i z a t i o n . The eggs w e r e t h e n washed and p l a c e d i n
i n c u b a t i o n u n i t s t o c o n t i n u e development . S t a n d a r d h a t c h e r y
p r o c e d u r e s i n v o l v i n g m a l a c h i t e g r e e n t r e a t m e n t s , shock ing , and
p i c k i n g (Anon. 1980) were fo l lowed .
I n c u b a t o r Design:
K i t o i i n c u b a t i o n u n i t s were of a v e r t i c a l , upwel l ing d e s i g n
c o n s i s t i n g o f f i b e r g l a s s - r e i n f o r c e d plywood boxes measur ing
61-cm w i d t h by 91-cm l e n g t h and by 61-cm dep th ( i n s i d e dimen-
s i o n s ) , w i t h a p e r f o r a t e d w a t e r d i s p e r s i o n p l a t e suspended 7.6
c m above t h e bottom. The d i s p e r s i o n p l a t e c o n s i s t e d o f a 61-
x 91-cm s h e e t o f po lypropy lene t h a t was p e r f o r a t e d w i t h a
s t a g g e r e d p a t t e r n o f 0.23-cm d i a m e t e r h o l e s t h a t w e r e 1.3-cm
on c e n t e r . The p l a t e was a t t a c h e d and s e a l e d t o a 1.3-cm2
c r i b b i n g s t r i p , which c i rcumvented t h e i n s i d e of t h e
i n c u b a t o r .
Water e n t e r e d e a c h i n c u b a t i o n u n i t below t h e p e r f o r a t e d p l a t e
t h r o u g h a 5-cm ( i n s i d e d i a m e t e r ) PVC p i p e a t 37 t o 38 l i t e r s
p e r minute . Water e n t e r i n g t h e i n c u b a t o r s was f i l t e r e d
t h r o u g h t w i n b a s k e t f i l t e r s w i t h 0.6-mm mesh s c r e e n i n s e r t s t o
remove o r g a n i c d e b r i s . Water t o a l l i n c u b a t i o n u n i t s was
unhea ted and n o t r e c i r c u l a t e d . Water and emergent f r y e x i t e d
t h e i n c u b a t o r th rough a 5-cm ( i n s i d e d i a m e t e r ) PVC d r a i n p i p e
l o c a t e d approx imate ly 1 0 c m below t h e t o p edge.
Egg I n c u b a t i o n :
The number o f l i v e eggs remaining a f t e r shocking and p i c k i n g
and t h o s e p u t i n t o each i n c u b a t i o n u n i t were de te rmined
g r a v i m e t r i c a l l y . Three subsamples were counted t o d e t e r m i n e
t h e number of eggs p e r u n i t o f we igh t . Eggs w e r e p l a c e d i n

incubators and "seeded" into the substrate by backflushing the
incubator while the eggs and substrate were washed down with a
hose. Water flows were then readjusted to 37 to 38 liters per
minute.
A test rack of incubators was installed to make access and fry counting easier. Three egg-loading densities were tested with
three replicate incubators for each test (Table 1). Three
additional incubation units were randomly selected from the
production system as controls.
Water flows and water chemistry were checked weekly, while
water temperature in the incubation units and Big Kitoi Creek
were reco-rded daily.
Fry Emergence and Enumeration:
Prior to fry emergence, collection troughs were positioned at
the outlets of all test and control incubators. Emergent fry
were retained in individual nets and enumerated on a daily
basis. Emergent fry were either hand counted or enumerated by
multiplying a know mean number of fry per unit weight by the
total weight of emergent fry from each unit. After counting,
fry were either placed in the production collection system,
retained for marking, or analyzed for fry quality.
An index net was placed in Big Kitoi Creek to capture wild
fry. Captured fry were enumerated daily and either released
back into the creek, retained for marking, or analyzed for
quality.
Fry Quality Samples:
Samples of 50 fish each were collected from test and control
incubators at approximately 25%, 50% and 75% of emergence.
Three samples of 50 fish each were taken from creek fry that
T a b l e 1. P i n k s a l m o n i n c u b a t i o n s c h e m a t i c i l l u s t r a t i n g e g g
l o t s a n d l o a d i n g d a t e s o f v a r i o u s d e n s i t y t e s t s c o n d u c t e d
a t the K i t o i Bay H a t c h e r y , 1 9 7 8 - 1 9 7 9 .
C o n t r o l - 1 7 5 , 0 0 0 e g g s l u n i t ( 0 . 9 5 e g g s / c m 3 )
Inc . 4 -9 Inc. 4 - 1 5 Inc. 5 - 2
L o t s 1 2 , 13 L o t 7 L o t 7
L o a d e d 1 0 / 1 9 / 7 9 L o a d e d 1 0 / 1 0 / 7 9 L o a d e d 1 0 / 1 1 / 7 9
I n c . 6 - 1 Inc. 6 - 3 Inc. 6 - 7
L o t 8 L o t 8 L o t 8
L o a d e d 1 0 / 1 1 / 7 9 L o a d e d 1 0 / 1 1 / 7 9 L o a d e d 1 0 / 1 1 / 7 9
D e n s i t y I1 - 2 3 0 , 0 0 0 e g g s l u n i t ( 1 . 2 5 e g g s / c m 3 )
Inc. 6 - 2 Inc. 6 - 6 Inc . 6 - 9
L o t 8 L o t 8 L o t 8
L o a d e d 1 0 / 1 1 / 7 9 L o a d e d 1 0 / 1 1 / 7 9 L o a d e d 1 0 / 1 3 / 7 9
D e n s i t y I11 - 2 6 0 , 0 0 0 e g g s / u n i t ( 1 . 4 1 e g g s / c m 3 )
Inc. 6 -4 Inc. 6-5 Inc. 6 - 8
L o t 8 L o t 8 L o t 8
L o a d e d 1 0 / 1 1 / 7 9 L o a d e d 1 0 / 1 1 / 7 9 L o a d e d 1 0 / 1 3 / 7 9

had been captured in the fyke net. We sampled wild fry when
we sampled ehe incubation units. All samples were preserved
in a 5% fornalin solution. After 6 weeks, all samples taken
on a single day were examined. Fork length and blotted
weights were recorded for individual fry.
A developme~t index: KD = lo 3/weight (mg) as used by Barns Length (mm)
(1970, 1972) was con~puted for individual fry. Additionally,
mean length and weight, variance, standard deviation and
error, and 95% confidence intervals for weight and length were
calculated for each sample.
Fry Marking and Release:
A percentage of the emergent fry was marked by removal of a fin or combination of fins for the purpose of estimating fry
to adult survival. Table 2 summarizes the various marked
groups evaluated, incubation sources for fry marking, fin
marks used for each control and test group, and the release
schedule for each group.
Marking procedures followed methods described in the ADF&G
Mark-Tag Manual for Salmon (Moberly et al. 1977). Marking
quality was monitored by taking a random sample of 20 fish per
2-hour marking period for each marker and by examining the
fish for completeness of fin removal. A discount was applied
to a clip when 25% or more of the fin was remaining, as
described by Barns and Crabtree (1976). The adjusted discount
was applied to the total number of fry marked during the
examination to obtain a corrected number of validly marked
fry.
Fin-clipped fry were held in recovery tanks for 5 - 12 hours prior to release. Dead fry were removed, counted, and
subtracted from the release records.

Table 2. Pink salmon fry marking design for evaluating ocean survival of fry released from the Kitoi Bay Hatchery,
1979.
Mark Treatment Fry Source Release Status
Ad Lv Test - Saltwater Rear Hatchery Short-term Rear
Production
Ad Rv Control - Unfed, Hatchery Volitional
Volitional Hatchery Production Release
Release
Rv Test - Incubation Density 111 Volitional
Density I11 Incubators Release
Lv Control - Incubation Hatchery Volitional
Control for Density I11 Production Release
LP T,est - Unfed, Hatchery Volitional Volitional Hatchery Production Release
Release
RP Control - Big Kitoi Big Kitoi Volitional Creek Wild Fry Creek Release

Marked and unmarked emergent fry were released from the
central fry- collection system through four polyethylene pipes,
5-cm diameter, which emptied into Big Kitoi Creek below the
index nets. All unfed fry released were liberated after dark
on a nightly basis. Marked and unmarked fry scheduled for
short-term rearing were transported to saltwater pens on a
daily basis.
Rearing and Estuarine Studies
Saltwater Rearing:
Emergent pink salmon fry from the production incubation system
were enumerated and transferred to saltwater rearing pens
within 24 hours after emergence. A portion of the emergent fry was marked and placed in rearing pens with unmarked fry.
Rearing pens, with a volume of 2 0 . 4 m3 and made of
0.32-cm mesh, were suspended from a square flotation collar.
The mass of fry reared per pen (82 kg of frylpen) was
calculated so that pen densities would not exceed 1.0 kg of fish per 0.125 m3 at the time of release.
Emergent fry were initially fed Oregon Moist starter mash.
When active feeding was observed, 1/32" Oregon Moist Pellets
were added to the diet in increasing amounts during a 5-day
period. All fry were fed at a rate of 5% body weight per day
for the entire rearing period.
Growth was monitored on a weekly basis, and feeding schedules
were adjusted accordingly. Pen maintenance was performed as
required.

F r y w e r e r e l e a s e d when t h e y a t t a i n e d a we igh t judged a s
s u i t a b l e f o r r e l e a s e , and when d e n s i t i e s o f zooplankton
i n c r e a s e d w i t h i n t h e bay.
E s t u a r i n e S t u d i e s :
Marine p la i ik ton abundance i n K i t o i Bay was moni tored weekly t o
p r e d i c t numbers o f food organisms a v a i l a b l e t o j u v e n i l e p ink
salmon. P l a n k t o n samples w e r e c o l l e c t e d from f o u r s t a t i o n s
w i t h i n t h e bay ( F i g u r e 1 ) . The s t a t i o n s w e r e s e l e c t e d i n
l o c a t i o n s where f r y had been obse rved f e e d i n g .
V e r t i c a l p l a n k t o n tows were made a t each s t a t i o n w i t h a 30-cm
d i a m e t e r - c o n i c a l n e t . Tows w e r e made from a d e p t h o f 1 2 . 2 m
t o t h e s u r f a c e a t s t a t i o n s 1, 3 , and 4 and 18.3 m t o t h e
s u r f a c e a t s t a t i o n 2 . P lank ton from each s t a t i o n was washed
i n t o a 125-ml b o t t l e c o n t a i n i n g 12.5 m l o f f o r m a l i n .
Samples were a n a l y z e d by p l a c i n g 1 - m l subsamples i n t o
Sedgewick-Rafter c o u n t i n g c e l l s . A g l a s s s l i d e w i t h two
.05-ml t e s t ce l l s was p l a c e d o v e r t h e c o u n t i n g c e l l , and t h e
number and t y p e s of organisms p e r t e s t c e l l ( f i v e t e s t
c e l l s / s a m p l e ) w e r e i d e n t i f i e d and enumerated.
P l a n k t o n d e n s i t i e s p e r s t a t i o n w e r e computed a s t h e number o f
p l a n k t e r s p e r c u b i c mete r by t h e f o l l o w i n g formula:
A C i N = ( - ) ( Y / X ) / (D) ( A ) n
A
where N = number of p l a n k t e r s per /m3, i = number o f p l a n k t e r s
p e r t e s t c e l l , n = number of t es t c e l l s a n a l y z e d ( 5 ) , Y =
volume o f e a c h sample (125 m l ) , X = t e s t c e l l volume ( .05 m l ) ,
D = l e n g t h o f tow i n m e t e r s , and A = a r e a o f n e t opening.
P l a n k t o n d e n s i t i e s w e r e averaged f o r a l l s t a t i o n s and graphed

by sample day to determine trends in food organism abundance.
Seawater temperature and salinity data taken at a depth of 1.0
m were recorded for each station per sample day.
Pink salmon fry were captured at random sites within Kitoi Bay
with a dip net and preserved in a 10% formalin solution. The
stomach contents were removed in the laboratory and examined
microscopically to enumerate the food organisms (Appendix B.
Tables 4 and 5).
Evaluation of Adult Salmon Returns in 1980
Commercial Catch Sampling:
A portion of the commercial seine catches in the southeastern
Afognak management district was sampled for marked, adult pink
salmon to estimate hatchery contribution to the commercial
fishery (Figure 2). Mixed stock fisheries in statistical
areas 252-31 and 252-32 were sampled through the entire seine
fishery. Total pink salmon catches were determined from fish
ticket data compiled at the end of the season. Commercial
catches within Kitoi Bay were also sampled.
Fish in commercial catches were examined individually as they
were unloaded onto cannery tenders. We collected data on the
location of catches, the total number of fish examined, and
the number and types of marks recorded. Whole weight and
mid-eye to tail-fork lengths were recorded from a subsample of
marked fish.
The estimated contribution of hatchery-produced pink salmon to
mixed stock commercial fisheries was calculated by the
following formula:
Hatchery Contribution = (Proportion of Hatchery Fish in
Catch)(Total Catch)

l zhut B a y
Figure 2. Pink Salmon commercial catch sampling locations
where interception of hatchery produced salmon occurred
in 1980.

where: Proportion in Catch =
(No. of Hatchery Fish Released) (No. Marks Recovered)
(No. of Marked Fish Released) (No. Adults Sampled)
Marked Adult Recovery at the Hatchery:
All returning pink salmon utilized for hatchery brood-stock
were examined for fin marks as they were spawned. Whole
weights and mid-eye to tail-fork lengths were recorded from a
subsample of the marked fish recovered. Adult pink salmon
which passed through the weir into Big Kitoi Creek were not
examined.
RESULTS
Incubation and Water Quality
An estimated 22.8 million pink salmon eggs were obtained in
1978. Green-to-eyed-egg survival was estimated at 84.1%,
(19,205,400 eggs survived). About 2.6 million eyed eggs were
loaded into nine test and three control incubation units at
the densities given in Table 1. The remaining 16.6 million
eyed eggs were seeded into 95 production incubators at a
density of approximately 175,000 eggs per unit.
The higher than expected mortality (15.9%) of green eggs was
assumed to have been associated with warm water temperatures
in the hatchery during early stages of egg development.
Hatchery water temperatures exceeded 14.5"C from 1 September
to 6 September (Figure 3). Combs (1965) found that the
mortality rate of sockeye salmon (0. nerka) eggs significantly - increased at temperatures exceeding 12.8"C. During early cell

13-
1 4 - 13- 12 -
1 1 10
9 _
8 -
7.
6 . 5.
4 -
3 A l e v i n incubat ion 2 -
1 . t", i
Sep. O c t . Nov. 8
Dec . 8 8
Jan. I
Feb. 8
Mar. 4
Apr , I
May
Figure 3. Kitoi Bay Hatchery water temperatures (1978-1979) and time lines of pink
salmon egg and alevin development.
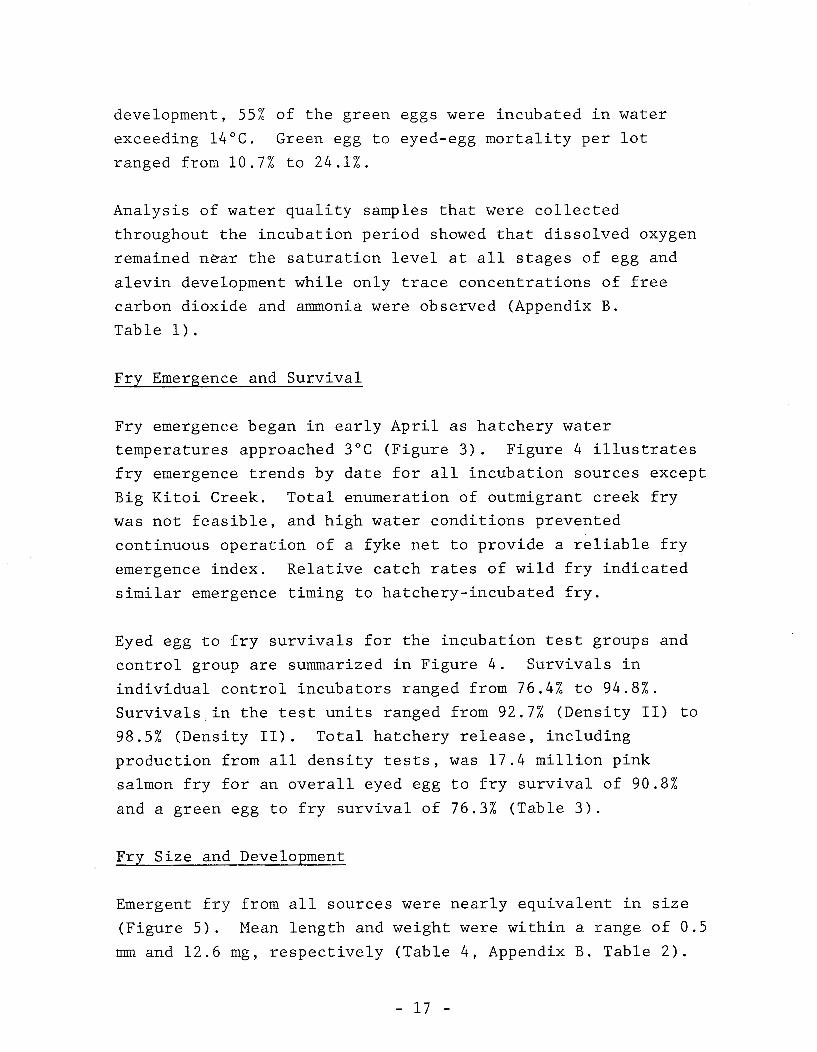
development, 55% of the green eggs were incubated in water
exceeding 14°C. Green egg to eyed-egg mortality per lot
ranged from 10.7% to 24.1%.
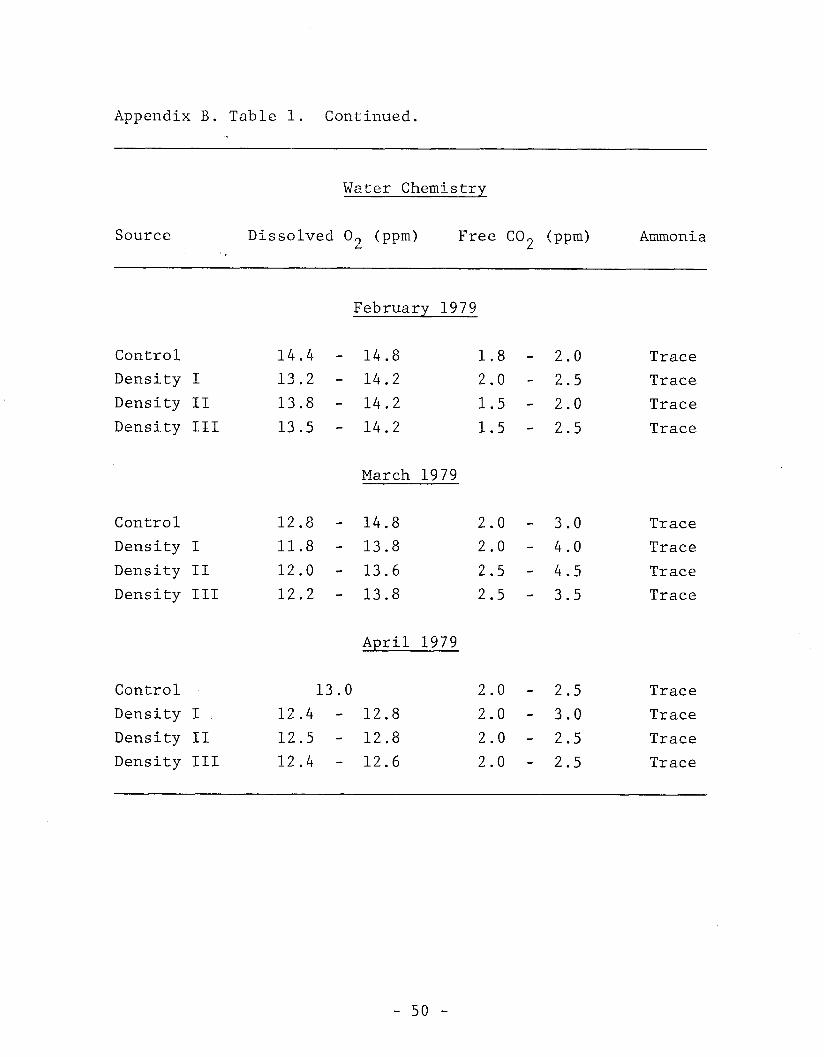
Analysis of water quality samples that were collected
throughout the incubation period showed that dissolved oxygen
remained near the saturation level at all stages of egg and
alevin development while only trace concentrations of free
carbon dioxide and ammonia were observed (Appendix B.
Table 1).
Fry Emergence and Survival
Fry emergence began in early April as hatchery water
temperatures approached 3°C (Figure 3). Figure 4 illustrates fry emergence trends by date for all incubation sources except
Big Kitoi Creek. Total enumeration of outmigrant creek fry
was not feasible, and high water conditions prevented
continuous operation of a fyke net to provide a reliable fry
emergence index. Relative catch rates of wild fry indicated
similar emergence timing to hatchery-incubated fry.
Eyed egg to fry survivals for the incubation test groups and
control group are summarized in Figure 4. Survivals in
individual control incubators ranged from 76.4% to 94.8%.
Survivals in the test units ranged from 92.7% (Density 11) to
98.5% (Density 11). Total hatchery release, including
production from all density tests, was 17.4 million pink
salmon fry for an overall eyed egg to fry survival of 90.8%
and a green egg to fry survival of 76.3% (Table 3).
Fry Size and Development
Emergent fry from all sources were nearly equivalent in size
(Figure 5). Mean length and weight were within a range of 0.5
mm and 12.6 mg, respectively (Table 4, Appendix B. Table 2).

loo 1 Control 0.95 eggs/ua3
- . . . . , . .
9 14 19 24 29 4 9 14 Apr i 1 May
(93.97%)
9 14 19 24 29 4 9 14 Apri 1 May
Figure 4. Pink salmon fry emergence timing and eyed-egg to fry
survival of four incubation density test groups at the
Kitoi Bay Hatchery, 1978-1979.

Table 3. Marked and unmarked pink salmon fry releases from Kitoi Bay Hatchery and Big
Kitoi Creek, 1979.
Experiment Fry Source
Marked Total
fry fry Mark release release
Test - Saltwater Rear
Control - Unfed, Volitional
I Hatchery Release P \L)
I Test - Incubation Density I11
Control - Incubation Control
Test - Unfed, Volitional Hatchery Release
Control - Wild Fry
Hatchery Production AdLv 31,389 3,122,260
Hatchery Production AdRv 42,246 5,059,377
Density I11 Incubators Rv 46,857 730,743
Hatchery Production Lv 47,354 5,670,757
Hatchery Production Lp 22,861 2,736,399
Big Kitoi Creek RP 6,425 116,740
Total: 197,132 17,436,276
Dens i ty 1 KD 1.950- . Density 3
Control Kg = 1.93- a
1 7.-
i- B l g K i t o i Creek KD = 1.920
Length (nml
Figure 5. Comparison of mean size and development (KD) of emergent pink salmon fry from
four hatchery incubation sources and Big Kitoi Creek, 1979.

Table 4 . Grand means of lengths, weights, and development
indices (KD) of pink salmon fry samples from Big Kitoi
Creek and hatchery incubation tests, 1 9 7 9 .
Source
Length (mm) Weight (mg) K~
Sample Std. Std. Std.
Size Mean Dev. Mean Dev. Mean Dev.
Big Kitoi Creek 1 4 5 3 3 . 4 1 . 5 2 6 3 . 2 3 1 . 7 1 . 9 2 0 . 0 8
Control 4 4 7 3 2 . 9 1 . 2 2 5 5 . 9 2 7 . 8 1 . 9 3 6 . 0 4
Density I 447 3 3 . 1 1 . 3 2 7 0 . 9 3 4 . 0 1 . 9 5 0 . 0 6
Density I1 4 5 0 3 3 . 2 1.1 2 6 4 . 4 2 9 . 3 1 . 9 3 3 . 0 4
Density 111 4 4 9 3 3 . 2 1 . 2 2 6 8 . 5 2 9 . 4 1 . 9 3 9 . 0 4

The ratio of weight to length, calculated as a development
index (KD),'expresses the increase in fry length and the
simultaneous decrease in weight due to yolk sac absorption as
emerged, unfed fry become more developed (KD decreases). Fry from Big Kitoi Creek were slightly more developed than
hatchery fry. Wild fry size and development were comparable
to data pre'sented by Blackett (1974).
Saltwater Rearing
Approximately 3.2 million emergent fry from the hatchery
production system were placed in ten 20.4-m3 saltwater rearing
pens located in Kitoi Bay, near the hatchery. Average fry
weight at- loading was 0.256 g for a calculated average rearing
density of 4.02 kg of fry per m3. All fry were reared for
approximately 36 days and released on 23 May at an average
weight of 0.669 g per fry. Overall mortality during rearing
was estimated at 2.56%. The estimated food conversion was
1.79 (total food fedltotal biomass gain). Seawater
temperatures ranged from 4.0°C to 8.1°C during rearing.
Reared fry that were larger than 0.5 g are typically released
in conjunction with increasing densities of zooplankton in the
nursery areas. However, in 1979, pen-cultured fry were
released prior to an increase in copepod density, although the
number of organisms per cubic meter was considerably less than
observed during an earlier plankton bloom (Figure 6).
Marine Plankton
The most common food items in stomach samples of pink salmon
fry that were captured in Kitoi Bay were copepods, barnacle
nauplii, and barnacle cyprids. As determined from fry stomach

Figure 6. Marine plankton densities and seawater temperatures in Kitoi Bay, 15 April
through 30 May, 1979.

contents, these were preferred organisms. Consequently, an
increase in.these species was used to time the releases of
reared fry.
Zooplankton densities were relatively low until late April
when a major increase in copepod abundance was observed
(Figure 6):- Copepod densities peaked near 1 May and 11 May
with 3,626 and 2,900 organisms per m3 observed, respectively.
Densities declined to 508 organisms per m3 during the last
week in May.
Peak emergence of hatchery fry occurred between 24 April and 4
May when large numbers of food organisms were available in
Kitoi Bay-. Pen cultured fry released on 23 May encountered
lower numbers of food organisms, but increasing abundance of
copepod nauplii in the 23 May and 29 May plankton samples
suggested increases in adult copepod densities in early June.
Kacyznski et al. (1973), Bailey et al. (1975), and Kron and
Yuen (1976) found that juvenile pink salmon did not consume
various planktonic organisms in proportion to plankton species
availability in rearing pens. Limited analysis of fry stomach
contents suggests that this was also true for pink salmon fry
in Kitoi Bay. On 1 May, plankton samples consisted of 28.1%
copepods, 45.5% barnacle nauplii, 7.3% barnacle cyprids, and
19.1% copepod nauplii, hydromedusea, cladocerans, and isopods
(Appendix B. Table 3). Stomach contents of fry (n = 10)
caught on 2 May were comprised of 70.1% copepods, 17.4%
barnacle nauplii, 9.8% barnacle cyprids, and 2.7% amphipods,
cumaceans and isopods (Appendix B. Table 4).
Plankton samples collected on 15 May consisted of 7.1%
copepods, 62.9% barnacle nauplii, 6.1% barnacle cyprids, and
13.9% copepod; nauplii, gastropod larvae, cladocerans, and
cumaceans (Appendix B. Table 3). Stomach contents of fry

(n = 10) caught on 16 May consisted of 93.6% copepods, 1.4%
barnacle nauplii, 1.1% barnacle cyprids, and 3.9% cumaceans,
cladocerans, amphipods, and invertebrate eggs (Appendix B.
Table 5 ) .
Ocean Survival and Adult Returns
Examination for marked adult pink salmon returning from the
1979 release began on 23 July 1980 with the commencement of
commercial fishing activities in the east Afognak district and
was completed on 15 September with the termination of hatchery
egg-take activities. A total of 244,000 pink salmon were
examined for marks (fishery and hatchery brood-stock) with a
recovery-of 929 marked fish. Commercial catches were sampled
throughout the entire season in three primary interception
areas for pink salmon returning to Kitoi Bay.
In the Duck Bay (251-32) and Izhut Bay (251-31) areas, catches
were comprised of hatchery, Big Kitoi Creek, and native stocks
from systems on Afognak and Kodiak Islands. The terminal
fishery inside Kitoi Bay was comprised of hatchery and wild
fish from Big Kitoi Creek. The estimated contribution of
hatchery- and creek-produced pink salmon to commercial catches
and adult returns to the facility are summarized in Table 5.
Fry to adult survival of hatchery- and creek-produced pink
salmon was calculated from the ratio of marked adults in the
return versus the number of validly marked fry released per
incubation source. The methods for this, described in
Appendix A, were applied to mark recovery data to correct for
differential marking mortality between pectoral and ventral
clips and differential mortality between marked and unmarked
groups. The average ocean survival of unfed volitionally
released hatchery fry was 1.89% with a range of 1.62% to 2.02%
(Table 6). The combined unfed, volitional-release groups

Table 5. Summary of Kitoi Bay Hatchery and Big Kitoi Creek
pink salmon production, commercial catch contribution,
and return to the facility, 1978 brood.
Contribution Hatchery Natural Total Range
Source "- Production Production Return @ 95% C.I.
(* 80 CI) (k 80 CI)
Mixed stock 153,974 1,351 155,325 137,144 - fisheries (*17,654) (A527) 173,506
Kitoi Bay 123,580 1,085
catches (t241)z1
Broodstock 83,671 725
and (A120)a/ - escapement
a/ Estimates based on fin mark recoveries. - b/ Actual catch and return data derived from fish tickets -
and hatchery records, respectively.

T a b l e 6 . E s t i m a t e d o c e a n survival o f v a r i o u s g r o u p s o f p i n k
s a l m o n f r y r e l e a s e d f r o m the K i t o i Bay H a t c h e r y a n d B i g
K i t o i C r e e k , 1 9 7 9 .
Number o f P e r c e n t
Number o f A d u l t s Ocean
R e l e a s e Group Mark F r y R e l e a s e d R e t u r n i n g S u r v i v a l
S a l t w a t e r r e a r e d Ad L v 3 , 1 2 0 , 0 0 0 8 7 , 8 0 0 2 . 8 1
Unfed V o l i t i o n a l Ad Rv 5 , 0 6 0 , 0 0 0 8 1 , 9 0 0 1 . 6 2
re lease -
D e n s i t y III
U n f e d V o l i t i o n a l L v 5 , 6 7 0 , 0 0 0 1 1 5 , 3 0 0 1 . 6 2
release
B i g K i t o i C r e e k
U n f e d V o l i t i o n a l LP 2 , 7 4 0 , 0 0 0 3 , 1 6 0 2 . 7 1
release

t o t a l l e d 77.2% of t h e h a t c h e r y r e l e a s e and 69.7% of t h e a d u l t
r e t u r n . Ocean s u r v i v a l was 2.71% f o r w i l d f r y from Big K i t o i
Creek and 2.81% f o r s h o r t - t e r m r e a r e d f i s h . A s i n g l e
i n c u b a t i o n d e n s i t y t e s t (Dens i ty 111, 1 . 4 1 eggs/cm3 o f
s u b s t r a t e ) , i n which w e e v a l u a t e d a l l l i f e s t a g e s th rough t h e
a d u l t r e t u r n , r e s u l t e d i n f r y t o a d u l t s u r v i v a l o f 2.61%.
A c h i - s q u a r e s t a t i s t i c c o r r e c t e d f o r c o n t i n u i t y (Snedecor and
Cochran, 1967) was c a l c u l a t e d f o r each i n c u b a t i o n and r e l e a s e
exper iment t o t e s t f o r s i g n i f i c a n t d i f f e r e n c e s i n mar ine
s u r v i v a l o f f r y r e l e a s e d from t h e tes t and c o n t r o l g roups
(Tab le 7 ) . For e a c h exper iment t h e c h i - s q u a r e v a l u e was
c a l c u l a t e d from t h e obse rved and e x p e c t e d f r e q u e n c i e s o f f i n
marks tha - t w e r e found and n o t found i n t h e a d u l t r e t u r n .
The s i z e o f r e t u r n i n g a d u l t s v a r i e d o n l y s l i g h t l y between t h e
r e a r e d and d e n s i t y tes t groups and t h e c o r r e s p o n d i n g c o n t r o l
g roups (Tab le 8 ) . Re tu rn ing a d u l t s from t h e s h o r t - t e r m r e a r e d
group w e r e s l i g h t l y s m a l l e r t h a n a d u l t s from t h e c o n t r o l
g roup , a s was t h e c a s e w i t h r e a r i n g s t u d i e s conducted by
Mar t in e t a l . (1981) . Both s e x e s from t h e Big K i t o i Creek
w e r e s m a l l e r t h a n a l l o t h e r g roups measured. The s m a l l e r s i z e
o f f i s h i n t h e s e g roups may have been caused by t h e p e c t o r a l
mark.
DISCUSS I O N
Based on t h e r e s u l t s of i n c u b a t i o n t e s t s e v a l u a t i n g egg t o f r y
s u r v i v a l and f r y development , K i t o i i n c u b a t i o n u n i t s can b e
o p e r a t e d a t eyed egg d e n s i t i e s up t o 1 . 4 1 eggs p e r cm3 o f
s u b s t r a t e . T h e o r e t i c a l l y , t h e u n i t s c o u l d be o p e r a t e d a t
h i g h e r d e n s i t i e s s i n c e none o f t h e measured p h y s i c a l
p a r a m e t e r s have i n d i c a t e d s i g n s o f env i ronmenta l stress t o
i n c u b a t i n g a l e v i n s o r emergent f r y . F ry t h a t w e r e r e l e a s e d

T a b l e 7 . Summary o f c h i - s q u a r e c a l c u l a t i o n s t o t e s t f o r
s i g n i f ' i c a n t d i f f e r e n c e s i n mar ine s u r v i v a l f o r t h r e e p i n k
salmon f r y r e l e a s e e x p e r i m e n t s , K i t o i Bay Hatchery , 1979.
Experiment
E s t i m a t e d C a l c u l a t e d Dec i s ion
Marine c h i - s q u a r e
S u r v i v a l
8
S a l t w a t e r Reared F r y 2.81 S i g n i f i c a n t d i f f e r e n c e
v e r s u s 11.53 i n s u r v i v a l s
Unfed, V o l i t i o n a l (P < - 0 1 )
Hatchery Re leased Fry 1 .62
I n c u b a t i o n
D e n s i t y 111,
r e l e a s e d unfed
v e r s u s
P r o d u c t i o n I n c u b a t i o n
D e n s i t y , r e l e a s e d
unfed
No s i g n i f i c a n t
d i f f e r e n c e i n
s u r v i v a l s
Rig K i t o i Creek Wild S i g n i f i c a n t d i f f e r e n c e
F r y 2 . 7 1 i n s u r v i v a l s (. 0 1 < p
v e r s u s 6.56 < .05)
Unfed, V o l i t i o n a l
Hatchery Re leased Fry 2 . 0 2

Table 8. Mean lengths and weights of marked adult pink salmon
recovered from commercial catches and hatchery
brood-stock, Kitoi Bay, 1980.
Treatment '
Sample Mean Mean
Mark Size Length (cm) Weight (kg)
Test - Saltwater rear Ad .Lv 4 6
Control ---Unfed Ad Rv 51
volitional hatchery
release
Test - Incubation Rv 7 6
Density I11
Control - Incubation L v 77 Control for Density 111
Test - Unfed volitional Lp 2 4
hatchery release
Control - Big Kitoi RP 15 Creek wild fry
- Continued -

Table 8. Continued.
Treatment
Sample Mean Mean
Mark Size Length (cm) Weight (kg)
Test - Saltwater rear Ad Lv 35
Control - Unfed A d R v 3 4
volitional hatchery
release --
Test - Incubation Density 111
Control - Incubation I,v 4 6
Control for Density I11
Test - Unfed volitional Lp 19
hatchery release
Control - Big Ritoi RP 11
Creek wild fry

from t h e h iqh d e n s i t y i n c u b a t i o n group s u r v i v e d i n t h e ocean
a t a h igher ' r a t e o f ocean s u r v i v a l t h a n f r y from t h e
c o r r e s p o n d i n g c o n t r o l group. Although t h e c h i - s q u a r e t e s t d i d
n o t show a s i g n i f i c a n t d i f f e r e n c e .
I n c u b a t i o n d e n s i t y t e s t s demons t ra te t h a t t h e p r o d u c t i o n
c a p a c i t y OF t h e K i t o i Bay Hatchery can be i n c r e a s e d from 2 1
m i l l i o n t o 31 m i l l i o n eggs a n n u a l l y w i t h o u t modify ing t h e
p r e s e n t i n c u b a t i o n system. A d d i t i o n a l t e s t i n g w i l l p robab ly
i n d i c a t e t h a t t h e f a c i l i t y p r o d u c t i o n c a p a c i t y can b e
i n c r e a s e d f u r t h e r .
A s shown by t h e r e s u l t s o f pen c u l t u r e s t u d i e s , s h o r t - t e r m
s a l t w a t e r r e a r i n g w i l l s i g n i f i c a n t l y i n c r e a s e t h e ocean
s u r v i v a l o f ha tchery-produced p i n k salmon. Although f r y
r e l e a s e t i m i n g undoubtedly i n f l u e n c e s ocean s u r v i v a l , r e a r i n q
exper iments a t K i t o i Ray t o d a t e have n o t been s p e c i f i c enough
t o q u a n t i f y t h e e f f e c t s o f r e l e a s i n g r e a r e d f r y a t d i f f e r e n t
l e v e l s o f e s t u a r i n e p r o d u c t i v i t y . Moreover, t h e concep t o f
" o p t i m a l r e l e a s e t i m i n g " h a s n o t been d e f i n e d e f f e c t i v e l y .
Comprehensive r e a r i n g s t u d i e s , s i m i l a r t o t h o s e conducted by
Mar t in e t a l . (1980) a t L i t t l e P o r t W a l t e r , would p r o v i d e
q u a n t i t a t i v e i n f o r m a t i o n c o n c e r n i n g r e l e a s e t i m i n g of f r y
r e a r e d a t t h e K i t o i Bay f a c i l i t y .
Marine p l a n k t o n d e n s i t i e s , s p e c i f i c a l l y d e n s i t i e s o f p r e f e r r e d
food organisms such a s copepods, a r e g e n e r a l i n d i c a t o r s o f
e s t u a r i n e f e e d i n g c o n d i t i o n s . S i n c e o b s e r v a t i o n s o f mar ine
p l a n k t o n d e n s i t i e s began i n 1976, r e l e a s e s o f p ink salmon f r y
t h a t were r e a r e d f o r 30 t o 4 0 days have g e n e r a l l y c o i n c i d e d
w i t h i n c r e a s i n g d e n s i t i e s of p r e f e r r e d food organisms t h a t
o c c u r n e a r t h e end o f May. Based on t h e c o n s i s t e n t t r e n d i n
mar ine p l a n k t o n blooms, t h e h a t c h e r y manager can p l a n food
r e q u i r e m e n t s and f r y r e l e a s e s a c c o r d i n g l y .

The analyses of pink salmon fry stomach contents, in relation
to standing ,crops of marine zooplankton, indicate that
juvenile pink salmon in Kitoi Bay are selective grazers with a
preference for copepods. Studies have shown that zooplankton
densities generally do not begin to increase until the later
part of April. Outmigrant hatchery fry begin entering the
estuary in 2arly April and normally encounter poorer feeding
conditions than those of the late hatchery-released or
short-term reared fry. A 2-week minimal rearing period for
all hatchery fry, with releases scheduled on a weekly basis,
would distribute large hatchery releases of pink salmon fry
over time, and would, theoretically, buffer the impact on
standing crops of preferred food organisms as well as delaying
the seaward migration slightly so that hatchery-produced fry
would encounter improved feeding conditions in the estuary.
This assumes that pen-reared fry will remain in Kitoi Bay and
exhibit similar feeding habits as the fry analyzed in this
study. This assumption needs to be verified.
The results of the recovery progrzm for marked adults clearly
illustrate that salmon production in the east Afognak fishing
district has been enhanced as a result of pink salmon fry
releases from the Kitoi Bay Hatchery. Hatchery contributions
have provided supplemental production to mixed stock cape
fisheries as well as additional fleet fishing opportunities
through the terminal harvest of pink salmon in Kitoi Bay.
ACKNOWLEDGEMENTS
The authors wish to thank the many technicians and fish
culturists who assisted in the field work associated with the
project. Special appreciation is extended to Tim Joyce and
Ron Davis at the Kitoi Bay Hatchery for their laborious

efforts during the hatchery phases of the project. We also
thank Roger 'Blackett for project direction and support and
critical review of the manuscript.
REFERENCES
Anon. 1980. Fish Culture Manual (Preliminary Copy), Fisheries
Rehabilitation, Enhancement, and Development Division,
Alaska Department of Fish and Game, Juneau, Alaska.
Bailey, J. E. 1972. Report of progress on a pilot study of
the feasibility of producing high quality salmon fry from
gravel environments. PJMFS, Auke Bay Bio. Lab.
Unpublished ms. 30 pp.
. 1973. Report of progress on a pilot study of the
feasibility of producing high quality salmon fry from
gravel environments. NMFS, Auke Bay Bio. Lab.
Unpublished ms. 3 pp.
Eailey, J. E., B. L . Wing, and C. R. Mattson. 1975.
Zooplankton abundance and feeding habits of fry of pink
salmon, Oncorhynchus gorbuscha, and chum salmon,
Oncorhynchus keta in Traitors Cove, Alaska, with -9
speculations on the carrying capacity of the area. Fish.
Bull. 73(4): 846-861.
Barns, R. A. 1970. Evaluation of revised hatchery method
tested on pink and chum salmon fry. J. Fish. Res. Bd.
Canada. 27:1429-1452.

. 1972. A quantitative evaluation of survival to
the adult stage and other characteristics of pink salmon
(Oncorhynchus gorbuscha) produced by a revised hatchery
method which simulates optimal natural conditions. J.
Fish. Res. Bd. Canada. 29:1151-1167.
Bams, R. A.*'and D. G. Crabtree. 1976. A method for pink
salmon propagation: The Headquarters Creed Experimental
Hatchery, 1968-1974. Fish. Marine Serv. Tech. Rept. 627.
Blackett, Roger F. 1974. Preliminary evaluation of pink
(Oncorhynchus gorbuscha) and sockeye (0. nerka) salmon - incubation and rearing in gravel incubators and troughs.
Alaska Dept. of Fish and Game Tech. Data Rept. 17. 32
PP .
. 1980. Method of analysis for allocation of
marked and unmarked pink salmon returns at Kitoi Bay.
Alaska Dept. Fish and Game, Division of Fisheries
Rehabilitation, Enhancement and Development, Hatchery
Evaluation through Marking and Tagging, Regional
Workshop. Unpublished. 5 pp.
Combs, Bobby D. 1965. Effect of temperature on development
of salmon eggs. Prog. Fish-Cult. 27(3):134-137.
Dudiak, Nick C. and Alan Quimby. 1979. Tutka Lagoon Hatchery
1977-1978 production report and subsequent 1979 adult
return evaluation. Alaska Dept. Fish and Game, Division
of Fisheries Rehabilitation, Enhancement and Development.
Unpublished ms. 74 pp.

Heard, W. R. 1978. An overview of adult coho and pink salmon
returns in 1977 from releases of marked juveniles at
Little Port Walter, Alaska. Annual American Fisheries
Society, Alaska Chapter Meeting, Sitka, Alaska. Feb.
21-24, 1978.
Kaczynski, V . W. , R. J. Feller, J. Clayton, and R. J. Gerke. 1973. Trophic analysis of juvenile pink and chum salmon
(Oncorhynchus gorbuscha and - 0. - keta) in Puget Sound. F .
Fish. Res. Bd. Canada. 30:1003-1008.
Kron, T. M. and H.J.K. Yuen. 1976. Spring estuarine
productivity as an indicator for release timing of pink
salmon (Oncorhynchus gorbuscha) fry. Alaska Dept. of
Fish and Game, Division of Fisheries Rehabilitation,
Enhancement and Development. 75 pp.
Leon, Kenneth A. 1975. Improved growth and survival of
juvenile Atlantic salmon (Salmo salar) hatched in drums
packed with labyrinthine plastic substrate. Prog.
Fish-Cult. 37(3):158-163.
Martin, R. W., W. R. Heard, and A. C. Wertheimer. 1981. Short-term rearing of pink salmon (Oncorhynchus
gorbuscha) fry: effect on survival and biomass of
returning adults. Can. J. Fish. Aquatic Sci.
38 : 554-558.
McDaniel, Tim. 1980. Short-term rearing of pink salmon
(Oncorhynchus gorbuscha) fry at the Kitoi Bay Hatchery.
Northeast Pacific Pink and Chum Workshop, Feburary, 1980.

Moberly, S. A., Rita Miller, Karen Crandall, and Steve Bates.
1977. 'Mark-Tag Manual for Salmon. Alaska Dept. of Fish
and Game, Division of Fisheries Rehabilitation,
Enhancement and Development. 56 pp.
Snedecor, G. W., and W. G. Cochran. 1967. Statistical
~iethod*~. Iowa State University Press, Ames, Iowa. 593
PP .

A P P E N D I X A

A METHOD OF ANALYSIS FOR ALLOCATION OF MARKED
AND UNMARKED P I N K SALMON RETURNS AT KIT01 BAY
Step 1. Calcula tes t h e handicap f o r p e c t o r a l f i n c l i p s when
both v e n t r a l and pec to ra l c l i p s a r e used.
~ ' e n t r a l c l i p recovery
No. marked f r y re leased = Marked r e t u r n
Pec to ra l c l i p recovery
No. marked f r y re leased = Marked r e t u r n
Marked r e t u r n v e n t r a l c l i p - marked r e t u r n p e c t o r a l
c l i p = Handicap
Rv .0036 - Rp .0014 = , 0 0 2 2 Handicap
Handicap + p e c t o r a l c l i p marked r e t u r n = Adjusted
p e c t o r a l c l i p r e t u r n
Adjusted pec to ra l c l i p r e t u r n x No. marked f r y
re leased = Adjusted No. pec to ra l c l i p f i s h
recovered.

When an experiment or evaluation requires the use of
ventral and pectoral fin clips in a comparison of
survival, it is necessary to evaluate differential
mortality between fin clips. The same fry source
and equivalent marking, handling, and release must
be used for the pectoral and ventral fin clip group
when they are used to determine differential
mortality. The assumption is made that there is no - difference between right and left fin clips. This
allows either a right or left pectoral fin to be
clipped for a test and leaves the remaining fin
available for determining differential mortality.
Evaluation of double clips (i.e. both ventrals) is
-impossible by this method.
Step 2. After adjustments of pectoral fin clip returns
(step I), calculate the percent of marked fish in all fish examined and the number of marked fish in
the return for each clip group.
Number of marked fish recovered
Number of fish examined x 100 = % marked
AdLV 84 69,594 x 100 = 0.12%
AdRV 41
69,594 x 100 = .06%

Etc .
Commercial Catch + Broodstock ti Morta l i ty + Big
K i t o i Creek escapement = Tota l Return
% Marked of those examined x Tota l r e t u r n = Marked
f i s h i n r e t u r n
AdLV . 0 0 1 2 x 2 3 5 , 3 2 1 = 282
AdRV . 0 0 0 6 x 2 3 5 , 3 2 1 = 1 4 1
LV , 0 0 1 1 x 2 3 5 , 3 2 1 = 259
Rp . 0 0 0 7 x 2 3 5 , 3 2 1 = 1 6 5
Etc .
This s t e p p r o j e c t s the a c t u a l percent recovery f o r each
f i n c l i p recovered t o the t o t a l r e t u r n . The r e s u l t i s a
pro jec ted number of marked f i s h f o r each f i n c l i p i n t h e
t o t a l r e t u r n .
Step 3 . Calcula tes t h e percent r e t u r n of marked f r y re leased
using t h e t o t a l marked f i s h of each group i n the
t o t a l r e t u r n .
Tota l marked f i s h i n r e t u r n
Marked fry r e l eased x 1 0 0 = % Return
AdLV 282
3 1 , 6 5 8 x 1 0 0 = 0 . 8 9 %

AdRV 1 4 1
1 8 , 9 9 6 x 1 0 0 = 0 . 7 4 %
E t c .
T h i s i s t h e p e r c e n t o f m a r k e d f r y o f each f i n c l i p
g r o u p p r o j e c t e d t o b e i n the t o t a l r e t u rn .
S t e p 4 . C a l c u l a t e s the r e tu rn e x p e c t e d f r o m the t o t a l f r y
r e l e a s e d f r o m each i n c u b a t i o n s o u r c e .
% M a r k e d i n return x T o t a l f r y r e l e a s e d = E x p e c t e d
r e turn
AdLV 0 . 8 9 x 1 , 8 5 1 , 6 0 4 = 1 6 , 4 7 9
AdRV 0 . 7 4 x 7 0 3 , 3 4 9 = 5 , 2 0 5
LV 0 . 8 1 x 1 2 , 7 1 3 , 2 1 1 = 1 0 2 , 9 7 7
Rp 1 . 2 8 x 1 2 , 9 6 1 = 1 6 6
E t c .
T h e sum o f t h e e x p e c t e d r e t u rn f o r each i n c u b a t i o n
s o u r c e i s the t o t a l e x p e c t e d re turn i . e . :
1 6 , 4 7 9 t 5 , 2 0 5 t 1 0 2 , 9 7 7 + 1 6 6 + e t c . = 1 5 8 , 6 2 2
T h e e x p e c t e d r e tu rn i s p r o j e c t e d d i r e c t l y f r o m
m a r k e d f i s h r e c o v e r y . T h e known re tu rn i n 1 9 7 9 o f
2 3 5 , 3 2 1 i s 7 6 , 6 9 9 f i s h g r e a t e r than the e x p e c t e d

return of 158,622. The reason for this is that
marked fish have a substantially higher mortality
than unmarked fish. A handicap ratio for marked
pink salmon of 37-49% was observed in experiments
reviewed by Ricker (1976). Steps 5 & 6 adjust for
this mortality factor.
Step 5. Calculates the percent contribution of each source
to the total expected return.
Return for each source 100 = % Contribution to
expected
Total expected return x re turn
AdRV 16,479
158,622 x 100 = 10.39%
AdRV 5,205
158,622 x 100 = 3.28%
Etc.
Step 6. Calculates the adjusted contribution of each source
to the total return.
% contribution x Total return = Adjusted source
contribution

Step 7
AdLV 0 . 1 0 3 9 x 2 3 5 , 3 2 1 = 2 4 , 4 5 0
AdRV . 0 3 2 8 x 2 3 5 , 3 2 1 = 7 , 7 1 8
LV 0 . 6 4 9 2 x 2 3 5 , 2 3 1 = 1 5 2 , 7 7 0
Rp . 0 0 1 0 x 2 3 5 , 3 2 1 = 2 3 5
Etc.
Calculates % recovery (survival) for each source
contributing to the total return.
Adjusted source contribution
Number of fry released x100=%recovery(survival)
AdLV 2 4 , 4 4 9
1 , 8 5 1 , 6 0 4 x 1 0 0 = 1 . 3 2 %
AdRV 7 , 7 1 8
7 0 3 , 3 4 9 x 1 0 0 = 1 . 1 0 %
LV 1 5 2 , 7 6 5
1 2 , 7 1 3 , 2 1 1 x 1 0 0 = 1 . 2 0 %
RP 2 3 5 1 2 , 9 6 1 x 1 0 0 = .81%
Etc.
The following must be known at Kitoi:
1. Total number of fry released from each
incubation source contributing to the return.
This includes natural production.

2. Total number of valid marked fry released from
each incubation source contributing to the
return.
3. An estimate of total salmon return.
TKe following assumptions are accepted:
1. No difference in mortality between right and
left clips of paired fins.
2. Ratio of marked fish recovered truly represents
the ratio in the total return.
3 . Commercial fishery is non-selective of marked
and/or unmarked fish.
The following are sources of error:
1. Regeneration of fins. Regeneration of clipped
ventral fins on pink salmon fry held in
saltwater pens at Kitoi for 6 months resulted
in 30% of the marks being unidentifiable.
2. Failure to detect marked fish equivalently
during recovery examination, i.e. adipose fin
clip not detected as easily as pelvic fin clip.
3 . Pre-emergent fry index estimator of natural
creek fry production in error.
4 . Failure of the hatchery to accurately assess
number of fry released for each source
represented by a fin clip.

5. Inadequate recovery of marked fish in the
fishery (area and number of fish examined).
6. Inaccurate total return estimate.
7. Failure in the marking design to treat all
* groups of marked fry equivalently.
APPENDIX A. REFERENCES
Ricker, W. E. 1976. Review of the rate of growth and
mortality of pacific salmon in saltwater and noncatch
mortality caused by fishing. J. Fish. Res. Board Can.
33(7) 1483-1522.

A P P E N D I X B

LIST OF APPENDIX B TABLES
Table Page
1. Range of water chemistry at the Kitoi Bay Hatchery
. . . . . . . . . . . . . . during incubation studies, 1978-1979 49
2. Mean lengths, weights, and development indices
(KD) of emergent pink salmon fry by sample date
. . . . . . . . and source at the Kitoi Bay Hatchery, 1979 51
3 . Mean number of plankters/m3 and percent
compositiorl of marine plankton for all stations
. . . . . . . . . . . . . . . . . . . . . . . combined in Kitoi Bay, 1979 54
4 . Stomach contents of pink fry caught in Kitoi Bay,
2 May, 1979 . . . . . . . . . . . . . . . . . . . . . . . . . . . . . . . . . . . . . . . 56
5. Stomach contents of fry caught in Kitoi Bay,
May 16, 1979 . . . . . . . . . . . . . . . . . . . . . . . . . . . . . . . . . . . . . . 58

Appendix B . Table 1. Range of water chemistry a t t h e K i t o i
Bay Hatchery during incubat ion s t u d i e s , 1978-1979 .
Water Chemistry -
Source Dissolved O2 (ppm) Free C 0 2 (ppm) Ammonia
November 1 9 7 8
Control 1 2 . 5 - 1 3 . 1 2 . 0 - 3 . 5 Trace
Density I 1 2 . 0 - 1 2 . 8 2 . 0 - 3 . 5 Trace
Density II 1 1 . 8 - 13.1 2 . 0 - 2 . 5 Trace
Density I11 1 2 . 0 - 1 3 . 1 2 . 0 - 2 . 5 Trace
December 1 9 7 8
Control 1 3 . 9 - 1 4 . 2 0 . 1 5 - 2 . 0 Trace
Density I 1 2 . 5 - 1 4 . 6 0 . 2 0 - 2 . 5 Trace
Density X I 1 3 . 9 - 1 4 . 2 0 . 2 5 - 2 . 5 Trace
Density I11 1 3 . 9 - 1 4 . 4 0 . 2 0 - 2 . 0 Trace
January 1 9 7 9
Control 1 3 . 8 - 1 4 . 8 2 . 0 - 2 . 5 Trace
Density I 1 3 . 5 - 1 4 . 4 1 . 5 - 3 . 0 Trace
Density X I 1 3 . 8 - 1 4 . 4 1 . 5 - 3 . 0 Trace
Density I11 1 3 . 6 - 1 4 . 4 2 . 0 - 3 . 0 Trace
- Continued -
Appendix B. Table 1. Continued.
Water Chemistrv
Source Dissolved O 2 (ppm) Free C o p (ppm) Ammonia
Control
Density I
Density I1
Density 1x1
Control
Denskty I
Density I1
Density 111
Control
Density I
Density I1
Density I11
Februarv 1979
March 1979
April 1979
Trace
Trace
Trace
Trace
Trace
Trace
Trace
Trace
Trace
Trace
Trace
Trace

Appendix B. Table 2 . Mean lengths, weights, and development indices (KD) of emergent
pink salmon fry by sample date and source at the Kitoi Bay Hatchery, 1 9 7 9 .
Length (m) Weight (mg) KD Index
Collection Sample Standard Standard v' Standard
Source Date Size Mean Deviation Mean Deviation Mean Deviation
Big Ritoi Creek 4 / 2 4 47 3 3 . 3 2 . 2 2 6 6 2 6 1 . 9 3 5 0 . 1 4
4 / 2 6 4 8 3 3 . 3 1 . 2 2 5 5 3 1 1 . 9 0 0 0 . 0 5
5 / 0 1 5 0 3 3 . 5 1 . 2 2 6 9 3 8 1 . 9 2 4 0 . 0 6
Control Inc. 415 4 / 2 4 5 0 3 3 . 5 1 . 2 2 5 1 2 5 1 . 9 3 9 0 . 0 4 2 I
Cn 4 / 2 5 5 0 3 3 . 3 1 . 0 2 5 1 2 4 1 . 8 8 9 0 . 0 3 2
I-' 4 / 3 0 5 0 3 2 . 6 1 . 2 2 5 3 26 1 . 9 4 1 0 . 0 2 9 I
Inc. 5 2 4 / 2 4 47 3 2 . 7 1 . 3 248 2 9 1 . 9 2 1 0 . 0 5 8
4 / 2 5 5 0 3 2 . 3 1 . 3 245 26 1 . 9 3 8 0 . 0 4 4
Inc. 49 5 1 2 5 0 3 3 . 3 1 . 3 270 29 1 . 9 4 2 0 . 0 4 1
5 1 4 5 0 3 2 . 7 1.1 264 3 1 1 . 9 6 0 0 . 0 4 5
5 1 6 50 3 2 . 8 1 . 3 260 3 1 1 . 9 4 4 0 . 0 3 5
- Continued -
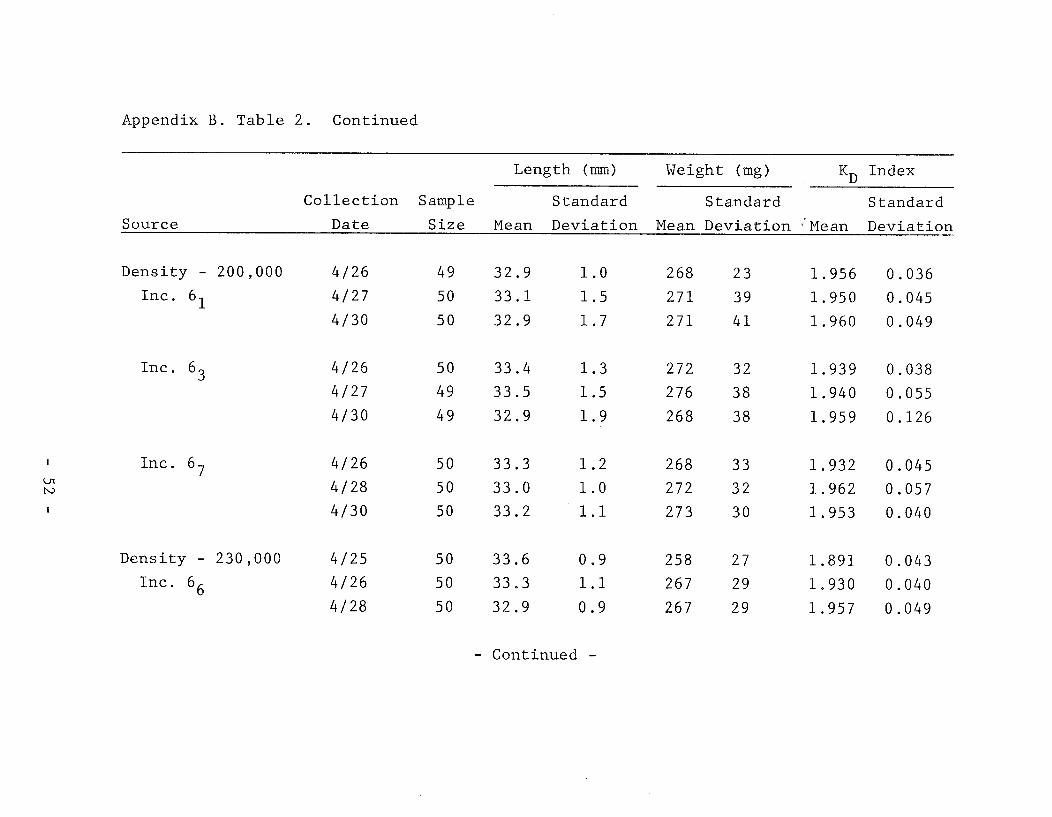
Appendix B. Table 2 . Continued
Length (mm) Weight ( m g ) KD Index
Collection Sample Standard Standard Standard
Source Date Size Mean Deviation Mean Deviation - ~ e a n Deviation
Density - 2 0 0 , 0 0 0 4 / 2 6 4 9 3 2 . 9 1 . 0 2 6 8 2 3 1 . 9 5 6 0 . 0 3 6
Inc. 6 i 4 / 2 7 5 0 3 3 . 1 1 . 5 2 7 1 3 9 1 . 9 5 0 0 . 0 4 5
4 / 30 5 0 3 2 . 9 1 . 7 2 7 1 4 1 1 . 9 6 0 0 . 0 4 9
Inc. 63
I Inc. 6 7 wl N
Density - 2 3 0 , 0 0 0 4 / 2 5 5 0 3 3 . 6 0 . 9 2 5 8 2 7 1 . 8 9 1 0 . 0 4 3
I ~ c . 66 4 / 2 6 5 0 3 3 . 3 1.1 267 29 1 . 9 3 0 0 . 0 4 0
4 / 2 8 5 0 3 2 . 9 0 . 9 267 29 1 . 9 5 7 0 . 0 4 9
- Continued -

Appendix B . Table 2 . Continued
- -
Length (mm) Weight (mg) KD Index
Collect ion Sample Standard Standard Standard
Source Date Size Mean Deviation Mean Deviation ' Mean Deviation
Inc. 6 2 4 / 2 6 5 0 3 3 . 3 1 . 4 2 6 3 3 3 1 . 9 2 3 0 . 0 4 0
4 / 27 5 0 3 2 . 9 1 . 2 2 6 1 3 1 1 . 9 3 7 0 . 0 4 0
4 / 3 0 5 0 3 3 . 2 1 . 2 2 7 0 2 8 1 . 9 4 3 0 . 0 3 5
Inc. b 9
I
Density - 2 6 0 , 0 0 0 4 / 2 5 5 0 3 3 . 4 1 . 2 2 6 1 3 2 1 . 9 0 7 0 . 0 4 9
Inc. b 4 4 / 2 7 5 0 3 3 . 0 1 . 2 2 6 9 2 9 1 . 9 5 5 0 . 0 4 8
4 / 2 8 5 0 3 3 . 0 1 . 5 2 6 6 3 4 1 . 9 4 5 0 . 0 3 7
Inc. 68
Inc. 6 5 4 / 2 6 4 9 3 3 . 7 1.1 2 7 9 2 4 1 . 9 3 5 0 . 0 4 5
4 . 2 7 5 0 3 2 . 8 1 . 2 2 6 9 3 0 1 . 9 6 4 0 . 0 3 7
4 / 3 0 5 0 3 3 . 1 1 . 3 2 7 1 2 6 1 . 9 5 7 0 . 0 4 8

Appendix B . Table 3. Mean number of plankters/m3 and percent
composition of marine plankton for all stations combined in
Ritoi Bay, 1979.
No. % No. % No. % No. % No. %
Copepods 72 4.32 145 18.19 3626 28.10 1305 11.92
Copepod nauplii 1087 59.99 1015 60.89 362 45.42 2171 16.83 2030 18.54
Barnacle nauplii
Gastropod larvae 652 36.04 218 13.08
Hydro- medusans
Euphasid larvae
Cladocerans 72 3.97
Polychaete larvae
Mysids
Isopods
Cumaceans
Rotifers
- Continued -

Appendix B. T a b l e 3 . Con t inued .
No. % No. % No. % No. %
Copepods
Copepod n a u p l i i 2030 10 .60 1668 1 1 . 6 8 1812 1 9 . 3 8 2900 58.82
B a r n a c l e n a u p l i i 10732 56 .07 8992 62 .95 72 0 .77 290 5 .88
B. c y p r i d s 870 6 .09 3335 35.66 290 5 .88
Gas t ropod- l a r v a e 870 4.54 1595 11.17 798 8 . 5 3 798 16.19
Hydro- medusans 2320 12 .12
Euphas id l a r v a e
C l a d o c e r a n s
P o l y c h a e t e l a r v a e
Mysids
I s o p o d s 290 1 . 5 1 72 0 .77
Cumaceans 72 0.50
R o t i f e r s 2102 22.48

Appendix B. Table 4. Stomach contents of pink fry caught in Kitoi Bay, 2 May, 1979.
Copepods Barnacle Others
Harpacticoid Calanoid Unidentified Nauplii Cyprids
Sample No. % No. % No. % No. % No. %.
Many shells
Many--digested 10
beyond recognition
Amphipods :
2 , 3.92%
Amphipods: 2,
3.27%, Cumacean:
1, 1.63%, Isopod:
1, 1.63%.
- Continued -

Appendix B . T a b l e 4 . Cont inued.
Copepods Barnac le 0 t h e r s
H a r p a c t i c o i d Ca lano id U n i d e n t i f i e d N a u p l i i Cypr ids
Sample No. % No. % No. % No. % No. %"
5 55.56 4 44.44
( d i g e s t e d )
Cumacean: 1,
4 . 1 7 % .
1 1 2 . 5 0 2 25.0 Shrimp, 1 ,
12 .50%.
Summary of % compos i t ion : Copepods - 70.12%
B . n a u p l i i - 17.39%
B . c y p r i d s - 9.77%
O t h e r - 2.72%

Appendix B. Table 5. Stomach contents of fry caught in Kitoi Bay, May 16, 1979.
Copepods Barnacle
Sample Warpacticoids Calanoids Unidentified Nauplii Cyprids Cumaceans Others and
No. % No. % No. % No.% No.% No. % Comments
26 56.52 Cladocerans :
Amphipod: 2,
Amphipod, shrimp,
mysid: 3.3%
Many invertebrate
eggs 8 48 94.12 1 1.96 2 3.92
9 13 18.31 3 4.23 502 70.424 5.631 1.41 Many invertebrate
eggs Few invertebrate
Su~nmary of % com.position: Copepods - 93.57% Unidentified because of digestion.
B. nauplii - 1.43% V h e s e are small nauplii and
B. cyprids - 1.07% metanaplii stages, appear to be
Other - 3.93% copepods, many of which are gravid.

The Alaska Department of Fish and Game administers all programs and activities free from discrimination based on race, color, national origin, age, sex, religion, marital status, pregnancy, parenthood, or disability. The department administers all programs and activities in compliance with Title VI of the Civil Rights Act of 1964, Section 504 of the Rehabilitation Act of 1973, Title II of the Americans with Disabilities Act of 1990, the Age Discrimination Act of 1975, and Title IX of the Education Amendments of 1972. If you believe you have been discriminated against in any program, activity, or facility, or if you desire further information please write to ADF&G, P.O. Box 25526, Juneau, AK 99802-5526; U.S. Fish and Wildlife Service, 4040 N. Fairfax Drive, Suite 300 Webb, Arlington, VA 22203 or O.E.O., U.S. Department of the Interior, Washington DC 20240. For information on alternative formats for this and other department publications, please contact the department ADA Coordinator at (voice) 907-465-6077, (TDD) 907-465-3646, or (FAX) 907-465-6078.