Embed Size (px)
Citation preview
Effect of organic compounds on nanoparticle formation
in diluted diesel exhaust
U. Mathis, M. Mohr, R. Zenobi
To cite this version:
U. Mathis, M. Mohr, R. Zenobi. Effect of organic compounds on nanoparticle formation indiluted diesel exhaust. Atmospheric Chemistry and Physics Discussions, European GeosciencesUnion, 2004, 4 (1), pp.227-265. <hal-00300886>
HAL Id: hal-00300886
https://hal.archives-ouvertes.fr/hal-00300886
Submitted on 15 Jan 2004
HAL is a multi-disciplinary open accessarchive for the deposit and dissemination of sci-entific research documents, whether they are pub-lished or not. The documents may come fromteaching and research institutions in France orabroad, or from public or private research centers.
L’archive ouverte pluridisciplinaire HAL, estdestinee au depot et a la diffusion de documentsscientifiques de niveau recherche, publies ou non,emanant des etablissements d’enseignement et derecherche francais ou etrangers, des laboratoirespublics ou prives.
ACPD4, 227–265, 2004
Effect of organiccompounds on
nanoparticleformation
U. Mathis et al.
Title Page
Abstract Introduction
Conclusions References
Tables Figures
J I
J I
Back Close
Full Screen / Esc
Print Version
Interactive Discussion
© EGU 2004
Atmos. Chem. Phys. Discuss., 4, 227–265, 2004www.atmos-chem-phys.org/acpd/4/227/SRef-ID: 1680-7375/acpd/2004-4-227© European Geosciences Union 2004
AtmosphericChemistry
and PhysicsDiscussions
Effect of organic compounds onnanoparticle formation in diluted dieselexhaustU. Mathis1, M. Mohr1, and R. Zenobi2
1EMPA, Swiss Federal Laboratories for Materials Testing and Research, Laboratory forInternal Combustion Engines and Furnaces, CH-8600 Dubendorf, Switzerland2ETH Honggerberg, Swiss Federal Institute of Technology, Chemistry Department, CH-8093Zurich, Switzerland
Received: 6 November 2003 – Accepted: 8 January 2004 – Published: 15 January 2004
Correspondence to: M. Mohr ([email protected])
227
ACPD4, 227–265, 2004
Effect of organiccompounds on
nanoparticleformation
U. Mathis et al.
Title Page
Abstract Introduction
Conclusions References
Tables Figures
J I
J I
Back Close
Full Screen / Esc
Print Version
Interactive Discussion
© EGU 2004
Abstract
The nucleation of nanoparticles in the exhaust of a modern light-duty diesel vehiclewas investigated on a chassis dynamometer. This laboratory study is focused on theinfluence of volatile organic compounds (VOCs) on nucleation of volatile nanoparticles.Different organic compounds were added to the dilution air of the particle sampling un-5
der different sampling conditions. Sample temperature and relative sample humiditywere varied in a wide range. The number size distribution of the particles was mea-sured with a scanning mobility particle sizer (SMPS) and showed significant differencesin response to the added organic compounds. While the nucleation mode particlesshowed a large variation in concentration, the accumulation mode particles remained10
unchanged for all compounds. Depending on the functional group, organic compoundswere capable of initiating and increasing (alcohols and toluene) or decreasing (acetone,aniline, and methyl tert-butyl ether (MTBE)) nucleation mode particles. Short volatilealiphatic hydrocarbons (hexane and cyclohexane) turned out to be without effect onnucleation of nanoparticles. Possible reasons for the differences are discussed.15
1. Introduction
Exhaust from diesel engines represents an important anthropogenic source of particlesin ambient air. Particles from internal combustion engines can be divided into solid andvolatile particles (Kittelson, 1998). The solid particles mainly consist of agglomeratedcarbonaceous primary particles, which are usually described as soot. However, other20
compounds such as hydrocarbons can be adsorbed or condensed on its surface. Thevolatile nanoparticles are usually formed by nucleation of sulfuric acid, water, and otherspecies. Formation of these volatile nanoparticles strongly depends on the dilutionand cooling process of the exhaust. The two different kinds of particles usually formseparate modes in the number size distribution, that are referred to as “accumulation25
mode” and “nucleation mode”.
228
ACPD4, 227–265, 2004
Effect of organiccompounds on
nanoparticleformation
U. Mathis et al.
Title Page
Abstract Introduction
Conclusions References
Tables Figures
J I
J I
Back Close
Full Screen / Esc
Print Version
Interactive Discussion
© EGU 2004
Adverse health effects of particles on human health have been documented in sev-eral studies (Pope, 2000; Petrovic et al., 2000; Oberdorster, 2001). Impact on healthhas mainly been studied for soot particles and thus, there is limited information aboutvolatile nanoparticles. Because volatile nanoparticles have a distinctly smaller diame-ter than soot particles, the mass contribution of volatile nanoparticles is usually small.5
However, investigations has documented that health effects were more related to parti-cle number than to mass (Donaldson et al., 1998; Sydbom et al., 2001) even though thecurrent legislation for particle emissions is based on mass. Compared to soot a higherdeposition rate in the lungs might be expected for volatile nanoparticles because oftheir smaller diameters. As indicated in a study by Kim and Jaques (2000), the de-10
position rate of 40 nm solid nanoparticles is nearly 2.5 times higher than for 100 nmnanoparticles. To assess the human health impact of volatile nanoparticles, more infor-mation about their exact composition is needed. Sulfuric acid seems to be a relevantcompound for human health effects in volatile nanoparticles. Inhalation of acid aerosolsin laboratory animal studies causes genotoxic damage in cells (Soskolne et al., 1984;15
Swenberg and Beauchamp, 1997). Kilgour et al. (2002) showed cell proliferation of therespiratory tract in rats due to exposure to sulfuric acid.
Improvements in engine technologies have reduced particle mass emissions fromdiesel engines. The limit values for mass emissions from light-duty diesel vehicleswere gradually reduced by more than four times from 0.18 g km−1 (Euro 1, since 1992)20
to 0.025 g km−1 (Euro 4, as of 2005). A reduction in mass is related to a decreasein number of soot particles, but there is no clear relation to the volatile nanoparticleemissions (Mohr et al., 2001). It is generally accepted that volatile nanoparticles areinfluenced by dilution parameters such as temperature, dilution ratio, residence time,and humidity (Abdul-Khalek et al., 1999; Khalek et al., 2000; Mathis, 2002). In addi-25
tion, the fuel sulfur content plays an important role (Ntziachristos et al., 2000; Maricqet al., 2002). Volatile nanoparticles are observed in both laboratory and chasing ex-periments, but the observed nucleation mode in chasing studies could not have beenreproduced in laboratory control experiments yet (Kittelson, 2002; Vogt et al., 2003). A
229
ACPD4, 227–265, 2004
Effect of organiccompounds on
nanoparticleformation
U. Mathis et al.
Title Page
Abstract Introduction
Conclusions References
Tables Figures
J I
J I
Back Close
Full Screen / Esc
Print Version
Interactive Discussion
© EGU 2004
possible explanation could be the high sensitivity of the nucleation mode to the dilutionparameters. Kittelson (1998) reported that a dilution ratio of 1000 is typical for an at-mospheric dilution process of exhaust. However, such a high dilution ratio cannot beapplied for many laboratory studies due to the high requirements of the dilution ratiocontrol. Nevertheless, laboratory studies facilitate a better principle understanding of5
the formation process of volatile nanoparticles.If the concentration of soot particles is sufficiently large, volatile nanoparticles can
be quenched. Moreover, pre-existing soot particles scavenge a part of the volatilenanoparticles by collision (Seinfeld and Pandis, 1998). As the total surface providedby soot particles is reduced, the relevant species responsible for nucleation remain in10
the gaseous phase and can lead to homogeneous nucleation (Kittelson, 1998; Mohret al., 2001). However, the classical binary nucleation theory of water and sulfuric acidunderestimates the formation of nucleation mode particles by several orders in numberand thus, further species are suspected to be involved in nucleation (Shi and Harrison,1999; Khalek et al., 2000). Besides the explanation of classical binary homogeneous15
nucleation of sulfuric acid and water in diesel exhaust, homogeneous ternary nucle-ation of sulfuric acid, ammonia, and water (Napari et al., 2002) or nanoparticle forma-tion from chemiions generated during combustion (Yu, 2001; Yu, 2002) were reported.Organic compounds are often considered as the key species to control the growth ofnucleation mode particles (Maricq et al., 1999; Kerminen et al., 2000; Khalek et al.,20
2000; Zhang and Wexler, 2002). Analytical investigations of the volatile nanoparticlesin diesel exhaust has given strong indications that organic compounds were involvedin the nucleation process (Tobias et al., 2001; Sakurai et al., 2003). The role of organiccompounds has been investigated in more detail for the formation of cloud condensa-tion nuclei (CCN) than for the dilution process of engine exhaust. The organic com-25
pounds found in CCN are mainly organic acids such as formic, acetic, pyruvic, pinonicoxalic, and malonic acids (Yu, 2000; Hegg et al., 2001; Giebl et al., 2002). Little isknown about organics with other functional groups. We investigated how non-acid or-ganic compounds are involved in the nucleation process of volatile particles in diluted
230
ACPD4, 227–265, 2004
Effect of organiccompounds on
nanoparticleformation
U. Mathis et al.
Title Page
Abstract Introduction
Conclusions References
Tables Figures
J I
J I
Back Close
Full Screen / Esc
Print Version
Interactive Discussion
© EGU 2004
diesel exhaust. We added a variety of VOCs (aliphatic hydrocarbons, aromatic com-pounds, a ketone, an amine, an ether, and alcohols) into the primary dilution air. Theintention of this laboratory study is to contribute to a better understanding of organiccompounds that are involved in the nucleation process of diluted diesel exhaust.
2. Experimental5
2.1. Vehicle and fuel
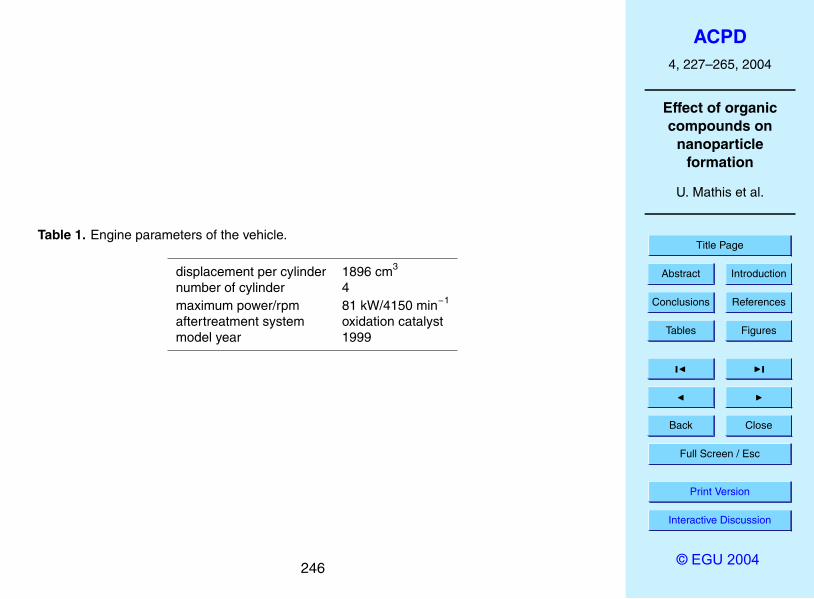
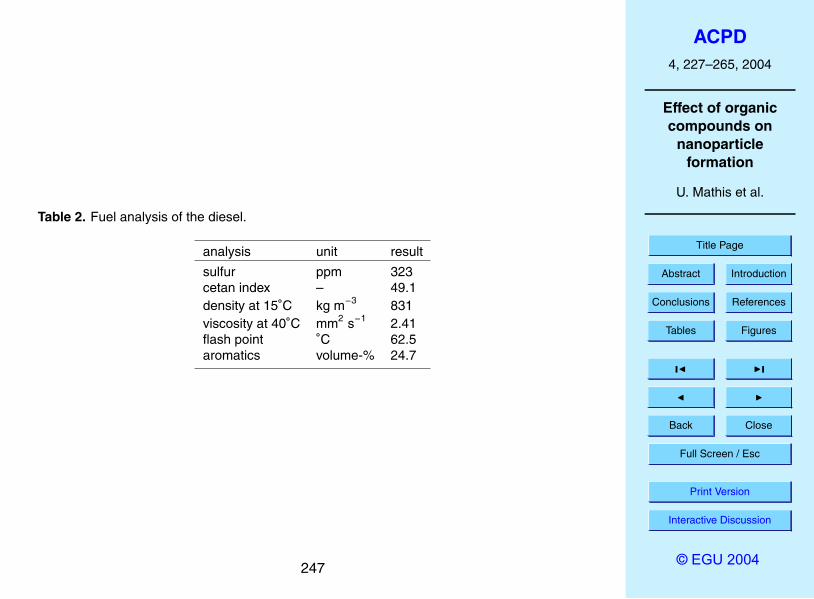
All experiments were conducted with a modern light-duty diesel vehicle on a chas-sis dynamometer at constant speed (50 km h−1) and increased load conditions(7.0±0.2 kW, 18.1±0.5% of maximum power, 2100 rpm). The normal load was 2 kWunder road conditions. The engine parameters and the results of fuel analysis are listed10
in Tables 1 and 2. The tests were run with a standard fuel with a sulfur concentrationof 323 ppm. The additional sulfur contribution in the exhaust by lube oil consumptionwas estimated to be 6 ppm. The vehicle was running at 7.0±0.2 kW load for at least20 min to conditionate the vehicle and sampling system.
2.2. Sampling15
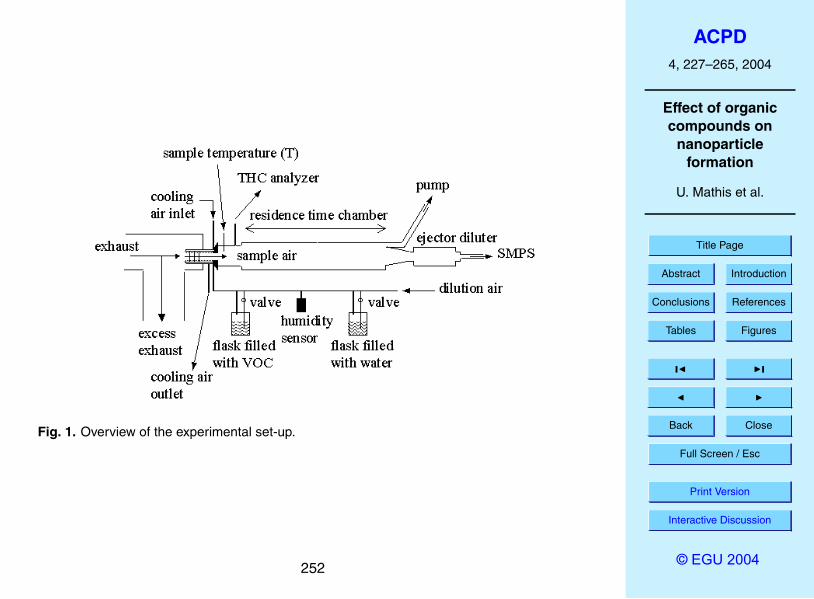
The overall set-up of the particle measurement is shown in Fig. 1. The relevant nucle-ation parameters such as dilution ratio, dilution temperature, and residence time werekept constant. Dilution of the exhaust sample was performed with a two-stage dilu-tion unit. The primary dilution of the exhaust was accomplished inside a porous tube(Dekati prototype), which was inserted directly into the tailpipe to minimize sampling20
losses. Detailed information about the diluter can be found in Mikkanen et al. (2001).By controlling the temperature of the dilution air by means of a vortex cooler, the sam-ple temperatures (T ) were in the range of 34.7±0.5◦C or 44.5±0.5◦C, respectively. Thesample temperature was measured immediately after the first dilution. The dilution ratio
231
ACPD4, 227–265, 2004
Effect of organiccompounds on
nanoparticleformation
U. Mathis et al.
Title Page
Abstract Introduction
Conclusions References
Tables Figures
J I
J I
Back Close
Full Screen / Esc
Print Version
Interactive Discussion
© EGU 2004
was set to 8.5±0.5 by the flow ratio of the dilution air to the raw exhaust. Downstreamof the first dilution stage unit, a residence chamber was inserted offering sufficienttime for the relevant nucleation compounds to nucleate. A constant residence time of2.50±0.15 s was chosen. The second dilution unit was placed at the end of the resi-dence chamber to quench the formation and growth of nucleation mode particles. The5
dilution ratio of this ejector dilution unit remained constant at 10.To vary humidity in the exhaust sample, a part of the dilution air of the primary diluter
was bubbled through a flask filled with de-ionized water before entering the poroustube diluter. Relative humidity of the dilution air ranged from 4% to 75% at ambienttemperature, measured by a humidity sensor (Rotronic BM90). Further contributions10
to the humidity came from combustion of the diesel fuel and the combustion air. Cal-culation of the combustion air humidity was based on a typical diesel fuel elementalcomposition of 14% hydrogen and 86% carbon. The combustion air was measuredto be 50% relative humidity at 25◦C and 950 hPa. Taking all contributions into ac-count, the relative sample humidity after the first dilution unit was calculated to range15
from 30% to 99% at the measured sample temperature. The relative sample humidityis hereafter referred to as humidity (RH). To adjust the gas concentration of the se-lected organic compounds in the sample, the pure organic compounds were filled intoan additional flask as shown in Fig. 1. Some of the liquid organic compounds filledin the flask could uptake water from the dilution air and reduce the relative humidity20
of the dilution air. This effect was considered to be negligible in this study. All addedorganic compounds were of technical quality (Fluka). Control experiments by evap-orating the organic compounds and de-ionized water in the flask showed no particleformation: The dilution air enriched with the organic compounds and water was ana-lyzed by a scanning mobility particle sizer (SMPS, TSI) without observing any particles25
in the number size distribution. Concentrations of the organic compounds added tothe exhaust were measured with a flame ionization detector (FID, Horiba Mexa-7400H)after the first dilution and were normalized to the effective number of carbon. The FIDwas calibrated with propane in the linear region from 1 ppm to 5000 ppm corrected as
232

ACPD4, 227–265, 2004
Effect of organiccompounds on
nanoparticleformation
U. Mathis et al.
Title Page
Abstract Introduction
Conclusions References
Tables Figures
J I
J I
Back Close
Full Screen / Esc
Print Version
Interactive Discussion
© EGU 2004
C1. When the concentration exceeded the concentration of 5000 ppm corrected as C1,we present the data as larger than the highest measured concentration corrected forthe added organic compound (e.g. >5600 ppm toluene in Fig. 6, top panel).
2.3. Particle number size distribution
A SMPS consisting of a differential mobility analyzer (DMA, TSI 3071) and a conden-5
sation particle counter (CPC, TSI 3025) was used for determining the number sizedistribution of the particle. The DMA had a polydisperse inlet flow of 1.5 l min−1 anda sheath air flow of 15 l min−1 that selected particle diameters ranged from 7 nm to214 nm. The impactor upstream of the DMA was removed because the pressure dropwas too high to properly operate the CPC. A bypass to the DMA (4.8 l min−1) was10
installed to increase the flow rate and reduce diffusion losses. Therefore, no correctionof diffusion losses was conducted.
2.4. Calculation of the organic vapor concentration
Based on the FID measurements, the vapor pressure pi of the substance i in thesample air was calculated according to the ideal gas equation:15
pi =(cppm − cbackground · 10−6
MvR · T, (1)
where R is the universal gas constant (8.3145 J mol−1 K−1), T is the absolute temper-ature, cppm is the volume concentration in ppm of the substance i , cbackground,ppm is theconcentration without adding any VOCs, and Mv is the mole volume. cbackground,ppmwasmeasured experimentally to be 5 ppm for all measurements.20
The vapor pressure PSi in Torr over the pure liquid phase for a flat surface wascalculated for the substance i according to the Antoine equation (Lange and Dean,
233
ACPD4, 227–265, 2004
Effect of organiccompounds on
nanoparticleformation
U. Mathis et al.
Title Page
Abstract Introduction
Conclusions References
Tables Figures
J I
J I
Back Close
Full Screen / Esc
Print Version
Interactive Discussion
© EGU 2004
1973):
log10 PSi = A − BC + t
, (2)
or alternatively, for 1-butanol with
log10 PSi = C − 52.23 · B(t + 273.15)
, (3)
where A,B, and C are constants and t is the temperature in ◦C.5
The constants A,B, and C were taken from Lange and Dean (1973). For 1-hexanoland MTBE the values were taken from Poling et al. (2001) and Krahenbuhl andGmehling (1994), respectively.
To compare the vapor pressures with each other, a common quantity was introduced.A good approach is the saturation ratio Si ; the ratio of the partial vapor pressure pi to10
the saturation vapor over the pure liquid phase PSi :
Si =pi
PSi. (4)
3. Results and discussions
The aim of this investigation was to study a selection of VOCs on the nucleation processat varying temperature and humidity of the sample. Because the nucleation process15
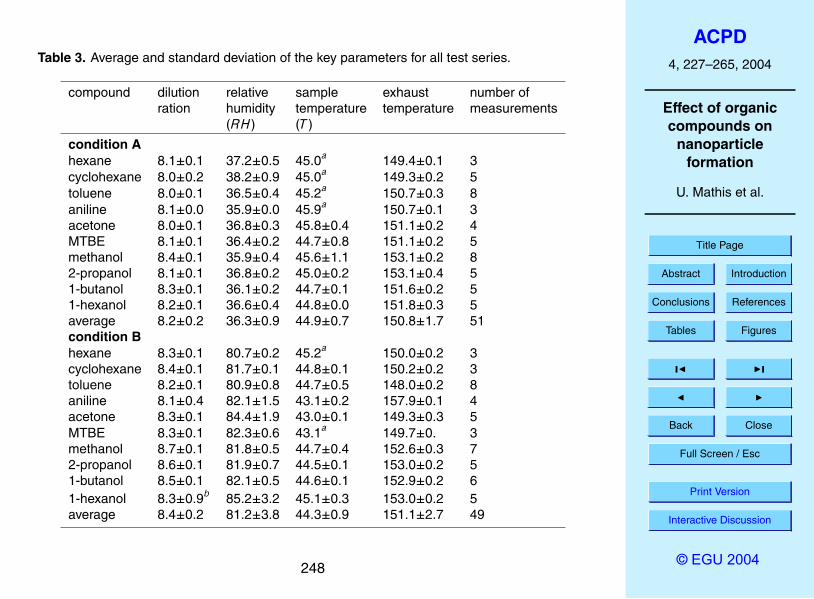
reacts very sensitively to small changes of the dilution conditions, it had to be verifiedthat the increase of humidity and VOCs in the dilution air did not influence any samplingparameters. Regarding the key parameters listed in Table 3, the variations of the sam-pling parameters are small within a test series. The variations from one test to anothermainly depended on the restart of the vehicle. To unambiguously assign the effect of20
VOCs, the influence of the other key parameters were recorded. A typical temperaturevariation of the dilution flow, sample flow, and exhaust flow within the same test series
234
ACPD4, 227–265, 2004
Effect of organiccompounds on
nanoparticleformation
U. Mathis et al.
Title Page
Abstract Introduction
Conclusions References
Tables Figures
J I
J I
Back Close
Full Screen / Esc
Print Version
Interactive Discussion
© EGU 2004
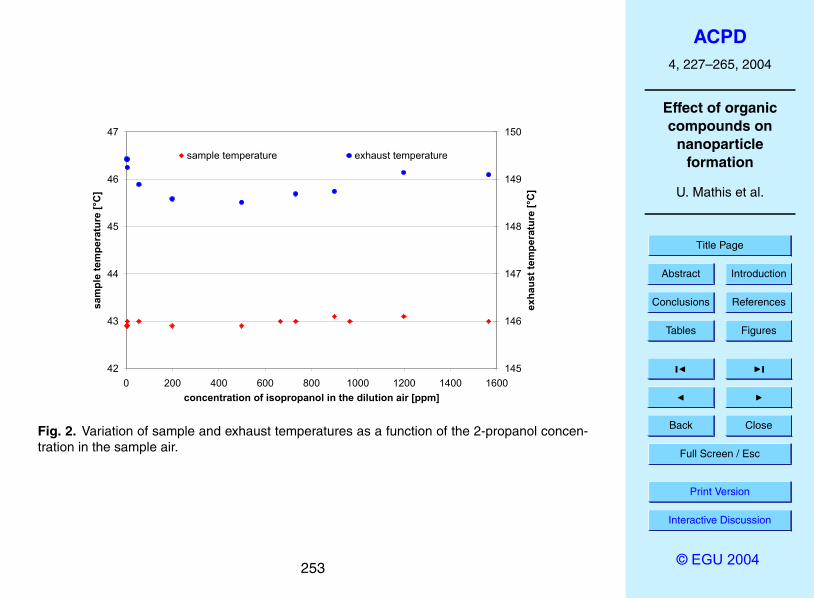
is shown for 2-propanol in Fig. 2. Variations of temperatures were randomly distributedand were not dependent on the concentration of 2-propanol in the dilution air. Basedon these control experiments, it was verified that an increase of humidity and VOCs didnot influence the sampling parameters.
The variation of the accumulation mode was found to vary ±25% from one test series5
to another when the vehicle was restarted. A possible reason could be the correspond-ing vehicle load variation of ±3% at this very sensitive operation point. In line with theload variation the exhaust temperature varied ±6◦C (see Fig. 2). Nevertheless, the loadcould be set within ±1% for a test series that provided stable test conditions withoutany significant effect on the accumulation mode particles.10
To investigate at which step of nucleation VOCs have an impact, three test con-ditions A, B, and C were evaluated. The key nucleation parameters of these threeconditions are presented in Table 3. Tests without any addition of VOC revealed thefollowing results: Under test condition A (sample temperature (T )=44.9◦C, relative hu-midity (RH)=36.3%) no or only a weak nucleation mode could be detected. Under15
condition B (T=44.3◦C, RH=81.2%) a nucleation was always observed, which is ex-plained by the higher humidity compared to condition A (T=44.9◦C, RH=36.3%). Thestrongest nucleation occurred under condition C (T=34.7◦C, RH=31.6%) as the lowdilution air temperature provoked nucleation already at low humidity levels.
3.1. Effect of humidity20
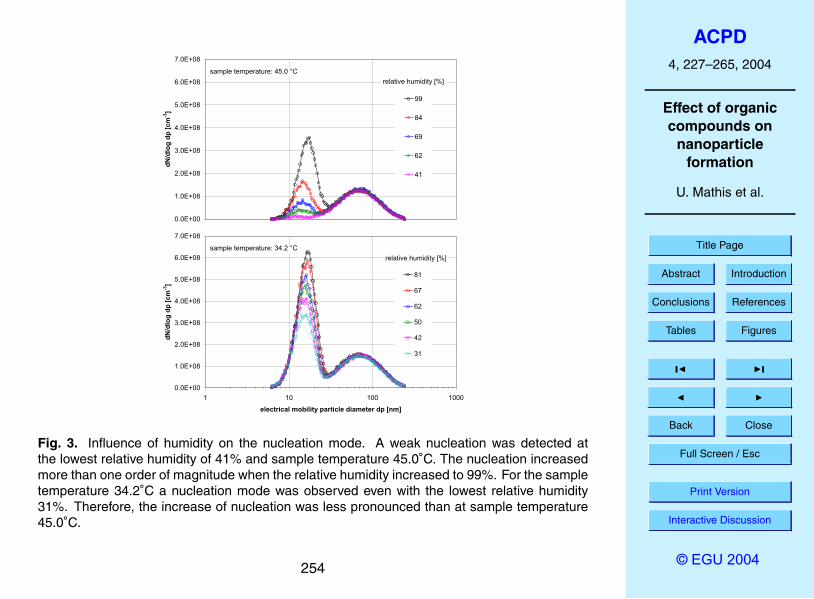
To distinguish the effect of humidity and VOCs in the dilution air on the nucleation pro-cess, a first series was conducted varying only the humidity in the dilution air. Thesample temperature was either held at 45.0◦C or at 34.2◦C. Figure 3 depicts the ef-fect of humidity on nucleation under both conditions. A considerable humidity effecton the nucleation mode particles was found at a sample temperature of 45.0◦C. When25
the humidity was increased, a strong rise of the nucleation mode particles was ob-served. In addition, this peak moved to slightly higher diameters with increasing hu-midity. This can be explained by stronger coagulation due to a higher concentration
235
ACPD4, 227–265, 2004
Effect of organiccompounds on
nanoparticleformation
U. Mathis et al.
Title Page
Abstract Introduction
Conclusions References
Tables Figures
J I
J I
Back Close
Full Screen / Esc
Print Version
Interactive Discussion
© EGU 2004
of volatile nanoparticles at 99% relative humidity. The accumulation mode remainedstable at about 70 nm. There was a distinct nucleation mode under dry conditions at31% relative humidity and a sample temperature of 34.2◦C. The nucleation mode par-ticles increased by a factor of two when the relative humidity was increased from 31%to 81%. In comparison with the sample temperature at 45.0◦C, there was a consider-5
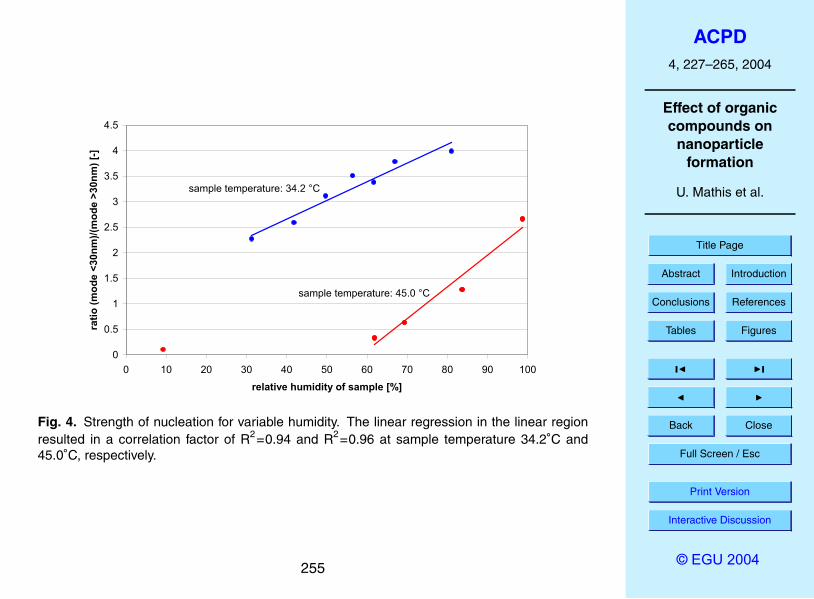
ably lower influence of humidity on the nucleation process. To compare the strengthof nucleation, the ratio of the maximum number concentrations in the nucleation modeto the accumulation mode was calculated. Due to this normalization, no correction ofthe particle number size distribution by the dilution ratio was necessary. This ratio ispresented as a function of the relative humidity in the sample in Fig. 4. Below about10
60% relative humidity, no appreciable nucleation took place at a sample temperature of45.0◦C indicating a minimal initial relative humidity for nucleation. As soon as the rel-ative humidity was further increased, a clear dependence on humidity was observed.The ratio of the maximum number concentrations of nucleation mode to the accumu-lation mode showed a linear dependence on the humidity over the entire investigated15
range at a sample temperature of 34.2◦C. The lower sensitivity on humidity at a sampletemperature of 34.2◦C is apparent when the slope is compared under the assumptionof linear response. The sample temperature at 45.0◦C with a slope of 0.062 (% relativehumidity)−1 had a significantly steeper slope than at 34.2◦C with a slope of 0.037 (% rel-ative humidity)−1. In spite of the bigger humidity effect on the volatile nanoparticles at a20
sample temperature of 45.0◦C, the absolute concentration of volatile nanoparticles wasalways higher at 34.2◦C. Our experimental work is in accordance with the parametricstudy of Kim et al. (2002). A linear dependence was found of the nucleation rate as afunction of relative humidity under conditions of increased humidity.
3.2. Effect of organic vapors on the nucleation mode25
To find out which substance classes affect the nucleation process, a variety of or-ganic compounds were added. The measured hydrocarbon concentration correctedas C1 ranged from 500 ppm to 5000 ppm in the mixed sample part and exceeded the
236
ACPD4, 227–265, 2004
Effect of organiccompounds on
nanoparticleformation
U. Mathis et al.
Title Page
Abstract Introduction
Conclusions References
Tables Figures
J I
J I
Back Close
Full Screen / Esc
Print Version
Interactive Discussion
© EGU 2004
normal concentrations in exhaust gas by one or two orders of magnitude. However,concentrations of several thousands ppm are typical for cold starts at low tempera-tures. We found raw gas concentrations of 5000 ppm to 20 000 ppm and 10 000 ppmto 30 000 ppm for diesel and gasoline vehicles, respectively, in the first minutes of coldstarts at −20◦C. Since we operated the engine at warm conditions, the oxidation cata-5
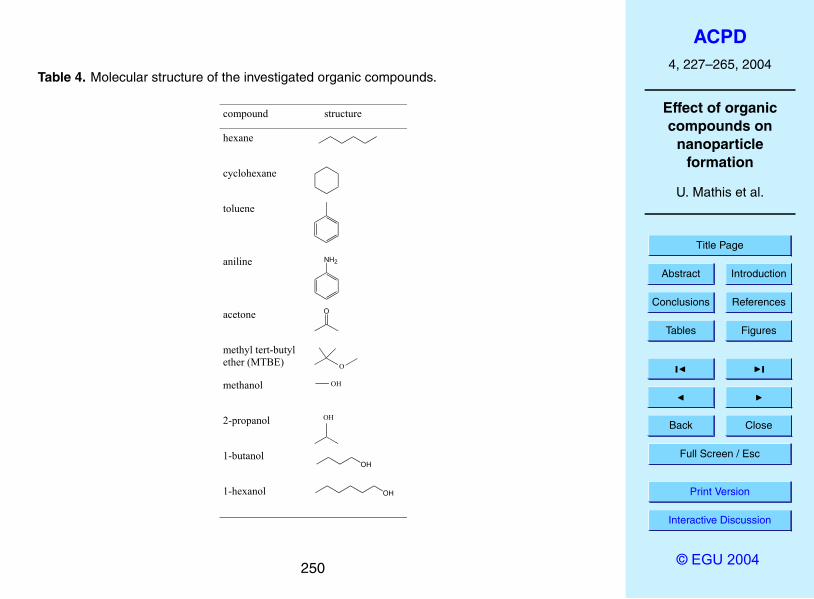
lyst converted hydrocarbons to a large extent. However, we do not intend to simulatethe real world situation at this engine operation point but to gain a principle under-standing of the nucleation process in presence of organic compounds. The addedchemical compounds consisted of aliphatic hydrocarbons, aromatic compounds, a ke-tone, an amine, an ether, and alcohols. The chemical structures of these compounds10
are shown in Table 4. We chose compounds of high volatility to prevent losses by con-densation on the sampling system. We are aware that less volatile organic compoundsare more likely to be involved in the nucleation process under atmospheric conditions.Sakurai et al. (2003) reported that organic compounds from diesel nanoparticle wascomprised of medium molecular weight with carbon numbers in the range from C24 to15
C32 for aliphatic hydrocarbons. However, our objective of this laboratory study was toidentify the functional groups that are involved in the nucleation process. Therefore, thevolatility of the organic compounds only played a minor relevance for the interpretationof our data.
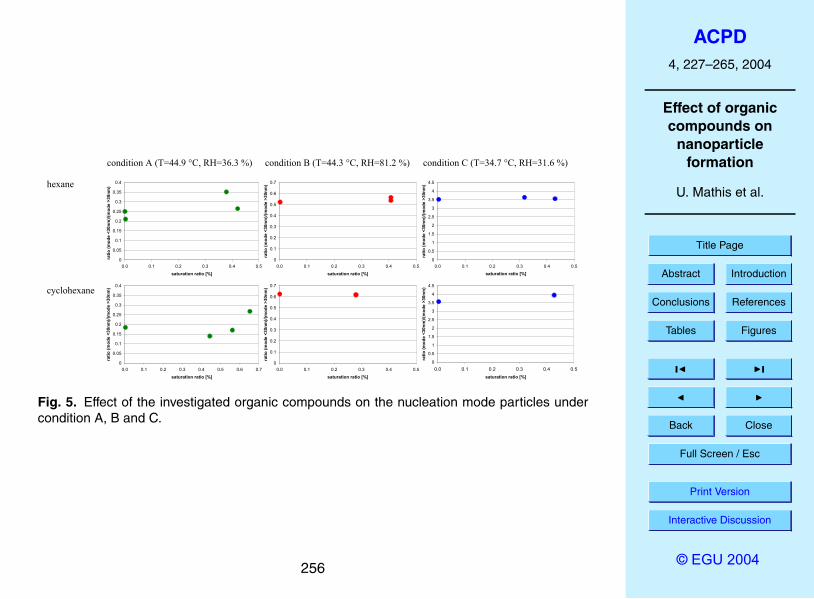
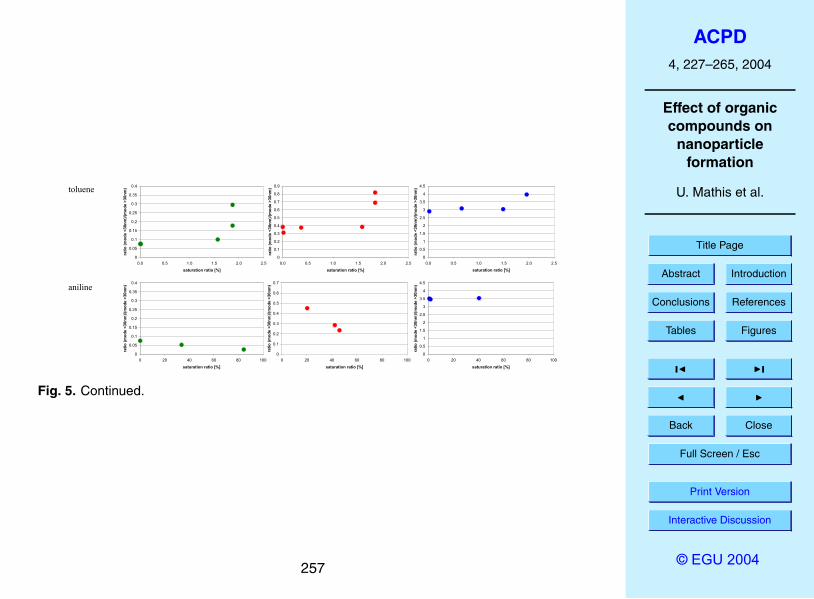
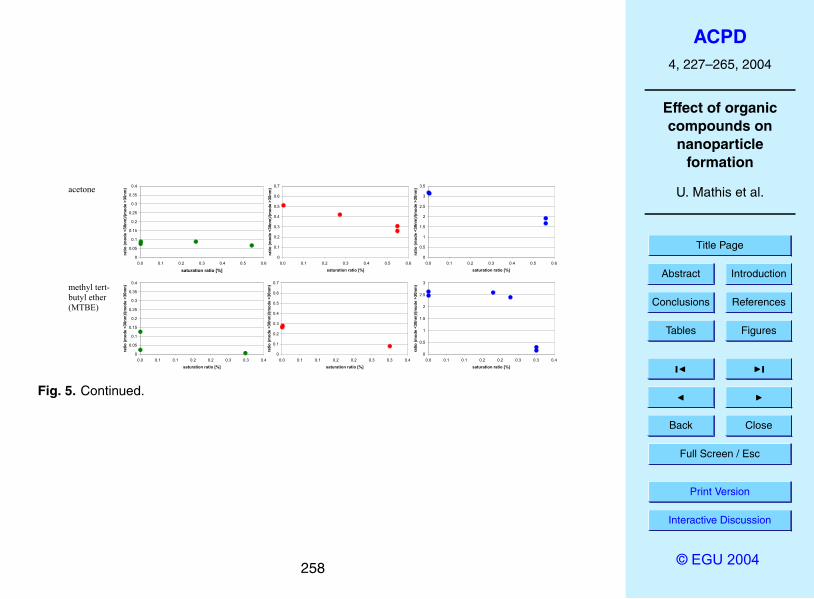
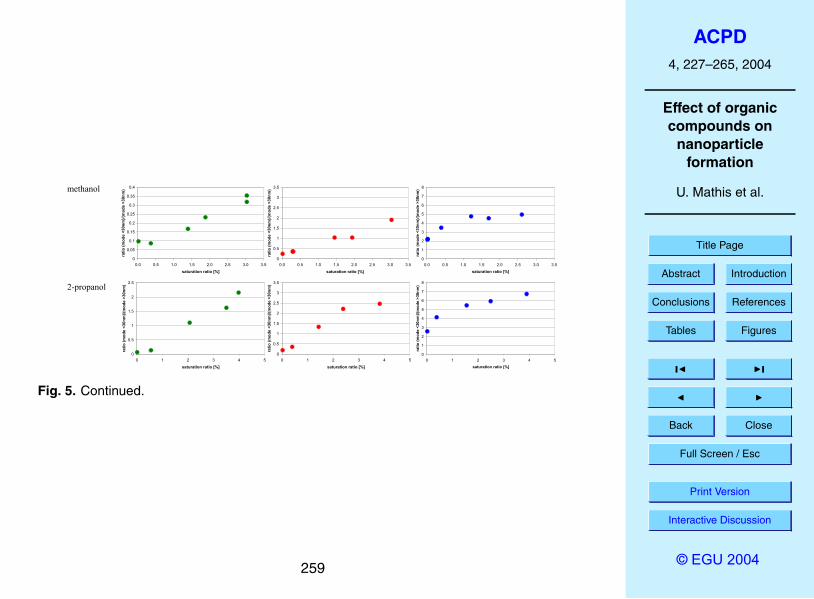
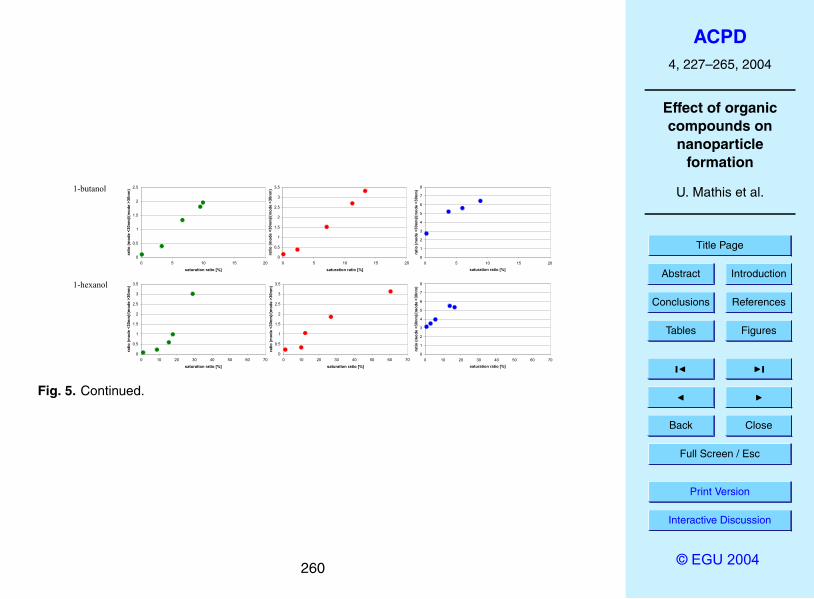
An overview of the effect of the organic compounds on the nucleation mode is given20
in Fig. 5. To compare the strength of nucleation, the ratio of the maximum numberconcentrations in the nucleation mode to the accumulation mode was calculated.
3.2.1. Aliphatic hydrocarbons
The effect on nucleation mode particles was investigated for two aliphatic hydrocar-bons, hexane and cyclohexane. For both compounds, no effect was observed on the25
particles in the nucleation mode though the concentration in the dilution air was in-creased up to 8000 ppm (see Fig. 5). However, due to their high volatility the saturationratio remained always below 0.41%. Besides the low saturation ratio, little interaction
237
ACPD4, 227–265, 2004
Effect of organiccompounds on
nanoparticleformation
U. Mathis et al.
Title Page
Abstract Introduction
Conclusions References
Tables Figures
J I
J I
Back Close
Full Screen / Esc
Print Version
Interactive Discussion
© EGU 2004
of these hydrophobic molecules with the main nucleation mode particles (water andsulfuric acid) exists.
3.2.2. Aromatic compounds
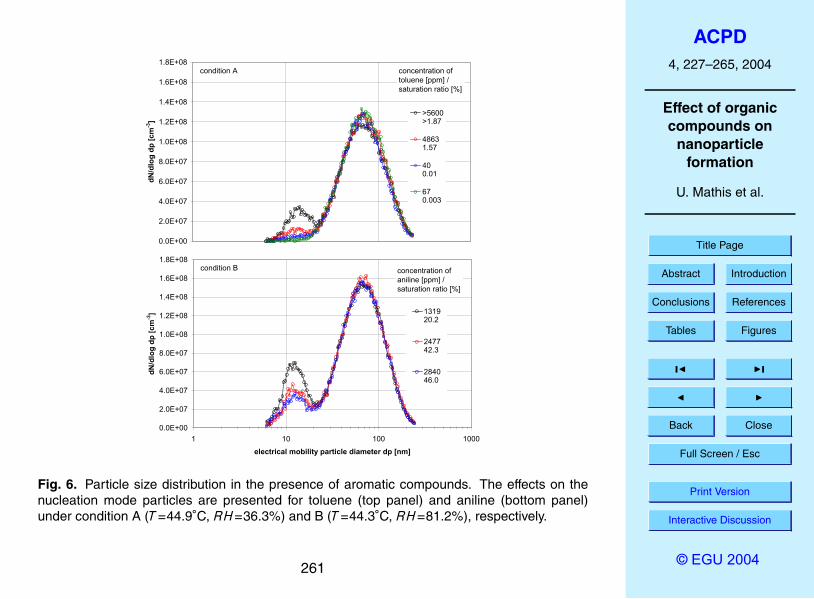
Toluene was chosen due to its high volatility compared to other polyaromatic com-pounds. Toluene influenced the nucleation mode particles under all conditions in-5
vestigated, but only at the highest toluene concentration. Similar to the effect ofhumidity, the nucleation process was more affected when no or a weak nucleationmode existed in the beginning as under conditions A (T=44.9◦C, RH=36.3%) andB (T=44.3◦C, RH=81.2%) than for a strong nucleation mode as under condition C(T=34.7◦C, RH=31.6%). Interestingly, toluene was capable of triggering a nucleation10
mode under condition A (T=44.9◦C, RH=36.3%) when no spontaneous nucleation oc-curred (see Fig. 6, top panel). Obviously, the hydrophobic toluene associates with thenucleation mode particles. Following a suggestion by Tobias et al. (2001), a two-phasesystem of the hydrophobic compounds and water/sulfuric acid is proposed because itis unlikely that an association takes place between toluene and water/sulfuric acid. It15
likely seems that the organic phase was mainly created by the added toluene. Com-pared to other factors affecting the nucleation process, e.g. humidity, the increasednucleation mode particles due to the addition of toluene were moderate. Therefore,hydrophobic compounds with vapor pressures comparable to or higher than toluene(38 hPa at 25◦C) are assumed to be irrelevant for the nucleation process in diluted20
diesel exhaust.For aniline, a further increase of nucleation mode particles is expected because
hydrogen bonds to water and sulfuric acid can be formed providing additional stabi-lization. Nucleation mode particles were not influenced under conditions A (T=44.9◦C,RH=36.3%) and C (T=34.7◦C, RH=31.6%). The only effect appeared under condition25
B (T=44.3◦C, RH=81.2%; see Fig. 6, bottom panel). Instead of the expected increaseof nucleation mode particles with additional aniline, a weak reduction was observed.A possible explanation could be the reaction of the basic amino group of the aniline
238
ACPD4, 227–265, 2004
Effect of organiccompounds on
nanoparticleformation
U. Mathis et al.
Title Page
Abstract Introduction
Conclusions References
Tables Figures
J I
J I
Back Close
Full Screen / Esc
Print Version
Interactive Discussion
© EGU 2004
with the sulfuric acid and thus, formation of anilinium sulfate particles. This processremoves sulfuric acid from the exhaust air resulting in a lower sulfuric acid vapor con-centration and a decrease in nucleation. However, no relevant change of the particlenumber size distribution was observed indicating the existence of anilinium sulfate par-ticles. We assume in the following that the reduction of nucleation is completely caused5
by a acid-base reaction of sulfuric acid with aniline creating particles in the size rangeof accumulation mode particles. The volume of the nucleation mode particles with adiameter < 30 nm was calculated for the data shown in Fig. 6 (bottom panel, at the low-est and highest aniline concentration) and compared with the volume of the particleswith a diameter > 30 nm. The volume of particles with a diameter < 30 nm contributed10
less than 2% to the volume of the particles with a diameter > 30 nm. Therefore, no sig-nificant change of the particle number size distribution would be expected if aniliniumsulfate particles had been formed.
3.2.3. Acetone
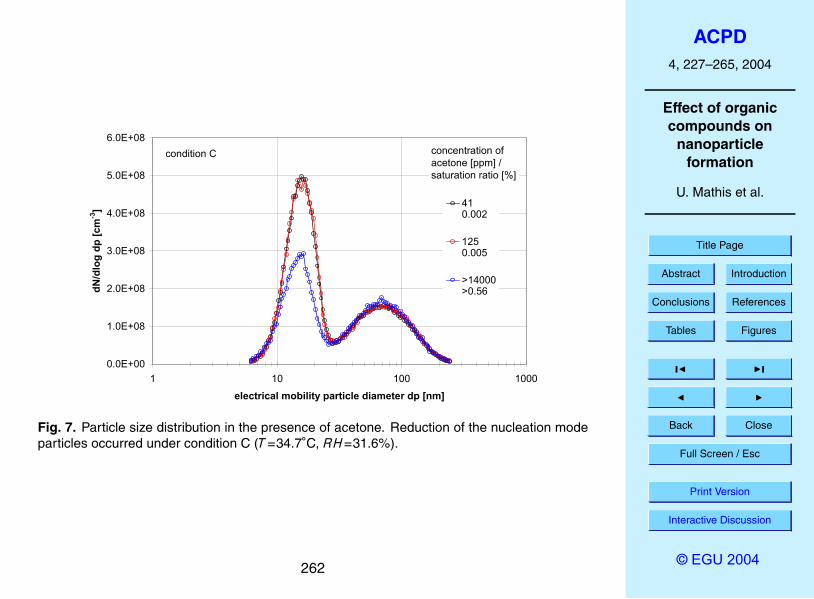
Acetone was chosen due to its high volatility. Without pre-existing nucleation mode15
particles, under condition A (T=44.9◦C, RH=36.3%), no effect on the nucleation wasdetected with addition of the compound. The effect of acetone was relatively weak andconsisted in a decrease of nucleation mode particles with increasing acetone concen-tration in the sample under condition B (T=44.3◦C, RH=81.2%) and C (T=34.7◦C,RH=31.6%). As an example, condition C (T=34.7◦C, RH=31.6%) is depicted in20
Fig. 10.
3.2.4. MTBE
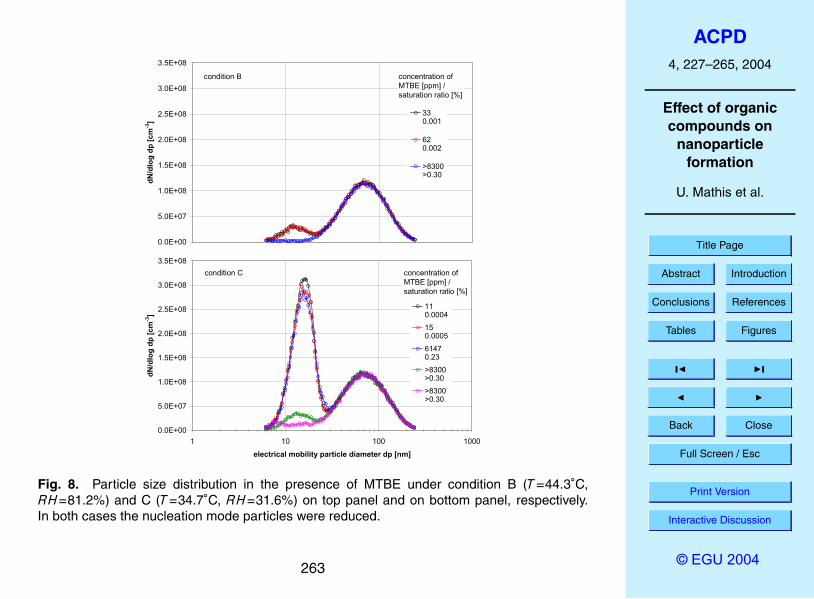
Due to its high relevance as a gasoline additive, MTBE was chosen. MTBE leads tomore complete combustion due to the oxygen contained in the molecule (Poulopou-los and Philippopoulos, 2003). The nucleation mode particles showed a strong de-25
crease as soon as the MTBE concentration was increased. Similar to acetone,
239
ACPD4, 227–265, 2004
Effect of organiccompounds on
nanoparticleformation
U. Mathis et al.
Title Page
Abstract Introduction
Conclusions References
Tables Figures
J I
J I
Back Close
Full Screen / Esc
Print Version
Interactive Discussion
© EGU 2004
no nucleation mode particles occurred with addition of MTBE under condition A(T=44.9◦C, RH=36.3%). The nucleation was completely removed under condition B(T=44.3◦C, RH=81.2%; see Fig. 8, top panel) and nearly suppressed under conditionC (T=34.7◦C, RH=31.6%; see Fig. 8, bottom panel).
We do not have a satisfactory explanation for the reduction of nucleation mode par-5
ticles with acetone and MTBE. MTBE is an inert compound that is often used as asolvent in chemical reactions and thus, no chemical reaction with any reactive com-bustion product is expected.
3.2.5. Alcohols
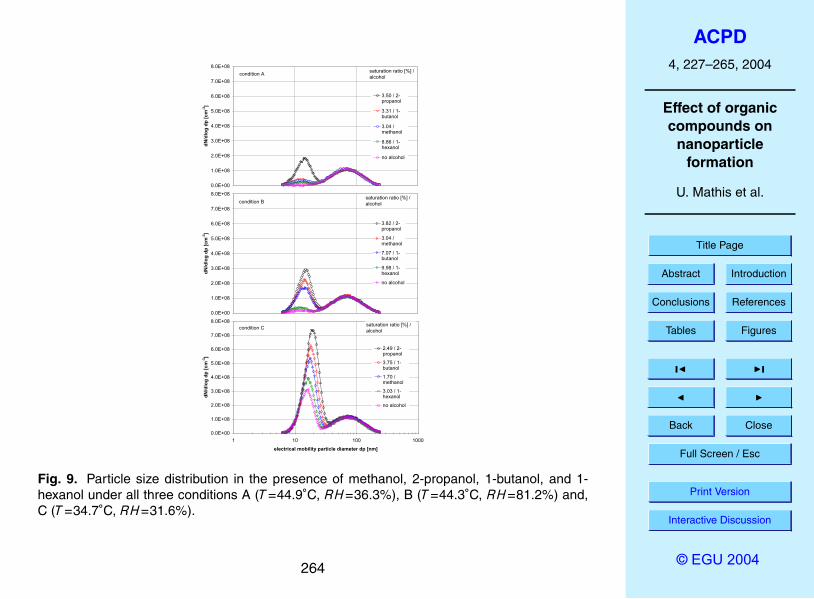
A selection of alcohols with increasing hydrophobicity was chosen, methanol, 2-10
propanol, 1-butanol, and 1-hexanol. When alcohol was added to the dilution air, an in-crease of nucleation mode particles was observed. In Fig. 9, a direct comparison of allfour alcohols is depicted under all three conditions. The nucleation mode particles wereincreased in the following order: 2-propanol > (1-butanol or methanol) > 1-hexanol.Compared to condition A (T=44.9◦C, RH=36.3%) and B (T=44.3◦C, RH=81.2%), the15
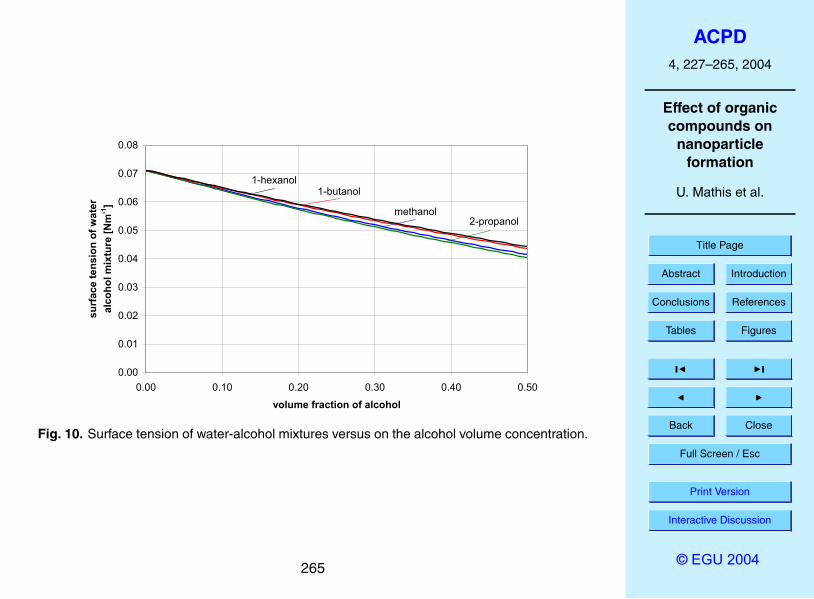
relative increase of nucleation mode particles was much less pronounced under condi-tion C (T=34.7◦C, RH=31.6%). To explain the variation of the nucleation process withinthe alcohols, the surface tension and water solubility of the alcohols were consideredin more detail. Since the alcohols investigated have a conspicuously lower surfacetension than water, a surface tension reduction of the nucleation mode particles is ex-20
pected in the presence of the alcohols. The reduction of surface tension as a functionof the alcohol fraction is depicted in Fig. 10 for the alcohols investigated. The sur-face tensions of the water-alcohol mixtures were calculated by the method of Tamura(Tamura et al., 1955). The hydrophilic hydroxyl group interacts via hydrogen bondswith the water phase while the hydrophobic rest of the alcohol is directed away from25
the droplet and reduced the surface tension. A reduction of surface tension increasesthe nucleation mode particles since the barrier to nucleate is reduced. The highestincrease in nucleation occurred for 2-propanol followed by methanol, 1-butanol, and
240
ACPD4, 227–265, 2004
Effect of organiccompounds on
nanoparticleformation
U. Mathis et al.
Title Page
Abstract Introduction
Conclusions References
Tables Figures
J I
J I
Back Close
Full Screen / Esc
Print Version
Interactive Discussion
© EGU 2004
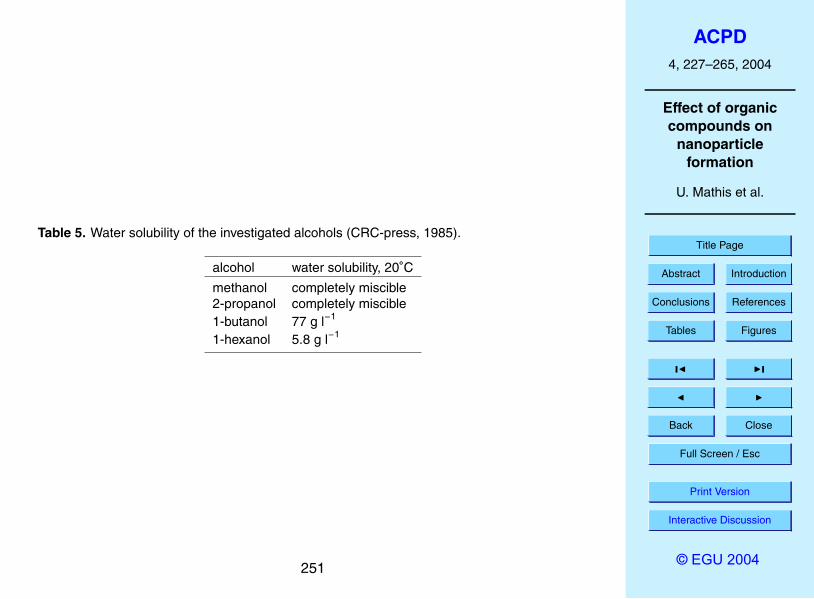
1-hexanol. The calculated reduction of surface tension was consistent with the ob-served increase of the nucleation mode particles shown in Fig. 9. No difference ofmethanol and 1-butanol were found because both alcohols increased nucleation modeparticles to a similar level. 1-hexanol showed a distinctly lower increase of nucleationmode particles than the other investigated alcohols. In Table 5 the water solubility of5
the alcohols are listed. Methanol and 2-propanol containing a short hydrophobic chainare miscible with water and thus, a stronger nucleation is expected than for the morehydrophobic 1-butanol and 1-hexanol. 1-butanol showed a more pronounced growthof nucleation mode particles than 1-hexanol, which can be explained by the more than13 times higher water solubility of 1-butanol. For the two more hydrophobic alcohols10
a two-phase system is expected causing a lower nucleation rate if the concentrationexceeds their water solubility.
4. Conclusions
The role of organic vapors in the dilution air of diesel exhaust was investigated at con-stant vehicle speed. Three different settings of conditions A (T=44.9◦C, RH=36.3%),15
B (T=44.3◦C, RH=81.2%), and C (T=34.7◦C, RH=31.6%) were defined by the twocrucial nucleation parameters, sample humidity and sample temperature. Increasedhumidity initiated nucleation at the higher sample temperature and increased the exist-ing nucleation mode at the lower sample temperature. As soon as the humidity initiatedthe nucleation process, the nucleation particles concentration showed a linear correla-20
tion with relative humidity of the sample. The increase of nucleation mode particles ata sample temperature of 44.9◦C was about 40% higher than at a sample temperatureof 34.7◦C.
It was observed that organic compounds played a key role in nucleation. Becausethere is little knowledge of the chemical composition of the organic compounds involv-25
ing in the formation of nucleation particles, we studied a broad selection of organiccompounds. Aliphatic hydrocarbons (hexane and cyclohexane) turned out to be with-
241
ACPD4, 227–265, 2004
Effect of organiccompounds on
nanoparticleformation
U. Mathis et al.
Title Page
Abstract Introduction
Conclusions References
Tables Figures
J I
J I
Back Close
Full Screen / Esc
Print Version
Interactive Discussion
© EGU 2004
out effect on the nucleation process due to their high volatility. The hydrophobic toluenecould initiated and slightly increased a pre-existing nucleation mode at high concentra-tion. However, hydrophobic compounds without any functional groups and with vaporpressure equal or higher than toluene are unlikely to substantially contribute to the nu-cleation mode particles of diluted diesel exhaust. Aniline was capable of reducing the5
nucleation mode particles. Because of its basic character, aniline is proposed to neu-tralize the sulfuric acid and prevent nucleation of sulfuric acid and water. Alcohols gen-erally increased nucleation mode particles. Two parameters affected the potential ofnucleation, reduction of surface tension and water solubility. Increasing water solubilityand decreasing surface tension led to stronger nucleation. 2-propanol, with the high-10
est reduction in surface tension and water miscibility, increased nucleation most. Thelower potential for nucleation of the water miscible methanol can be explained by thelower reduction of the surface tension compared to 2-propanol. Nucleation mode parti-cles were less influenced by the more hydrophobic 1-hexanol. Although 1-hexanol and1-butanol reduce the surface tension to a comparable extent, 1-butanol increased the15
concentration of nucleation mode particles significantly more than 1-hexanol. A pos-sible reason for this finding could be the 13 times higher water solubility of 1-butanol.Acetone and MTBE reduced nucleation mode particles; we presently do not have anysatisfactory explanation for this behavior. In the case of MTBE, the nucleation couldbe suppressed almost completely. Further work has to be undertaken to understand20
the influence of organic compounds in reduction of nucleation mode particles in moredetail.
Acknowledgements. This project was funded by the Swiss Federal Office for Education andScience (BBW). We thank R. Crockett from EMPA for critical review.
References25
Abdul-Khalek, I. S., Kittelson, D. B., and Brear, F.: The influence of dilution conditions on dieselexhaust particle size distribution measurements, SAE Technical Paper Series, No. 1999-01-
242
ACPD4, 227–265, 2004
Effect of organiccompounds on
nanoparticleformation
U. Mathis et al.
Title Page
Abstract Introduction
Conclusions References
Tables Figures
J I
J I
Back Close
Full Screen / Esc
Print Version
Interactive Discussion
© EGU 2004
1142, 1999.CRC-press: CRC Handbook of chemistry and physics, Boca Raton, FL, CRC Press, 1985.Donaldson, K., Li, X. Y., and MacNee, W.: Ultrafine (nanometre) particle mediated lung injury,
J. Aerosol. Sci., 29, 553–560, 1998.Giebl, H., Berner, A., Reischl, G., Puxbaum, H., Kasper-Giebl, A., and Hitzenberger, R.: CCN5
activation of oxalic and malonic acid test aerosols with the University of Vienna cloud con-densation nuclei counter, J. Aerosol. Sci., 33, 1623–1634, 2002.
Hegg, D. A., Gao, S., Hoppel, W., Frick, G., Caffrey, P., Leaitch, W. R., Shantz, N., Ambrusko,J., and Albrechcinski, T.: Laboratory studies of the efficiency of selected organic aerosols asCCN, Atmos. Res., 58, 155–166, 2001.10
Kerminen, V. M., Virkkula, A., Hillamo, R., Wexler, A. S., and Kulmala, M.: Secondary organ-ics and atmospheric cloud condensation nuclei production, J. Geophys. Res.-Atmos., 105,9255–9264, 2000.
Khalek, I. A., Kittelson, D. B., and Brear, F.: Nanoparticle growth during dilution and coolingof diesel exhaust: Experimental investigation and theoretical assessment, SAE Technical15
Paper Series, No. 2000-01-0515, 2000.Kilgour, J. D., Rattray, N. J., Foster, J., Soames, A., and Hext, P. M.: Pulmonary responses and
recovery following single and repeated inhalation exposure of rats to polymeric methylenediphenyl diisocyanate aerosols, J. Appl. Toxicol., 22, 371–385, 2002.
Kim, C. S. and Jaques, P. A.: Respiratory dose of inhaled ultrafine particles in healthy adults,20
Philos. Trans. R. Soc. Lond. Ser. A-Math. Phys. Eng. Sci., 358, 2693–2705, 2000.Kim, D., Gautam, M., and Gera, D.: Parametric studies on the formation of diesel particulate
matter via nucleation and coagulation modes, J. Aerosol. Sci., 33, 1609–1621, 2002.Kittelson, D. B.: Engines and nanoparticles: A review, J. Aerosol. Sci., 29, 575–588, 1998.Kittelson, D. B.: Particle measurement methodology: Comparison of on-road and lab diesel25
particle size distribution, Proceedings of the 6th International ETH-Conference on Nanopar-ticle Measurements, 19–21 August, 2002.
Krahenbuhl, M. A. and Gmehling, J.: Vapor-pressures of methyl tert-butyl ether, ethyl tert-butylether, isopropyl tert-butyl ether, tert-amyl methyl-ether, and tert-amyl ethyl ether, J. Chem.Eng. Data, 39, 759–762, 1994.30
Lange, N. A. and Dean, J. A.: Lange’s handbook of chemistry, McGraw-Hill, New York, 1973.Maricq, M. M., Chase, R. E., and Podsiadlik, D. H.: Vehicle exhaust particle size distributions:
A comparison of tailpipe and dilution tunnel measurements, SAE Technical Paper Series,
243
ACPD4, 227–265, 2004
Effect of organiccompounds on
nanoparticleformation
U. Mathis et al.
Title Page
Abstract Introduction
Conclusions References
Tables Figures
J I
J I
Back Close
Full Screen / Esc
Print Version
Interactive Discussion
© EGU 2004
No. 1999-01-1461, 1999.Mathis, U.: Influencing parameters of nanoparticle formation from diesel exhaust, Proceedings
of the 6th International ETH-Conference on Nanoparticle Measurements, 19–21 August,2002.
Mikkanen, P., Moisio, M., Keskinen, J., Ristimaki, J., and Marjamaki, M.: Sampling method for5
particle measurements of vehicle exhaust, SAE Technical Paper Series, No. 2001-01-0219,2001.
Mohr, M., Jaeger, L. W., and Boulouchos, K.: The influence of engine parameters on particulateemissions, Motortechnische Zeitschrift, 9, 25–28, 2001.
Napari, I., Kulmala, M., and Vehkamaki, H.: Ternary nucleation of inorganic acids, ammonia,10
and water, J. Chem. Phys., 117, 8418–8425, 2002.Ntziachristos, L., Samaras, Z., Pistikopoulos, P., and Kyriakis, N.: Statistical analysis of diesel
fuel effects on particle number and mass emissions, Environ. Sci. Technol., 34, 5106–5114,2000.
Oberdorster, G.: Pulmonary effects of inhaled ultrafine particles, Int. Arch. Occup. Environ.15
Health, 74, 1–8, 2001.Petrovic, S., Urch, B., Brook, J., Datema, J., Purdham, J., Liu, L., Lukic, Z., Zimmerman, B.,
Tofler, G., Downar, E., Corey, P., Tarlo, S., Broder, I., Dales, R., and Silverman, F.: Car-diorespiratory effects of concentrated ambient PM2.5: A pilot study using controlled humanexposures, Inhal. Toxicol., 12, 173–188, 2000.20
Poling, B. E., Prausnitz, J. M., and O’Connell, J. P.: The properties of gases and liquids,McGraw-Hill, New York, 2001.
Pope, C. A.: Review: Epidemiological basis for particulate air pollution health standards,Aerosol Sci. Technol., 32, 4–14, 2000.
Poulopoulos, S. G. and Philippopoulos, C. J.: The effect of adding oxygenated compounds to25
gasoline on automotive exhaust emissions, J. Eng. Gas. Turbines Power-Trans. ASME, 125,344–350, 2003.
Sakurai, H., Tobias, H. J., Park, K., Zarling, D., Docherty, S., Kittelson, D. B., McMurry, P. H.,and Ziemann, P. J.: On-line measurements of diesel nanoparticle composition and volatility,Atmos. Environ., 37, 1199–1210, 2003.30
Seinfeld, J. H. and Pandis, S. N.: Atmospheric chemistry and physics from air pollution toclimate change, Wiley, New York, 1998.
Shi, J. P. and Harrison, R. M.: Investigation of ultrafine particle formation during diesel exhaust
244
ACPD4, 227–265, 2004
Effect of organiccompounds on
nanoparticleformation
U. Mathis et al.
Title Page
Abstract Introduction
Conclusions References
Tables Figures
J I
J I
Back Close
Full Screen / Esc
Print Version
Interactive Discussion
© EGU 2004
dilution, Environ. Sci. Technol., 33, 3730–3736, 1999.Soskolne, C. L., Zeighami, E. A., Hanis, N. M., Kupper, L. L., Herrmann, N., Amsel, J., Mausner,
J. S., and Stellman, J. M.: Laryngeal-cancer and occupational exposure to sulfuric-acid, Am.J. Epidemiol., 120, 358–369, 1984.
Swenberg, J. A. and Beauchamp, R. O.: A review of the chronic toxicity, carcinogenicity, and5
possible mechanisms of action of inorganic acid mists in animals, Crit. Rev. Toxicol., 27,253–259, 1997.
Sydbom, A., Blomberg, A., Parnia, S., Stenfors, N., Sandstrom, T., and Dahlen, S. E.: Healtheffects of diesel exhaust emissions, Eur. Resp. J., 17, 733–746, 2001.
Tamura, M., Kurata, M., and Odani, H.: Practical method for estimating surface tensions of10
solutions, Bull. Chem. Soc. Jpn., 28, 83–88, 1955.Tobias, H. J., Beving, D. E., Ziemann, P. J., Sakurai, H., Zuk, M., McMurry, P. H., Zarling, D.,
Waytulonis, R., and Kittelson, D. B.: Chemical analysis of diesel engine nanoparticles usinga nano- DMA/thermal desorption particle beam mass spectrometer, Environ. Sci. Technol.,35, 2233–2243, 2001.15
Vogt, R., Scheer, V., Casati, R., and Benter, T.: On-road measurement of particle emission inthe exhaust plume of a diesel passenger car, Environ. Sci. Technol., 37, 4070–4076, 2003.
Yu, F. Q.: Chemiions and nanoparticle formation in diesel engine exhaust, Geophys. Res. Lett.,28, 4191–4194, 2001.
Yu, F. Q.: Chemiion evolution in motor vehicle exhaust: Further evidence of its role in nanopar-20
ticle formation, Geophys. Res. Lett., 29, art. no. 1717, 2002.Yu, S. C.: Role of organic acids (formic, acetic, pyruvic and oxalic) in the formation of cloud
condensation nuclei (CCN): a review, Atmos. Res., 53, 185–217, 2000.Zhang, K. M. and Wexler, A. S.: A hypothesis for growth of fresh atmospheric nuclei, J. Geo-
phys. Res.-Atmos., 107, art. no. 4577, 2002.25
245
ACPD4, 227–265, 2004
Effect of organiccompounds on
nanoparticleformation
U. Mathis et al.
Title Page
Abstract Introduction
Conclusions References
Tables Figures
J I
J I
Back Close
Full Screen / Esc
Print Version
Interactive Discussion
© EGU 2004
Table 1. Engine parameters of the vehicle.
displacement per cylinder 1896 cm3
number of cylinder 4maximum power/rpm 81 kW/4150 min−1
aftertreatment system oxidation catalystmodel year 1999
246
ACPD4, 227–265, 2004
Effect of organiccompounds on
nanoparticleformation
U. Mathis et al.
Title Page
Abstract Introduction
Conclusions References
Tables Figures
J I
J I
Back Close
Full Screen / Esc
Print Version
Interactive Discussion
© EGU 2004
Table 2. Fuel analysis of the diesel.
analysis unit result
sulfur ppm 323cetan index – 49.1density at 15◦C kg m−3 831viscosity at 40◦C mm2 s−1 2.41flash point ◦C 62.5aromatics volume-% 24.7
247
ACPD4, 227–265, 2004
Effect of organiccompounds on
nanoparticleformation
U. Mathis et al.
Title Page
Abstract Introduction
Conclusions References
Tables Figures
J I
J I
Back Close
Full Screen / Esc
Print Version
Interactive Discussion
© EGU 2004
Table 3. Average and standard deviation of the key parameters for all test series.
compound dilution relative sample exhaust number ofration humidity temperature temperature measurements
(RH) (T )
condition Ahexane 8.1±0.1 37.2±0.5 45.0a 149.4±0.1 3cyclohexane 8.0±0.2 38.2±0.9 45.0a 149.3±0.2 5toluene 8.0±0.1 36.5±0.4 45.2a 150.7±0.3 8aniline 8.1±0.0 35.9±0.0 45.9a 150.7±0.1 3acetone 8.0±0.1 36.8±0.3 45.8±0.4 151.1±0.2 4MTBE 8.1±0.1 36.4±0.2 44.7±0.8 151.1±0.2 5methanol 8.4±0.1 35.9±0.4 45.6±1.1 153.1±0.2 82-propanol 8.1±0.1 36.8±0.2 45.0±0.2 153.1±0.4 51-butanol 8.3±0.1 36.1±0.2 44.7±0.1 151.6±0.2 51-hexanol 8.2±0.1 36.6±0.4 44.8±0.0 151.8±0.3 5average 8.2±0.2 36.3±0.9 44.9±0.7 150.8±1.7 51condition Bhexane 8.3±0.1 80.7±0.2 45.2a 150.0±0.2 3cyclohexane 8.4±0.1 81.7±0.1 44.8±0.1 150.2±0.2 3toluene 8.2±0.1 80.9±0.8 44.7±0.5 148.0±0.2 8aniline 8.1±0.4 82.1±1.5 43.1±0.2 157.9±0.1 4acetone 8.3±0.1 84.4±1.9 43.0±0.1 149.3±0.3 5MTBE 8.3±0.1 82.3±0.6 43.1a 149.7±0. 3methanol 8.7±0.1 81.8±0.5 44.7±0.4 152.6±0.3 72-propanol 8.6±0.1 81.9±0.7 44.5±0.1 153.0±0.2 51-butanol 8.5±0.1 82.1±0.5 44.6±0.1 152.9±0.2 61-hexanol 8.3±0.9b 85.2±3.2 45.1±0.3 153.0±0.2 5average 8.4±0.2 81.2±3.8 44.3±0.9 151.1±2.7 49
248
ACPD4, 227–265, 2004
Effect of organiccompounds on
nanoparticleformation
U. Mathis et al.
Title Page
Abstract Introduction
Conclusions References
Tables Figures
J I
J I
Back Close
Full Screen / Esc
Print Version
Interactive Discussion
© EGU 2004
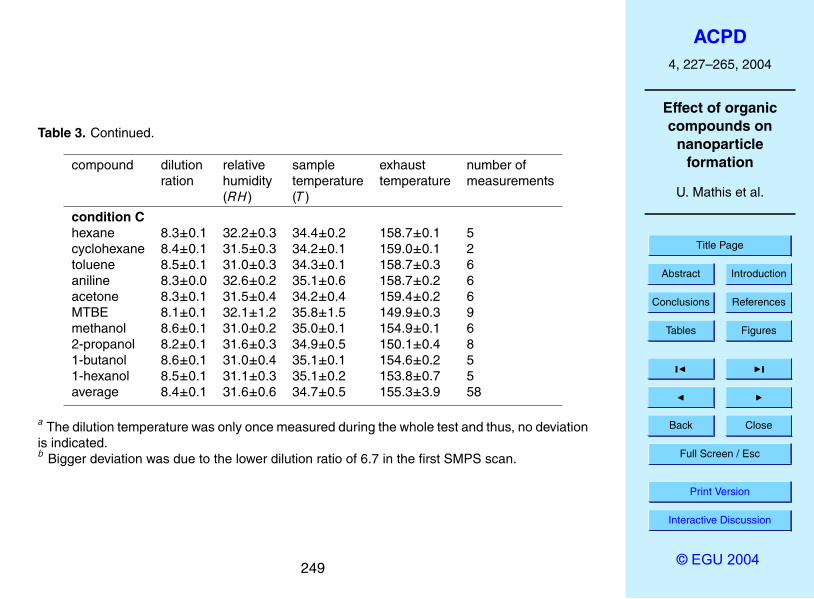
Table 3. Continued.
compound dilution relative sample exhaust number ofration humidity temperature temperature measurements
(RH) (T )
condition Chexane 8.3±0.1 32.2±0.3 34.4±0.2 158.7±0.1 5cyclohexane 8.4±0.1 31.5±0.3 34.2±0.1 159.0±0.1 2toluene 8.5±0.1 31.0±0.3 34.3±0.1 158.7±0.3 6aniline 8.3±0.0 32.6±0.2 35.1±0.6 158.7±0.2 6acetone 8.3±0.1 31.5±0.4 34.2±0.4 159.4±0.2 6MTBE 8.1±0.1 32.1±1.2 35.8±1.5 149.9±0.3 9methanol 8.6±0.1 31.0±0.2 35.0±0.1 154.9±0.1 62-propanol 8.2±0.1 31.6±0.3 34.9±0.5 150.1±0.4 81-butanol 8.6±0.1 31.0±0.4 35.1±0.1 154.6±0.2 51-hexanol 8.5±0.1 31.1±0.3 35.1±0.2 153.8±0.7 5average 8.4±0.1 31.6±0.6 34.7±0.5 155.3±3.9 58
a The dilution temperature was only once measured during the whole test and thus, no deviationis indicated.b Bigger deviation was due to the lower dilution ratio of 6.7 in the first SMPS scan.
249
ACPD4, 227–265, 2004
Effect of organiccompounds on
nanoparticleformation
U. Mathis et al.
Title Page
Abstract Introduction
Conclusions References
Tables Figures
J I
J I
Back Close
Full Screen / Esc
Print Version
Interactive Discussion
© EGU 2004
Table 4. Molecular structure of the investigated organic compounds.
compound structure
hexane
cyclohexane
toluene
aniline
acetone
methyl tert-butylether (MTBE)
methanol
2-propanol
1-butanol
1-hexanol
NH2
O
O
OH
OH
OH
OH
250
ACPD4, 227–265, 2004
Effect of organiccompounds on
nanoparticleformation
U. Mathis et al.
Title Page
Abstract Introduction
Conclusions References
Tables Figures
J I
J I
Back Close
Full Screen / Esc
Print Version
Interactive Discussion
© EGU 2004
Table 5. Water solubility of the investigated alcohols (CRC-press, 1985).
alcohol water solubility, 20◦C
methanol completely miscible2-propanol completely miscible1-butanol 77 g l−1
1-hexanol 5.8 g l−1
251
ACPD4, 227–265, 2004
Effect of organiccompounds on
nanoparticleformation
U. Mathis et al.
Title Page
Abstract Introduction
Conclusions References
Tables Figures
J I
J I
Back Close
Full Screen / Esc
Print Version
Interactive Discussion
© EGU 2004
Fig. 1. Overview of the experimental set-up.
252
ACPD4, 227–265, 2004
Effect of organiccompounds on
nanoparticleformation
U. Mathis et al.
Title Page
Abstract Introduction
Conclusions References
Tables Figures
J I
J I
Back Close
Full Screen / Esc
Print Version
Interactive Discussion
© EGU 2004
42
43
44
45
46
47
0 200 400 600 800 1000 1200 1400 1600concentration of isopropanol in the dilution air [ppm]
sam
ple
tem
pera
ture
[°C
]
145
146
147
148
149
150
exha
ust t
empe
ratu
re [°
C]
sample temperature exhaust temperature
Fig. 2. Variation of sample and exhaust temperatures as a function of the 2-propanol concen-tration in the sample air.
253
ACPD4, 227–265, 2004
Effect of organiccompounds on
nanoparticleformation
U. Mathis et al.
Title Page
Abstract Introduction
Conclusions References
Tables Figures
J I
J I
Back Close
Full Screen / Esc
Print Version
Interactive Discussion
© EGU 2004
0.0E+00
1.0E+08
2.0E+08
3.0E+08
4.0E+08
5.0E+08
6.0E+08
7.0E+08
dN/d
log
dp [c
m-3
]
99
84
69
62
41
relative humidity [%] sample temperature: 45.0 °C
0.0E+00
1.0E+08
2.0E+08
3.0E+08
4.0E+08
5.0E+08
6.0E+08
7.0E+08
1 10 100 1000electrical mobility particle diameter dp [nm]
dN/d
log
dp [c
m-3
]
81
67
62
50
42
31
relative humidity [%] sample temperature: 34.2 °C
Fig. 3. Influence of humidity on the nucleation mode. A weak nucleation was detected atthe lowest relative humidity of 41% and sample temperature 45.0◦C. The nucleation increasedmore than one order of magnitude when the relative humidity increased to 99%. For the sampletemperature 34.2◦C a nucleation mode was observed even with the lowest relative humidity31%. Therefore, the increase of nucleation was less pronounced than at sample temperature45.0◦C.
254
ACPD4, 227–265, 2004
Effect of organiccompounds on
nanoparticleformation
U. Mathis et al.
Title Page
Abstract Introduction
Conclusions References
Tables Figures
J I
J I
Back Close
Full Screen / Esc
Print Version
Interactive Discussion
© EGU 2004
0
0.5
1
1.5
2
2.5
3
3.5
4
4.5
0 10 20 30 40 50 60 70 80 90 100relative humidity of sample [%]
ratio
(mod
e <3
0nm
)/(m
ode
>30n
m) [
-]
sample temperature: 34.2 °C
sample temperature: 45.0 °C
Fig. 4. Strength of nucleation for variable humidity. The linear regression in the linear regionresulted in a correlation factor of R2=0.94 and R2=0.96 at sample temperature 34.2◦C and45.0◦C, respectively.
255
ACPD4, 227–265, 2004
Effect of organiccompounds on
nanoparticleformation
U. Mathis et al.
Title Page
Abstract Introduction
Conclusions References
Tables Figures
J I
J I
Back Close
Full Screen / Esc
Print Version
Interactive Discussion
© EGU 2004
27
condition A (T=44.9 °C, RH=36.3 %) condition B (T=44.3 °C, RH=81.2 %) condition C (T=34.7 °C, RH=31.6 %)
hexane
cyclohexane
Figure 5. continued.
0
0.05
0.1
0.15
0.2
0.25
0.3
0.35
0.4
0.0 0.1 0.2 0.3 0.4 0.5saturation ratio [%]
ratio
(mod
e <3
0nm
)/(m
ode
>30n
m)
0
0.1
0.2
0.3
0.4
0.5
0.6
0.7
0.0 0.1 0.2 0.3 0.4 0.5saturation ratio [%]
ratio
(mod
e <3
0nm
)/(m
ode
>30n
m)
0
0.5
1
1.5
2
2.5
3
3.5
4
4.5
0.0 0.1 0.2 0.3 0.4 0.5saturation ratio [%]
ratio
(mod
e <3
0nm
)/(m
ode
>30n
m)
0
0.1
0.2
0.3
0.4
0.5
0.6
0.7
0.0 0.1 0.2 0.3 0.4 0.5saturation ratio [%]
ratio
(mod
e <3
0nm
)/(m
ode
>30n
m)
0
0.5
1
1.5
2
2.5
3
3.5
4
4.5
0.0 0.1 0.2 0.3 0.4 0.5saturation ratio [%]
ratio
(mod
e <3
0nm
)/(m
ode
>30n
m)
0
0.05
0.1
0.15
0.2
0.25
0.3
0.35
0.4
0.0 0.1 0.2 0.3 0.4 0.5 0.6 0.7saturation ratio [%]
ratio
(mod
e <3
0nm
)/(m
ode
>30n
m)
Fig. 5. Effect of the investigated organic compounds on the nucleation mode particles undercondition A, B and C.
256
ACPD4, 227–265, 2004
Effect of organiccompounds on
nanoparticleformation
U. Mathis et al.
Title Page
Abstract Introduction
Conclusions References
Tables Figures
J I
J I
Back Close
Full Screen / Esc
Print Version
Interactive Discussion
© EGU 2004
28
toluene
aniline
Figure 5. continued.
0
0.05
0.1
0.15
0.2
0.25
0.3
0.35
0.4
0.0 0.5 1.0 1.5 2.0 2.5saturation ratio [%]
ratio
(mod
e <3
0nm
)/(m
ode
>30n
m)
0
0.1
0.2
0.3
0.4
0.5
0.6
0.7
0.8
0.9
0.0 0.5 1.0 1.5 2.0 2.5saturation ratio [%]
ratio
(mod
e <3
0nm
)/(m
ode
>30n
m)
0
0.5
1
1.5
2
2.5
3
3.5
4
4.5
0.0 0.5 1.0 1.5 2.0 2.5saturation ratio [%]
ratio
(mod
e <3
0nm
)/(m
ode
>30n
m)
0
0.05
0.1
0.15
0.2
0.25
0.3
0.35
0.4
0 20 40 60 80 100saturation ratio [%]
ratio
(mod
e <3
0nm
)/(m
ode
>30n
m)
0
0.1
0.2
0.3
0.4
0.5
0.6
0.7
0 20 40 60 80 100saturation ratio [%]
ratio
(mod
e <3
0nm
)/(m
ode
>30n
m)
0
0.5
1
1.5
2
2.5
3
3.5
4
4.5
0 20 40 60 80 100saturation ratio [%]
ratio
(mod
e <3
0nm
)/(m
ode
>30n
m)
Fig. 5. Continued.
257
ACPD4, 227–265, 2004
Effect of organiccompounds on
nanoparticleformation
U. Mathis et al.
Title Page
Abstract Introduction
Conclusions References
Tables Figures
J I
J I
Back Close
Full Screen / Esc
Print Version
Interactive Discussion
© EGU 2004
29
acetone
methyl tert-butyl ether(MTBE)
Figure 5. continued.
0
0.05
0.1
0.15
0.2
0.25
0.3
0.35
0.4
0.0 0.1 0.2 0.3 0.4 0.5 0.6
saturation ratio [%]
ratio
(mod
e <3
0nm
)/(m
ode
>30n
m)
0
0.1
0.2
0.3
0.4
0.5
0.6
0.7
0.0 0.1 0.2 0.3 0.4 0.5 0.6saturation ratio [%]
ratio
(mod
e <3
0nm
)/(m
ode
>30n
m)
0
0.5
1
1.5
2
2.5
3
3.5
0.0 0.1 0.2 0.3 0.4 0.5 0.6saturation ratio [%]
ratio
(mod
e <3
0nm
)/(m
ode
>30n
m)
0
0.05
0.1
0.15
0.2
0.25
0.3
0.35
0.4
0.0 0.1 0.1 0.2 0.2 0.3 0.3 0.4saturation ratio [%]
ratio
(mod
e <3
0nm
)/(m
ode
>30n
m)
0
0.1
0.2
0.3
0.4
0.5
0.6
0.7
0.0 0.1 0.1 0.2 0.2 0.3 0.3 0.4saturation ratio [%]
ratio
(mod
e <3
0nm
)/(m
ode
>30n
m)
0
0.5
1
1.5
2
2.5
3
0.0 0.1 0.1 0.2 0.2 0.3 0.3 0.4saturation ratio [%]
ratio
(mod
e <3
0nm
)/(m
ode
>30n
m)
Fig. 5. Continued.
258
ACPD4, 227–265, 2004
Effect of organiccompounds on
nanoparticleformation
U. Mathis et al.
Title Page
Abstract Introduction
Conclusions References
Tables Figures
J I
J I
Back Close
Full Screen / Esc
Print Version
Interactive Discussion
© EGU 2004
30
methanol
2-propanol
Figure 5. continued.
0
0.5
1
1.5
2
2.5
3
3.5
0.0 0.5 1.0 1.5 2.0 2.5 3.0 3.5saturation ratio [%]
ratio
(mod
e <3
0nm
)/(m
ode
>30n
m)
0
0.05
0.1
0.15
0.2
0.25
0.3
0.35
0.4
0.0 0.5 1.0 1.5 2.0 2.5 3.0 3.5saturation ratio [%]
ratio
(mod
e <3
0nm
)/(m
ode
>30n
m)
0
1
2
3
4
5
6
7
8
0.0 0.5 1.0 1.5 2.0 2.5 3.0 3.5saturation ratio [%]
ratio
(mod
e <3
0nm
)/(m
ode
>30n
m)
0
0.5
1
1.5
2
2.5
0 1 2 3 4 5saturation ratio [%]
ratio
(mod
e <3
0nm
)/(m
ode
>30n
m)
0
0.5
1
1.5
2
2.5
3
3.5
0 1 2 3 4 5saturation ratio [%]
ratio
(mod
e <3
0nm
)/(m
ode
>30n
m)
0
1
2
3
4
5
6
7
8
0 1 2 3 4 5saturation ratio [%]
ratio
(mod
e <3
0nm
)/(m
ode
>30n
m)
Fig. 5. Continued.
259
ACPD4, 227–265, 2004
Effect of organiccompounds on
nanoparticleformation
U. Mathis et al.
Title Page
Abstract Introduction
Conclusions References
Tables Figures
J I
J I
Back Close
Full Screen / Esc
Print Version
Interactive Discussion
© EGU 2004
31
1-butanol
1-hexanol
Figure 5. Effect of the investigated organic compounds on the nucleation mode particles under condition A, B and C.
0
0.5
1
1.5
2
2.5
0 5 10 15 20saturation ratio [%]
ratio
(mod
e <3
0nm
)/(m
ode
>30n
m)
0
1
2
3
4
5
6
7
8
0 5 10 15 20saturation ratio [%]
ratio
(mod
e <3
0nm
)/(m
ode
>30n
m)
0
0.5
1
1.5
2
2.5
3
3.5
0 10 20 30 40 50 60 70saturation ratio [%]
ratio
(mod
e <3
0nm
)/(m
ode
>30n
m)
0
0.5
1
1.5
2
2.5
3
3.5
0 10 20 30 40 50 60 70saturation ratio [%]
ratio
(mod
e <3
0nm
)/(m
ode
>30n
m)
0
1
2
3
4
5
6
7
8
0 10 20 30 40 50 60 70saturation ratio [%]
ratio
(mod
e <3
0nm
)/(m
ode
>30n
m)
0
0.5
1
1.5
2
2.5
3
3.5
0 5 10 15 20saturation ratio [%]
ratio
(mod
e <3
0nm
)/(m
ode
>30n
m)
Fig. 5. Continued.
260
ACPD4, 227–265, 2004
Effect of organiccompounds on
nanoparticleformation
U. Mathis et al.
Title Page
Abstract Introduction
Conclusions References
Tables Figures
J I
J I
Back Close
Full Screen / Esc
Print Version
Interactive Discussion
© EGU 2004
0.0E+00
2.0E+07
4.0E+07
6.0E+07
8.0E+07
1.0E+08
1.2E+08
1.4E+08
1.6E+08
1.8E+08
dN/d
log
dp [c
m-3
]
>5600>1.87
48631.57
400.01
670.003
concentration of toluene [ppm] / saturation ratio [%]
condition A
0.0E+00
2.0E+07
4.0E+07
6.0E+07
8.0E+07
1.0E+08
1.2E+08
1.4E+08
1.6E+08
1.8E+08
1 10 100 1000electrical mobility particle diameter dp [nm]
dN/d
log
dp [c
m-3
] 131920.2
247742.3
284046.0
concentration ofaniline [ppm] /saturation ratio [%]
condition B
Fig. 6. Particle size distribution in the presence of aromatic compounds. The effects on thenucleation mode particles are presented for toluene (top panel) and aniline (bottom panel)under condition A (T=44.9◦C, RH=36.3%) and B (T=44.3◦C, RH=81.2%), respectively.
261
ACPD4, 227–265, 2004
Effect of organiccompounds on
nanoparticleformation
U. Mathis et al.
Title Page
Abstract Introduction
Conclusions References
Tables Figures
J I
J I
Back Close
Full Screen / Esc
Print Version
Interactive Discussion
© EGU 2004
0.0E+00
1.0E+08
2.0E+08
3.0E+08
4.0E+08
5.0E+08
6.0E+08
1 10 100 1000electrical mobility particle diameter dp [nm]
dN/d
log
dp [c
m-3
] 410.002
1250.005
>14000>0.56
concentration ofacetone [ppm] /saturation ratio [%]
condition C
Fig. 7. Particle size distribution in the presence of acetone. Reduction of the nucleation modeparticles occurred under condition C (T=34.7◦C, RH=31.6%).
262
ACPD4, 227–265, 2004
Effect of organiccompounds on
nanoparticleformation
U. Mathis et al.
Title Page
Abstract Introduction
Conclusions References
Tables Figures
J I
J I
Back Close
Full Screen / Esc
Print Version
Interactive Discussion
© EGU 2004
0.0E+00
5.0E+07
1.0E+08
1.5E+08
2.0E+08
2.5E+08
3.0E+08
3.5E+08
dN/d
log
dp [c
m-3
]
330.001
620.002
>8300>0.30
concentration of MTBE [ppm] /saturation ratio [%]
condition B
0.0E+00
5.0E+07
1.0E+08
1.5E+08
2.0E+08
2.5E+08
3.0E+08
3.5E+08
1 10 100 1000electrical mobility particle diameter dp [nm]
dN/d
log
dp [c
m-3
]
110.0004150.000561470.23>8300>0.30>8300>0.30
concentration ofMTBE [ppm] /saturation ratio [%]
condition C
Fig. 8. Particle size distribution in the presence of MTBE under condition B (T=44.3◦C,RH=81.2%) and C (T=34.7◦C, RH=31.6%) on top panel and on bottom panel, respectively.In both cases the nucleation mode particles were reduced.
263
ACPD4, 227–265, 2004
Effect of organiccompounds on
nanoparticleformation
U. Mathis et al.
Title Page
Abstract Introduction
Conclusions References
Tables Figures
J I
J I
Back Close
Full Screen / Esc
Print Version
Interactive Discussion
© EGU 2004
0.0E+00
1.0E+08
2.0E+08
3.0E+08
4.0E+08
5.0E+08
6.0E+08
7.0E+08
8.0E+08
dN/d
log
dp [c
m-3
]
3.50 / 2-propanol
3.31 / 1-butanol
3.04 /methanol
8.86 / 1-hexanol
no alcohol
saturation ratio [%] /alcohol condition A
0.0E+00
1.0E+08
2.0E+08
3.0E+08
4.0E+08
5.0E+08
6.0E+08
7.0E+08
8.0E+08
dN/d
log
dp [c
m-3
]
3.82 / 2-propanol
3.04 /methanol
7.07 / 1-butanol
9.98 / 1-hexanol
no alcohol
saturation ratio [%] / alcohol condition B
0.0E+00
1.0E+08
2.0E+08
3.0E+08
4.0E+08
5.0E+08
6.0E+08
7.0E+08
8.0E+08
1 10 100 1000electrical mobility particle diameter dp [nm]
dN/d
log
dp [c
m-3
]
2.49 / 2-propanol
3.75 / 1-butanol
1.70 /methanol
3.03 / 1-hexanol
no alcohol
saturation ratio [%] /alcohol condition C
Fig. 9. Particle size distribution in the presence of methanol, 2-propanol, 1-butanol, and 1-hexanol under all three conditions A (T=44.9◦C, RH=36.3%), B (T=44.3◦C, RH=81.2%) and,C (T=34.7◦C, RH=31.6%).
264
ACPD4, 227–265, 2004
Effect of organiccompounds on
nanoparticleformation
U. Mathis et al.
Title Page
Abstract Introduction
Conclusions References
Tables Figures
J I
J I
Back Close
Full Screen / Esc
Print Version
Interactive Discussion
© EGU 2004
0.00
0.01
0.02
0.03
0.04
0.05
0.06
0.07
0.08
0.00 0.10 0.20 0.30 0.40 0.50volume fraction of alcohol
surf
ace
tens
ion
of w
ater
alco
hol m
ixtu
re [N
m-1
]
methanol2-propanol
1-hexanol1-butanol
Fig. 10. Surface tension of water-alcohol mixtures versus on the alcohol volume concentration.
265