Embed Size (px)
Citation preview
Effect of Network Structure/Topology on Mechanical Properties of Crosslinked
Polymers
A Thesis
Submitted to the Faculty
of
Drexel University
by
Majid Sharifi
in partial fulfilment of the
requirements for the degree
of
Doctor of Philosophy
May 2015

© Copyright 2015
Majid Sharifi. All Rights Reserved.

ii
Dedications
To my family, my wife and her family for their invaluable support and
inspiration.

iii
Acknowledgments
First, I would like to express my sincere gratitude to my advisor, Prof. Giuseppe
Palmese for his invaluable guidance and support during the course of my research.
Working under his supervision was a great experience. With his help, I learned
how to think independently, how to look at problems from different perspectives,
and more importantly, how to lead and manage a professional career. He helped
me grow in my academic curricula, and I will always be thankful for all his support.
I would like to express my immense gratitude to my family for their invaluable
support at every moment of my life, and foremost, my wife who has always
believed in me and inspired me. I truly acknowledge and appreciate their sincere
support, and they have been an inspiration to me. I would have never been able to
succeed in this journey without having them in my life.
I would like to thank and acknowledge my thesis committee, Profs. Cameron
Abrams, Richard Cairncross, Kenneth Lau, and Christopher Li for their willingness
to be on my dissertation committee and for their valuable advice and guidance on
this project. Special thanks to the faculty, and staff of the Chemical and Biological
Engineering department at Drexel, especially Jennifer Bing and Andrea Falcone.
I am grateful to my colleagues and friends for their assistance, in particular,
Kaustubh Ghorpade, Fengshuo Hu, Emre Kinaci, Sam Laurencin, Dr. Ian
iv
McAninch, Dr. Amy Peterson, Purnomo Pratama, Dr. Vijay Raman, Sadella Santos,
John Vergara, Dr. Arianna Watters, and Dr. Santosh Yadav. I would like to give,
with special thanks to Dr. Changwoon Jang for the molecular simulations, James
Throckmorton for his help on SEM imaging, Dr. Dmitri Barbash for the help on
SAXS measurements, and the undergraduate students who helped me on
particular aspects of this project including, Andrew Devenny, Emeka Edege,
Katelyn Kavanaugh, Hong Nguyen, and Kamil Przychodzien.
I would like to acknowledge Profs. Bazle Z. Haque, and Jack Gillespie for providing
me the opportunity to use the facilities at the University of Delaware – Center for
Composite Materials (UDCCM), and for their advice on high strain rate mechanical
characterization.
Research was sponsored by the Army Research Laboratory and was accomplished
under Cooperative Agreement Number W911NF-12-2-0022. The views and
conclusions contained in this document are those of the author and should not be
interpreted as representing the official policies, either expressed or implied, of the
Army Research Laboratory or the U.S. Government. The U.S. Government is
authorized to reproduce and distribute reprints for Government purposes
notwithstanding any copyright notation herein.
v
Table of Contents
List of Tables ........................................................................................................................... x
List of Figures ....................................................................................................................... xii
Abstract ................................................................................................................................. xxi
Chapter 1. Introduction ...................................................................................................... 1
1.1. List of References ...................................................................................................... 7
Chapter 2. Background ....................................................................................................... 9
2.1. Introduction .............................................................................................................. 9
2.2. Step-Growth Polymerization ................................................................................. 11
2.3. Epoxy-Amine Reactions ......................................................................................... 13
2.4. Cure Kinetics and Network Structure ................................................................... 16
2.5. Time-Temperature Superposition (TTS) ............................................................... 18
2.6. Modification to Polymer Network Structure ........................................................ 19
2.7. Structure-Related Properties .................................................................................. 22
2.8. List of References .................................................................................................... 23
Chapter 3. Epoxy Thermosets with Altered Network Topology via Reactive
Encapsulation of Solvent; Synthesis and Characterization ............................................. 28
3.1. Introduction ............................................................................................................ 28
3.2. Experimental ........................................................................................................... 31
3.2.1. Materials .......................................................................................................... 31
3.2.2. Solvent Selection ............................................................................................. 33
3.2.3. Resin Selection ................................................................................................. 34
3.2.4. Resin Processing .............................................................................................. 35
3.2.5. Curing Procedure ............................................................................................ 36
3.2.6. Fourier Transform Infrared Spectroscopy (FTIR) ......................................... 37
3.2.7. Thermal Drying ............................................................................................... 37
3.2.8. Dynamical Mechanical Analysis (DMA) ....................................................... 38
3.2.9. Density Measurement ..................................................................................... 38
3.2.10. Quasi-static mechanical properties ................................................................ 39
vi
3.2.11. Scanning Electron Microscopy (SEM) ........................................................... 39
3.2.12. All-atom Molecular Dynamics (MD) Simulations ........................................ 40
3.3. Results and discussion ........................................................................................... 41
3.3.1. Curing .............................................................................................................. 41
3.3.2. Drying .............................................................................................................. 43
3.3.3. Bulk Density .................................................................................................... 45
3.3.4. Dynamical Mechanical Properties ................................................................. 47
3.3.5. Topological Differences .................................................................................. 56
3.3.6. Swelling ........................................................................................................... 61
3.3.7. Minimum Topological Contour Lengths from All-Atom Simulations ....... 62
3.3.8. Quasi-Static Tensile Properties ...................................................................... 64
3.3.9. Void Size and Density..................................................................................... 73
3.3.10. Compressive Properties .................................................................................. 79
3.4. Conclusions ............................................................................................................. 83
3.5. List of References .................................................................................................... 83
Chapter 4. Porous Polymer Network Structures; Synthesis and Characterization ... 87
4.1. Introduction ............................................................................................................ 87
4.2. Experimental ........................................................................................................... 89
4.2.1. Materials .......................................................................................................... 89
4.2.2. Sample Preparation ......................................................................................... 91
4.2.3. Curing .............................................................................................................. 93
4.2.4. Equilibrium Swelling Experiment ................................................................. 93
4.2.5. Supercritical Solvent Extraction ..................................................................... 94
4.2.6. Differential Scanning Calorimetry ................................................................. 95
4.3. Results and Discussion ........................................................................................... 95
4.3.1. Equilibrium Swelling Analysis ...................................................................... 95
4.3.2. Molecular Weight between Crosslinks .......................................................... 99
4.3.3. Thermal Analysis. ......................................................................................... 103
4.3.4. Modification to the Dusek model ................................................................ 107
4.3.5. Effect of network structure on equilibrium swelling ................................. 113
4.4. Conclusion ............................................................................................................. 118
vii
4.5. List of References .................................................................................................. 119
Chapter 5. Synthesis and Characterization of Polymer Network Isomers using
Diamine-functionalized Partially Reacted Substructures (dPRS) ................................ 121
5.1. Introduction .......................................................................................................... 121
5.2. Experimental ......................................................................................................... 123
5.2.1. Materials ........................................................................................................ 123
5.2.2. Synthesis Procedure ...................................................................................... 125
5.2.3. Molecular Dynamics Simulations ................................................................ 128
5.2.4. Uniaxial Compression .................................................................................. 128
5.3. Results and Discussion ......................................................................................... 131
5.3.1. Fracture Toughness ....................................................................................... 131
5.3.2. Fracture Interface Nanostructure ................................................................. 134
5.3.3. Fracture Mechanism ..................................................................................... 144
5.3.4. Glass Transition Temperature ...................................................................... 149
5.3.5. Atomistic Molecular Dynamic Simulation .................................................. 152
5.3.6. Quasi-Static Mechanical Properties ............................................................. 157
5.3.7. Effect of Chain Length .................................................................................. 160
5.3.8. Time Temperature Superposition (TTS) ...................................................... 166
5.3.9. Swelling Study .............................................................................................. 173
5.3.10. Rate Dependent Mechanical Behavior under Compression ...................... 175
5.3.11. Effect of the Molecular Weight of the Aliphatic Curing Agents on Cure
Kinetics of Epoxy-Amine Reactions ............................................................................ 189
5.4. Conclusion ............................................................................................................. 204
5.5. List of References .................................................................................................. 205
Chapter 6. Investigating the Effect of Tg on Mechanical Properties of Epoxy-Amine
Polymer Networks with Altered Topology ..................................................................... 209
6.1. Introduction .......................................................................................................... 209
6.2. Experimental ......................................................................................................... 210
6.2.1. Material .......................................................................................................... 210
6.2.2. Processing ...................................................................................................... 213
6.3. Results and Discussion ......................................................................................... 216
6.3.1. Glass Transition Temperature ...................................................................... 220
viii
6.3.2. Mechanical Properties................................................................................... 224
6.3.3. Small Angle X-ray Scattering ....................................................................... 230
6.4. Conclusion ............................................................................................................. 235
Chapter 7. Synthesis and Characterization of Polymer Network Isomers using
Monoamine-functionalized Partially Reacted Substructures (mPRS) ......................... 236
7.1. Introduction .......................................................................................................... 236
7.2. Experimental ......................................................................................................... 240
7.2.1. Material .......................................................................................................... 240
7.2.2. Synthesis Procedure ...................................................................................... 243
7.3. Results and Discussion ......................................................................................... 246
7.3.1. Glass Transition Temperature ...................................................................... 246
7.3.2. Fracture Toughness ....................................................................................... 255
7.3.3. Quasi-Static Tensile Properties .................................................................... 264
7.3.4. Applicability of the PRS Toughening Technique to Other Epoxy Resins . 273
7.3.5. Advantages of mPRS Resins ........................................................................ 278
7.3.6. Gelation Delay in the PRS ............................................................................ 279
7.4. Conclusion ............................................................................................................. 294
7.5. List of References .................................................................................................. 295
Chapter 8. Conclusions and Recommendations for Future Work ............................ 296
8.1. Conclusions ........................................................................................................... 296
8.2. Recommendation for Future Directions.............................................................. 302
Appendix A. Mathematical Derivation of the Adjusted Dusek Equation ................... 304
Appendix B. DSC Thermographs of the Porous Polymers ............................................ 307
Appendix C. Comparing the Experimental Mc Values to the Theoretical Values...... 310
Appendix D. MATLAB code for solving the system of ODEs ....................................... 315
Appendix E. Strain Energy Release Rate ......................................................................... 317
Appendix F. Crystallization Point of the mPRS1000 Systems ......................................... 318
Appendix G. Stress-Stain Curves for the mPRS-Modified Systems ............................. 319

ix
Appendix H. Viscosity Measurement versus Cure Kinetics .......................................... 322
Vita ........................................................................................................................................ 325
x
List of Tables
Table 3.1. Averaged density values at room temperature and 40 °C above Tg................. 46
Table 3.2. DMA results: RT glassy modulus, rubbery modulus (T = Tg + 40 °C), glass
transition temperature, and peak values of tan δ......................................................... 52
Table 3.3. Tensile properties (engineering) under uniaxial tensile load at room
temperature. .................................................................................................................... 72
Table 3.4. Compressive properties of 0, 0.5, 0.75, 1 and 1.5 DEA samples. ....................... 82
Table 4.1. Chemical structures of the materials used in this study. .................................. 90
Table 4.2. Curing time at 60 °C for samples with different THF content (regardless of the
type of epoxy resin). The asterisked sample (0 TEA) was post-cured at 160 °C for 12
hrs.19 ................................................................................................................................. 92
Table 4.3. Average values of v1r , v2r , v1s , and v2s for each system.22 ................................. 98
Table 5.1. Void diameter of the structural features (cavities) measured by ImageJ. ...... 137
Table 5.2. d-spacing of the heterogeneous domains for each of the samples in this study.
........................................................................................................................................ 141
Table 5.3. Mechanical properties. Young’s modulus, Tensile strength, and Failure strain
values. ............................................................................................................................ 159
Table 5.4. Primary amine (k1) and secondary amine (k2) rate constants at each individual
run. Reaction temperature was at 80 °C. (k1 and k2 has the unit of lit2.mol-2.min-1) 198
Table 6.1. Summary of the DMA results, including Tg, tan δ, FWHM, Flexural modulus
at room temperature, and crosslinking density (ν). ................................................... 223
Table 6.2. Average values of Young’s modulus (E), tensile strength (σmax), and elongation
at break (εf). ................................................................................................................... 229
Table 7.1. Glass transition temperature of the thermosets reinforced with PEA1000. ...... 254
Table 7.2. Glass transition temperature of the thermosets reinforced with PEA600. ....... 254
Table 7.3. Average values of Young’s modulus, Tensile strength, and failure strain for
the systems reinforced with PEA1000. ........................................................................... 271
xi
Table 7.4. Average values of Young’s modulus, Tensile strength, and failure strain for
the systems reinforced with PEA600. ............................................................................ 272
Table 7.5. Average values of Young’s modulus, Tensile strength, and failure strain. ... 276
Table C.1. Mc values of the dense polymer networks; 1) Measured by the adjusted
Dusek model, 2) Calculated from the molecular size of the resins (using Vakil et al.
model), 3) Calculated from the molecular size (using Crawford et al. model). ....... 313
xii
List of Figures
Figure 1.1. Topographical schematics of the polymer network isomers that will be
considered in this work. (a) Reactive Encapsulation of Solvent (RES), (b) Diamine-
functionalized Partially Reacted Substructures (dPRS), (c) Monoamine-
functionalized Partially Reacted Substructures (mPRS). ............................................... 4
Figure 2.1. Scheme of epoxy-amine reactions. Step 1 is the epoxide-primary amine, and
step 2 is the epoxide-secondary amine.2 ....................................................................... 10
Figure 2.2. Schematic of a multifunctional monomer growth during step-growth
polymerization. The red line is the percolated path at the gelation point. ................ 12
Figure 2.3. Molecular structure of a crosslinked polymer network. .................................. 15
Figure 3.1. Molecular structures of (a) Diglycildyl Ether of Bisphenol-A (DGEBA), EPON
828, n=0.13, (b) Polyetheramine (Jeffamine D400), x=6.1, (c) Dichloromethane
(DCM). ............................................................................................................................. 32
Figure 3.2. FT-NIR spectra for epoxy-amine reactions for a sample containing
dichloromethane (0.5 DEA) at 70°C. ............................................................................. 42
Figure 3.3. Thermo-gravimetric analysis at 120 °C for samples with different initial
solvent amounts. ............................................................................................................. 44
Figure 3.4. 2D schematic network structure of a neat-cured epoxy and modified epoxy
through RES and RESD. The upper right is when solvent is removed through
supercritical extraction and lower right is when solvent removed through thermal
drying. ............................................................................................................................. 48
Figure 3.5. Dynamic Mechanical properties of the thermal heated samples with different
initial solvent content. Storage Modulus vs. Temperature. ........................................ 50
Figure 3.6. Dynamic Mechanical properties of the thermal heated samples with different
initial solvent content. Loss Modulus vs. Temperature............................................... 51
Figure 3.7. Tan δ vs. temperature for unmodified (0 DEA) and modified (1 DEA)
samples. ........................................................................................................................... 55
Figure 3.8. Apparent molecular weight between crosslinks and apparent crosslinking
density vs. initial solvent-to-monomer weight ratio. Samples are fully reacted and
identical in composition. ................................................................................................ 57
xiii
Figure 3.9. 2D schematic of an unmodified (left) and a modified (right) polymer
network. Green lines are the topological distances, red arrows are the spatial
distances and dots are crosslink points. Modified network structure has collapsed
voids with identical intermolecular packing to the unmodified structure. ............... 60
Figure 3.10. Average minimum inter-nitrogen contour length as function of the initial
amount of DCM from all-atom MD simulations.36 ...................................................... 63
Figure 3.11. Engineering stress-strain curve for unmodified, 0 DEA, (solid black line)
and modified, 1.5 DEA, (red dashed-line) samples in tensile mode. ......................... 66
Figure 3.12. RT-fracture surface of unmodified (a) and modified (b) structures. Scale
bars are 1 µm in size. The schematic is representative of network deformations and
bond reorientations during protovoid growth under tensile stress. .......................... 67
Figure 3.13. Average toughness values for each sample under uniaxial tensile load.
Error bars indicate the distribution around statistical averages. ................................ 70
Figure 3.14. Average strain-at-failure values for each sample under uniaxial tensile load.
Error bars indicate the distribution around statistical averages. ................................ 71
Figure 3.15. Average pore diameter on the fractured surface vs. initial solvent-to-
monomer weight ratio. ................................................................................................... 74
Figure 3.16. Average surface area covered by voids for RT-fracture surfaces (0 DEA, 0.5
DEA, 0.75 DEA, 1 DEA and 1.5 DEA) and freeze-fracture surfaces (1.5 DEA-FF). ... 77
Figure 3.17. Surface morphology of the modified sample, 1.5 DEA. Freeze-fracture (a)
and RT-fracture surface (b). Scale bars are both 1 µm lengthwise.............................. 78
Figure 3.18. True stress vs. (1-λ) for unmodified, 0 DEA, (solid black line) and modified,
1.5 DEA, (red dashed line) in compressive mode. ....................................................... 80
Figure 4.1. Values of molecular weight between crosslinks based on Dusek model.22 .. 101
Figure 4.2. Probable states of: (a) Dense polymer network structure (0 TEA), (b) Fully
reacted polymer network structure in presence of THF, (c) Fully reacted polymer
network structure after supercritical extraction/drying, (d) Fully reacted polymer
network structure after thermal treatment. ................................................................ 104
Figure 4.3. Glass transition temperature values for the super-critically dried samples. x-
axis is the volume fraction of solvent in the gels prior to super-critical
extraction/drying.22 ....................................................................................................... 105
xiv
Figure 4.4. Glass transition temperature vs. molecular weight between crosslinks
(measured by the Dusek model). ................................................................................ 109
Figure 4.5. Values of molecular weight between crosslinks based on the modified Dusek
model.22 .......................................................................................................................... 112
Figure 4.6. Glass transition temperature vs. adjusted molecular weight between
crosslinks.22 (measured by eqn. 4.10) .......................................................................... 114
Figure 4.7. The equilibrium volume fraction of THF in swollen state vs. relaxed state (as
prepared). ...................................................................................................................... 117
Figure 5.1. Molecular structure of the epoxy resin and the curing agents used in this
study. (a) EPON 825 (DGEBA), n=0.07, (b) Jeffamine D-4000 (PPODA), x=68, and
Jeffamine D-2000 (PPODA), x=33, (c) EPIKURE W (DETDA)................................... 124
Figure 5.2. (a) FTIR spectra, epoxy-amine reactions of PRS (DGEBA+PPODA) at 80°C.
(b) Reaction fractional conversion based on epoxide consumption. ........................ 127
Figure 5.3. (a) Gauge section of the INSTRON Machine for quasi-static compression test,
(b) Kolsky bar set-up in Direct-Impact mode for high strain rate compression test.
........................................................................................................................................ 130
Figure 5.4. Strain energy release rate, G1c. .......................................................................... 133
Figure 5.5. SEM images of the fracture surfaces of the polymer network isomers. Surface
morphology of the (a) blank samples, (b) control sample (0% conv. PRS), (c) PRS-
modified sample (60% conv. PRS), (d) PRS-modified sample (70% conv. PRS), and
(e) PRS-modified sample (80% conv. PRS). The control and modified samples are at
10% PRS content. The scale bars are 1 µm. ................................................................. 135
Figure 5.6. Scattered X-ray intensity vs. reciprocal space vector, q, for the “Control
samples”. ....................................................................................................................... 139
Figure 5.7. Scattered X-ray intensity vs. reciprocal space vector, q, for the “Modified
samples”. ....................................................................................................................... 140
Figure 5.8. Probable structural formation of the polymer network isomers. (upper)
Control systems (dispersion of isolated PPODAs). (lower) PRS-modified systems
(Coalesced PPODAs). ................................................................................................... 143
Figure 5.9. Schematic representation of nano-cavitation and shear-yielding in the plastic
zone at the control and PRS-modified systems. ......................................................... 146
xv
Figure 5.10. Room-temperature fractured (upper) vs. cold fractured (lower) surface
morphology of an 80% PRS-modified sample, at 10% PRS content. The scale bars are
1 µm. .............................................................................................................................. 148
Figure 5.11. Tan δ curves of the blank, control and modified samples at 10% PRS
content. .......................................................................................................................... 150
Figure 5.12. Glass transition temperature of the control and modified samples at
different PRS loading. The dashed line represents the Fox model. .......................... 151
Figure 5.13. Specific Volume vs. Temperature for the control (0% conv. PRS) and
modified (80% conv. PRS) systems, at 15% PRS content. Glass transition
temperature is around 410 K for the control, and 425 K for the modified systems. 154
Figure 5.14. Root-mean squared fluctuation in the center-of-mass of DETDA rings vs.
temperature for the control (0% conv. PRS) and modified systems (80% conv. PRS)
at 15% PRS content. ...................................................................................................... 156
Figure 5.15. Representative stress-strain curves under mechanical extension for the PRS-
modified (red) and Control samples at 10% PRS loading. ........................................ 158
Figure 5.16. Strain energy release rate, G1c, for the systems reinforced with PRS made
from Jeffamine D-2000. ................................................................................................ 162
Figure 5.17. Tan δ curves of the blank, control and modified samples at 15% PRS
content. .......................................................................................................................... 164
Figure 5.18. Glass transition temperature of the control and modified samples at
different PRS loading. The dashed line represents the Fox model. .......................... 165
Figure 5.19. Superimposed master-curves of tan δ vs. frequency for the polymer network
isomers at 10% PRS content. ........................................................................................ 168
Figure 5.20. Superimposed master-curves of tan δ vs. frequency for the polymer
networks at 0% PRS conversion (control systems). ................................................... 169
Figure 5.21. Activation energy of α-transition for the systems with the PRS made from
Jeffamine D-4000. .......................................................................................................... 171
Figure 5.22. Activation energy of α-transition for the systems with the PRS made from
Jeffamine D-2000. .......................................................................................................... 172
Figure 5.23. Relative solvent mass uptake for the polymer systems investigated in this
study. ............................................................................................................................. 174
xvi
Figure 5.24. Representative stress-time curves under high strain rates compressive
loading for the control samples (0% conversion PRS) at different contents of PRS. 176
Figure 5.25. Representative stress-time curves under high strain rates compressive
loading for the modified samples (80% conversion PRS) at different contents of PRS.
........................................................................................................................................ 177
Figure 5.26. Representative stress-strain curves under quasi-static strain rates
compressive loading for the control samples (0% conversion PRS) at different
contents of PRS. ............................................................................................................ 178
Figure 5.27. Representative stress-strain curves under quasi-static strain rates
compressive loading for the modified samples (80% conversion PRS) at different
contents of PRS. ............................................................................................................ 179
Figure 5.28. Compressive elastic modulus under quasi-static strain rates of the
thermosets tested in this study. ................................................................................... 181
Figure 5.29. Compressive elastic modulus under high strain rate of the thermosets tested
in this study................................................................................................................... 182
Figure 5.30. Compressive yield strength under quasi-static strain rates of the thermosets
tested in this study. ...................................................................................................... 185
Figure 5.31. Compressive yield strength under high strain rates of the thermosets tested
in this study................................................................................................................... 186
Figure 5.32. SAXS results of the polymer networks before (green curve) and after (black
curve) compression. (a) Blank sample, (b) Control sample (0% conv. PRS), (c) PRS-
modified (70% conv. PRS) and (d) PRS-modified (80% conv. PRS).......................... 188
Figure 5.33. Average values of primary amine-epoxy (k1), secondary amine-epoxy (k2)
reaction rate constants at 80 °C, from at least three replicates for each system. ...... 196
Figure 5.34. Average values of substitution factor at 80 °C, from at least three replicates
per system. .................................................................................................................... 197
Figure 5.35. Numerical (solid lines) and experimental (dots) concentration profiles of the
reactive groups during the curing reactions of DGEBA-PEA230 at 80 °C. ................ 199
Figure 5.36. Numerical (solid lines) and experimental (dots) concentration profiles of the
reactive groups during the curing reactions of DGEBA-PEA400 at 80 °C. ................ 200
Figure 5.37. Numerical (solid lines) and experimental (dots) concentration profiles of the
reactive groups during the curing reactions of DGEBA-PEA2000 at 80 °C. ............... 201
xvii
Figure 5.38. Numerical (solid lines) and experimental (dots) concentration profiles of the
reactive groups during the curing reactions of DGEBA-PEA4000 at 80 °C. ............... 202
Figure 6.1. Chemical structure of the resins used in this study. (a) Diglycidyl Ether of
Bisphenol-A (DGEBA), (b) Phenyl Glycidyl Ether (PGE), (c) DiEthyl-Toluene-
DiAmine (DETDA), (d) Poly(Propylene-Oxide)DiAmine (PPODA), x = 2.5, 6.1, 33,
68. ................................................................................................................................... 212
Figure 6.2. Molecular structure of the inert “capped PPODAs”. The value of x can be
varied depending on the PPODAs reacted with PGE. Average x = 6.1, 33, and 68 in
this study. ...................................................................................................................... 214
Figure 6.3. The dog-bone shape specimens for mechanical extension characterization.
The thermosets with capped PPODAx=68, specimens in the last row, are phase
separated. ...................................................................................................................... 217
Figure 6.4. The illustration of probable network structure when cured with and without
capped PPODAs. (a) Blank, (b) 5% capped PPODAx=6.1, (c) 5% capped PPODAx=33.219
Figure 6.5. Representative tan δ curves for the DGEBA-DETDA systems with varying
capped PPODA contents. ............................................................................................. 222
Figure 6.6. Representative stress-strain curves for the DGEBA-DETDA systems. ......... 225
Figure 6.7. Representative stress-strain curves for the DGEBA-PPODAx=2.5 systems. .... 226
Figure 6.8. Representative stress-strain curves for the DGEBA-PPODAx=6.1 systems. .... 227
Figure 6.9. Average scattered intensity of the DGEBA-PPODAx=6.1 systems prior to
mechanical extension, with average integration over the azimuthal angle (χ). ...... 232
Figure 6.10. Average scattered intensity of the DGEBA-PPODAx=6.1 systems after to
mechanical extension, with average integration over the azimuthal angle (χ). ...... 233
Figure 7.1. dPRS-modified vs. mPRS-modified systems; differences in molecular
structures. ...................................................................................................................... 239
Figure 7.2. Chemical structure of the resins used in this study. (a) tetraglycidyl of
diaminodiphenylmethane (TGDDM), (b) Jeffamine Monoamines (M-series) [Upper]
: m-600, MW = 600, PO/EO = 9/1, [Lower] : m-1000, MW = 1000, PO/EO = 3/19 , (c)
Jeffamine Diamines (D-series) D-230, MW = 230, PO ~ 2.5........................................ 242
Figure 7.3. Chemical consumption of epoxide groups as a measure of the extent of
curing reactions for TGDDM together with PEA600 and PEA1000. The reaction
temperature was at 80 °C. ............................................................................................ 244
xviii
Figure 7.4. Tan δ of the blank, control and mPRS1000-modified systems at 20% mPRS
content. .......................................................................................................................... 248
Figure 7.5. Tan δ of the blank, control and mPRS1000-modified systems at 10% mPRS
content. .......................................................................................................................... 249
Figure 7.6. Tan δ of the blank, control and mPRS600-modified systems at 20% mPRS
content. .......................................................................................................................... 251
Figure 7.7. Tan δ of the blank, control and mPRS600-modified systems at 10% mPRS
content. .......................................................................................................................... 252
Figure 7.8. Strain energy release rate, G1c, for the mPRS1000 systems................................ 256
Figure 7.9. Strain energy release rate, G1c, for the mPRS600 systems. ................................ 257
Figure 7.10. Probable structural formation of the polymer network isomers. Control
systems (dispersion of PEAs). mPRS-modified systems (Coalesced PEAs). ........... 260
Figure 7.11. SEM micrographs from the fracture surfaces of Blank, Control, and
Modified structures. The control and modified samples were at 10% mPRS content,
and the mPRS conversion was at 80%. Scale bars are 1µm in size. .......................... 262
Figure 7.12. Representative stress-strain curves for the control, and mPRS-modified
systems at 20% mPRS loading. .................................................................................... 266
Figure 7.13. Representative stress-strain curves for the control system isomers with
compositions corresponding to 0%, 10%, 15%, and 20% mPRS content. ................. 268
Figure 7.14. Representative stress-strain curves for the modified systems at 0%, 10%,
15%, and 20% mPRS content........................................................................................ 269
Figure 7.15. Representative stress-strain curves for the modified DGEBA systems at 15%
mPRS content and the corresponding control systems. ............................................ 274
Figure 7.16. Representative stress-strain curves for the modified TGDDM systems at
15% mPRS content and the corresponding control systems. .................................... 275
Figure 7.17. Simultaneous extent of cure and viscosity vs. reaction time for the TGDDM-
PEA600 system at 80 °C. The dashed line represents the approximate gelation point.
........................................................................................................................................ 282
Figure 7.18. Simultaneous extent of cure and viscosity vs. reaction time for the TGDDM-
PEA1000 system at 120 °C. The dashed line represents the approximate gelation point.
........................................................................................................................................ 283
xix
Figure 7.19. Simultaneous extent of cure and viscosity vs. reaction time for the TGDDM-
PEA2070 system at 120 °C. The dashed line represents the approximate gelation point.
........................................................................................................................................ 284
Figure 7.20. Simultaneous extent of cure and viscosity vs. reaction time for the TGDDM-
PEA2070 system at 160 °C. The dashed line represents the approximate gelation point.
........................................................................................................................................ 285
Figure 7.21. NearIR spectra during the TGDDM-PEA600 reactions at 80 °C. ................... 287
Figure 7.22. NearIR spectra during the TGDDM-PEA1000 reactions at 120 °C. ................ 288
Figure 7.23. NearIR spectra during the TGDDM-PEA2070 reactions at 120 °C. ................ 289
Figure 7.24. NearIR spectra during the TGDDM-PEA2070 reactions at 160 °C. ................ 290
Figure 7.25. Probable reaction pathway for the TGDDM-PEA2070. ................................... 293
Figure B.1. DSC first heating scans on the super-critically dried gels (aerogels) for 0, 0.5,
1, 3 TEA specimens (Epon828-PACM). ....................................................................... 308
Figure B.2. DSC third heating scans on the super-critically dried gels (aerogels) for 0, 0.5,
1, 3 TEA samples (Epon828-PACM). The temperature at which inflection point is
occurring is where the Tg is reported. ......................................................................... 309
Figure E.1. Values of strain energy release rate at higher loading of dPRS (30% weight) is
shown. ........................................................................................................................... 317
Figure F.1. DSC thermographs of the stoichiometric blend of TGDDM and PEA1000.
Exothermic peaks are upward. .................................................................................... 318
Figure G.1. Representative stress-strain curves for the control, and mPRS1000-modified
systems at 10% mPRS loading. .................................................................................... 319
Figure G.2. Representative stress-strain curves for the control, and mPRS600-modified
systems at 20% mPRS loading. .................................................................................... 320
Figure G.3. Representative stress-strain curves for the control, and mPRS600-modified
systems at 10% mPRS loading. .................................................................................... 321
Figure H.1. Viscosity measurement of the stoichiometric blends of DGEBA and PPODA
(x= 2.5, 6.1, 33, 68). The testing temperature was at 80 °C. ........................................ 322

xx
Figure H.2. Simultaneous FTIR, Rheology on a stoichiometric mixture of DGEBA-
PPODAx=68 at 80 °C. The experimental gelation point was around 83.5% conversion.
........................................................................................................................................ 323
Figure H.3. Simultaneous FTIR, Rheology on a stoichiometric mixture of DGEBA-
PPODAx=33 at 80 °C. The experimental gelation point was around 65% conversion324
xxi
Abstract Effect of Network Structure/Topology on Mechanical Properties of
Crosslinked Polymers
Majid Sharifi
Giuseppe R. Palmese, Ph.D.
The interest in epoxy thermosetting polymers is widespread (e.g. Boeing 787
Dreamliner, windmill blades, automobiles, coatings, adhesives, etc.), and a demand
still exists for improving toughness of these materials without degrading
advantageous properties such as strength, modulus, and Tg. This study introduces
novel approaches for improving the intrinsic mechanical characteristics of these
polymers.
The designed synthetic techniques focus on developing polymer materials with the
same overall compositions but varying in network topologies, with distinct
topological features in the size range of 5-50 nm, measured by SAXS and SEM.
It was found that without altering chemical structure, the network topology of a
dense thermoset can be engineered such that, under mechanical deformation, nano-
cavities open and dissipate energy before rupturing covalent bonds, producing a
tougher material without sacrificing strength, modulus, and even glass transition
temperature. Modified structures also revealed higher resistance to fracture than
the corresponding control structures. The major fracture mechanism responsible
for the increased energy dissipation was found to be nano-cavitation. SEM images

xxii
from the fracture surfaces showed clear cavities on the modified samples whereas
none were seen on the fracture surface of the control samples.
Overall, it was demonstrated that network topology can be used to tailor thermal
and mechanical properties of thermosetting polymers. The experimental
methodologies in this dissertation can directly and economically be applied to
design polymeric materials with improved properties for desired applications.
Although topology-based toughening was investigated on epoxy-amine polymers,
the concept can be extended to most thermoset chemistries and perhaps to other
brittle network forming materials.

xxiii
1
Chapter 1. Introduction
Thermosetting materials are one important class of polymer materials that have
been widely used for many years. These polymers form crosslinks between
polymer chains during cure. Due to the inherent crosslinked nature of these
polymer materials, they typically show relatively high thermal and mechanical
stability, stiffness and strength compared to thermoplastic polymers. Therefore,
they are better candidates for conditions where durable materials are desired,
particularly at relatively higher temperature demands.
Epoxy resins are one of the most important and widely used thermosets. Epoxy
composites are extensively used as the structural materials in aviation (Boeing 787
Dreamliner), and automobile manufacturing industries because of their high
strength-to-weight ratio, relatively high modulus, and low processing and
maintenance cost.1 In addition, epoxy resins are widely used in coating because
they guarantee excellent adhesion and high chemical resistance. They are also used
in electrical systems and electronics due to their low electrical and heat
conductivity.
Despite their desirable properties, epoxy thermosets are inherently brittle in nature
due to the densely crosslinked network structures that form upon curing. Once
2
cured, they exhibit poor resistance to fracture,2-5 so they generally break before
yielding with relatively low energy absorption before failure.6
Significant effort has been dedicated toward developing methods to toughen epoxy
systems. Toughening of epoxy polymers has been achieved using: micro-sized
liquid rubber,7 thermoplastic particles,8-10 core-shell rubber particles,11, 12
elastomers,13 diblock copolymers,14-16 and interpenetrating networks.17 Although
these techniques achieved success in toughening thermosets, it has been widely
observed that the presence of a soft second phase matter such as rubber particles,
thermoplastic particles, or a low-stiffness interpenetrated network reduces the
modulus, strength and, more importantly, glass transition temperature of the
resulting system.
Recent molecular-simulation work uncovered a significant finding: Using coarse-
grained molecular simulations of highly crosslinked polymer networks, Mukherji
et al.18, 19 observed the opening of many small random voids upon uniaxial tension,
leading to a significantly high energy absorption before break. The void opening
mechanism upon uniaxial tension was not observed for the similar crosslinked
polymer networks in which bonds were constrained such that void openings were
restricted. The representative stress-strain curve of the two systems revealed that
the observed toughening was achieved with no sacrifice in Young’s modulus and
strength.
3
This major finding is the basis of the current dissertation. The principle focuses of
this study are: (1) synthesis of amine-cured epoxy systems with the same overall
composition but varying network topologies (also called “polymer network
isomers”), with controlled topological features in the size range of 5-50 nm; (2)
characterizing the topological variations using the existing nanoscope
instrumentations; (3) material characterization to link polymer network topology
to mechanical properties. The end results promote an understanding of the
fundamental question: To what extent can network topology affect the mechanical
properties of crosslinked polymers? The impact of this work will consist of
developing a new generation of epoxy resins that are resistive to fracture and
failure, and unlike other toughening conventions, will preserve the essential
properties such as mechanical strength and stiffness and glass transition
temperature.
In this study, there are three suggested approaches of synthesis through which
polymer networks with the same overall compositions but vary in network
topology are synthesized. Figure 1.1 schematically demonstrates the approaches
that are considered in this study.
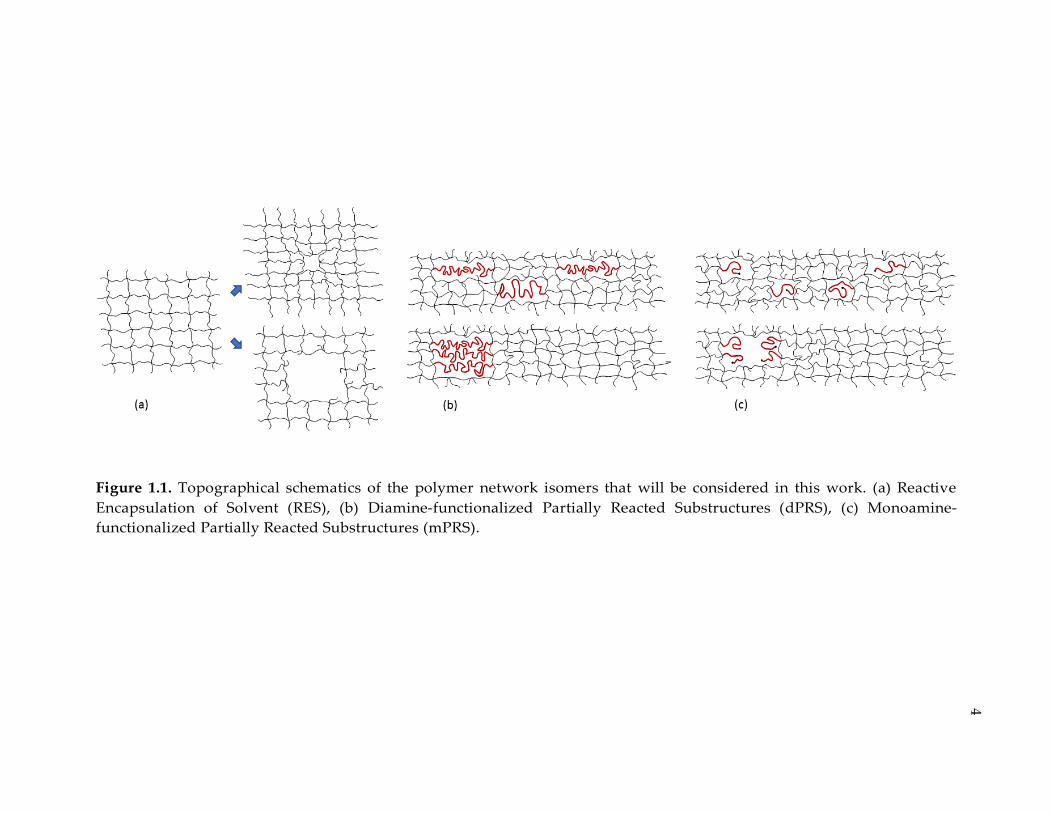
Figure 1.1. Topographical schematics of the polymer network isomers that will be considered in this work. (a) Reactive
Encapsulation of Solvent (RES), (b) Diamine-functionalized Partially Reacted Substructures (dPRS), (c) Monoamine-
functionalized Partially Reacted Substructures (mPRS).
4
5
Accordingly, Chapter 3 introduces a new strategy of developing epoxy-amine
thermosetting polymers with altered topology using a non-reactive solvent during
cure. The synthesis methodology used in this Chapter is termed “Reactive
Encapsulation of Solvent (RES)”. This Chapter describes how the manipulation of
network topology could induce remarkable plastic behavior to glassy networks
subjected to high load environments. It was found that without altering chemical
structure, the network topology of a dense thermoset can be engineered such that,
under deformation, nanometer-sized cavities open and dissipate energy before
rupturing covalent bonds, producing a tougher material without sacrificing tensile
strength, modulus, density, or glass transition temperature.
Chapter 4 gives an overview of employing equilibrium swelling to investigate and
characterize the network structure of crosslinked polymers that are formed/cured
in dilute environments, i.e. in presence of excess inert solvent during cure. The
findings of this study suggest that the traditional models don’t accurately represent
swelling behavior of epoxy-amine gels prepared in highly dilute environments as
they over-predict the molecular weight between crosslinks. A strait forward
modification to existing models was adopted to correct for this, and additional
insight was gained in understanding the changes in network topology that occur
when inert solvents are used for the synthesis of epoxy-amine networks. Some of
6
the results presented in this Chapter are reproduced with permission from the
works of Ghorpade20 and Raman.21
Chapter 6 explains the effect of materials’ Tg on behavioral characteristics.
Accordingly, three different epoxy-amine thermosetting systems with Tg’s ranging
from 60 °C – 180 °C were investigated. The findings in this Chapter provide
additional insight in understanding the flexibility of the crosslinkers on the
mechanical behavior of thermosets when network topology is altered.
Chapters 5 and 7 introduce a novel technique in developing the polymer network
isomers using a solvent-free protocol. These Chapters reveal that the synthesis of
epoxy-amine networks that have the same overall composition but vary in network
topology, result in some of the network isomers having unprecedented
concomitant gains in fracture toughness and Tg, without degrading strength and
modulus. The presented molecular simulations results are reproduced with
permission from the works of Jang and Abrams.22
The end results demonstrated that network topology can be used to tailor the
behavior of thermosetting materials without the incorporation of toughening
agents that often reduce processing ease and are costly. The resins developed based
on the addressed protocols can be used directly to formulate new epoxy-amine
systems for coating, adhesive and composite applications. The concepts can also
7
be extended to most thermoset chemistries and perhaps also to other brittle
network forming materials.
1.1. List of References
1. Askeland, D. R.; Editor, The Science and Engineering of Materials, Third Edition.
Chapman & Hall: 1996; p 256 pp.
2. Bagheri, R.; Marouf, B. T.; Pearson, R. A. Polym. Rev. (Philadelphia, PA, U. S.)
2009, 49, 201-225.
3. LeMay, J. D.; Kelley, F. N. Adv. Polym. Sci. 1986, 78, 115-48.
4. Pearson, R. A.; Yee, A. F. Journal of Materials Science 1991, 26, (14), 3828-3844.
5. Petrie, E. M., Epoxy Adhesive Formulations. McGraw-Hill: 2006; p 535.
6. Kinloch, A., Mechanics and mechanisms of fracture of thermosetting epoxy
polymers; Epoxy Resins and Composites I. In Epoxy Resins and Composites I, Springer
Berlin / Heidelberg: 1985; Vol. 72, pp 45-67.
7. Rowe, E. H.; Siebert, A. R.; Drake, R. S. Mod. Plast. 1970, 47, 110-12, 14, 116-17.
8. Brooker, R. D.; Kinloch, A. J.; Taylor, A. C. The Journal of Adhesion 2010, 86, (7),
726-741.
9. Dusek, K.; Lednicky, F.; Lunak, S.; Mach, M.; Duskova, D. Adv. Chem. Ser. 1984,
208, 27-35.
10. Kinloch, A. J.; Yuen, M. L.; Jenkins, S. D. J. Mater. Sci. 1994, 29, 3781-90.
11. Bagheri, R.; Pearson, R. A. J. Mater. Sci. 1996, 31, (15), 3945-3954.
8
12. Choi, J.; Yee, A. F.; Laine, R. M. Macromolecules 2004, 37, (9), 3267-3276.
13. Yee, A. F.; Pearson, R. A. Journal of Materials Science 1986, 21, (7), 2462-2474.
14. Dean, J. M.; Verghese, N. E.; Pham, H. Q.; Bates, F. S. Macromolecules 2003, 36,
(25), 9267-9270.
15. Thio, Y. S.; Wu, J.; Bates, F. S. Macromolecules 2006, 39, (21), 7187-7189.
16. Thompson, Z. J.; Hillmyer, M. A.; Liu, J.; Sue, H.-J.; Dettloff, M.; Bates, F. S.
Macromolecules 2009, 42, (7), 2333-2335.
17. Harani, H.; Fellahi, S.; Bakar, M. Journal of applied polymer science 1999, 71, (1),
29-38.
18. Mukherji, D.; Abrams, C. F. Physical Review E 2008, 78, (5), 050801.
19. Mukherji, D.; Abrams, C. F. Physical Review E 2009, 79, (6), 061802.
20. Ghorpade, K. A. Swelling Behavior of Nanoporous Epoxy-Amine Gels. Drexel
University, Philadelphia, PA, 2006.
21. Raman, V. I.; Palmese, G. R. Design of nanoporous polymer networks using a
reactive encapsulation of solvent (RES) technique. Ph.D., Drexel University, Philadelphia,
PA, 2005.
22. Jang, C.; Sharifi, M.; Abrams, C. F.; Palmese, G. R. Polymer 2014, 55, (16), 3859-
3868.
9
Chapter 2. Background
2.1. Introduction
Thermosetting polymers are a type of polymeric materials that irreversibly cure.
Cure can be carried out through heating, radiation, or chemical reactions. The
cured polymers form a network structure, because of the presence of crosslinking
between polymer chains.1 Because of the inherent crosslinked structures, they are
strong and thus used in broad range of applications. Amine-cured epoxy systems
which will be discussed in-depth in this dissertation, generally form via a series of
chemical reactions between epoxide and amine groups as represented in Figure 2.1.
The reason for choosing amine-cured epoxy thermosets for this study was due to
the formation of the relatively homogenous polymer networks after cure, because
the polymerization is known to be via “step-growth polymerization” for this
polymers.
10
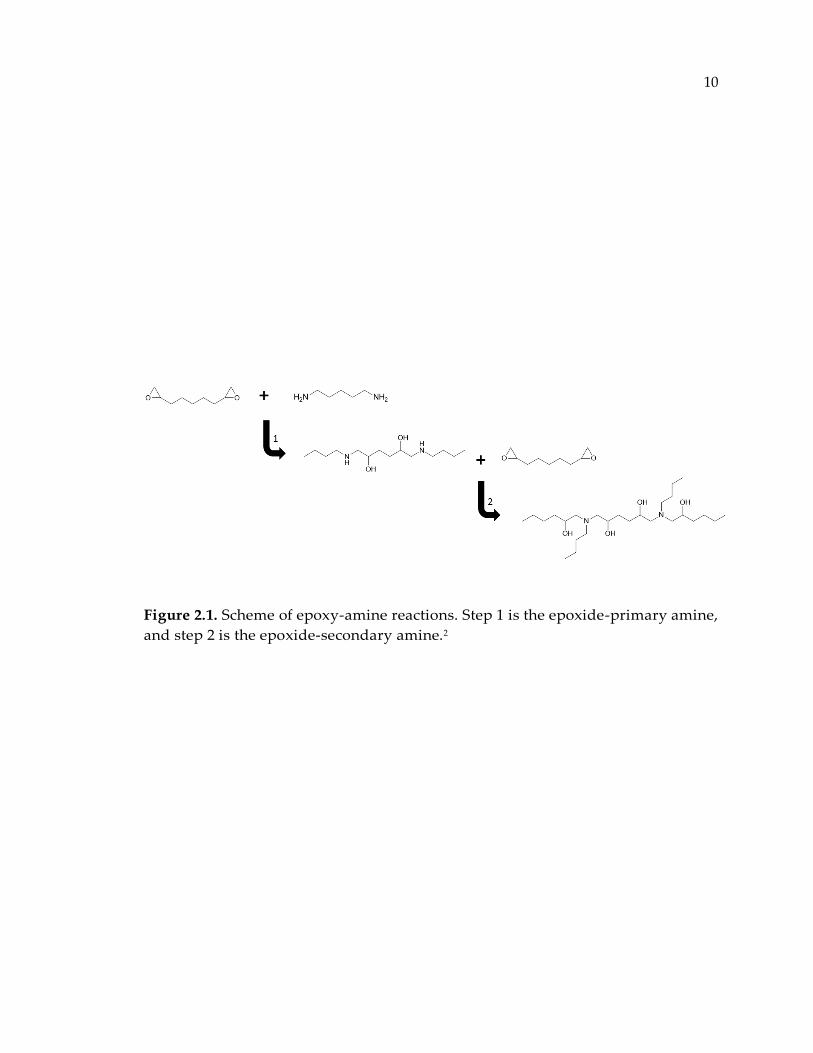
Figure 2.1. Scheme of epoxy-amine reactions. Step 1 is the epoxide-primary amine,
and step 2 is the epoxide-secondary amine.2
11
2.2. Step-Growth Polymerization
Step-growth polymerization refer to a type of reaction mechanism that monomers
react to form dimers, trimers, then longer oligomers and eventually long chain
polymers. If the functionality of the monomers are more than two, then
crosslinking appear during the reactions. As polymerization proceeds, the polymer
cluster grow until a percolation path is formed. This stage of polymerization is
known as the gel point, where the steady shear viscosity suddenly jumps.3 After
gelation, the reaction kinetics is diffusion controlled. Polymerization continues
while crosslinking density increases. This step is known as vitrification. Glass
transition temperature goes up until full conversion achieved. Figure 2.2
demonstrates a schematic representation at each stage of polymerization.
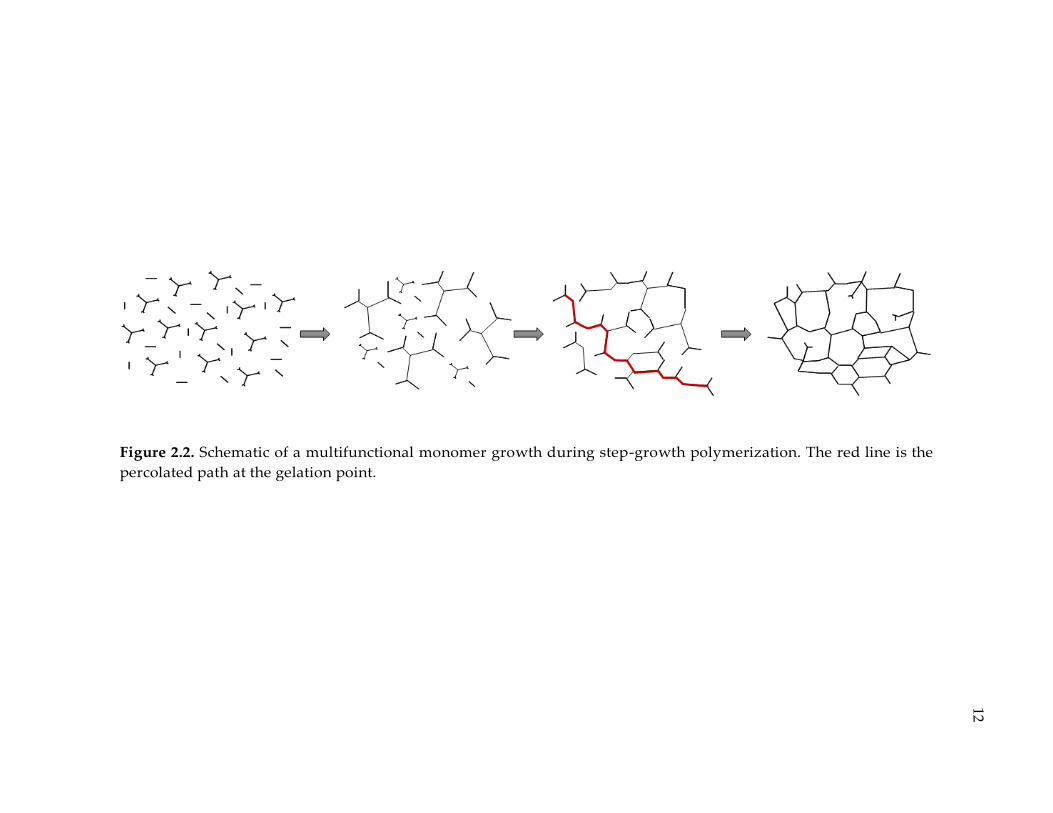
Figure 2.2. Schematic of a multifunctional monomer growth during step-growth polymerization. The red line is the
percolated path at the gelation point.
12
13
2.3. Epoxy-Amine Reactions
The addition reaction of epoxide and amine is known to occur stepwise as shown
in Figure 2.1.4 Step 1 represents an addition reaction between primary amines and
epoxide functional groups, and step 2 indicates the addition reaction between
secondary amines and epoxide groups. In some literatures, the reaction rate
constant for both reactions assumed to be equal,5 however, in some others it is
shown that they are not equal and their rate constant ratio k2/k1, also known as
substitution factor, is a determining factor of the final network topology.6, 7
Hydroxyl groups are also generated in step 1 and 2. They act as catalyst for the
epoxy-amine reactions and affect the reaction rate constants, substitution factor,
and consequently topological structure of the matrix. Homopolymerization
reactions of epoxides are excluded since they are reported to occur only in the
presence of the Lewis acid type catalysts.8, 9 Etherification reactions are known to
happen, however, experimental results show that this type of reactions is very
improbable to occur or the amount of products are negligible compare to the
amount produced in step 1 and 2 at stoichiometric mixtures of diepoxide and
aliphatic diamines.4, 10, 11 Ochi et al.12, 13 reported that less than 20% of epoxide
groups consume in etherification reactions for a mixture of stoichiometric DGEBA-
aliphatic diamines without the presence of an accelerator such as salicylic acid.
Although, influence of etherification is reported to be larger when aromatic
14
diamines used as the curing agent. In this case, etherification reactions becomes
more significant on account of low reactivity of secondary amine with respect to
primary amine.14, 15 After full conversion, a highly crosslinked structure obtained.
Figure 2.3 is showing a crosslinked network structure for a stoichiometric blend of
a typical epoxy (DGEBA) and a cycloaliphatic amine (PACM).
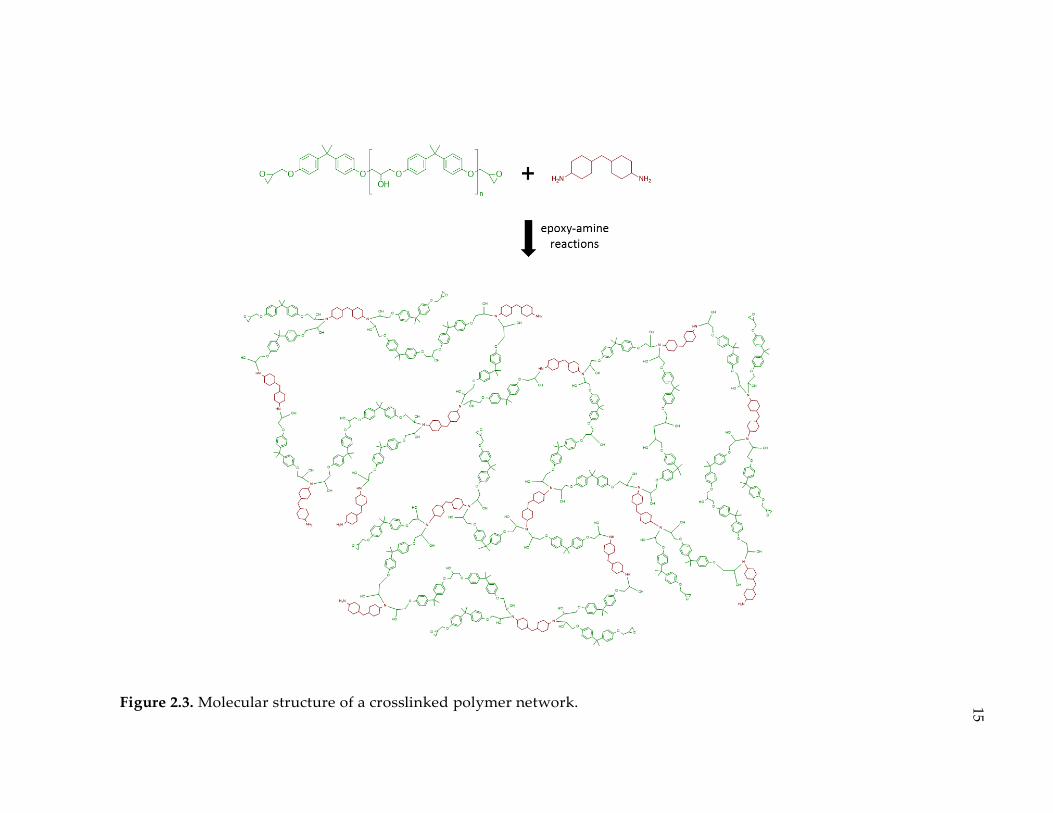
Figure 2.3. Molecular structure of a crosslinked polymer network.
15
16
2.4. Cure Kinetics and Network Structure
The physical properties and behavioral of epoxy-amine polymer networks during
cure have been elucidated over the last two decades. Gillham et al.5, 16 showed that
curing reaction of epoxy-amine mixtures, e.g. Epon-828/PACM-20, is always
accompanying with an initial devitrification, a vitrification, and a final
devitrification point if epoxy/amine batch put under continuous heating at a
constant rate. In their study, glass transition temperature has been determined at
different stages of cure. They also showed that Tg goes up as the curing reactions
proceed. This increasing trend of glass transition temperature during cure is an
indication of the formation of crosslinks for multifunctional monomers. As the
degree of crosslinking increases, viscosity, the degree of rotational restrictions and
the free volume fraction of the network are affected.17-19 According to Sanford and
McCullough,17 glass transition temperature is a critical structural parameter that
can reflect a measure of free volume available and the degree of rotational
restrictions for polymer chain mobility.
Bueche et al.20 modeled the free volume fraction as a linear function of the difference
of temperature from Tg. This relation is shown in the following equation.
17
𝑓 = 𝑓𝑔 + 𝛼𝑓(𝑇 − 𝑇𝑔) (2.1)
In that, 𝑓𝑔 is the fractional free volume at T = Tg and 𝛼𝑓 is the thermal expansion
coefficient. Cohen and Turnbull21 reported the values of 𝑓𝑔 and 𝛼𝑓 for an
epoxy/amine system. In their works, 𝑓𝑔 and 𝛼𝑓 determined to be 0.025 and 4.8 ×
10−4 ˚C-1 respectively.21-23 Glass transition temperature at certain stages of cure can
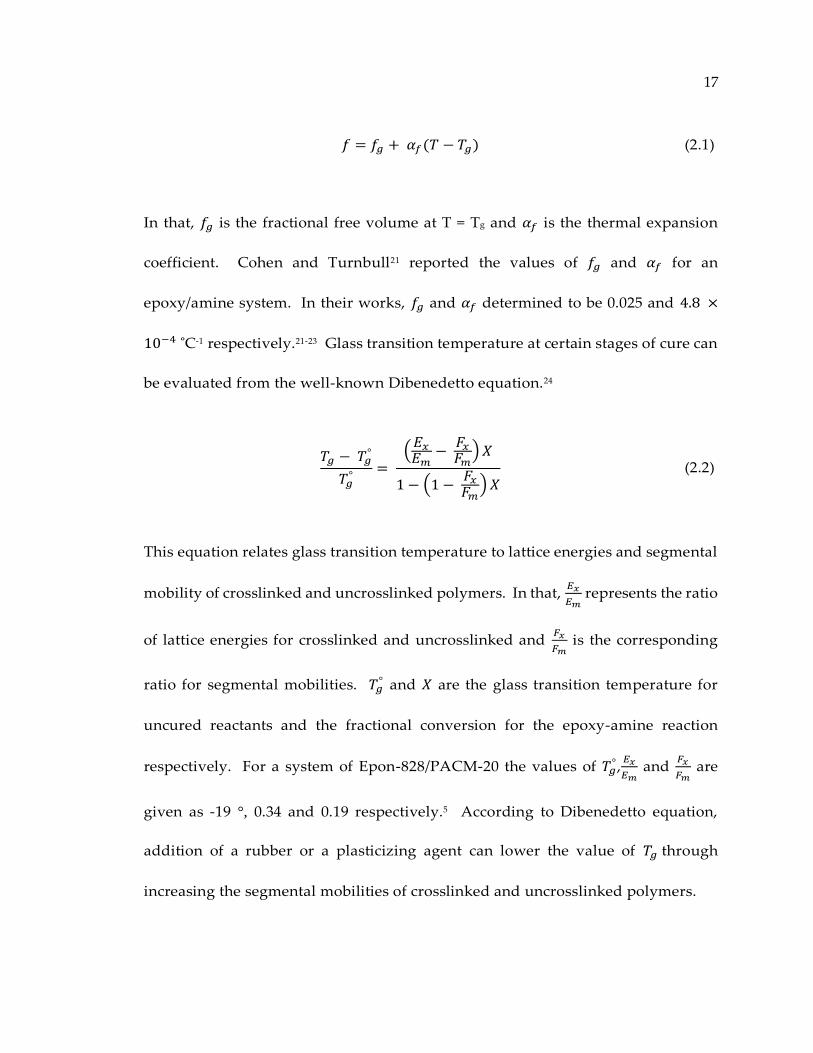
be evaluated from the well-known Dibenedetto equation.24
𝑇𝑔 − 𝑇𝑔°
𝑇𝑔°
= (
𝐸𝑥𝐸𝑚
− 𝐹𝑥𝐹𝑚
) 𝑋
1 − (1 − 𝐹𝑥
𝐹𝑚) 𝑋
(2.2)
This equation relates glass transition temperature to lattice energies and segmental
mobility of crosslinked and uncrosslinked polymers. In that, 𝐸𝑥
𝐸𝑚 represents the ratio
of lattice energies for crosslinked and uncrosslinked and 𝐹𝑥
𝐹𝑚 is the corresponding
ratio for segmental mobilities. 𝑇𝑔° and 𝑋 are the glass transition temperature for
uncured reactants and the fractional conversion for the epoxy-amine reaction
respectively. For a system of Epon-828/PACM-20 the values of 𝑇𝑔°,
𝐸𝑥
𝐸𝑚 and
𝐹𝑥
𝐹𝑚 are
given as -19 °, 0.34 and 0.19 respectively.5 According to Dibenedetto equation,
addition of a rubber or a plasticizing agent can lower the value of 𝑇𝑔 through
increasing the segmental mobilities of crosslinked and uncrosslinked polymers.
18
2.5. Time-Temperature Superposition (TTS)
The time-temperature superposition principle states that for a viscoelastic material
that has molecular structure, time is equivalent to temperature, or temperature is a
measure of molecular motion. In other words, at elevated temperatures times move
faster for the molecules. According to the TTS principle, time and temperature are
identical to the extent that data at one temperature can be superimposed on data at
another temperature by shifting the curves along the log (time) axis.25 The
activation energy required for a system to pass a transition state can be measured
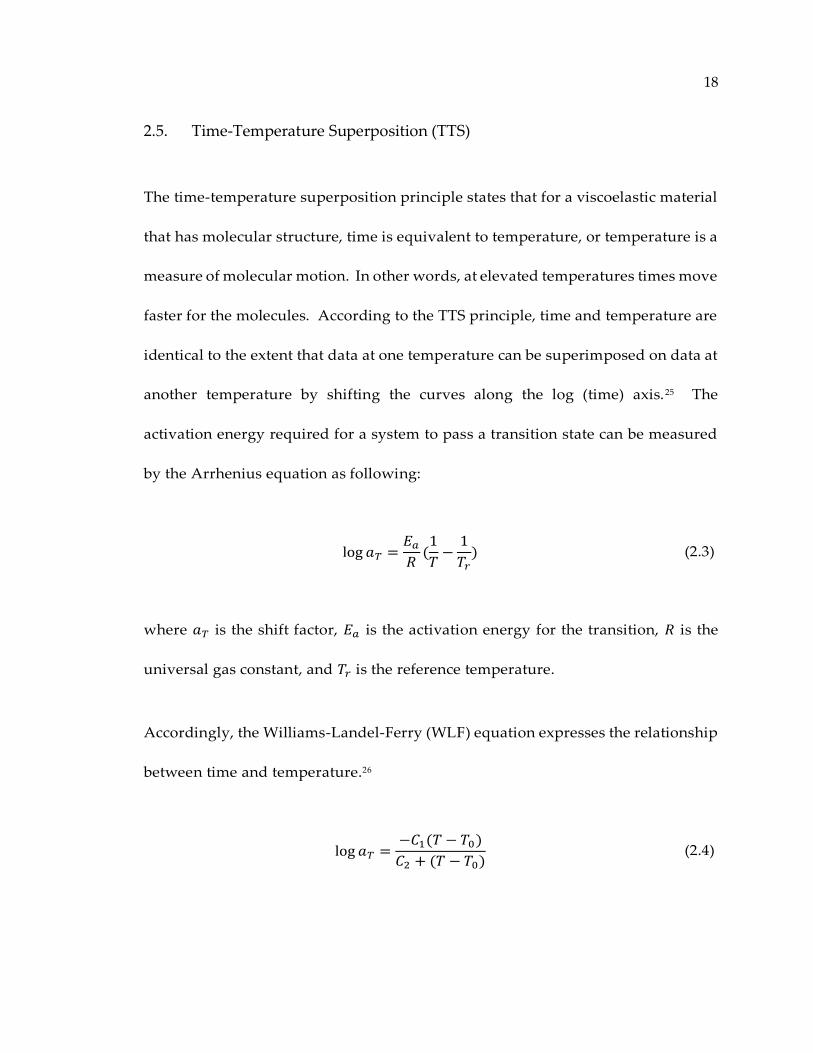
by the Arrhenius equation as following:
log 𝑎𝑇 =𝐸𝑎
𝑅(1
𝑇−
1
𝑇𝑟) (2.3)
where 𝑎𝑇 is the shift factor, 𝐸𝑎 is the activation energy for the transition, 𝑅 is the
universal gas constant, and 𝑇𝑟 is the reference temperature.
Accordingly, the Williams-Landel-Ferry (WLF) equation expresses the relationship
between time and temperature.26
log 𝑎𝑇 =−𝐶1(𝑇 − 𝑇0)
𝐶2 + (𝑇 − 𝑇0) (2.4)
19
Where 𝐶1 and 𝐶2 are the WLF constants, 𝑇0 is the reference temperature and for
most polymers Tg is taken as the reference temperature and 𝑎𝑇 is the shift factor.
2.6. Modification to Polymer Network Structure
In fact, the brittleness of epoxy networks is primarily due to the degree of
crosslinking density.27 Significant amount of works dedicated to modify the
network structure of epoxy systems. In early studies, introducing a secondary
phase component, mainly a plasticizer to a network,28-31 was proposed as an
effective way to improve long strain properties such as toughness. However,
resultant toughened networks always had lower Tg and modulus.
Bennet and Ferris28 improved the toughness for a system of epoxy/amine through
incorporation of reactive amine-terminated oligomers. They showed that when the
amine-terminated oligomers are applied at a sufficient level to form a material
consisting of a lightly crosslinked thermoplastic continuous within epoxy/amine
phase, the fracture energy increases accompanying with almost zero or slight
increase in modulus. Moreover, the effect of linear chain fraction on mechanical
properties of highly crosslinked polymer networks has been shown through the use
of molecular dynamic simulation.32 In that work, within increasing the linear chain
20
fraction of oligomers, the ductility (strain-to-failure) decreases until a threshold
value beyond which the ductility increases with increasing of linear chain fraction
of oligomers.
More recently, investigations are primarily focused on addition of nanoparticles to
obtain a toughened epoxy.33-40 Although diluents usually degrade Tg and modulus,
application of nanoparticles could result in getting a toughened network with
minimal impact on glass transition temperature and modulus. In a separate study,
Pearson et al.30 showed that toughening mechanisms are particle-dependent. In
fact, relatively large particles observe to provide a modest increase in fracture
toughness; however, small particles provide a remarkably large increase in
toughness through cavitation-induced shear bonding mechanism.30, 31
Raman in a separate work suggested a way through which one can modify and
change a thermosetting network molecular architecture and subsequently
manipulate mechanical and transport properties of the resultant matrix.6, 7 It is
proposed that epoxy addition to a primary amine could affect the reactivity of the
secondary amine and might change the basicity of amino group. It is hypothesized
that it can affect the network topology and structural properties thereafter. The
parameter, k2/k1, is a key parameter for predicting the structure of the resulting
network, which itself can be influenced by reaction rate parameters such as cure
21
temperature. Evidences show that a diffusion limitation always affects the final
stages of cure. Sourour and Kamal41 and Wisanrakkit and Gillham5 showed that an
intrinsic third-order autocatalytic reaction can best model the cure of epoxy-amine
polymerization. However, the model is incapable of predicting the reaction once
the reaction extents to certain degrees of polymerization. Some literatures show
that the reaction cannot assume to be kinetically controlled once it reaches to the
extents corresponding to vitrification points.5, 22, 23, 42, 43 In other words, as the
reaction proceeds to the point where the fractional conversion represents the point
of vitrification, the network no longer stays in its rubbery phase and it suddenly
jumps to glassy state region in Time-Temperature-Transformation, TTT diagram.5,
16 In the glassy state, the reactants must diffuse through the network so that they
collide and make the reaction to occur. Therefore at relatively high conversion, we
should expect a deviation from the third-order autocatalytic intrinsic model.
Experimental results demonstrated this deviation.5, 22, 23 Klein et al.42, 43 used
Rabinowitch equation44 as a relation for global reaction rate constant of epoxy-
amine polymerization in terms of diffusive and chemical parameters. They related
diffusivity of amine reagents within epoxy to the number-averaged molecular
weight of the network, Mn. And from Marten and Hamielec equation,45 they
obtained a global rate constant as a function of number-averaged molecular weight
through which they could predict the kinetics of the cure reaction at almost every
stages of polymerization. The diffusion limitations discussed so far could
22
potentially influence the topological structure of the final network by decreasing
the reaction rate, limiting the conversion and disrupting the network connectivity.6,
7
2.7. Structure-Related Properties
The correlations for physical and mechanical properties of epoxy/amine thermosets
have been widely investigated. The structural variation for correlation studies
mostly introduced through stoichiometry, cure cycle, reaction conversion and pre-
polymer with different molecular weights. Polymer networks mostly characterized
by measuring crosslinking density, average molecular weight between crosslinks,
free volume fraction, specific volume or bulk density as a measure of molecular
packing, and glass transition temperature.46 Density and molecular packing, or free
volume fraction, can be considered as the main factors which can affect small-strain
properties such as room temperature modulus and yield strength. Several studies
investigated the influence of cure temperature,47-50 and reactant composition,51, 52 on
glassy modulus. They showed that modulus decreases with increasing cure
temperature. Similarly, yield strength in glassy state is primarily depending on
free volume and hence it decreases as a result of free volume increase.50, 53, 54 On the
other hand, tensile strength and failure strain as the large-strain properties usually
23
exhibits a complex dependence on structural properties. In relating tensile strength
to crosslink density varied by changing the ratio of hardener to resins, researchers
found either a growth,55 or degradation,52 in strength level. In contrast, some others
reported no significant interdependence.56 Similar inconsistency has found for
failure strain when people tried to elucidate the effect of stoichiometry.51, 52, 56, 57 The
reason might be owing to the fact that changing crosslinking density through
varying stoichiometry could also change the network topology, and thus varying
the stoichiometric ratio of resin to hardener is not an effective way to characterize
network structure attributed solely to crosslinking density or free volume fraction.
2.8. List of References
1. Pascault, J.P.; Sautereau, H.; Verdu, J.; Williams, R. J. J.; Editors, Thermosetting
Polymers. Marcel Dekker, Inc.: 2002; p 496 pp.
2. Riccardi, C. C.; Williams, R. J. J. Journal of Applied Polymer Science 1986, 32, (2),
3445-3456.
3. Shen, M. Macromolecules 1969, 2, (4), 358-364.
4. Shechter, L.; Wynstra, J.; Kurkjy, R. P. J. Ind. Eng. Chem. (Washington, D. C.) 1956,
48, 94-7.
5. Wisanrakkit, G.; Gillham, J. K. Journal of Applied Polymer Science 1990, 41, (11-
12), 2885-2929.
24
6. Raman, V. I.; Palmese, G. R. Design of nanoporous polymer networks using a
reactive encapsulation of solvent (RES) technique. Ph.D., Drexel University, Philadelphia,
PA, 2005.
7. Raman, V. I.; Palmese, G. R. Macromolecules 2005, 38, (16), 6923-6930.
8. Potter, W. G., Epoxide Resins. Butterworth: 1970; p 248 pp.
9. May, C. A.; Editor, ASC Symposium Series, Vol. 227: American Chemical Society:
1983; p 325 pp.
10. Lunak, S.; Dusek, K. J. Polym. Sci., Polym. Symp. 1975, 53, 45-55.
11. Riccardi, C. C.; Adabbo, H. E.; Williams, R. J. J. J. Appl. Polym. Sci. 1984, 29, 2481-
92.
12. Ochi, M.; Iesako, H.; Shimbo, M. Polymer 1985, 26, 457-61.
13. Ochi, M.; Okazaki, M.; Shimbo, M. J. Polym. Sci., Polym. Phys. Ed. 1982, 20, 689-
99.
14. Dusek, K.; Lednicky, F.; Lunak, S.; Mach, M.; Duskova, D. Adv. Chem. Ser. 1984,
208, 27-35.
15. Horie, K.; Hiura, H.; Sawada, M.; Mita, I.; Kambe, H. J. Polym. Sci., Part A-1:
Polym. Chem. 1970, 8, 1357-72.
16. Enns, J. B.; Gillham, J. K. Journal of Applied Polymer Science 1983, 28, (8), 2567-
2591.
17. Sanford, W. M.; McCullough, R. L. J. Polym. Sci., Part B: Polym. Phys. 1990, 28,
973-1000.
18. Shibayama, K.; Suzuki, Y. J. Polym. Sci., Part A: Gen. Pap. 1965, 3, 2637-51.
19. Tajima, Y. A.; Crozier, D. Polym. Eng. Sci. 1983, 23, 186-90.
20. Bueche, F., Physical Properties of Polymers. Interscience Pubs.: 1962; p 345 pp.
25
21. Turnbull, D.; Cohen, M. H. J. Chem. Phys. 1961, 34, 120-5.
22. Rohr, D. F., Jr. Modeling reaction and diffusion in epoxy-amine polymerization
kinetics. 1988.
23. Rohr, D. F.; Klein, M. T. Ind. Eng. Chem. Res. 1988, 27, 1361-6.
24. Nielsen, L. E. J. Macromol. Sci., Rev. Macromol. Chem. 1969, 3, 69-103.
25. Sperling, L. H., Introduction to physical polymer science. John Wiley & Sons: 2005.
26. Williams, M. L.; Landel, R. F.; Ferry, J. D. Journal of the American Chemical society
1955, 77, (14), 3701-3707.
27. Min, B. G.; Stachurski, Z. H.; Hodgkin, J. H.; Heath, G. R. Polymer 1993, 34, 3620-
9.
28. Bennett, G. S.; Farris, R. J.; Thompson, S. A. Polymer 1991, 32, (9), 1633-1641.
29. Levita, G.; De Petris, S.; Marchetti, A.; Lazzeri, A. Journal of Materials Science 1991,
26, (9), 2348-2352.
30. Pearson, R. A.; Yee, A. F. Journal of Materials Science 1991, 26, (14), 3828-3844.
31. Yee, A. F.; Pearson, R. A. Journal of Materials Science 1986, 21, (7), 2462-2474.
32. Mukherji, D.; Abrams, C. F. Phys. Chem. Chem. Phys. 2009, 11, (12), 2113-2115.
33. Dean, J. M.; Verghese, N. E.; Pham, H. Q.; Bates, F. S. Macromolecules 2003, 36,
(25), 9267-9270.
34. Gojny, F. H.; Wichmann, M. H. G.; Köpke, U.; Fiedler, B.; Schulte, K. Composites
Science and Technology 2004, 64, (15), 2363-2371.
35. Guild, F. J.; Taylor, A. C.; Kinloch, A. J. Proc. Annu. Meet. Adhes. Soc. 2009, 32nd,
24-26.
26
36. Hsieh, T. H.; Kinloch, A. J.; Masania, K.; Taylor, A. C.; Sprenger, S. Polymer 2010,
51, 6284-6294.
37. Hsieh, T. H.; Kinloch, A. J.; Taylor, A. C.; Kinloch, I. A. J. Mater. Sci., No pp. yet
given.
38. Kinloch, A. J.; Johnsen, B. B.; Mohammed, R. D.; Taylor, A. C.; Sprenger, S. Proc.
Annu. Meet. Adhes. Soc. 2007, 30th, 340-342.
39. Mohammed, R. D.; Johnsen, B. B.; Kinloch, A. J.; Taylor, A. C.; Sprenger, S. In
Toughening mechanisms of nanoparticle-modified epoxy polymers, 2008; CRC Press:
2008; pp 798-801.
40. Wang, X.; Guild, F. J.; Kinloch, A. J.; Taylor, A. C.; Hadavinia, H. Proc. Annu. Meet.
Adhes. Soc. 2005, 28th, 300-302.
41. Sourour, S.; Kamal, M. R. Thermochimica Acta 1976, 14, (1-2), 41-59.
42. Huguenin, F. G. A. E.; Klein, M. T. Ind. Eng. Chem. Prod. Res. Dev. 1985, 24, 166-
71.
43. Rohr, D. F.; Klein, M. T. Ind. Eng. Chem. Res. 1990, 29, 1210-18.
44. Rabinowitch, E. Trans. Faraday Soc. 1937, 33, 1225-33.
45. Marten, F. L.; Hamielec, A. E. ACS Symp. Ser. 1979, 104, 43-90.
46. Sohn, D. W. Network structure and mechanical properties of amine cured epoxy.
1993.
47. Aronhime, M. T.; Peng, X.; Gillham, J. K.; Small, R. D. J. Appl. Polym. Sci. 1986, 32,
3589-626.
48. Fisch, W.; Hofmann, W.; Schmid, R. J. Appl. Polym. Sci. 1969, 13, 295-308.
49. Pang, K. P.; Gillham, J. K. J. Appl. Polym. Sci. 1989, 37, 1969-91.
50. Yamini, S.; Young, R. J. J. Mater. Sci. 1980, 15, 1814-22.
27
51. Gupta, V. B.; Drzal, L. T.; Lee, C. Y. C.; Rich, M. J. Polym. Eng. Sci. 1985, 25, 812-
23.
52. Kim, S. L.; Skibo, M. D.; Manson, J. A.; Hertzberg, R. W.; Janiszewski, J. Polym.
Eng. Sci. 1978, 18, 1093-100.
53. Morgan, R. J. Adv. Polym. Sci. 1985, 72, 1-43.
54. Morgan, R. J.; O'Neal, J. Polym. Eng. Sci. 1978, 18, 1081-6.
55. Mostovoy, S.; Ripling, E. J. J. Appl. Polym. Sci. 1966, 10, 1351-71.
56. Bell, J. P. J. Appl. Polym. Sci. 1970, 14, 1901-6.
57. Morgan, R. J.; Kong, F. M.; Walkup, C. M. Polymer 1984, 25, 375-86
28
Chapter 3. Epoxy Thermosets with Altered Network Topology via Reactive
Encapsulation of Solvent; Synthesis and Characterization
3.1. Introduction
As discussed, epoxy materials are extensively used because they typically
guarantee excellent adhesion, high chemical and heat resistance, good-to-excellent
mechanical properties,1 and relatively good electrical insulating properties. Many
attempts have been made to improve their resistance to abrasion when used as
coating materials.2 Structural epoxy-based composite materials are becoming
prominent in a vast number of applications where a material with relatively high
strength, high modulus and light-weight is needed. It is well known that epoxy
thermosets are brittle due to their highly crosslinked networks, and exhibit poor
resistance to fracture.3-6 These polymer materials generally break before yielding
without plastic deformation with relatively poor energy absorption before failure.7
Conventional toughening methods, for example, micro-sized liquid rubber,8, 9
thermoplastic particles,10-13 core-shell rubber particles,14-15 elastomers,16 diblock
copolymers,17-19 and interpenetrating networks20 were successful at toughening
thermosets, however, it is widely observed that the presence of a soft second phase
29
matter such as rubber particles, thermoplastic particles, or a low-stiffness
interpenetrated network reduces the modulus, strength and, more importantly,
glass transition temperature of the resulting system. Developing methods to
toughen epoxies without sacrificing these advantageous properties remains
paramount.
Recent molecular-simulation work points to a possible solution: Using coarse-
grained molecular simulations of highly crosslinked polymer networks, Mukherji
et al.8, 9 observed the opening of many small random voids upon uniaxial tension,
leading to a clear strain-hardening regime. These voids were not present in the
unstressed samples but were encoded by the non-uniform directionality of the
crosslink bonds, and these authors further showed that by tetrahedrally
distributing crosslinks emanating from each particle, these voids could be
suppressed, generating samples of the same density and ultimate strength as the
more random samples. This work suggests that altering the network connectivity
of a crosslinked polymer without changing the crosslink density offers a route to
increasing toughness without sacrificing strength.
Previous experimental work in our group offers a possible route toward realizing
this suggestion. Raman et al.21, 22 proposed a method through which a polymer
network could be tailored via a miscible and chemically inert solvent present

30
during cure. The technique was termed Reactive Encapsulation of Solvent (RES).
This method involves the synthesis an epoxy thermoset in presence of an inert
solvent without microphase separation. It was shown that when the step-growth
polymerization reactions take place in presence of an inert solvent that is miscible
with the monomers and resulting polymer, the polymer network encapsulates the
solvent species without covalent bonds being formed in the regions where inert
solvent species are present. Consequently, a nanoporous polymer network is
obtained upon solvent removal using supercritical extraction and drying.21, 22 If, as
is done in this work, solvent removal is conducted simply by heating the
organogels following network formation, the pores collapse leading to samples
with the same density as non-RES-modified epoxies. This method of network
synthesis is termed as Reactive Encapsulation of Solvent-Drying (RESD) approach.
The purpose of this article is to demonstrate how RESD can indeed generate
toughened epoxy materials without sacrificing density, strength, or glass-transition
temperature, for a particular epoxy/crosslinker/solvent system. All-atom
molecular dynamics simulations of the same systems further illustrate that RESD
yields inter-crosslink contour-length distributions shifted to higher values,
indicating that indeed network topology is predictably influenced by RESD.
31
3.2. Experimental
3.2.1. Materials
The materials used in this study are shown in Figure 3.1. The difunctional epoxy
resin used is Diglycidel Ether of Bisphenol-A (DGEBA), EPON 828 with n=0.13,
(Miller-Stephensen Chemical Co.). The curing agent is an aliphatic tetrafunctional
diamine, polyetheramine (Jeffamine D-400) with an averaged molecular weight of
about 430 g/mol (Huntsman). Dichloromethane (DCM) (Sigma-Aldrich) was used
as the inert solvent for the RESD technique.
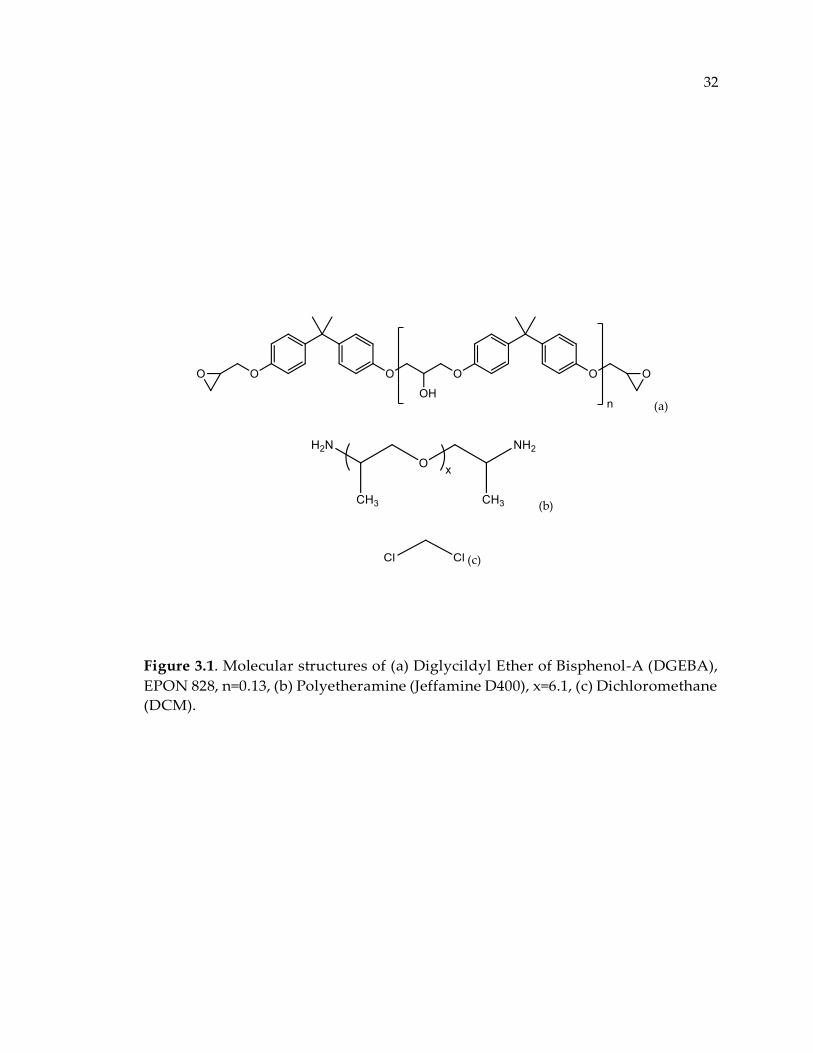
32
(a)
(b)
(c)
Figure 3.1. Molecular structures of (a) Diglycildyl Ether of Bisphenol-A (DGEBA),
EPON 828, n=0.13, (b) Polyetheramine (Jeffamine D400), x=6.1, (c) Dichloromethane
(DCM).
33
3.2.2. Solvent Selection
According to Raman et al.22, the solvent used in RES has to be miscible in DGEBA
and Jeffamine D400 for the entire polymerization. It also must not phase separate
before or during cure. Additionally, it is essential that the solvent species remain
inert during polymerization reactions and not react with any of the reactive
moieties at the curing temperature. The solvent molecules should also have a low
boiling point and optimal favorable interactions with polymer chains so that they
can be easily removed after polymerization but are soluble in the polymer. It is also
preferred that the solvent has a low vapor pressure to minimize solvent loss during
polymerization reactions at elevated temperatures. Taking into account all the
above, DCM was selected as the solvent. Fourier Transform Infrared Spectroscopy
in near infrared region revealed the inertness of DCM during the epoxy-amine
reactions at the temperature of interest. The good miscibility observed for DCM in
the reacting system likely stems from favorable weak dipole-dipole interactions
involving hydroxyls formed during the ring opening reaction of DGEBA. Sample
transparency (refractive indices of 1.5-1.57 and 1.42 for epoxy and DCM,
respectively) before and after cure indicated the miscibility of dichloromethane
during epoxy-amine reactions without macro/micro phase separation. Provided
34
the criteria for selecting a solvent described above are met other solvents can be
used to create networks of altered topology.
3.2.3. Resin Selection
Solvent species typically exhibit poor diffusion rate through highly crosslinked
membranes.23, 24 Additionally, in a numerical study Rohr and Klein proposed that
diffusivity of chemical species is strongly influenced by species chain lengths. 25, 26
The preliminary experiments conducted with the epoxy resin EPON 828 and
crosslinker 1,4-bis(aminocyclohexyl)methane (PACM-20). Thermogravimetric
results showed that the diffusion rate of DCM through a membrane made from an
aromatic epoxy resin such as DGEBA and an aliphatic amine hardener like
Jeffamine D400 is about 3 to 4 times greater when compared to a system composed
of same epoxy resin cured with a cycloaliphatic amine such as PACM. It is believed
that the higher diffusivity of DCM in the Jeffamine-based epoxies is attributed to
the greater segmental flexibility of Jeffamine (and the lower Tg). So, although
polyetheramine as the curing agent provides a relatively low glass transition
temperature, it was used as the curing agent in this study since it eases the solvent
removal step.
35
3.2.4. Resin Processing
The sample batches were named by the weight ratio, labelled “DEA”, of DCM to
the epoxy-amine resin used. For example, a “DEA 1” labelled sample has an equal
weight of solvent to epoxy-amine monomers and so it is 50% solvent by weight.
Batches with DEA’s of 0, 0.5, 0.75, 1, and 1.5 were prepared. EPON 828 resin was
put in vacuum prior to mixing to remove water and other impurities. The purity
of the EPON resin was confirmed using GPC. The value of epoxy equivalent
weight, EEW, for EPON 828 was taken as 185-192 gr/eq from the material spec
sheet. Jeffamine D-400 was used as received, and the amine hydrogen equivalent
weight, AHEW, was assumed to be 115 gr/eq according to the material data sheet.
Epoxy and amine were mixed in 2:1 molar ratio assuming ideal case where each
tetrafunctional amine reacts with two difunctional epoxies. Samples were mixed
in a centrifugal mixer at 2000 RPM for 10 min to ensure good mixing. The mixing
process continued until a clear transparent liquid was obtained.27 The samples
were then poured in a perfectly sealed container to minimize loss of DCM during
cure. PTFE tubes with tube vacuum couplings provided the sealed environment.
36
3.2.5. Curing Procedure
One challenge was to find the optimum curing temperature at which the
polymerization approaches adequate conversion while at the same time
guaranteeing the container could sustain the pressure produced by the DCM.
Previous studies confirm that the rate of epoxy-amine reactions is lowered in the
presence of inert solvent due to reactant dilution.28 Preliminary kinetic results
showed that curing reactions become extremely slow at temperatures below 50˚C
in the presence of DCM. DCM has a vapor pressure of approximately 2000 mmHg
at 70˚C,29 presenting experimental challenges with sealing the curing vessel for
curing temperatures above 70˚C. We therefore were limited to a maximum curing
temperature of 70˚C. All samples were kept at the reaction temperature for a total
of three days to ensure the concentration of unreacted moieties is approximately
zero (measured using Fourier transform infrared spectroscopy, detailed below).
The same curing protocol was used for all batches including 0 DEA. All samples
were weighed before and after cure to verify no solvent/resin was lost during cure.
It was observed that the relative volume shrinkage after drying was larger for the
specimens with higher initial solvent content.
37
3.2.6. Fourier Transform Infrared Spectroscopy (FTIR)
In order to monitor the epoxy-amine reactions and to investigate the inertness of
solvent molecules during epoxy-amine reactions, FTIR in the near-infrared region
(4000-8000 cm-1) was used. A NIR spectrometer Nexus 670/870 (Thermo Nicolet
Corp.) with CaF2 beam splitter was employed for this purpose. Capillary glass
tubes (ID = 1.6 + 0.05 mm) were used to hold the samples. The tubes were sealed to
ensure no solvent leakage during data acquisition. NIR spectra were collected at a
resolution of 4 cm-1 in absorbance mode. The near infrared region was chosen since
all the reactive moieties can be monitored. The peaks involved are the epoxy peak
at 4530 cm-1, the primary amine peak at 4925 cm-1, and the primary/secondary
amine peak at 6510 cm-1.30
3.2.7. Thermal Drying
All samples were oven-dried at 120˚C for about 20 days. The weight of each sample
was recorded at regular time intervals. After 20 days, the oven was turned off and
with the door closed, the samples were gradually cooled to room temperature. The
time between cooling and mechanical testing was approximately the same for all
samples, minimizing differences resulting from physical aging below Tg.
38
3.2.8. Dynamical Mechanical Analysis (DMA)
A TA instrument Q800 DMA apparatus was utilized to measure the viscoelastic
properties and Tg. All specimens were tested at a constant frequency of 1 Hz. The
oscillation amplitude was kept at 15 μm in single-cantilever mode. All samples
were sanded into rectangular slab geometry (35-36 mm in length, 10-12 mm in
width and approximately 2 mm in thickness). Test was conducted with a scanning
rate of 1˚C/min starting from room temperature to 140˚C to obtain sufficient data
below and above the glass transition temperature. The Tg value was taken from the
position of the peak of the loss modulus curve.
3.2.9. Density Measurement
The specific gravity and density of the resulting polymers was measured through
the water displacement technique as described in ASTM D792. All specimens were
well-polished and immersed in DI water at room temperature i.e. 23 ˚C. A setup
as described in ASTM D792 was used to measure wet weights and density was
measured using the procedures described therein.
Density values at the elevated temperatures (e.g. T = Tg + 40) were found by
adjusting the room temperature density using volume expansion data obtained
using a TA Instruments Q400 TMA apparatus.
39
3.2.10. Quasi-static mechanical properties
Uniaxial quasi-static mechanical properties in tensile and compressive modes were
determined using a servohydraulic INSTRON apparatus model 8872. Five
identical specimens were prepared for each sample type. They were cut into a
rectangular slab geometry and then plastic tabs glued at each end. They were also
well-polished to minimize the adverse effect of surface roughness on the resulting
stress-strain curves. All dimensions were uniform with a standard deviation of
±1%. All samples were drawn under a uniaxial tensile loading rate of 0.5 mm/min
at room temperature. The compression specimens were prepared the same way
where five identical cubic specimens (3x3x3 mm ± 2%) were put in order for each
of the sample types. Compressive load was applied in the axial direction at a
crosshead speed of 1 mm/min at room temperature. The stress-strain data was
collected until the point of rupture.
3.2.11. Scanning Electron Microscopy (SEM)
High resolution micrographs were taken with a Zeiss Supra 50VP equipped with
an in-lens imaging detector. The samples were all broken at either room
temperature or in liquid nitrogen. All the fractured surfaces were platinum
sputtered for 25 seconds prior to imaging. The sputtering duration is selected to
40
avoid covering the visible features on the broken surfaces with the sputtering
material.
3.2.12. All-atom Molecular Dynamics (MD) Simulations
The GAFF force field,31, 32 and the LAMMPS simulation package,33 was used to
conduct all-atom MD simulations of stoichiometric Epon/Jeffamine/DCM epoxies.
Each simulation system was generated by first placing stoichiometric amounts of
Epon828 and Jeffamine-D400 (J400) were followed by the desired amount
dichloromethane to obtain low density mixture in a periodic box. The
concentration of DCM in the mixtures was identical to those the experiments; i.e.,
0%, 33%, 40%, and 50% by weight DCM. Four replicas per DCM concentration
were generated. A series of NVE (constant number, volume and energy) and NPT
(constant number of atoms, constant pressure, and constant temperature)
simulations were initially performed on each system to achieve an equilibrium
density value of about 1.07 g/cm3. Then, a multi-step crosslinking algorithm was
applied to make three-dimensional network structures.34 Polymerization involves
the epoxide groups in Epon828 and the amine groups in Jeffamine D400 and results
in a crosslinked network. Once a fully reacted crosslinked polymer was
successfully achieved, DCM molecules were eliminated. Each system was
annealed afterwards in the NPT ensemble for 5 ns at 600 K. Finally, each system
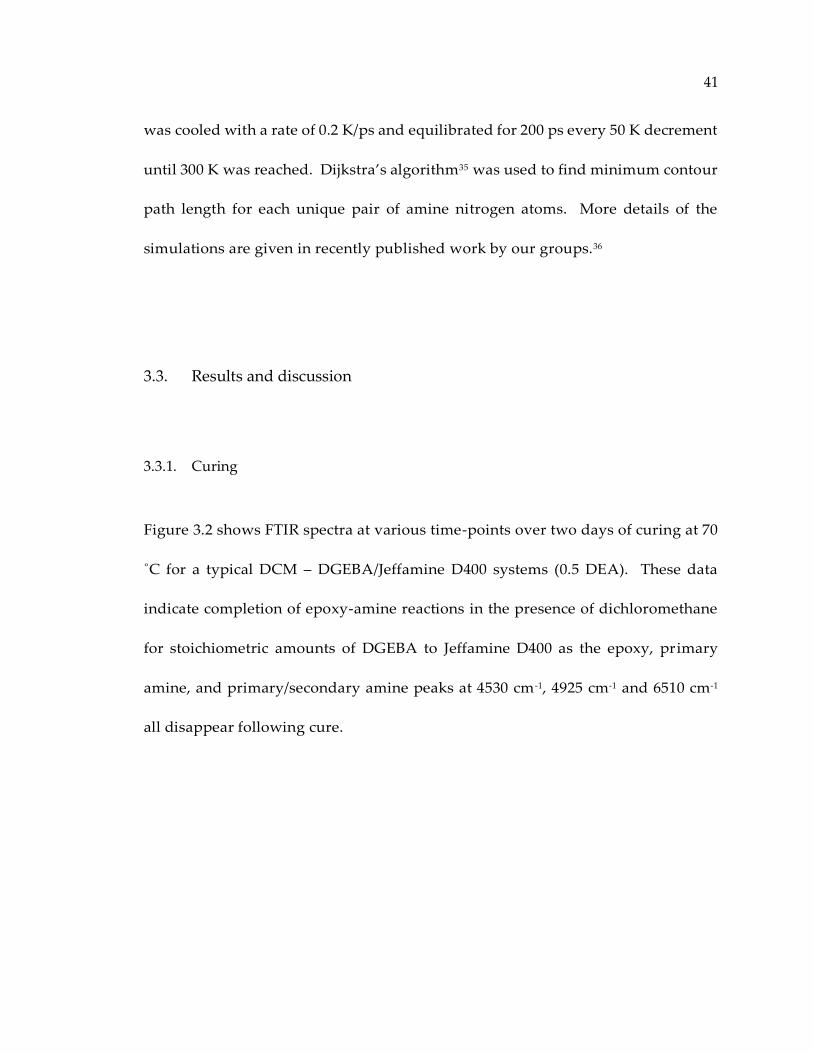
41
was cooled with a rate of 0.2 K/ps and equilibrated for 200 ps every 50 K decrement
until 300 K was reached. Dijkstra’s algorithm35 was used to find minimum contour
path length for each unique pair of amine nitrogen atoms. More details of the
simulations are given in recently published work by our groups.36
3.3. Results and discussion
3.3.1. Curing
Figure 3.2 shows FTIR spectra at various time-points over two days of curing at 70
˚C for a typical DCM – DGEBA/Jeffamine D400 systems (0.5 DEA). These data
indicate completion of epoxy-amine reactions in the presence of dichloromethane
for stoichiometric amounts of DGEBA to Jeffamine D400 as the epoxy, primary
amine, and primary/secondary amine peaks at 4530 cm-1, 4925 cm-1 and 6510 cm-1
all disappear following cure.
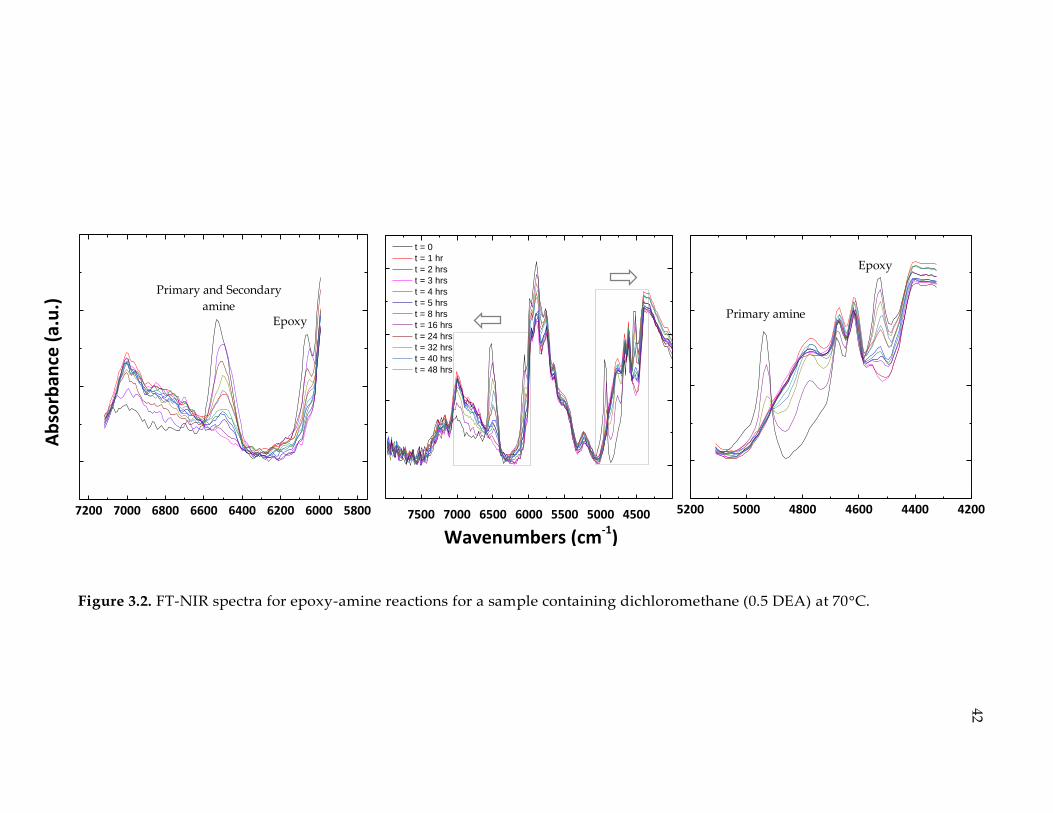
7500 7000 6500 6000 5500 5000 4500
t = 0
t = 1 hr
t = 2 hrs
t = 3 hrs
t = 4 hrs
t = 5 hrs
t = 8 hrs
t = 16 hrs
t = 24 hrs
t = 32 hrs
t = 40 hrs
t = 48 hrs
Wavenumbers (cm-1)
5200 5000 4800 4600 4400 4200
7200 7000 6800 6600 6400 6200 6000 5800
Ab
sorb
ance
(a.
u.)
Primary and Secondary
amine
Epoxy
Epoxy
Primary amine
Figure 3.2. FT-NIR spectra for epoxy-amine reactions for a sample containing dichloromethane (0.5 DEA) at 70°C.
42
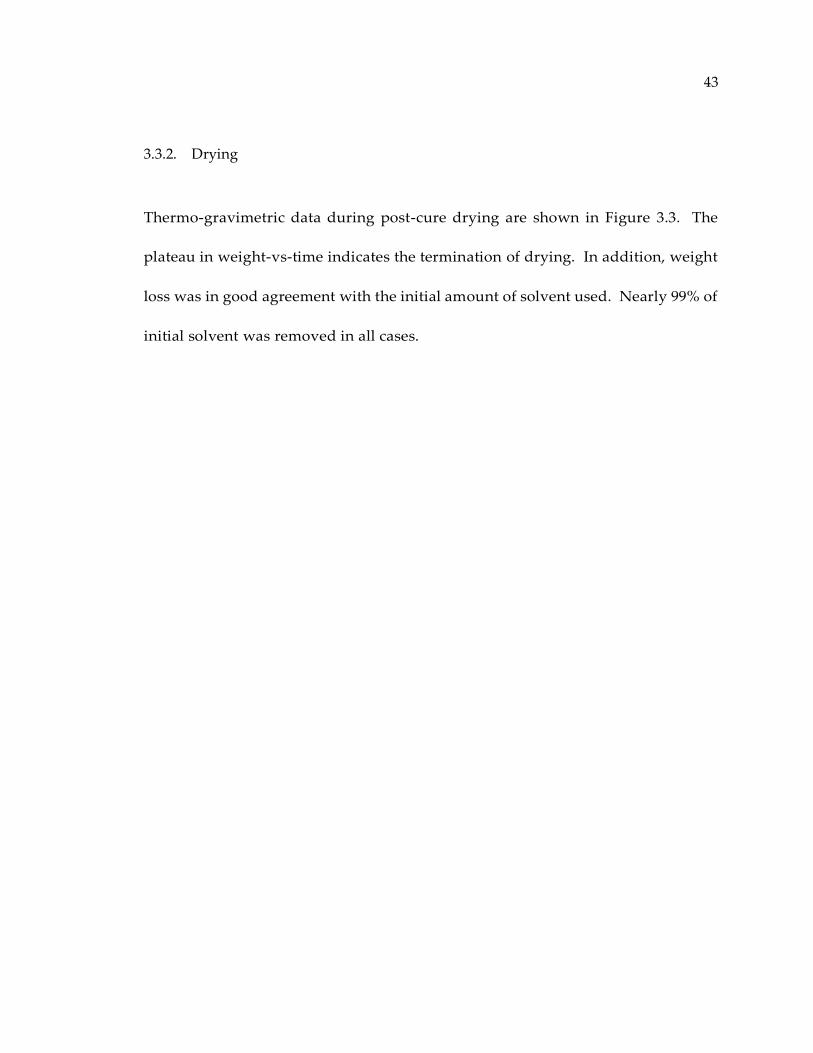
43
3.3.2. Drying
Thermo-gravimetric data during post-cure drying are shown in Figure 3.3. The
plateau in weight-vs-time indicates the termination of drying. In addition, weight
loss was in good agreement with the initial amount of solvent used. Nearly 99% of
initial solvent was removed in all cases.
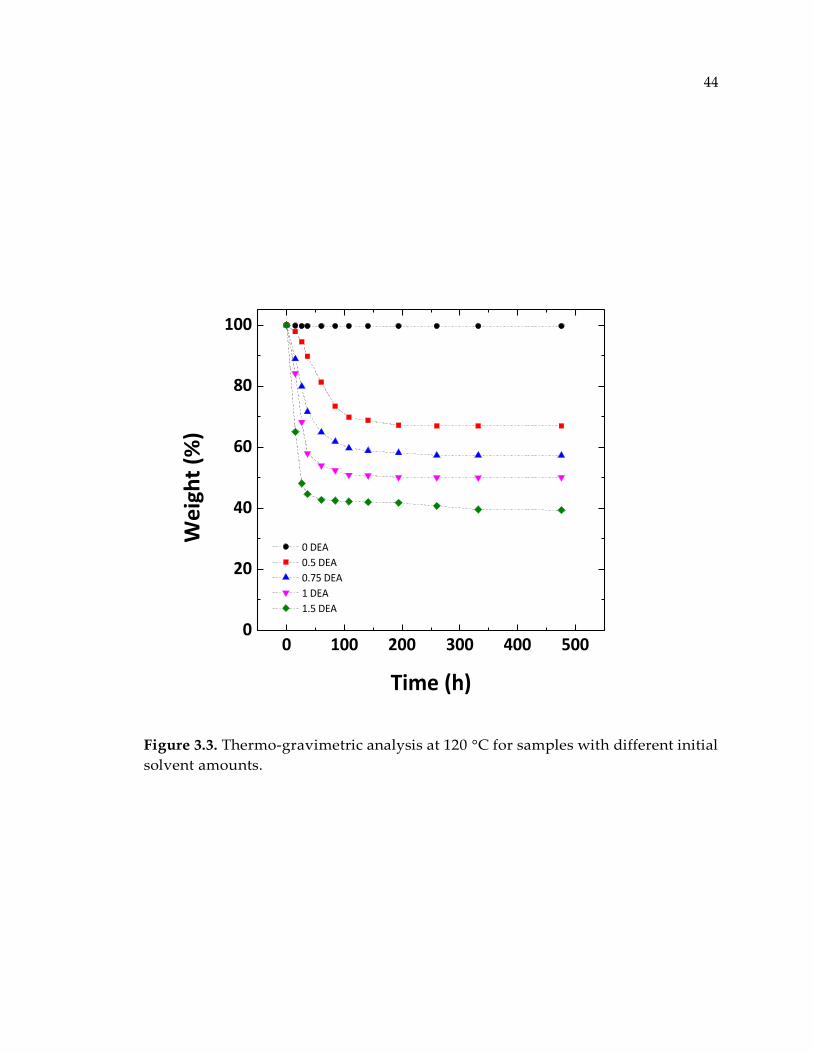
44
Figure 3.3. Thermo-gravimetric analysis at 120 °C for samples with different initial
solvent amounts.
0 100 200 300 400 5000
20
40
60
80
100
0 DEA
0.5 DEA
0.75 DEA
1 DEA
1.5 DEA
We
igh
t (%
)
Time (h)
45
3.3.3. Bulk Density
The original RES method using supercritical extraction was developed to
synthesize nanoporous thermosets.28 In the RESD approach, drying above Tg and
long-time annealing is hypothesized to fully collapse these voids, yielding samples
with the same density as neat-cured epoxies. Average density values and their
standard deviations for the dried specimens at room temperature, and their
corresponding estimated values for T = Tg + 40 °C are listed in Table 3.1. Statistically
invariant density values for all samples support the claim that the free volume
fraction is comparable for unmodified and modified systems implying that the
modified structures should have collapsed voids. Furthermore, equal density
values at T = Tg + 40 °C indicate that the hypothesized void structures remain
collapsed in the rubbery state.
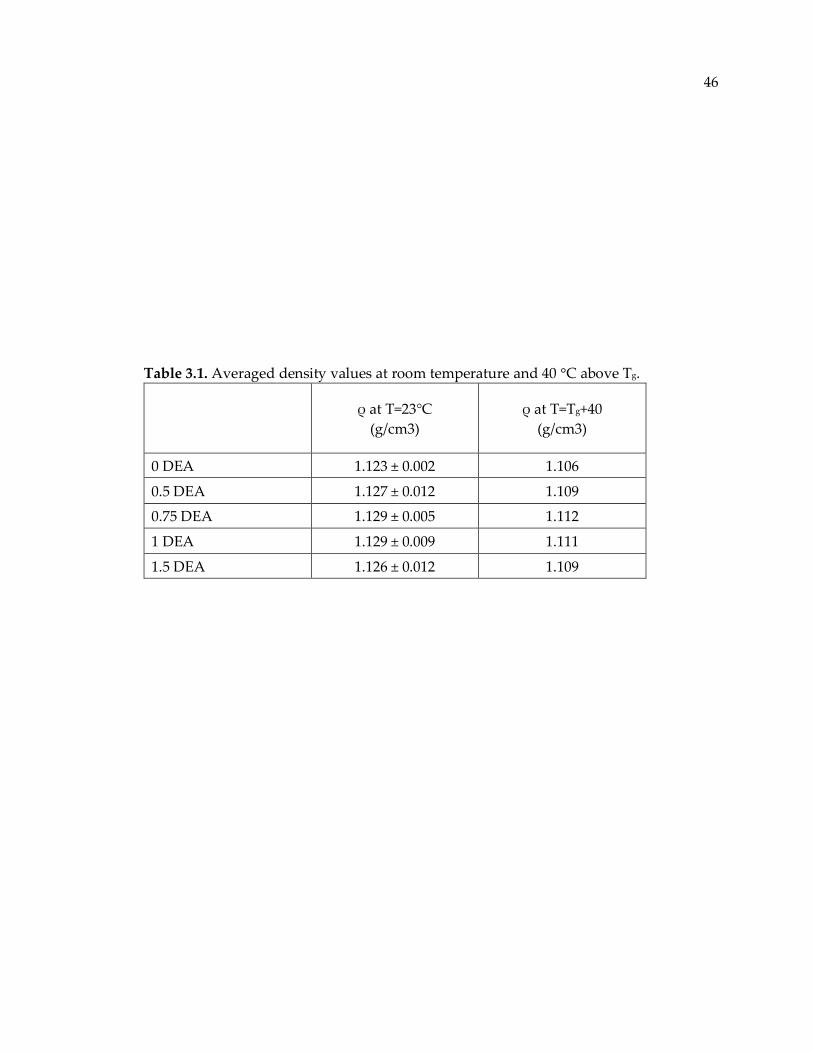
46
Table 3.1. Averaged density values at room temperature and 40 °C above Tg.
ρ at T=23°C
(g/cm3)
ρ at T=Tg+40
(g/cm3)
0 DEA 1.123 ± 0.002 1.106
0.5 DEA 1.127 ± 0.012 1.109
0.75 DEA 1.129 ± 0.005 1.112
1 DEA 1.129 ± 0.009 1.111
1.5 DEA 1.126 ± 0.012 1.109
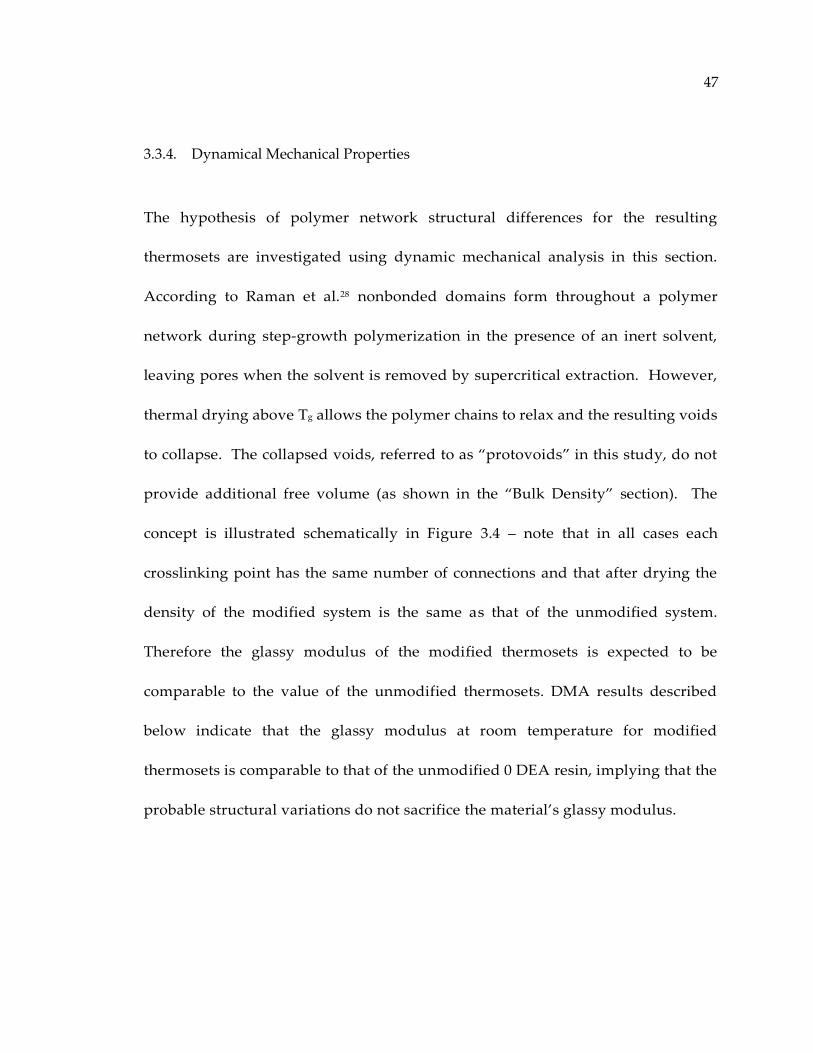
47
3.3.4. Dynamical Mechanical Properties
The hypothesis of polymer network structural differences for the resulting
thermosets are investigated using dynamic mechanical analysis in this section.
According to Raman et al.28 nonbonded domains form throughout a polymer
network during step-growth polymerization in the presence of an inert solvent,
leaving pores when the solvent is removed by supercritical extraction. However,
thermal drying above Tg allows the polymer chains to relax and the resulting voids
to collapse. The collapsed voids, referred to as “protovoids” in this study, do not
provide additional free volume (as shown in the “Bulk Density” section). The
concept is illustrated schematically in Figure 3.4 – note that in all cases each
crosslinking point has the same number of connections and that after drying the
density of the modified system is the same as that of the unmodified system.
Therefore the glassy modulus of the modified thermosets is expected to be
comparable to the value of the unmodified thermosets. DMA results described
below indicate that the glassy modulus at room temperature for modified
thermosets is comparable to that of the unmodified 0 DEA resin, implying that the
probable structural variations do not sacrifice the material’s glassy modulus.
48
Figure 3.4. 2D schematic network structure of a neat-cured epoxy and modified
epoxy through RES and RESD. The upper right is when solvent is removed through
supercritical extraction and lower right is when solvent removed through thermal
drying.
Fully Cured PN
Supercritical Extraction
Unmodified PN
ρ ~ 1.12 g/cm3
ρ ~ 1.12 g/cm3
(1.5 DEA specimen)
ρ < 1 g/cm3
(1.5 DEA specimen)
Modified PN
RES
Thermal Drying
RESD
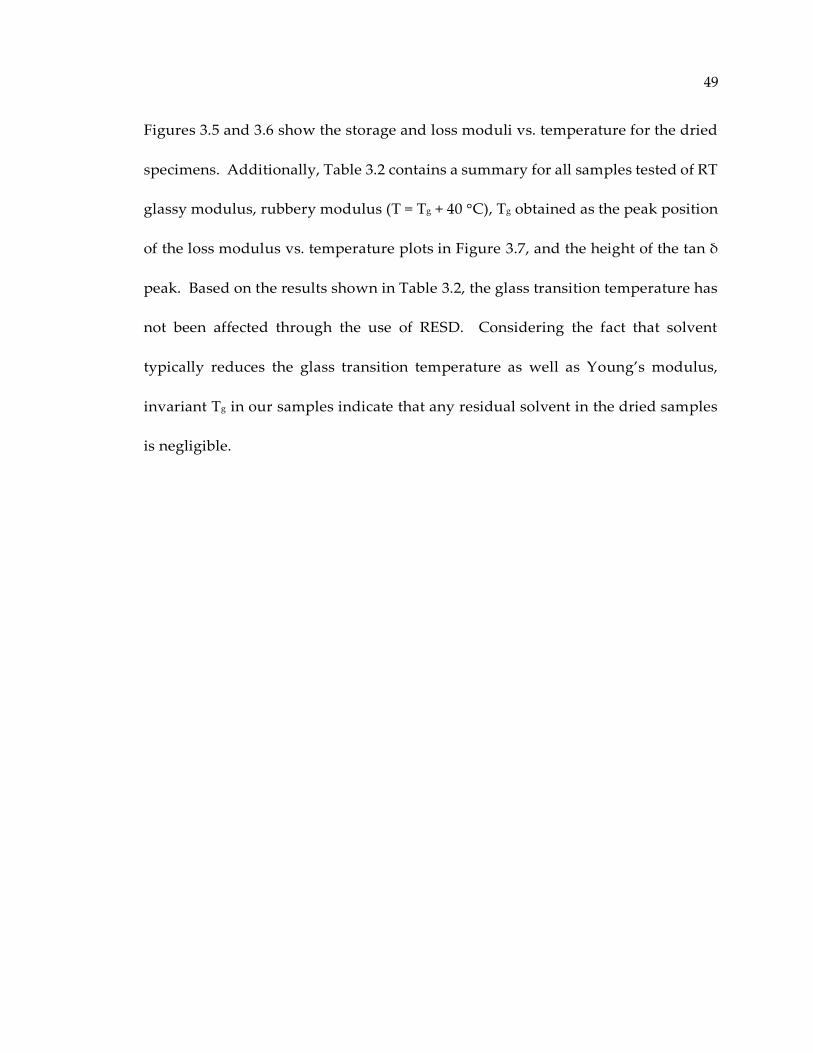
49
Figures 3.5 and 3.6 show the storage and loss moduli vs. temperature for the dried
specimens. Additionally, Table 3.2 contains a summary for all samples tested of RT
glassy modulus, rubbery modulus (T = Tg + 40 °C), Tg obtained as the peak position
of the loss modulus vs. temperature plots in Figure 3.7, and the height of the tan δ
peak. Based on the results shown in Table 3.2, the glass transition temperature has
not been affected through the use of RESD. Considering the fact that solvent
typically reduces the glass transition temperature as well as Young’s modulus,
invariant Tg in our samples indicate that any residual solvent in the dried samples
is negligible.
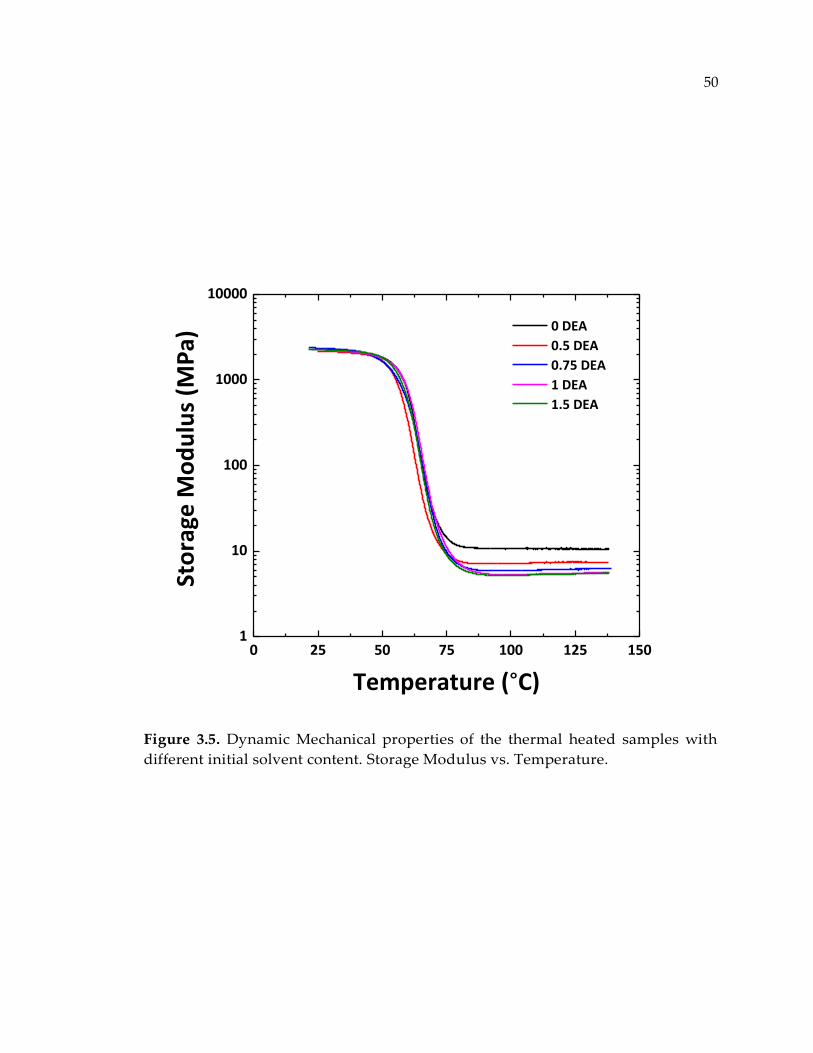
50
Figure 3.5. Dynamic Mechanical properties of the thermal heated samples with
different initial solvent content. Storage Modulus vs. Temperature.
0 25 50 75 100 125 1501
10
100
1000
10000
Sto
rage
Mo
du
lus
(MP
a)
Temperature (°C)
0 DEA
0.5 DEA
0.75 DEA
1 DEA
1.5 DEA

51
Figure 3.6. Dynamic Mechanical properties of the thermal heated samples with
different initial solvent content. Loss Modulus vs. Temperature.
0 25 50 75 100 125 150
0
100
200
300
400
Loss
Mo
du
lus
(MP
a)
Temperature (°C)
0 DEA
0.5 DEA
0.75 DEA
1 DEA
1.5 DEA
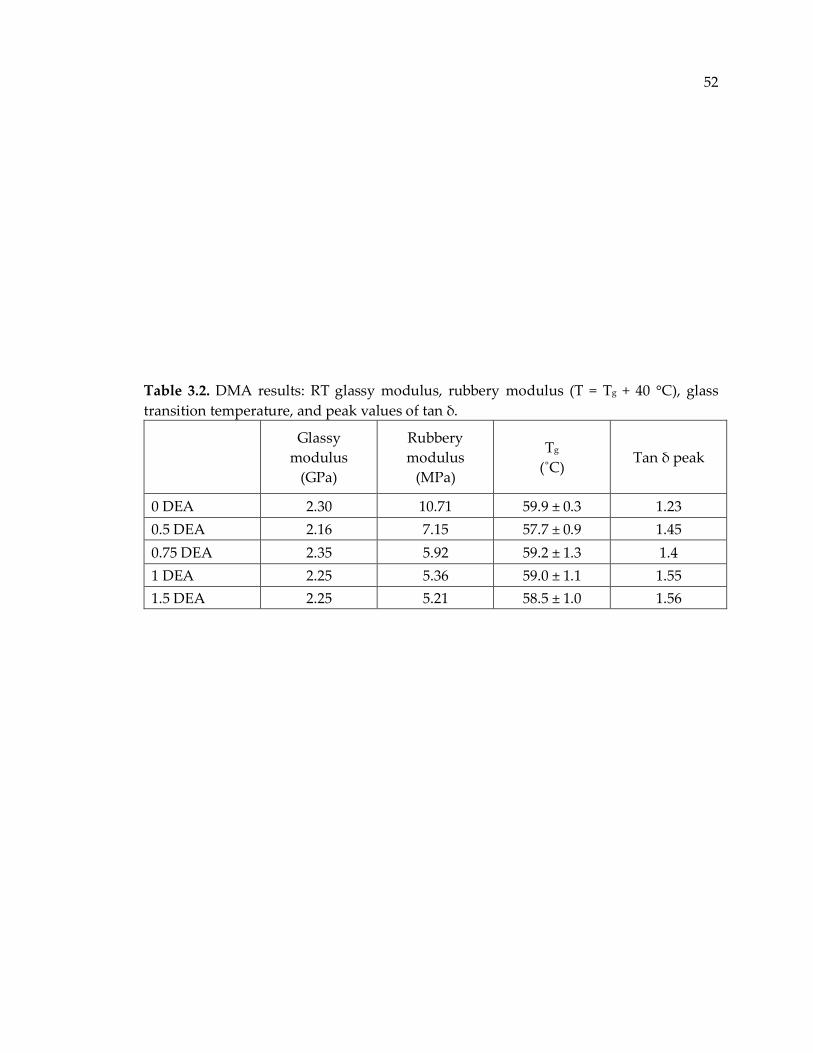
52
Table 3.2. DMA results: RT glassy modulus, rubbery modulus (T = Tg + 40 °C), glass
transition temperature, and peak values of tan δ.
Glassy
modulus
(GPa)
Rubbery
modulus
(MPa)
Tg
(˚C) Tan δ peak
0 DEA 2.30 10.71 59.9 ± 0.3 1.23
0.5 DEA 2.16 7.15 57.7 ± 0.9 1.45
0.75 DEA 2.35 5.92 59.2 ± 1.3 1.4
1 DEA 2.25 5.36 59.0 ± 1.1 1.55
1.5 DEA 2.25 5.21 58.5 ± 1.0 1.56
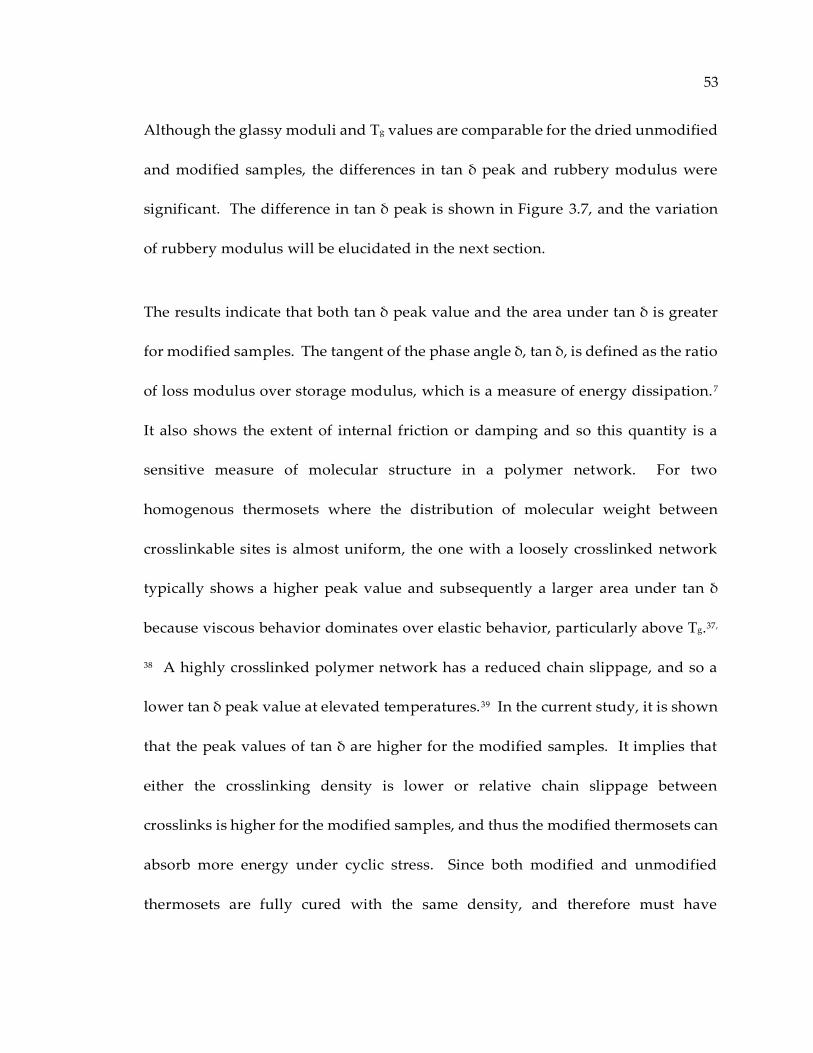
53
Although the glassy moduli and Tg values are comparable for the dried unmodified
and modified samples, the differences in tan δ peak and rubbery modulus were
significant. The difference in tan δ peak is shown in Figure 3.7, and the variation
of rubbery modulus will be elucidated in the next section.
The results indicate that both tan δ peak value and the area under tan δ is greater
for modified samples. The tangent of the phase angle δ, tan δ, is defined as the ratio
of loss modulus over storage modulus, which is a measure of energy dissipation.7
It also shows the extent of internal friction or damping and so this quantity is a
sensitive measure of molecular structure in a polymer network. For two
homogenous thermosets where the distribution of molecular weight between
crosslinkable sites is almost uniform, the one with a loosely crosslinked network
typically shows a higher peak value and subsequently a larger area under tan δ
because viscous behavior dominates over elastic behavior, particularly above Tg.37,
38 A highly crosslinked polymer network has a reduced chain slippage, and so a
lower tan δ peak value at elevated temperatures.39 In the current study, it is shown
that the peak values of tan δ are higher for the modified samples. It implies that
either the crosslinking density is lower or relative chain slippage between
crosslinks is higher for the modified samples, and thus the modified thermosets can
absorb more energy under cyclic stress. Since both modified and unmodified
thermosets are fully cured with the same density, and therefore must have

54
comparable crosslink densities, the observed difference in viscoelastic properties
could be due to network topology differences.
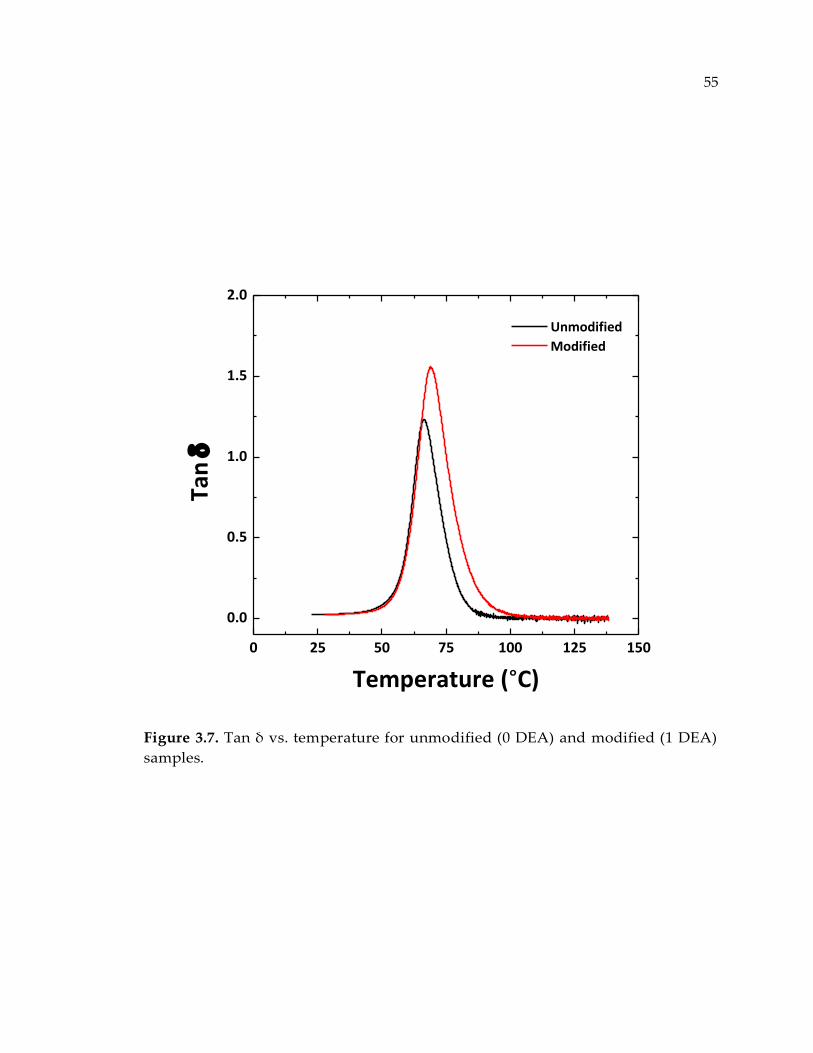
55
Figure 3.7. Tan δ vs. temperature for unmodified (0 DEA) and modified (1 DEA)
samples.
0 25 50 75 100 125 150
0.0
0.5
1.0
1.5
2.0
Unmodified
Modified
Tan
Temperature (°C)
56
3.3.5. Topological Differences
One important observation in this study is the decreasing trend in rubbery modulus
when increasing the initial solvent-to-monomer weight ratio of the dried samples
(Figure 3.5).
The molecular weight between crosslinks, 𝑀𝑐 , and crosslink density, ν, for an
amorphous polymer network above its glass transition temperature can be
obtained using the following relations derived from rubber elasticity theory:39
𝑀𝑐 = 3𝜌𝑅𝑇
𝐸 (3.1)
𝜈 =𝜌
𝑀𝑐 (3.2)
Crosslink density (𝜈) and molecular weight between crosslinks (𝑀𝑐 ), are plotted in
Figure 3.8 as a function of initial solvent-to monomer ratio using Equations 3.1 and
3.2 and density and rubbery modulus data obtained at T = Tg + 40 °C given in Tables
3.1 and 3.2 respectively.

57
Figure 3.8. Apparent molecular weight between crosslinks and apparent
crosslinking density vs. initial solvent-to-monomer weight ratio. Samples are fully
reacted and identical in composition.
0.0 0.5 1.0 1.5
900
1200
1500
1800
2100
MW between Crosslinks
Fitted Curve
Crosslinking Density
Initial Solvent-to-Monomer Weight RatioMo
lecu
lar
We
igh
t B
etw
ee
n C
ross
lin
ks
(g/m
ol)
0
2
4
6
8
10
12
Cro
sslinkin
g De
nsity
(*1
04 m
ol/cm
3)
58
The reduced plateau rubbery modulus for modified specimens is not due to
inadequate polymerization. NearIR spectra showed that epoxy-amine reactions are
the predominant reactions for systems with or without solvent. Additionally, all
show an ultimate conversion greater than 99% for epoxide reactive groups.
Macosko et al.40 related the molecular weight between crosslinkable sites to the
extent of crosslink formations. According to this theoretical relationship, the extent
of reaction beyond gelation for the resulting thermosets should be much lower than
unity to provide identical 𝑀𝑐 values corresponding to the ones measured for our
modified samples. This difference is larger than the error attributed to the
conversion levels obtained from NearIR and so the extent of cure is not the reason
for the elevated values of molecular weight between crosslinks. Moreover, it has
been discussed that glass transition temperature is a sensitive measure of extent of
polymerization,41-43 and any deviation from full cure conversion should result in a
drastic decrease in the glass transition temperature. From this perspective, the
comparable Tg values indicate that the reduced rubbery plateau was not caused by
differences in extent of polymerization.
The topological distance between crosslinks is anticipated to be a parameter that
differs substantially when comparing unmodified to modified systems. This offers
an explanation for the observed differences in rubbery plateau moduli that is not
predicted by theory if the crosslink density is kept constant. Topological distance
59
is defined as the average of all distances from one crosslink point to all of the
neighboring crosslinks when tracing the network, in contrast to spatial distance
which is the average of all the straight distances from one crosslink point to all the
neighboring crosslinks. The distinction between spatial and topological distance is
shown in Figure 3.9. Note that for our dried systems the spatial distance between
crosslinks does not vary because the number of crosslinks (composition) remains
the same.
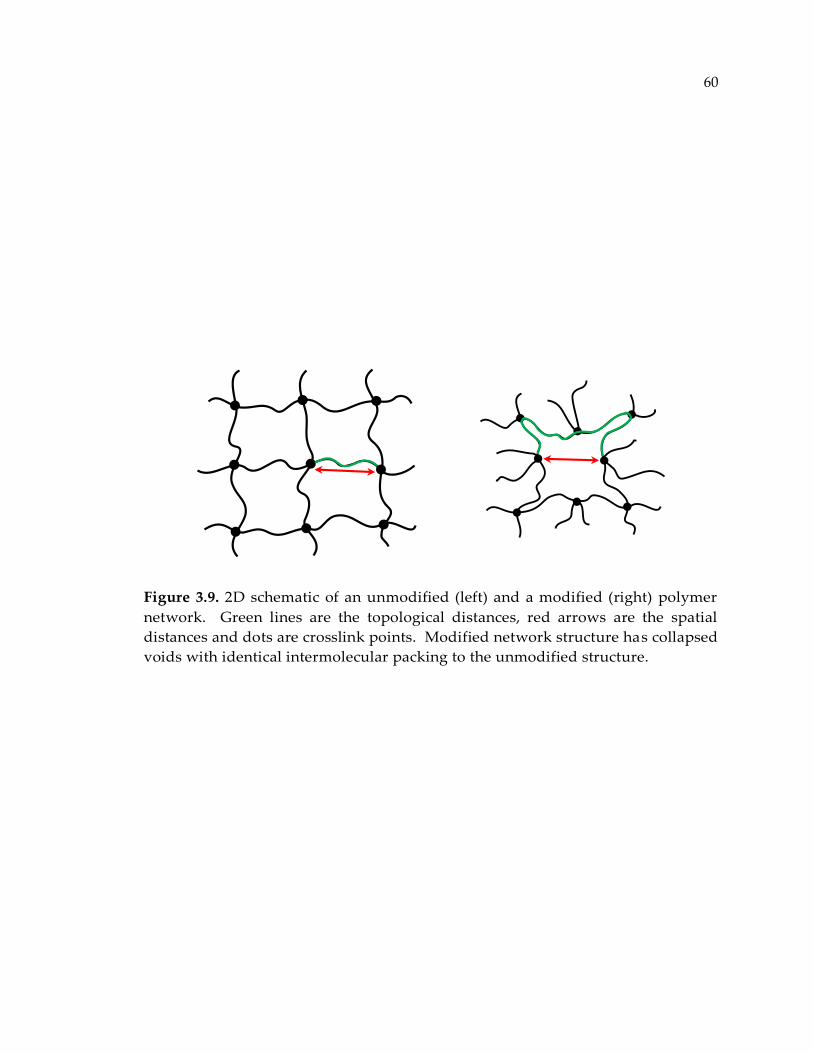
60
Figure 3.9. 2D schematic of an unmodified (left) and a modified (right) polymer
network. Green lines are the topological distances, red arrows are the spatial
distances and dots are crosslink points. Modified network structure has collapsed
voids with identical intermolecular packing to the unmodified structure.
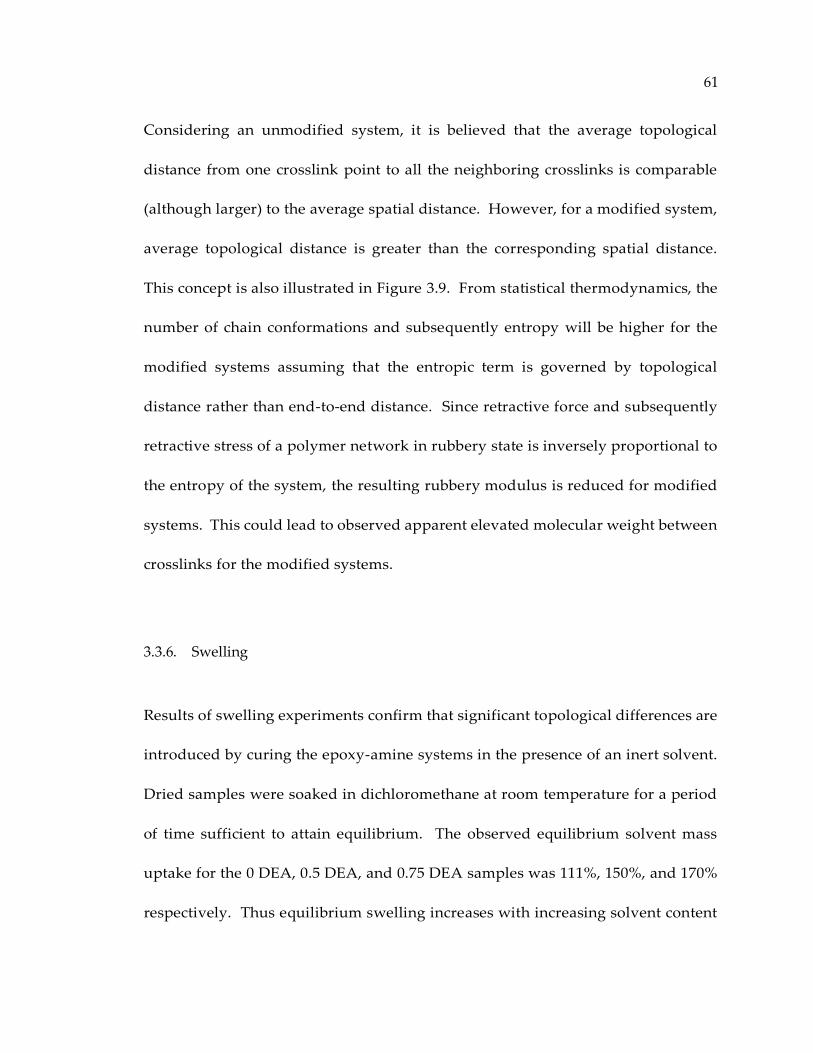
61
Considering an unmodified system, it is believed that the average topological
distance from one crosslink point to all the neighboring crosslinks is comparable
(although larger) to the average spatial distance. However, for a modified system,
average topological distance is greater than the corresponding spatial distance.
This concept is also illustrated in Figure 3.9. From statistical thermodynamics, the
number of chain conformations and subsequently entropy will be higher for the
modified systems assuming that the entropic term is governed by topological
distance rather than end-to-end distance. Since retractive force and subsequently
retractive stress of a polymer network in rubbery state is inversely proportional to
the entropy of the system, the resulting rubbery modulus is reduced for modified
systems. This could lead to observed apparent elevated molecular weight between
crosslinks for the modified systems.
3.3.6. Swelling
Results of swelling experiments confirm that significant topological differences are
introduced by curing the epoxy-amine systems in the presence of an inert solvent.
Dried samples were soaked in dichloromethane at room temperature for a period
of time sufficient to attain equilibrium. The observed equilibrium solvent mass
uptake for the 0 DEA, 0.5 DEA, and 0.75 DEA samples was 111%, 150%, and 170%
respectively. Thus equilibrium swelling increases with increasing solvent content
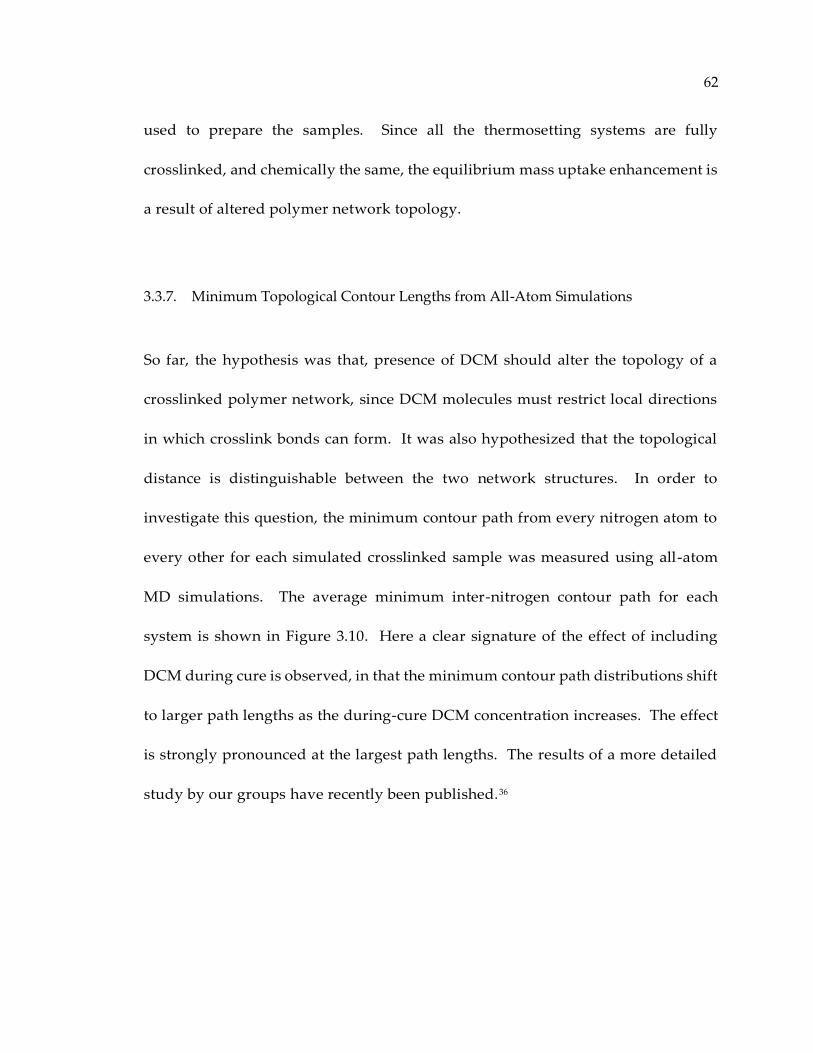
62
used to prepare the samples. Since all the thermosetting systems are fully
crosslinked, and chemically the same, the equilibrium mass uptake enhancement is
a result of altered polymer network topology.
3.3.7. Minimum Topological Contour Lengths from All-Atom Simulations
So far, the hypothesis was that, presence of DCM should alter the topology of a
crosslinked polymer network, since DCM molecules must restrict local directions
in which crosslink bonds can form. It was also hypothesized that the topological
distance is distinguishable between the two network structures. In order to
investigate this question, the minimum contour path from every nitrogen atom to
every other for each simulated crosslinked sample was measured using all-atom
MD simulations. The average minimum inter-nitrogen contour path for each
system is shown in Figure 3.10. Here a clear signature of the effect of including
DCM during cure is observed, in that the minimum contour path distributions shift
to larger path lengths as the during-cure DCM concentration increases. The effect
is strongly pronounced at the largest path lengths. The results of a more detailed
study by our groups have recently been published.36
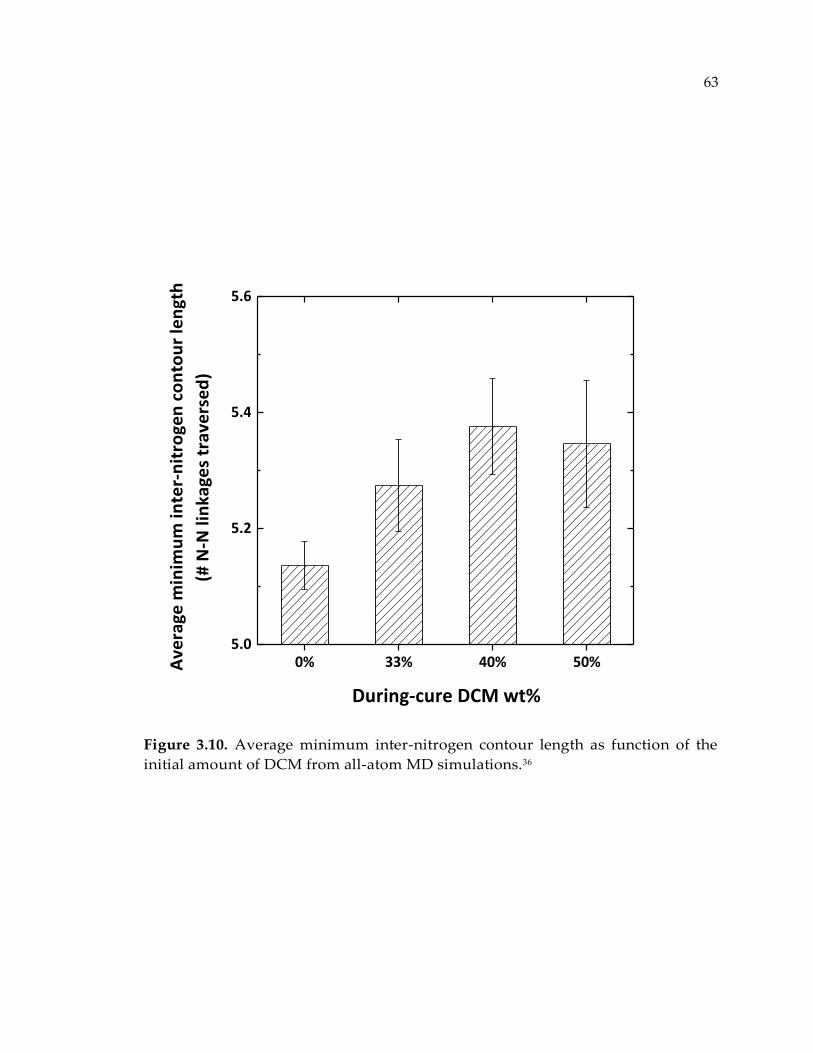
63
Figure 3.10. Average minimum inter-nitrogen contour length as function of the
initial amount of DCM from all-atom MD simulations.36
0% 33% 40% 50%5.0
5.2
5.4
5.6
During-cure DCM wt%
Ave
rage
min
imu
m in
ter-
nit
roge
n c
on
tou
r le
ngt
h
(# N
-N li
nka
ges
tra
vers
ed
)
64
The trend in minimum contour length with solvent content mimics that of the tan
δ peaks and apparent molecular weight between crosslinks. Clearly the all-atom
structures reflect the influence of solvent on the network topologies. This result is
significant because the minimum contour path between any two points represents
the largest Euclidean distance to which those points can be separated in straining
the system before covalent bonds must yield. Therefore it is hypothesized that
minimum contour paths between points in a network could influence large-scale
material properties, such as toughness, that depend less on intermolecular packing
and more on sacrificing covalent bonds. That we see twin correlations (a) between
RESD solvent content and toughness and (b) between RESD solvent content and
longer minimum contour paths justifies ongoing work in our labs to establish links
between network topology and material properties.
3.3.8. Quasi-Static Tensile Properties
As shown, RESD does not sacrifice the glass transition temperature and glassy
modulus of the cured thermosets. It was also discussed that the modified samples
contain structural features in the form of collapsed voids. According to Mukherji
et al.8 expansion and growth of these protovoids without bond breaking is the
microscopic origin of strain hardening in a glassy polymer which yields a more
65
ductile material. To investigate this hypothesis, mechanical response of each of the
materials to uniaxial tensile and compressive loading was captured.
Uniaxial stress-strain curves for the unmodified and modified tensile coupons were
recorded for at least five identical specimens for each data point. A very large
plastic deformation for the modified samples was observed, as shown in Figure
3.11. Although necking starts for both types of specimens at strain values of around
10%, modified samples also exhibited extensive drawing. The drawing is a result
of the local stress rising sufficiently during necking so that it is sufficient to stretch
material at the edge of the neck increasing the size of the necked region. It is
interesting to note that the behavior exhibited by the 1.5 DEA sample in Figure 3.11
is similar to that observed for semicrystalline thermoplastics where the ability to
sustain drawing is a result of large changes in microstructure with significant strain
hardening. Note that engineering stress and strain was used in reporting these data
as this is the most common way of reporting such data. Furthermore, simple
conversion to real stress strain does not provide additional insight since the necking
results in an inhomogeneous distribution of strains and stresses along the length of
the sample. Nevertheless it is important to realize that the stress in the necked
region is significantly higher than shown by the stress-strain plots in Figure 3.11.
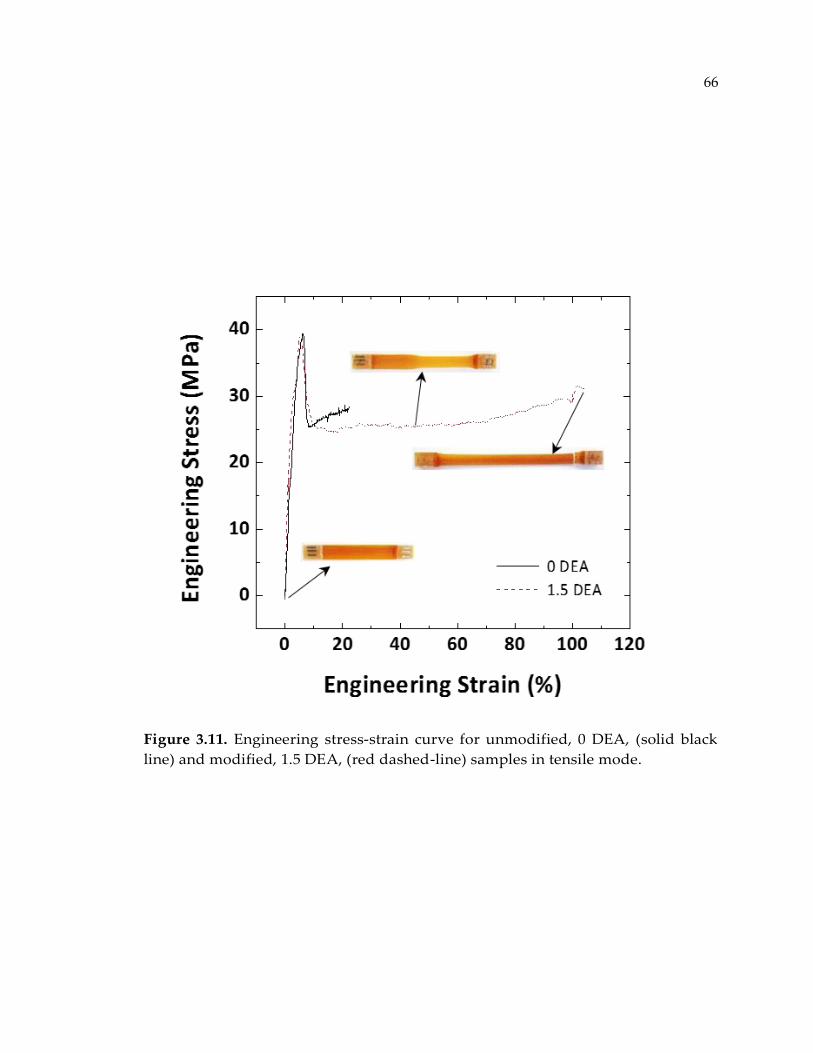
66
Figure 3.11. Engineering stress-strain curve for unmodified, 0 DEA, (solid black
line) and modified, 1.5 DEA, (red dashed-line) samples in tensile mode.
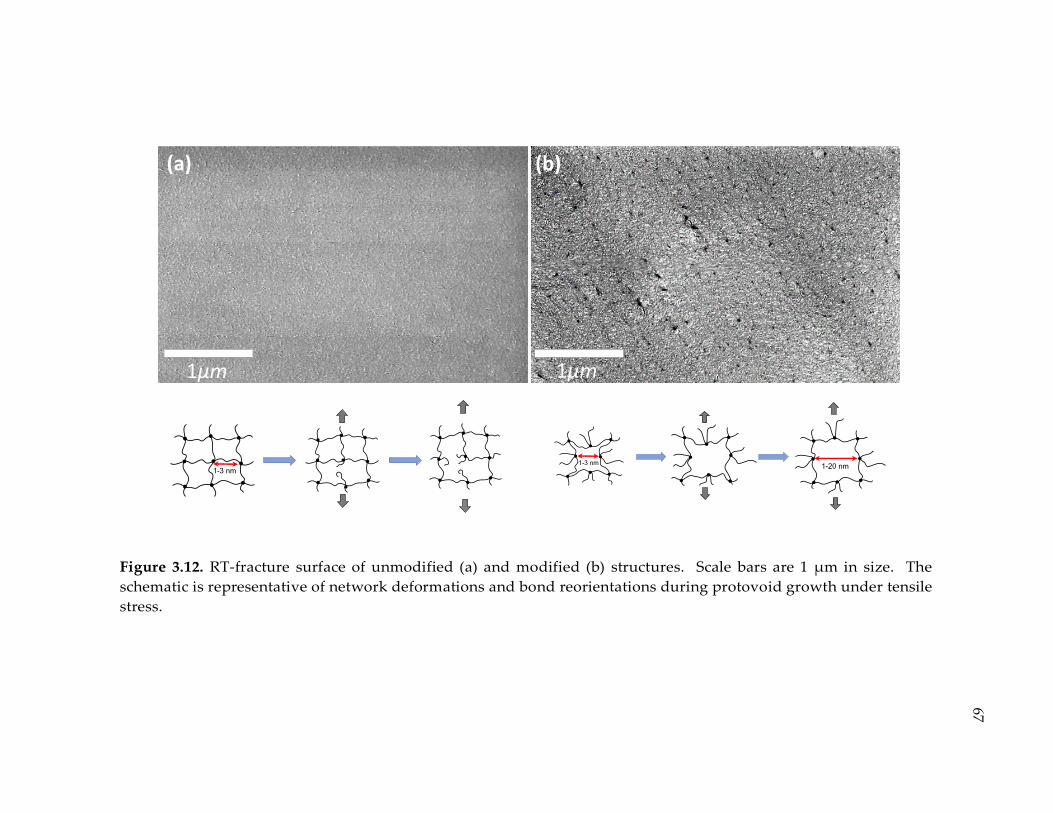
Figure 3.12. RT-fracture surface of unmodified (a) and modified (b) structures. Scale bars are 1 µm in size. The
schematic is representative of network deformations and bond reorientations during protovoid growth under tensile
stress.
1µm1µm
(a) (b)
1-3 nm1-3 nm
1-20 nm
67
68
It is suggested that this remarkable improvement in ductility, or toughness, is
primarily due to the topological differences between unmodified and modified
polymer networks as discussed. Opening of protovoids without bond breaking
would enable the thermoset to plastically elongate under tensile deformations as
illustrated schematically in Figure 3.12. Also contained in Figure 3.12 are SEM
images of the fracture surfaces of 0 DEA (a) and 1.5 DEA (b) samples. The modified
sample fracture surfaces clearly show nano-scale cavities not present in the
unmodified systems.
Evidence of stress relaxation was observed in the necked region after testing. In a
separate study, drawn samples were annealed at room temperature, and above Tg
(= 60 ˚C). Samples annealed at room temperature deformed slightly, whereas the
samples annealed above Tg recovered their original shape. The shape recovering
capacity of highly elongated samples suggest that covalent bond rupture was not
prevalent during tensile deformation. This suggests that the improved ductility of
the modified samples arises from enhanced molecular mobility associated with the
disruption of weak interactions at the interfaces of the protovoids.
Average values of toughness and failure strain are shown for each batch of samples
in Figures 3.13 and 3.14. Here, toughness refers to the total area under stress-strain
curve to the point of fracture, and it is a measure of ductility. In addition, failure
69
strain is defined as the strain value at which the sample breaks. As can be seen in
Figure 3.13, toughness increased with initial DCM content up to a solvent-to-
monomer weight ratio of 0.75, beyond which no further increase is observed. The
trend of failure strain was similar to that of toughness. Generally, thermoset
toughness can be increased by using more flexible crosslinkers, but more flexible
crosslinkers generally means lower Tg’s.9 We use relatively flexible Jeffamine
crosslinkers, but across our values of solvent-to-monomer initial weight ratios, Tg
is essentially invariant while ductility is greatly enhanced. This demonstrates that
the toughening effect due to the expansion of protovoids does not sacrifice Tg. In
addition, Young’s modulus (E) and tensile strength at yield (σy) are listed in Table
3.3. The results show no significant statistical differences between unmodified and
modified samples, demonstrating that the enhancement in ductility is obtained also
without sacrificing Young’s modulus and tensile strength.
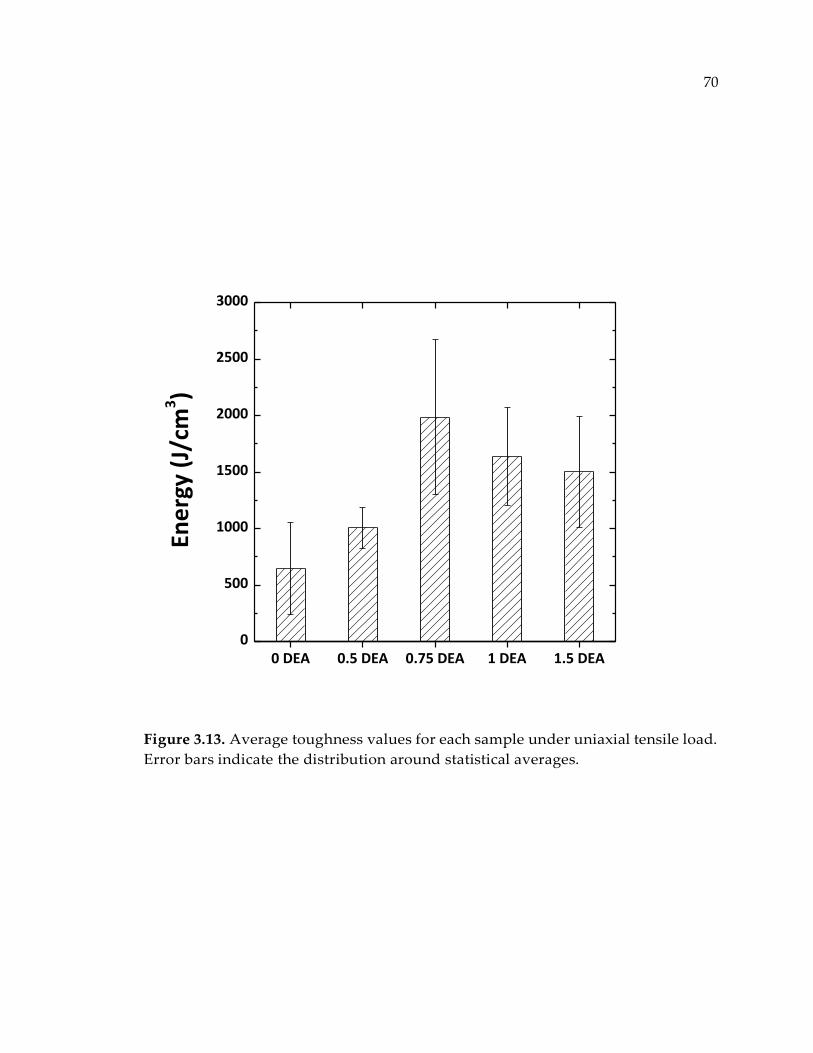
70
Figure 3.13. Average toughness values for each sample under uniaxial tensile load.
Error bars indicate the distribution around statistical averages.
0 DEA 0.5 DEA 0.75 DEA 1 DEA 1.5 DEA0
500
1000
1500
2000
2500
3000
Ene
rgy
(J/c
m3)
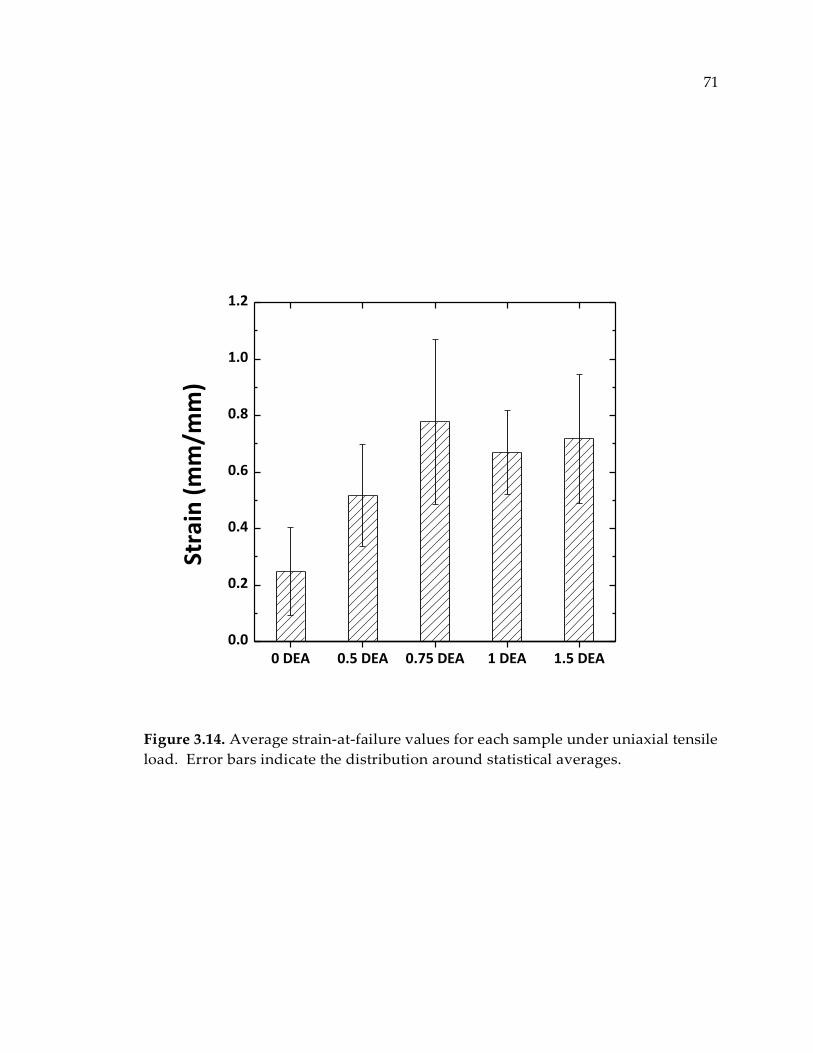
71
Figure 3.14. Average strain-at-failure values for each sample under uniaxial tensile
load. Error bars indicate the distribution around statistical averages.
0 DEA 0.5 DEA 0.75 DEA 1 DEA 1.5 DEA0.0
0.2
0.4
0.6
0.8
1.0
1.2
Stra
in (
mm
/mm
)
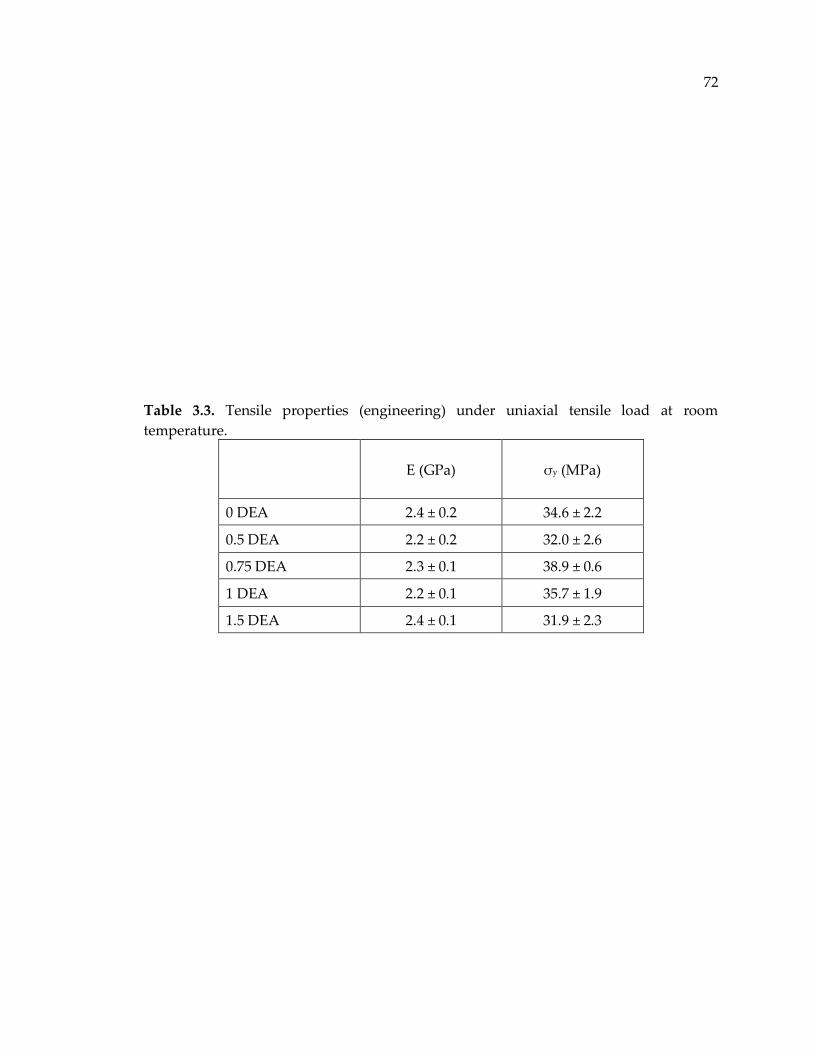
72
Table 3.3. Tensile properties (engineering) under uniaxial tensile load at room
temperature.
E (GPa) σy (MPa)
0 DEA 2.4 ± 0.2 34.6 ± 2.2
0.5 DEA 2.2 ± 0.2 32.0 ± 2.6
0.75 DEA 2.3 ± 0.1 38.9 ± 0.6
1 DEA 2.2 ± 0.1 35.7 ± 1.9
1.5 DEA 2.4 ± 0.1 31.9 ± 2.3
73
3.3.9. Void Size and Density
Raman et al.22 showed that in the RES technique using supercritical drying, average
pores size of a nanoporous polymer network can be tailored through the initial
solvent-to-monomer weight ratio. This suggests that the sizes of the protovoids
generated using RESD would also increase with increasing solvent content and that
the size might also be linked to improvement in ductility of the modified
thermosets. Assuming that the features observed in the fracture surfaces of
modified systems are indeed related to the size of the collapsed voids, protovoid
size was investigated by quantitatively analyzing SEM micrographs of such
surfaces. An image processing tool, ImageJ, was utilized to determine the average
pore size and surface density. Figure 3.15 shows estimates of void diameters for
samples from each batch. The error bars associated with each mean is the standard
deviation obtained from at least three images at different surface locations. We
observe that the average void diameter for the relatively circular features, with
circularity of 0.3-1, is roughly 20-22 nm. According to Raman et al.22, the average
pores size of the nanoporous thermosetting networks obtained from 0.5 and 0.75
solvent-to-monomer weight ratios in RES was 2.4 and 3.2 nm. The features
observed in our work are significantly larger perhaps because of deformation
induced by loading.
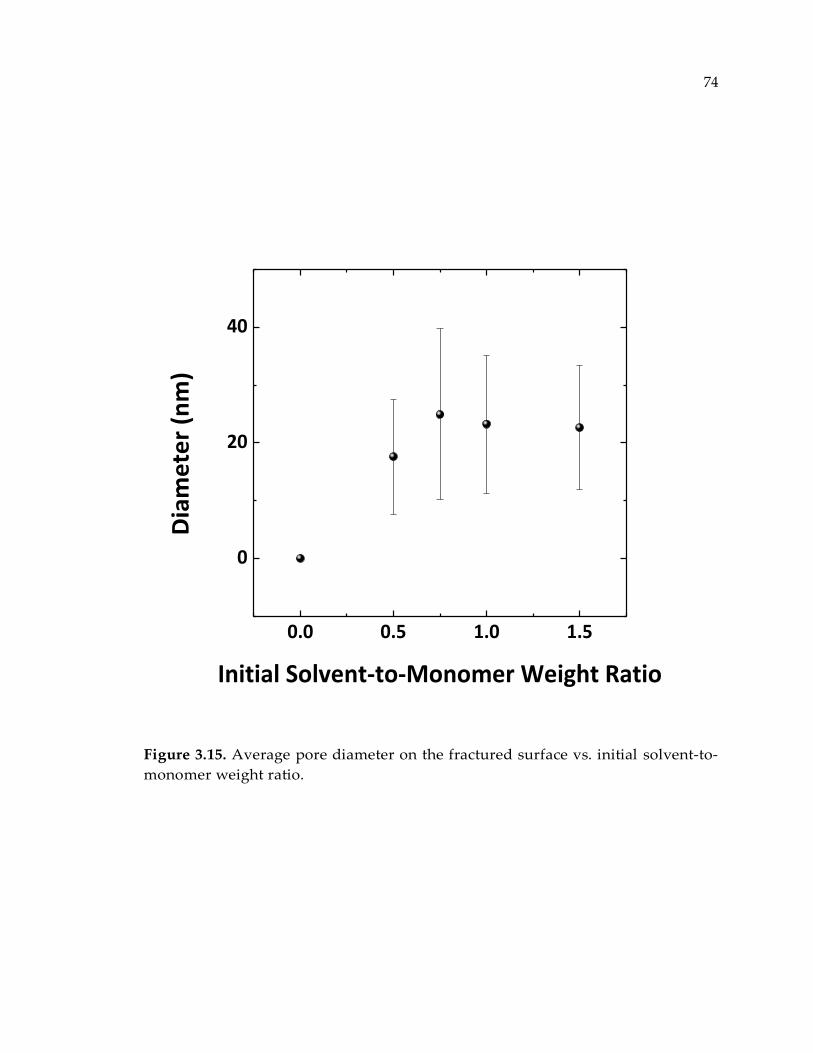
74
Figure 3.15. Average pore diameter on the fractured surface vs. initial solvent-to-
monomer weight ratio.
0.0 0.5 1.0 1.5
0
20
40
Dia
me
ter
(nm
)
Initial Solvent-to-Monomer Weight Ratio
75
The question arises as to whether the observed voids were present before failure.
The following discussion serves to answer this question. The surface area fraction
occupied by voids was obtained from the images of modified and unmodified
systems. These data are reported in Figure 3.16. For the modified samples broken
at ambient temperature void area fractions were not substantially different ranging
between 0.5 and 1.2%. If it is assumed that these voids were present before
mechanical testing, the area void fractions to calculate density values using the
equation below:
𝜌2 = (1 − 𝛼) ∗ 𝜌1 (3.3)
where 𝜌2 is predicted density, 𝜌1is the unmodified epoxy density, and 𝛼 is void-
covered area fraction which was measured through image processing of the
micrographs. For instance, 1.5 DEA was found to have an average 𝛼 value of 1.05%
from fracture surface micrographs. This yields a predicted density of
approximately 1.114 g/cm3. This value is significantly below the average density
of the material prior to tensile deformation. Thus this supports the hypothesis that
voids are not pre-existent but a result of protovoid opening and deformation
during fracture.
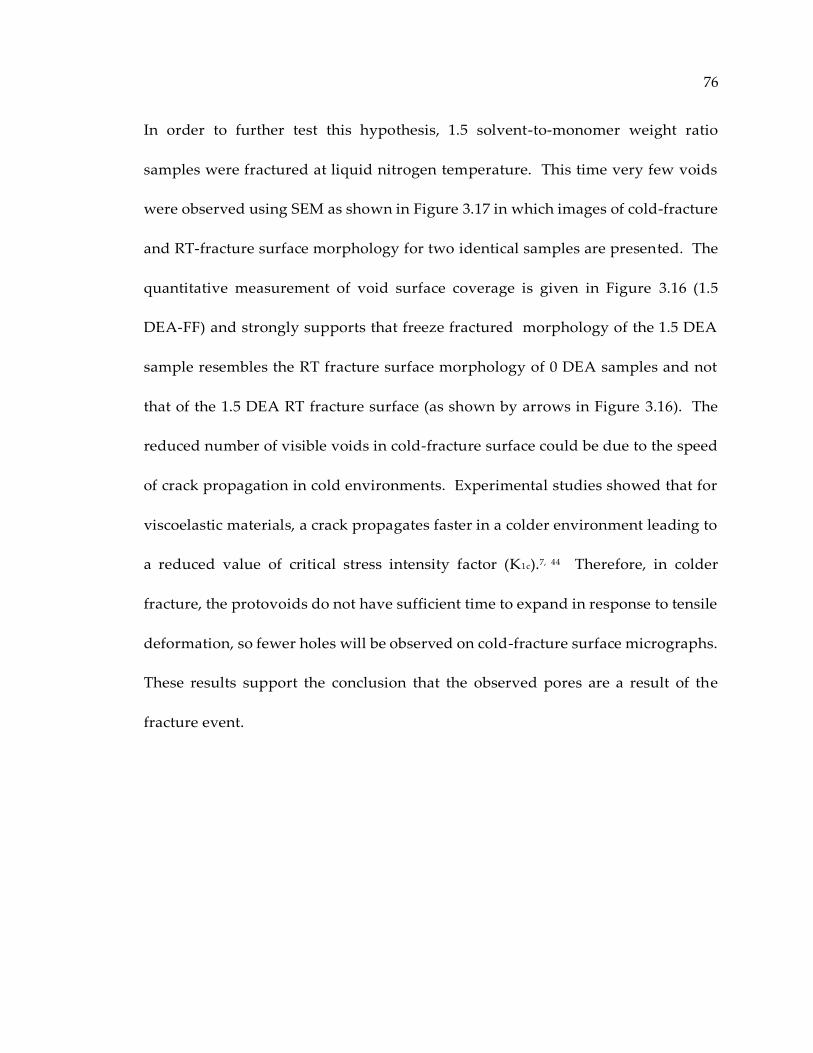
76
In order to further test this hypothesis, 1.5 solvent-to-monomer weight ratio
samples were fractured at liquid nitrogen temperature. This time very few voids
were observed using SEM as shown in Figure 3.17 in which images of cold-fracture
and RT-fracture surface morphology for two identical samples are presented. The
quantitative measurement of void surface coverage is given in Figure 3.16 (1.5
DEA-FF) and strongly supports that freeze fractured morphology of the 1.5 DEA
sample resembles the RT fracture surface morphology of 0 DEA samples and not
that of the 1.5 DEA RT fracture surface (as shown by arrows in Figure 3.16). The
reduced number of visible voids in cold-fracture surface could be due to the speed
of crack propagation in cold environments. Experimental studies showed that for
viscoelastic materials, a crack propagates faster in a colder environment leading to
a reduced value of critical stress intensity factor (K1c).7, 44 Therefore, in colder
fracture, the protovoids do not have sufficient time to expand in response to tensile
deformation, so fewer holes will be observed on cold-fracture surface micrographs.
These results support the conclusion that the observed pores are a result of the
fracture event.
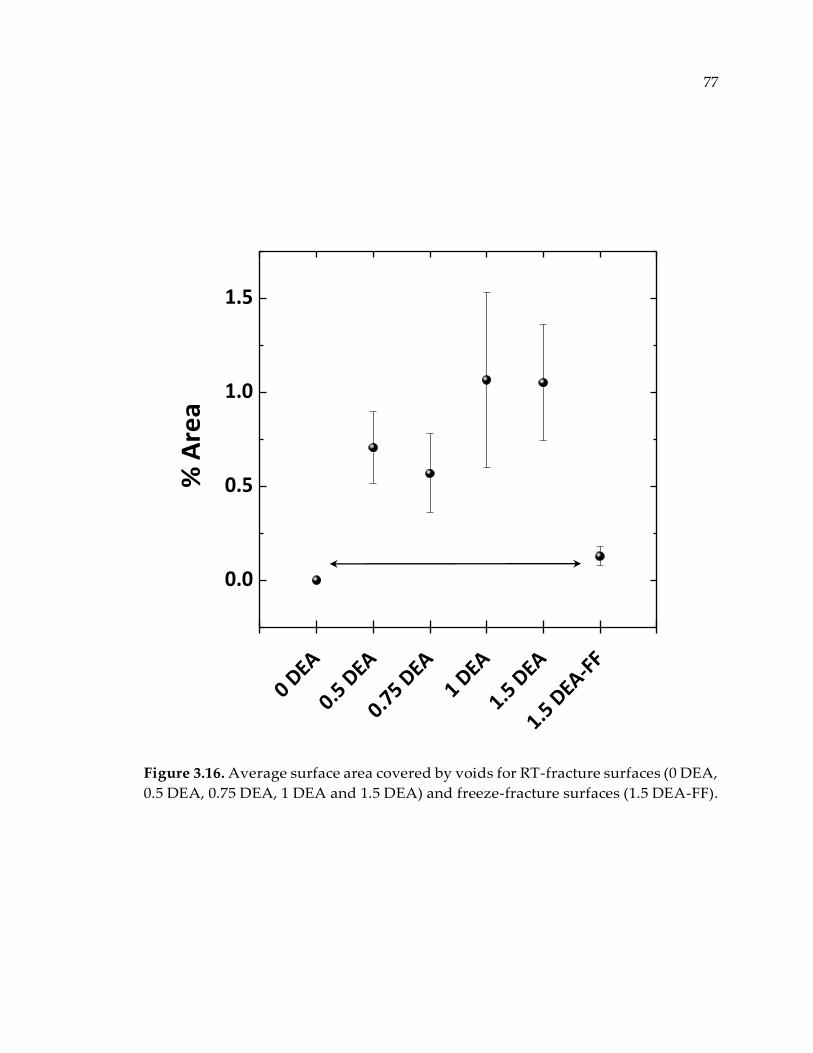
77
Figure 3.16. Average surface area covered by voids for RT-fracture surfaces (0 DEA,
0.5 DEA, 0.75 DEA, 1 DEA and 1.5 DEA) and freeze-fracture surfaces (1.5 DEA-FF).
0 DEA
0.5 D
EA
0.75 D
EA
1 DEA
1.5 D
EA
1.5 D
EA-FF
0.0
0.5
1.0
1.5
% A
rea
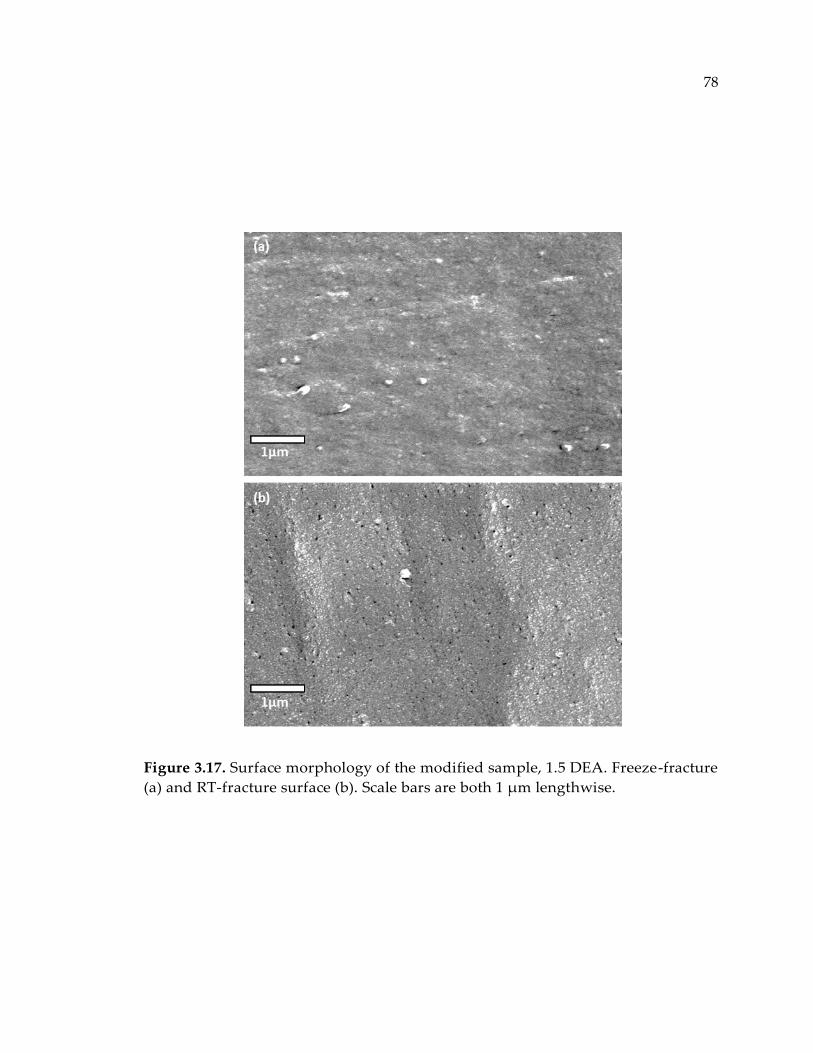
78
Figure 3.17. Surface morphology of the modified sample, 1.5 DEA. Freeze-fracture
(a) and RT-fracture surface (b). Scale bars are both 1 µm lengthwise.
79
3.3.10. Compressive Properties
The use of data from compression testing is sometimes preferred because
phenomena such as crazing and necking are suppressed.45 Therefore, to better
understand the effect of the protovoids on compressive behavior of the modified
thermosets, the response of those materials to uniaxial compressive load was
investigated. In this case true stress-strain values were utilized instead of the
engineering convention, since the dimensions of the samples greatly vary during
the test. True stress-strain values were evaluated from the engineering stress-strain
based on the following equations:46
𝜎𝑡 = 𝜎𝑒(1 + 휀𝑒) = 𝜎𝑒𝜆 (3.4)
휀𝑡 = 𝑙𝑛(1 + 휀𝑒) = 𝑙𝑛𝜆 (3.5)
Here, 𝜆 is the extension ratio which is defined by 𝜆 = 𝐿 𝐿0⁄ , 𝜎𝑡 and 휀𝑡 are the true
stress and true strain, respectively, and 𝜎𝑒 and 휀𝑒 are the corresponding engineering
values. True stress vs. (1-λ) for a typical unmodified sample, 0 DEA, and a
modified, 1.5 DEA, are shown in Figure 16.
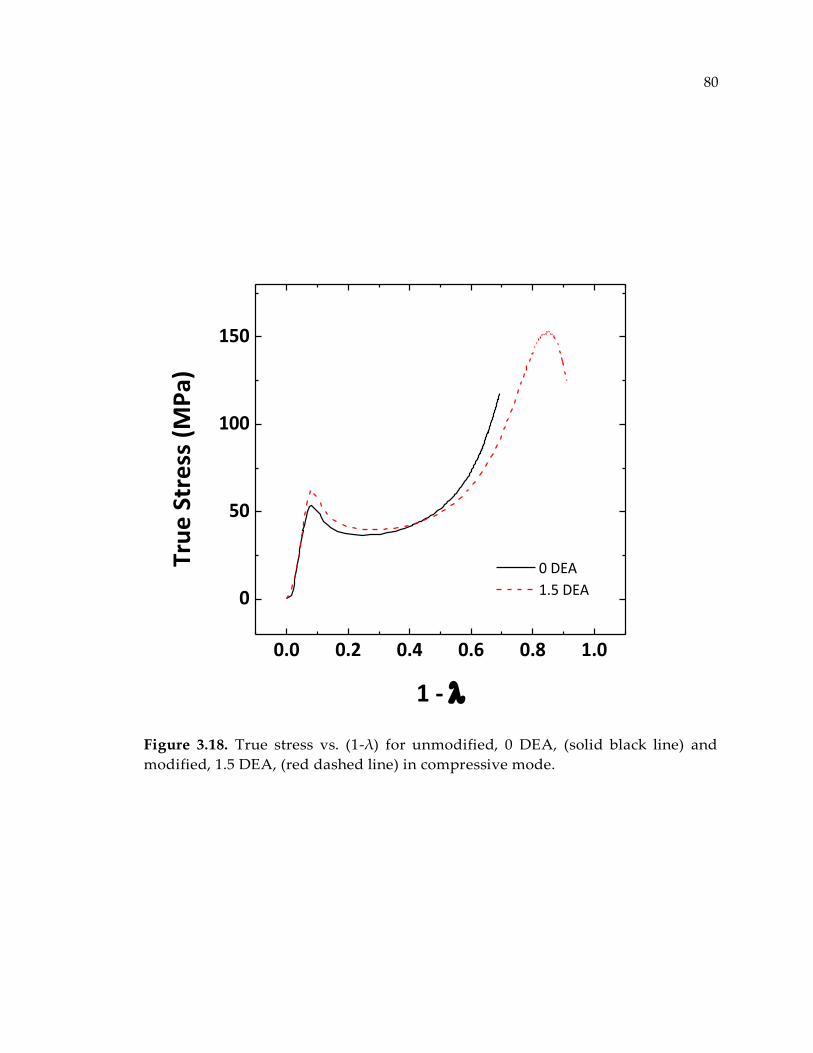
80
Figure 3.18. True stress vs. (1-λ) for unmodified, 0 DEA, (solid black line) and
modified, 1.5 DEA, (red dashed line) in compressive mode.
0.0 0.2 0.4 0.6 0.8 1.0
0
50
100
150
Tru
e S
tre
ss (
MP
a)
1 -
0 DEA
1.5 DEA
81
Values of compressive modulus (E), yield strength (σy), and compressive strength
(σr) based on true stress and strain are listed in Table 3.4. Results show no
significant statistical differences of compressive moduli, compressive strength and
compressive yield strength as a function of sample type. This suggests that induced
protovoids do not sacrifice the load bearing capacity of the network structures.
Also shown in Table 4 are is the engineering failure strain (εr) and plastic
deformation (εr- εy) for the series of samples showing that unmodified systems
possess significantly lower failure strain and plastic deformation capacity. Thus
the modified systems absorb significantly more energy before failure in a manner
consistent with the observations obtained from tensile experiments.
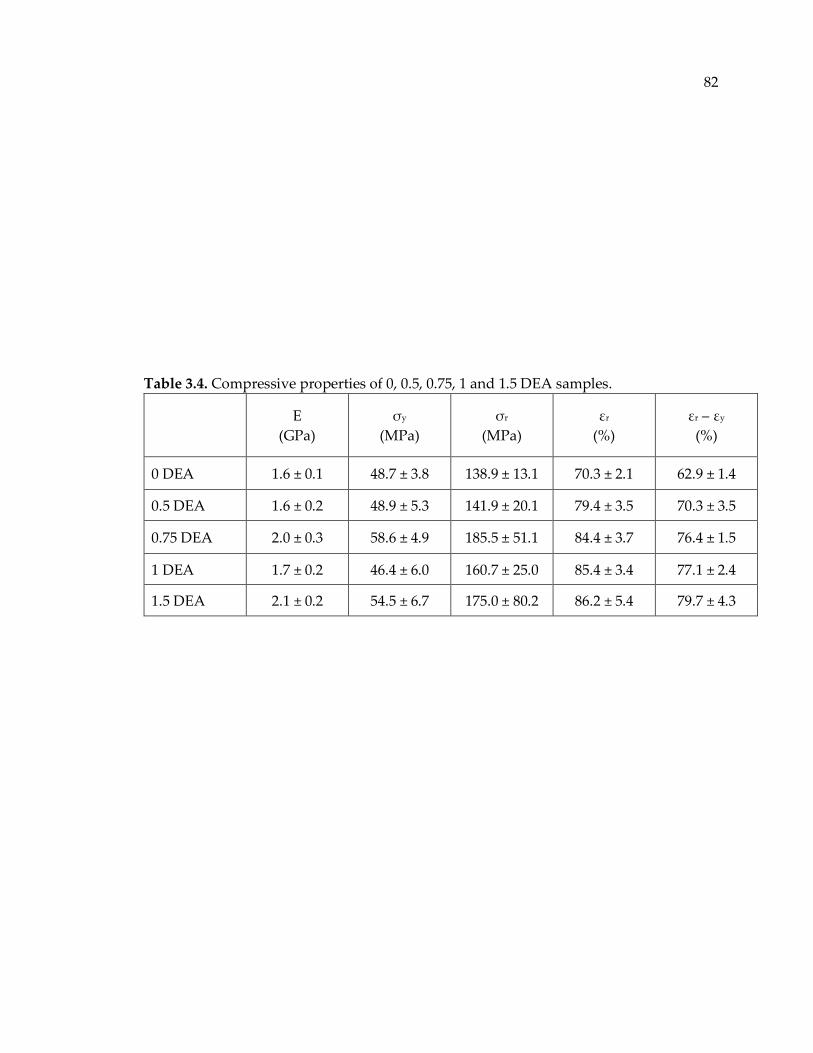
82
Table 3.4. Compressive properties of 0, 0.5, 0.75, 1 and 1.5 DEA samples.
E
(GPa)
σy
(MPa)
σr
(MPa)
εr
(%)
εr – εy
(%)
0 DEA 1.6 ± 0.1 48.7 ± 3.8 138.9 ± 13.1 70.3 ± 2.1 62.9 ± 1.4
0.5 DEA 1.6 ± 0.2 48.9 ± 5.3 141.9 ± 20.1 79.4 ± 3.5 70.3 ± 3.5
0.75 DEA 2.0 ± 0.3 58.6 ± 4.9 185.5 ± 51.1 84.4 ± 3.7 76.4 ± 1.5
1 DEA 1.7 ± 0.2 46.4 ± 6.0 160.7 ± 25.0 85.4 ± 3.4 77.1 ± 2.4
1.5 DEA 2.1 ± 0.2 54.5 ± 6.7 175.0 ± 80.2 86.2 ± 5.4 79.7 ± 4.3
83
3.4. Conclusions
More ductile crosslinked thermosets are obtained by applying a novel processing
technique termed reactive encapsulation of solvent/drying, or RESD. SEM images
from the fracture surfaces showed clear voids on the modified samples whereas
prior to tension, all modified samples had the same density, Tg, Young’s modulus
of the unmodified epoxy. Modified samples also had the same ultimate tensile
strength but much higher ductility compared to the unmodified epoxy. It was
shown using all-atom simulations that during-cure solvent species alter the
polymer network topology. The presence of distinct topological features in the
modified network is likely the origin of the large improvement in ductility.
Topology-based toughening is potentially an important step toward developing
better high performance network polymers and composites. Unlike other
toughening methods, critical mechanical and thermal properties such as Young’s
modulus, ultimate tensile strength and glass transition temperature are not
sacrificed.
3.5. List of References
1. Askeland, D. R.; Editor, The Science and Engineering of Materials, Third Edition.
Chapman & Hall: 1996; p 256 pp.
84
2. Ahmad, S.; Ashraf, S. M.; Hasnat, A. Paintindia 2002, 52, (1), 47-48, 50-52.
3. Bagheri, R.; Marouf, B. T.; Pearson, R. A. Polym. Rev. (Philadelphia, PA, U. S.)
2009, 49, 201-225.
4. Pearson, R. A.; Yee, A. F. Journal of Materials Science 1991, 26, (14), 3828-3844.
5. LeMay, J. D.; Kelley, F. N. Adv. Polym. Sci. 1986, 78, 115-48.
6. Petrie, E. M., Epoxy Adhesive Formulations. McGraw-Hill: 2006; p 535.
7. Kinloch, A., Mechanics and mechanisms of fracture of thermosetting epoxy
polymers; Epoxy Resins and Composites I. Springer Berlin / Heidelberg: 1985; Vol. 72, pp
45-67.
8. Mukherji, D.; Abrams, C. F. Physical Review E 2008, 78, (5), 050801.
9. Mukherji, D.; Abrams, C. F. Physical Review E 2009, 79, (6), 061802.
10. Brooker, R. D.; Kinloch, A. J.; Taylor, A. C. The Journal of Adhesion 2010, 86, (7),
726-741.
11. Kinloch, A. J.; Yuen, M. L.; Jenkins, S. D. J. Mater. Sci. 1994, 29, 3781-90.
12. Dusek, K.; Lednicky, F.; Lunak, S.; Mach, M.; Duskova, D. Adv. Chem. Ser. 1984,
208, 27-35.
13. Rowe, E. H.; Siebert, A. R.; Drake, R. S. Mod. Plast. 1970, 47, 110-12, 14, 116-17.
14. Bagheri, R.; Pearson, R. A. J. Mater. Sci. 1996, 31, (15), 3945-3954.
15. Choi, J.; Yee, A. F.; Laine, R. M. Macromolecules 2004, 37, (9), 3267-3276.
16. Yee, A. F.; Pearson, R. A. Journal of Materials Science 1986, 21, (7), 2462-2474.
17. Dean, J. M.; Verghese, N. E.; Pham, H. Q.; Bates, F. S. Macromolecules 2003, 36,
(25), 9267-9270.
85
18. Thompson, Z. J.; Hillmyer, M. A.; Liu, J.; Sue, H.-J.; Dettloff, M.; Bates, F. S.
Macromolecules 2009, 42, (7), 2333-2335.
19. Thio, Y. S.; Wu, J.; Bates, F. S. Macromolecules 2006, 39, (21), 7187-7189.
20. Harani, H.; Fellahi, S.; Bakar, M. Journal of applied polymer science 1999, 71, (1),
29-38.
21. Raman, V. I.; Palmese, G. R. Colloids Surf., A 2004, 241, 119-125.
22. Raman, V. I.; Palmese, G. R. Langmuir 2005, 21, 1539-1546.
23. Karad, S.; Jones, F., Moisture absorption by cyanate ester modified epoxy resin
matrices: Effect of resin structure. In Composites Technologies for 2020, Woodhead
Publishing Ltd.: University of Sydney, Australia, 2004; pp 143-148.
24. Robertson, M. B.; Ward, I. M.; Klein, P. G.; Packer, K. J. Macromolecules 1997, 30,
(22), 6893-6898.
25. Rohr, D. F.; Klein, M. T. Ind. Eng. Chem. Res. 1988, 27, 1361-6.
26. Rohr, D. F.; Klein, M. T. Ind. Eng. Chem. Res. 1990, 29, 1210-18.
27. Palmese, G. R.; McCullough, R. L. J. Appl. Polym. Sci. 1992, 46, 1863-73.
28. Raman, V. I.; Palmese, G. R. Macromolecules 2005, 38, (16), 6923-6930.
29. Lide, D. R., CRC handbook of chemistry and physics. CRC press: 2012.
30. Mijovic, J.; Andjelic, S. Macromolecules 1995, 28, (8), 2787-2796.
31. Wang, J.; Wang, W.; Kollman, P. A.; Case, D. A. J. Mol. Graphics Modell. 2006, 25,
(2), 247-260.
32. Wang, J.; Wolf, R. M.; Caldwell, J. W.; Kollman, P. A.; Case, D. A. J. Comput. Chem.
2004, 25, (9), 1157-1174.
33. Plimpton, S. J. Comput. Phys. 1995, 117, (1), 1-19.
86
34. Khare, K. S.; Khare, R. Macromol. Theory Simul. 2012, 21, (5), 322-327.
35. Dijkstra, E. W. Numerische mathematik 1959, 1, (1), 269-271.
36. Jang, C.; Sharifi, M.; Abrams, C. F.; Palmese, G. R. Polymer 2014, 55, (16), 3859-
3868.
37. Marks, M. J.; Verghese, N. E.; Hrovat, K. J.; Laboy-Bollinger, A.; Buck, J. C.; Rabon,
J. A., Jr.; O'Connell, C. L.; Allen, L. J. Polym. Sci., Part B: Polym. Phys. 2008, 46, (15), 1632-
1640.
38. Nielsen, L. E., Mechanical Properties of Polymers and Composites, Vol. 1. Dekker:
1974; p 255 pp.
39. Mark, J. Chem. Ind. (London, U. K.) 2007, 29-30.
40. Macosko, C. W.; Miller, D. R. Macromolecules 1976, 9, (2), 199-206.
41. DiBenedetto, A. T. J. Polym. Sci., Part B: Polym. Phys. 1987, 25, (9), 1949-69.
42. Nielsen, L. E. J. Macromol. Sci., Rev. Macromol. Chem. 1969, 3, (1), 69-103.
43. Pascault, J. P.; Williams, R. J. J. Polym. Bull. (Berlin) 1990, 24, (1), 115-21.
44. Anderson, T. L.; Editor, Fracture Mechanics: Fundamentals and Applications;
Third Edition. CRC Press: 2005; p 640 pp.
45. van Melick, H. G. H.; Govaert, L. E.; Meijer, H. E. H. Polymer 2003, 44, (12), 3579-
3591.
46. Roylance, D. Massachusetts Institute of Technology study, Cambridge 2001.
87
Chapter 4. Porous Polymer Network Structures; Synthesis and
Characterization
4.1. Introduction
In the previous Chapter it was shown that the behavioral characteristics of epoxy
thermosets can be linked to the molecular structure and topology of the polymer
networks.1, 2 Other studies have shown that many of the excellent properties of
epoxy materials are due to their densely crosslinked nature.3, 4 One fundamental
parameter used to quantify polymer network structure is the molecular weight
between crosslinks, 𝑀𝑐 .5, 6 Among techniques used to elucidate 𝑀𝑐 , the two well-
defined methods are those based on equilibrium swelling theory,7 and rubber-
elasticity theory.8, 9 Equilibrium swelling theory, which will be discussed in this
Chapter, was introduced by Frenkel.10 It was later investigated and established by
Flory-Rehner11, 12 and was further developed by Dusek,13, 14 and Bray-Merrill.15 The
classical equilibrium swelling theory is extensively used to characterize the
network structure of the hydrogels prepared in water,16, 17 or the systems that are
free-radical crosslinked.
88
Although the equilibrium swelling technique is a very reliable method to measure
values of molecular weight between crosslinks for dense polymer network
structures or for those prepared in moderately dilute environments, our
experimental results show that crosslinked gels that are formed in very dilute
solutions, such as the ones studied by Raman et al.,18 have 𝑀𝑐 values, measured via
equilibrium swelling, that deviate from those of the dense polymer networks.
The principal objective of the study in this Chapter is to employ equilibrium
swelling to investigate and characterize the network structure of crosslinked
polymers that are formed/cured in dilute environments, i.e. in presence of excess
inert solvent during cure. Experimental studies revealed that highly nanoporous
structures are obtained when the during-cure solvent is removed from the polymer
networks via supercritical extraction/drying.18
The well-known Dusek equation was used in this study to calculate the 𝑀𝑐 values
of polymer networks that are formed over a range of solvent inclusion. The
measured 𝑀𝑐 values were compared to the glass transition temperature of
corresponding dried gels. It was observed that, at high solvent contents, 𝑀𝑐 and Tg
values do not fit the well-known Fox and Loshaek equation. It was shown that the
discrepancy can be resolved by adjusting the Dusek equation via incorporation of
a factor that allows the equation to be applicable for highly nanoporous crosslinked
89
polymer structures. The adjusted values of molecular weight between crosslinks
for a series of supercritically dried epoxy polymers were determined via the
modified equation and the results compared to the corresponding Tg values. It was
shown that for the gels that are formed in very dilute environments, the
modification to the Dusek equation provides 𝑀𝑐 values that are consistent with Tg
behavior obtained via the Fox and Loshaek equation. This was not the case when
the non-adjusted values of 𝑀𝑐 were used.
4.2. Experimental
4.2.1. Materials
DGEBA (Miller-Stephenson) of three different molecular weights (EPON-828,
EPON-836, and EPON-1001F) was used as the epoxy resin. A cycloaliphatic tetra-
functional diamine, 4,4’-methylenebiscyclohexanamine, (PACM, Air Products) was
used as the curing agent, and ultrapure tetrahydrofuran, THF (Sigma-Aldrich), was
used as the inert solvent. Table 4.1 lists the chemical structures of the materials
used in this study and their average molecular weights.
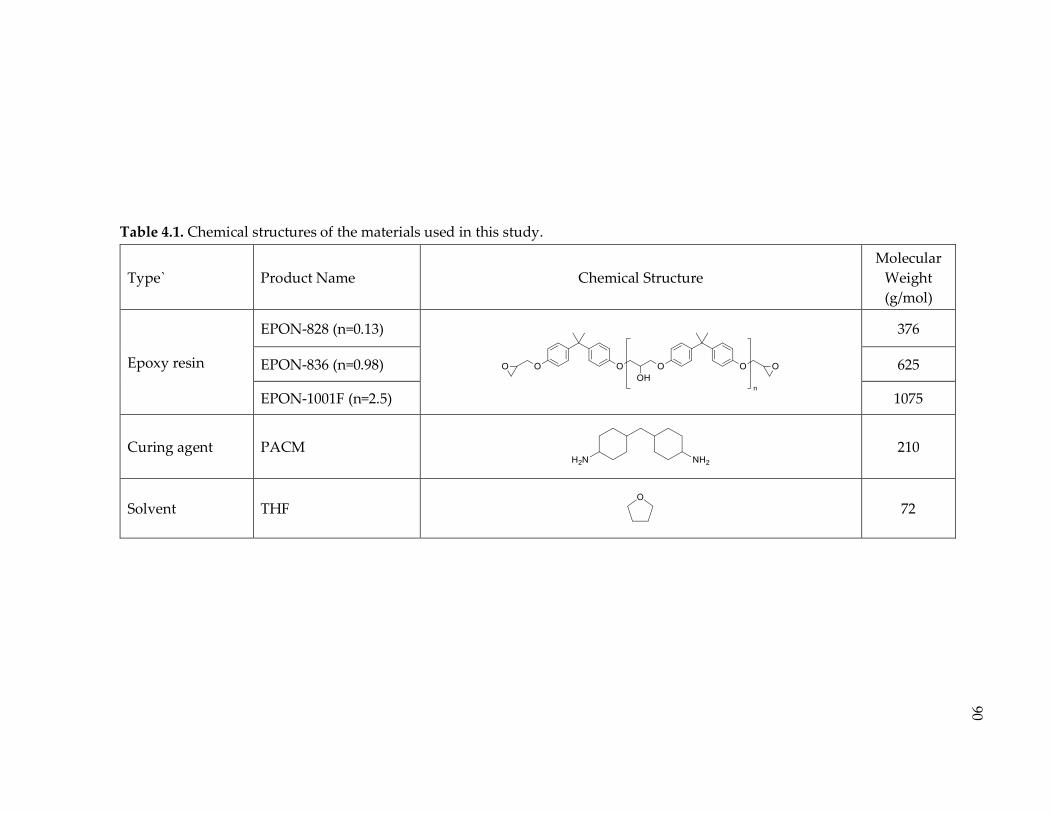
Table 4.1. Chemical structures of the materials used in this study.
Type` Product Name Chemical Structure
Molecular
Weight
(g/mol)
Epoxy resin
EPON-828 (n=0.13)
376
EPON-836 (n=0.98) 625
EPON-1001F (n=2.5) 1075
Curing agent PACM
210
Solvent THF
72
90
91
4.2.2. Sample Preparation
The purity of the DGEBA resins was confirmed by GPC. PACM was used as
received. Stoichiometric amount of epoxy resin and the curing agent (2:1 molar
ratio), were mixed with specific amounts of the solvent (THF) in a Thinky mixer
until a clear transparent liquid was obtained. In order to reduce the amount of THF
evaporation, the screw threads were lined with non-adhesive Teflon® tape before
closing the vial. Sample batches were delineated by THF to Epoxy-Amine resin
weight ratio. For instance, a “1 TEA” sample has an equal weight of solvent to resin
monomers and so has 50% solvent by weight. Batches with TEA’s of 0, 0.2, 0.5, 1,
1.5, 2, 3, 4, 6, and 8 were produced for systems made from EPON-828 and EPON-
836. Batches with TEA’s of 0, 0.2, 0.5, 1, 1.5, 2, 3, and 4 were prepared for the
systems composed of EPON-1001F.
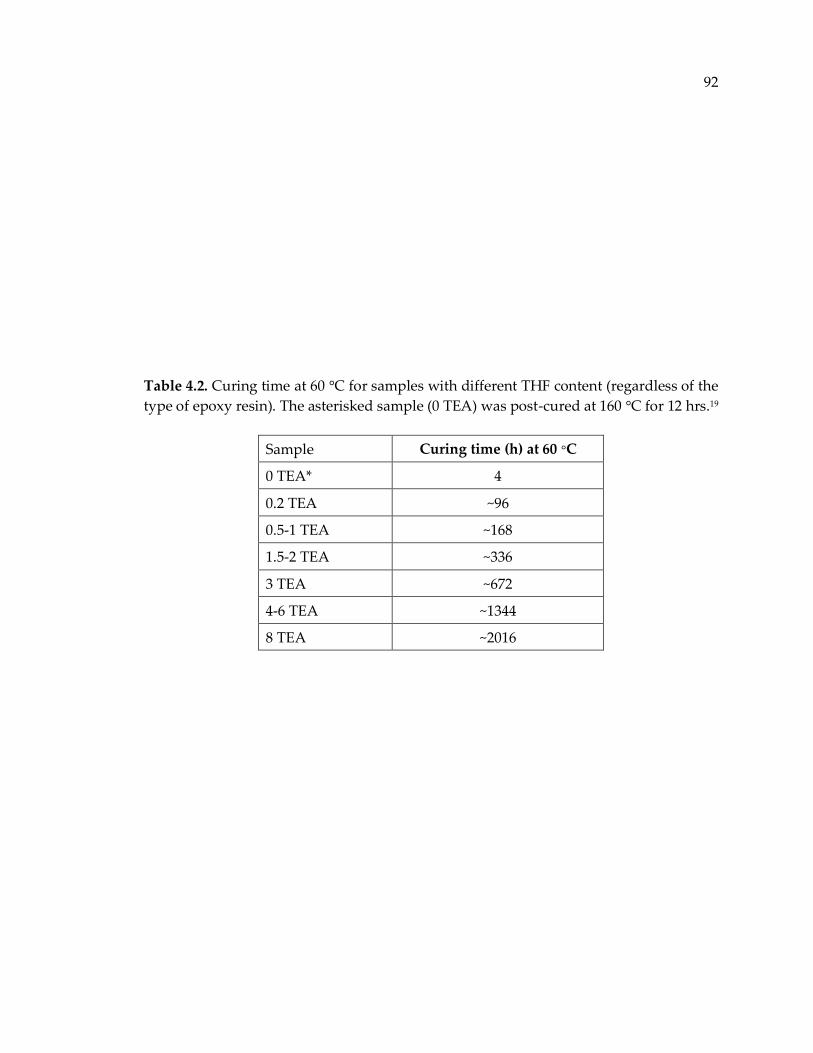
92
Table 4.2. Curing time at 60 °C for samples with different THF content (regardless of the
type of epoxy resin). The asterisked sample (0 TEA) was post-cured at 160 °C for 12 hrs.19
Sample Curing time (h) at 60 °C
0 TEA* 4
0.2 TEA ~96
0.5-1 TEA ~168
1.5-2 TEA ~336
3 TEA ~672
4-6 TEA ~1344
8 TEA ~2016
93
4.2.3. Curing
The mixtures were placed at 60 °C ± 1 °C for sufficient time to attain close to full
conversion in the presence of the inert solvent. Conversion was monitored by
tracking the FTIR absorbance peak (in the near IR region) associated with oxirane
bands at 4530 cm-1, and the peak associated with N-H bands at 5056 cm-1 and 6510
cm-1.20, 21 To ensure fully reacted systems were obtained at the curing temperature,
the samples were kept at the curing conditions for the durations as listed in Table
4.2. FTIR spectra of the specimens after cure did not show the existence of the peaks
attributed to epoxy and amine bands, suggesting the complete conversion. The
batches composed of EPON-1001F at very high THF contents (6 TEA and 8 TEA)
never gelled at the curing temperature of 60 °C, and thus they were excluded from
further analysis.
4.2.4. Equilibrium Swelling Experiment
Once fully reacted gels were prepared, equilibrium swelling experiments were
conducted by weighing a small cut of each gel, 𝑊𝑟 , and immersing it in a vial
containing THF. The vials were capped and maintained at 60 °C for two days and
94
subsequently at room temperature for one week. The mass uptake was recorded
until an equilibrium weight was achieved.
4.2.5. Supercritical Solvent Extraction
Supercritical drying procedure was conducted using a SPI-DRYTM CPD
Supercritical Fluid Extraction System. The apparatus consists of a chamber where
liquid CO2 can be stored. The temperature of the whole system can be controlled
by immersing the entire pressurized system in a water bath. Wet samples, prepared
in presence of solvent, were immediately placed inside the chamber, and then the
chamber was filled with liquid CO2 until the sample was entirely immersed in
liquid CO2, allowing the THF to be replaced by CO2. Samples remained in liquid
CO2 for sufficient time to allow the solvent exchange process to be completed, and
then the chamber was refilled with fresh liquid CO2. The chamber was maintained
at 5-10 °C during this step. The solvent exchange process was repeated three to
four times. The chamber temperature was raised above the supercritical
temperature of CO2, (31.1 °C). Supercritical CO2 was then gradually vented. Once
all CO2 was exhausted, dried samples were obtained.
95
4.2.6. Differential Scanning Calorimetry
A Perkin Elmer Differential Scanning Calorimeter model DSC-7 was used to
measure glass transition temperature. All samples were tested through a
heat/cool/heat cycle for 3 cycles, in the temperature range of 30 °C to 200 °C with a
scanning rate of 10 °C/min. Values of glass transition temperature were measured
from the second order transition (the inflection point) in the third cycle. The DSC
thermographs are shown in Appendix B.
4.3. Results and Discussion
4.3.1. Equilibrium Swelling Analysis
A swelling test was performed on wet samples to measure the value of molecular
weight between crosslinks based on the Dusek swelling theory. First, the
equilibrium volume fraction of each phase, solvent (THF), phase 1, and polymer
network (PN), phase 2, was measured in the relaxed state (immediately after
crosslinking but before swelling) as follows:
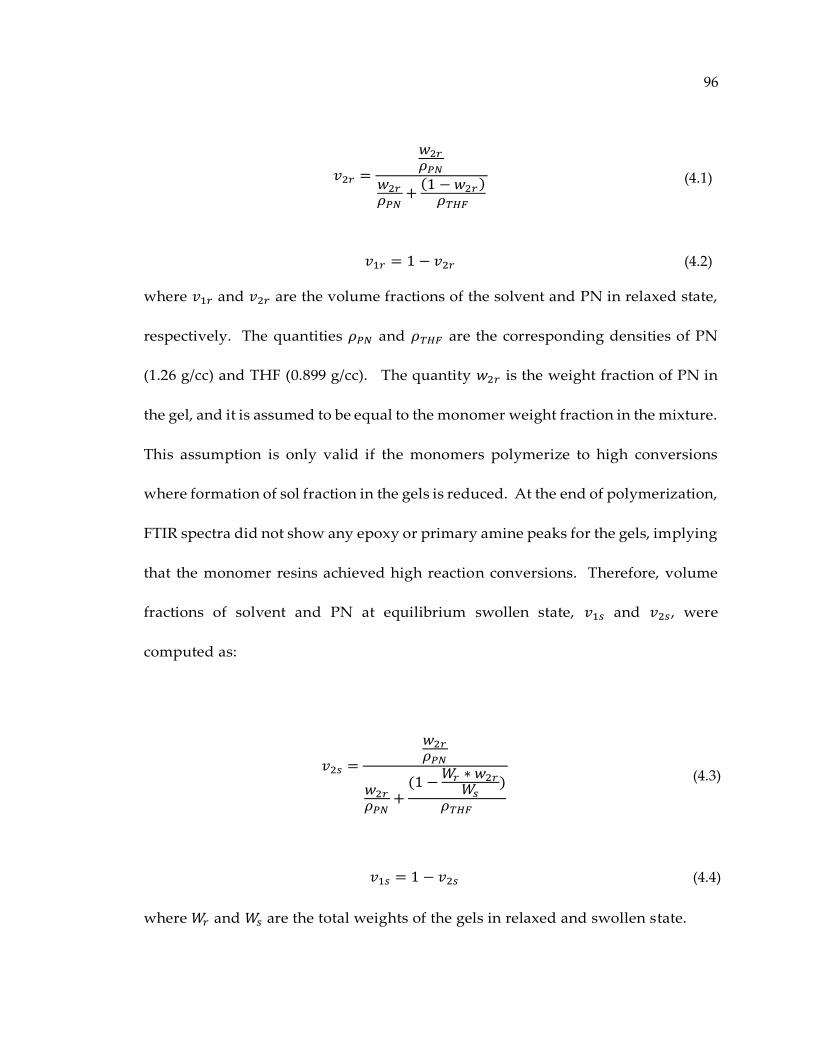
96
𝑣2𝑟 =
𝑤2𝑟𝜌𝑃𝑁
𝑤2𝑟𝜌𝑃𝑁
+(1 − 𝑤2𝑟 )
𝜌𝑇𝐻𝐹
(4.1)
𝑣1𝑟 = 1 − 𝑣2𝑟 (4.2)
where 𝑣1𝑟 and 𝑣2𝑟 are the volume fractions of the solvent and PN in relaxed state,
respectively. The quantities 𝜌𝑃𝑁 and 𝜌𝑇𝐻𝐹 are the corresponding densities of PN
(1.26 g/cc) and THF (0.899 g/cc). The quantity 𝑤2𝑟 is the weight fraction of PN in
the gel, and it is assumed to be equal to the monomer weight fraction in the mixture.
This assumption is only valid if the monomers polymerize to high conversions
where formation of sol fraction in the gels is reduced. At the end of polymerization,
FTIR spectra did not show any epoxy or primary amine peaks for the gels, implying
that the monomer resins achieved high reaction conversions. Therefore, volume
fractions of solvent and PN at equilibrium swollen state, 𝑣1𝑠 and 𝑣2𝑠, were
computed as:
𝑣2𝑠 =
𝑤2𝑟𝜌𝑃𝑁
𝑤2𝑟𝜌𝑃𝑁
+(1 −
𝑊𝑟 ∗ 𝑤2𝑟𝑊𝑠
)
𝜌𝑇𝐻𝐹
(4.3)
𝑣1𝑠 = 1 − 𝑣2𝑠 (4.4)
where 𝑊𝑟 and 𝑊𝑠 are the total weights of the gels in relaxed and swollen state.

97
At least three experiments were conducted for each system, and the average values
of 𝑣1𝑟 , 𝑣2𝑟 , 𝑣1𝑠, and 𝑣2𝑠 are reported in Table 4.3.22
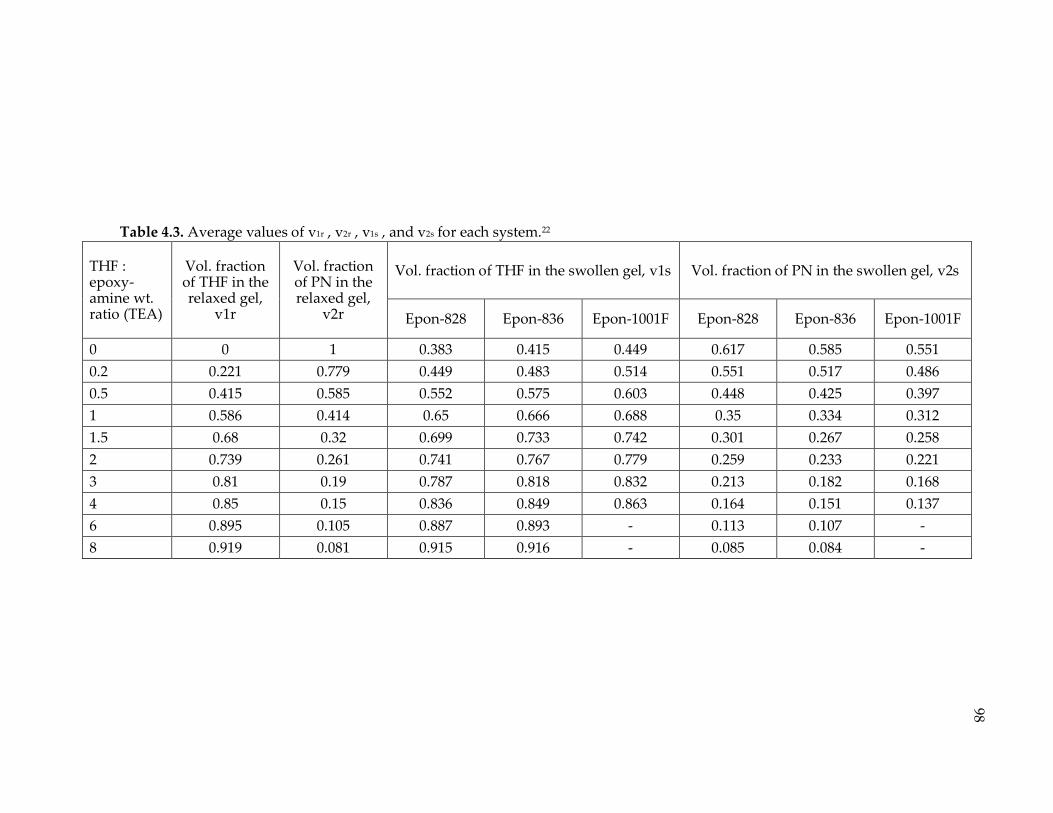
Table 4.3. Average values of v1r , v2r , v1s , and v2s for each system.22
THF : epoxy-amine wt. ratio (TEA)
Vol. fraction of THF in the relaxed gel,
v1r
Vol. fraction of PN in the relaxed gel,
v2r
Vol. fraction of THF in the swollen gel, v1s Vol. fraction of PN in the swollen gel, v2s
Epon-828 Epon-836 Epon-1001F Epon-828 Epon-836 Epon-1001F
0 0 1 0.383 0.415 0.449 0.617 0.585 0.551
0.2 0.221 0.779 0.449 0.483 0.514 0.551 0.517 0.486
0.5 0.415 0.585 0.552 0.575 0.603 0.448 0.425 0.397
1 0.586 0.414 0.65 0.666 0.688 0.35 0.334 0.312
1.5 0.68 0.32 0.699 0.733 0.742 0.301 0.267 0.258
2 0.739 0.261 0.741 0.767 0.779 0.259 0.233 0.221
3 0.81 0.19 0.787 0.818 0.832 0.213 0.182 0.168
4 0.85 0.15 0.836 0.849 0.863 0.164 0.151 0.137
6 0.895 0.105 0.887 0.893 - 0.113 0.107 -
8 0.919 0.081 0.915 0.916 - 0.085 0.084 -
98
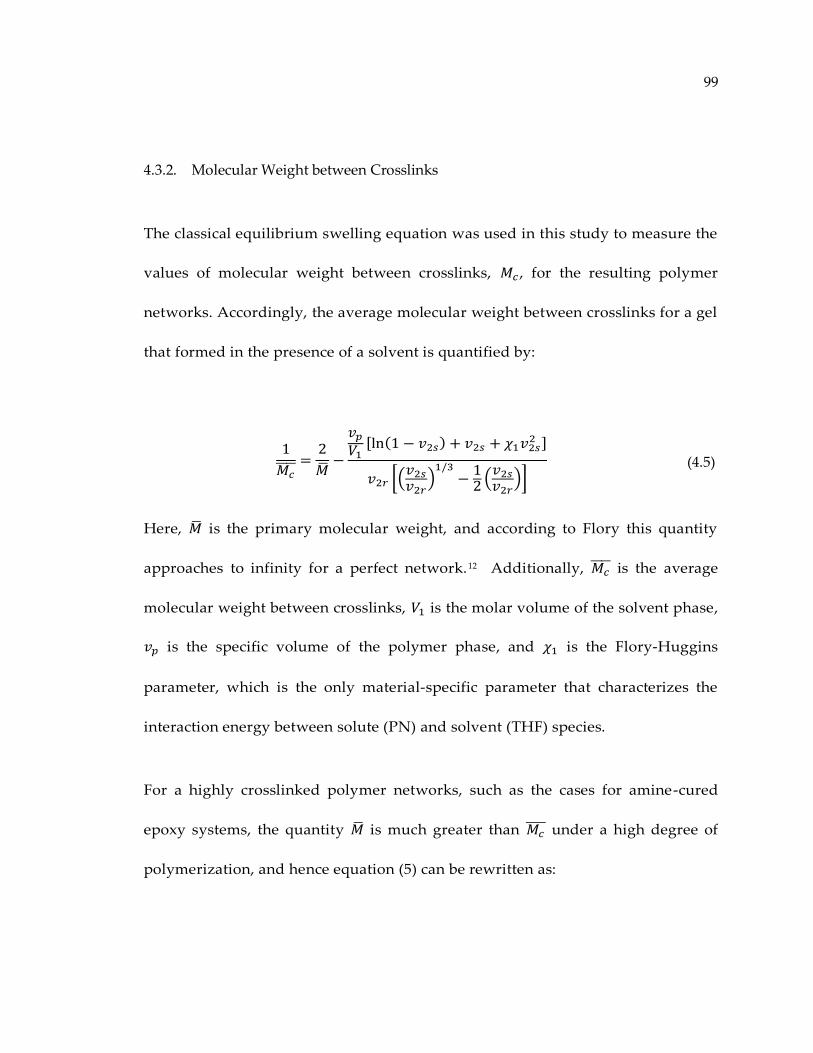
99
4.3.2. Molecular Weight between Crosslinks
The classical equilibrium swelling equation was used in this study to measure the
values of molecular weight between crosslinks, 𝑀𝑐 , for the resulting polymer
networks. Accordingly, the average molecular weight between crosslinks for a gel
that formed in the presence of a solvent is quantified by:
1
𝑀𝑐 =
2
��−
𝑣𝑝
𝑉1[ln(1 − 𝑣2𝑠) + 𝑣2𝑠 + 𝜒1𝑣2𝑠
2 ]
𝑣2𝑟 [(𝑣2𝑠
𝑣2𝑟)
1/3−
12
(𝑣2𝑠
𝑣2𝑟)]
(4.5)
Here, �� is the primary molecular weight, and according to Flory this quantity
approaches to infinity for a perfect network.12 Additionally, 𝑀𝑐 is the average
molecular weight between crosslinks, 𝑉1 is the molar volume of the solvent phase,
𝑣𝑝 is the specific volume of the polymer phase, and 𝜒1 is the Flory-Huggins
parameter, which is the only material-specific parameter that characterizes the
interaction energy between solute (PN) and solvent (THF) species.
For a highly crosslinked polymer networks, such as the cases for amine-cured
epoxy systems, the quantity �� is much greater than 𝑀𝑐 under a high degree of
polymerization, and hence equation (5) can be rewritten as:
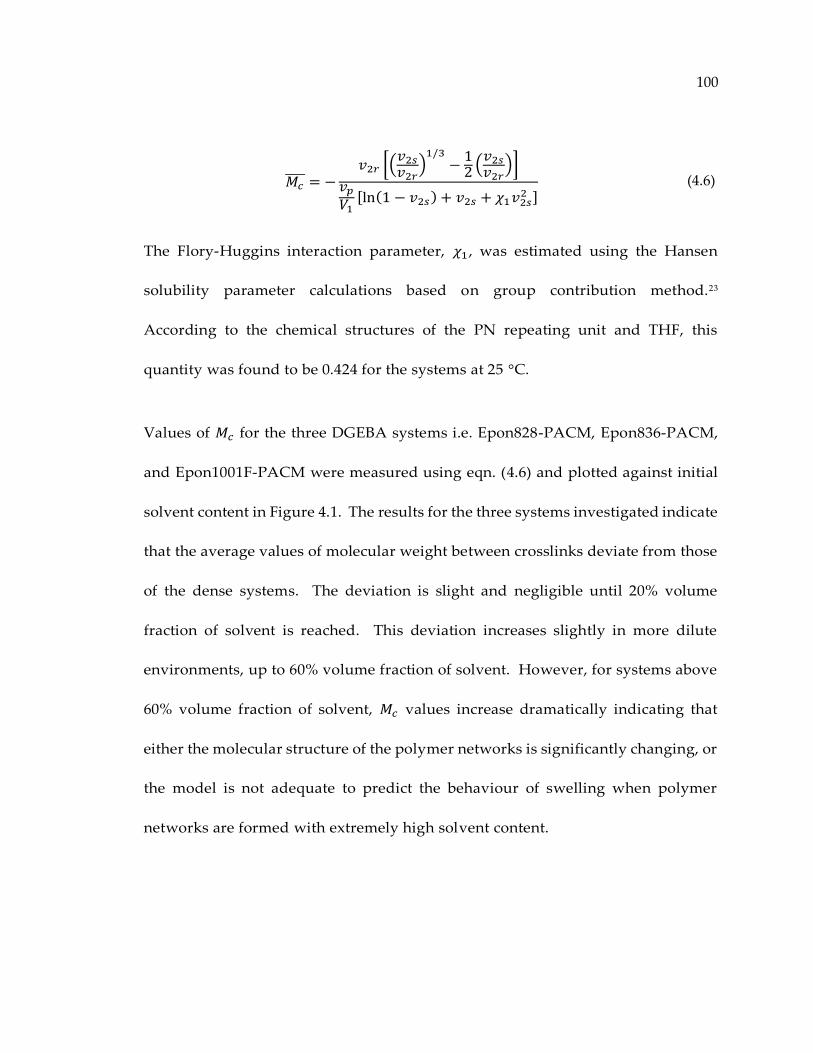
100
𝑀𝑐 = −
𝑣2𝑟 [(𝑣2𝑠
𝑣2𝑟)
1/3−
12
(𝑣2𝑠
𝑣2𝑟)]
𝑣𝑝
𝑉1[ln(1 − 𝑣2𝑠) + 𝑣2𝑠 + 𝜒1𝑣2𝑠
2 ] (4.6)
The Flory-Huggins interaction parameter, 𝜒1 , was estimated using the Hansen
solubility parameter calculations based on group contribution method.23
According to the chemical structures of the PN repeating unit and THF, this
quantity was found to be 0.424 for the systems at 25 °C.
Values of 𝑀𝑐 for the three DGEBA systems i.e. Epon828-PACM, Epon836-PACM,
and Epon1001F-PACM were measured using eqn. (4.6) and plotted against initial
solvent content in Figure 4.1. The results for the three systems investigated indicate
that the average values of molecular weight between crosslinks deviate from those
of the dense systems. The deviation is slight and negligible until 20% volume
fraction of solvent is reached. This deviation increases slightly in more dilute
environments, up to 60% volume fraction of solvent. However, for systems above
60% volume fraction of solvent, 𝑀𝑐 values increase dramatically indicating that
either the molecular structure of the polymer networks is significantly changing, or
the model is not adequate to predict the behaviour of swelling when polymer
networks are formed with extremely high solvent content.
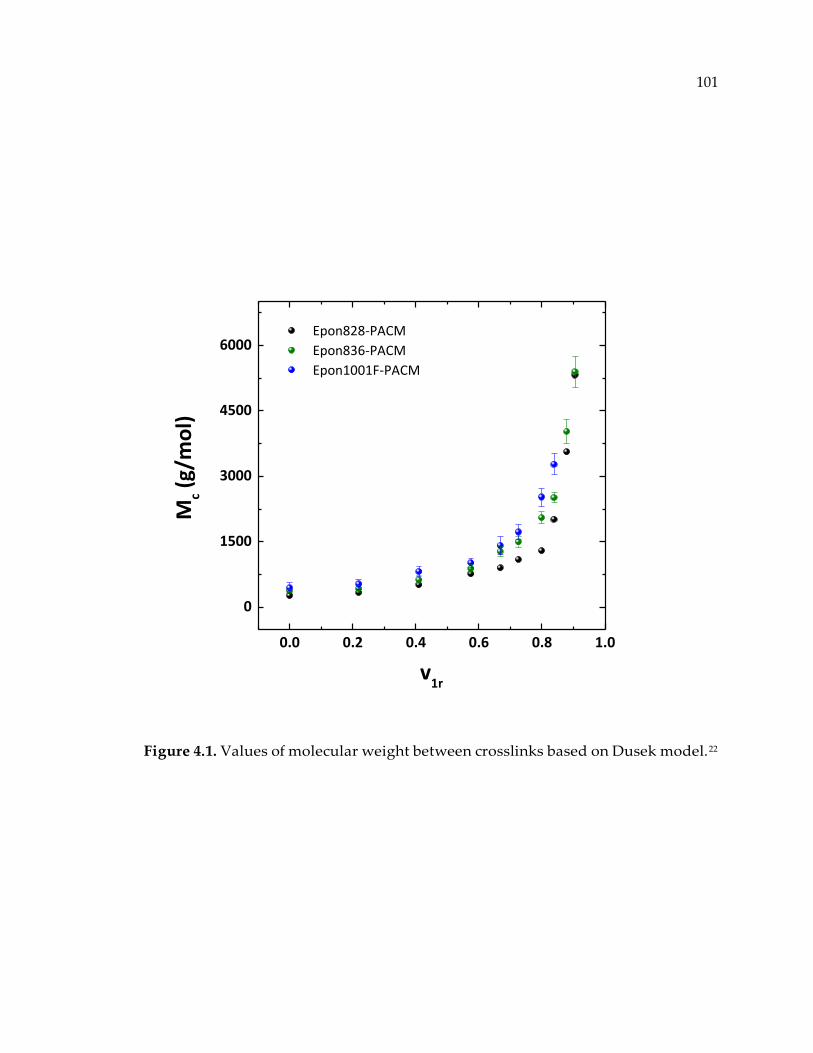
101
Figure 4.1. Values of molecular weight between crosslinks based on Dusek model.22
0.0 0.2 0.4 0.6 0.8 1.0
0
1500
3000
4500
6000 Epon828-PACM
Epon836-PACM
Epon1001F-PACM
Mc (
g/m
ol)
v1r
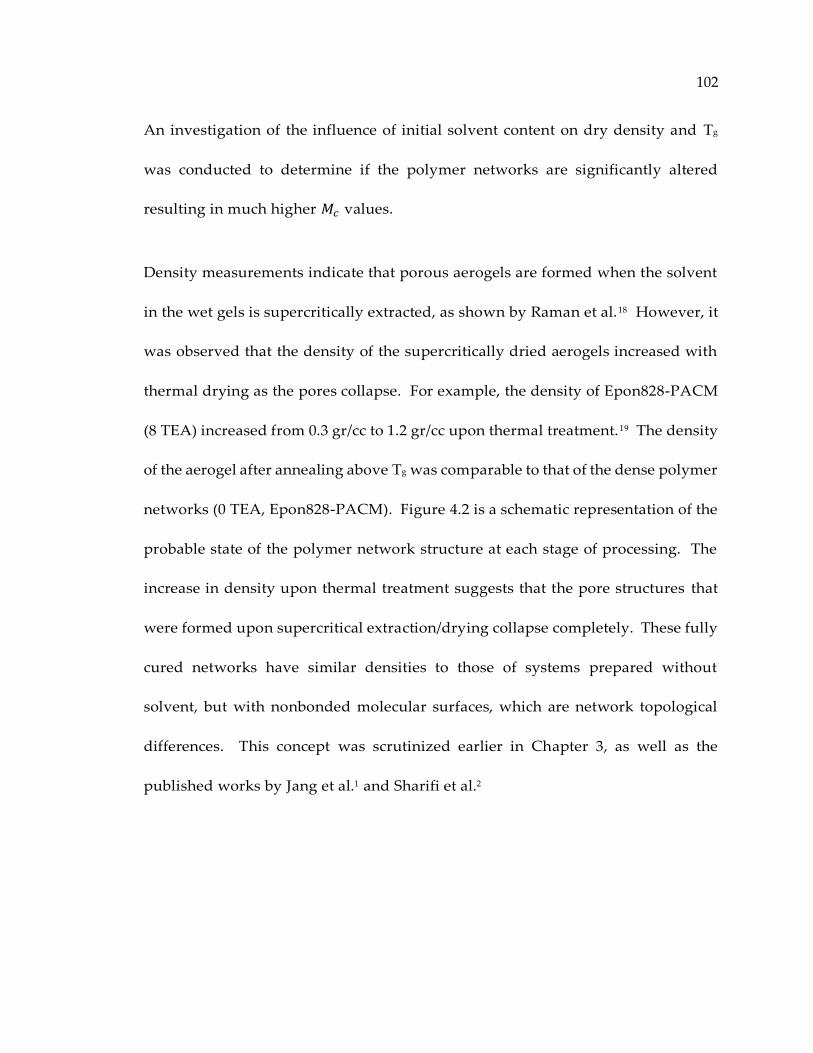
102
An investigation of the influence of initial solvent content on dry density and Tg
was conducted to determine if the polymer networks are significantly altered
resulting in much higher 𝑀𝑐 values.
Density measurements indicate that porous aerogels are formed when the solvent
in the wet gels is supercritically extracted, as shown by Raman et al.18 However, it
was observed that the density of the supercritically dried aerogels increased with
thermal drying as the pores collapse. For example, the density of Epon828-PACM
(8 TEA) increased from 0.3 gr/cc to 1.2 gr/cc upon thermal treatment.19 The density
of the aerogel after annealing above Tg was comparable to that of the dense polymer
networks (0 TEA, Epon828-PACM). Figure 4.2 is a schematic representation of the
probable state of the polymer network structure at each stage of processing. The
increase in density upon thermal treatment suggests that the pore structures that
were formed upon supercritical extraction/drying collapse completely. These fully
cured networks have similar densities to those of systems prepared without
solvent, but with nonbonded molecular surfaces, which are network topological
differences. This concept was scrutinized earlier in Chapter 3, as well as the
published works by Jang et al.1 and Sharifi et al.2
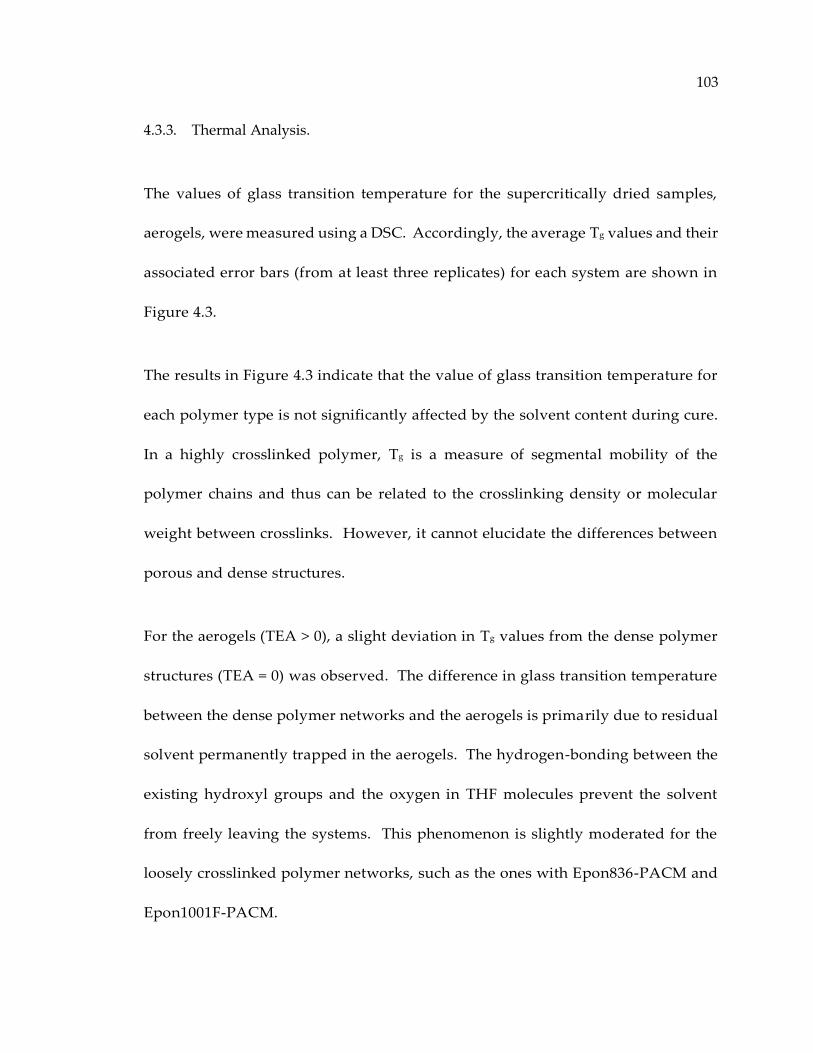
103
4.3.3. Thermal Analysis.
The values of glass transition temperature for the supercritically dried samples,
aerogels, were measured using a DSC. Accordingly, the average Tg values and their
associated error bars (from at least three replicates) for each system are shown in
Figure 4.3.
The results in Figure 4.3 indicate that the value of glass transition temperature for
each polymer type is not significantly affected by the solvent content during cure.
In a highly crosslinked polymer, Tg is a measure of segmental mobility of the
polymer chains and thus can be related to the crosslinking density or molecular
weight between crosslinks. However, it cannot elucidate the differences between
porous and dense structures.
For the aerogels (TEA > 0), a slight deviation in Tg values from the dense polymer
structures (TEA = 0) was observed. The difference in glass transition temperature
between the dense polymer networks and the aerogels is primarily due to residual
solvent permanently trapped in the aerogels. The hydrogen-bonding between the
existing hydroxyl groups and the oxygen in THF molecules prevent the solvent
from freely leaving the systems. This phenomenon is slightly moderated for the
loosely crosslinked polymer networks, such as the ones with Epon836-PACM and
Epon1001F-PACM.
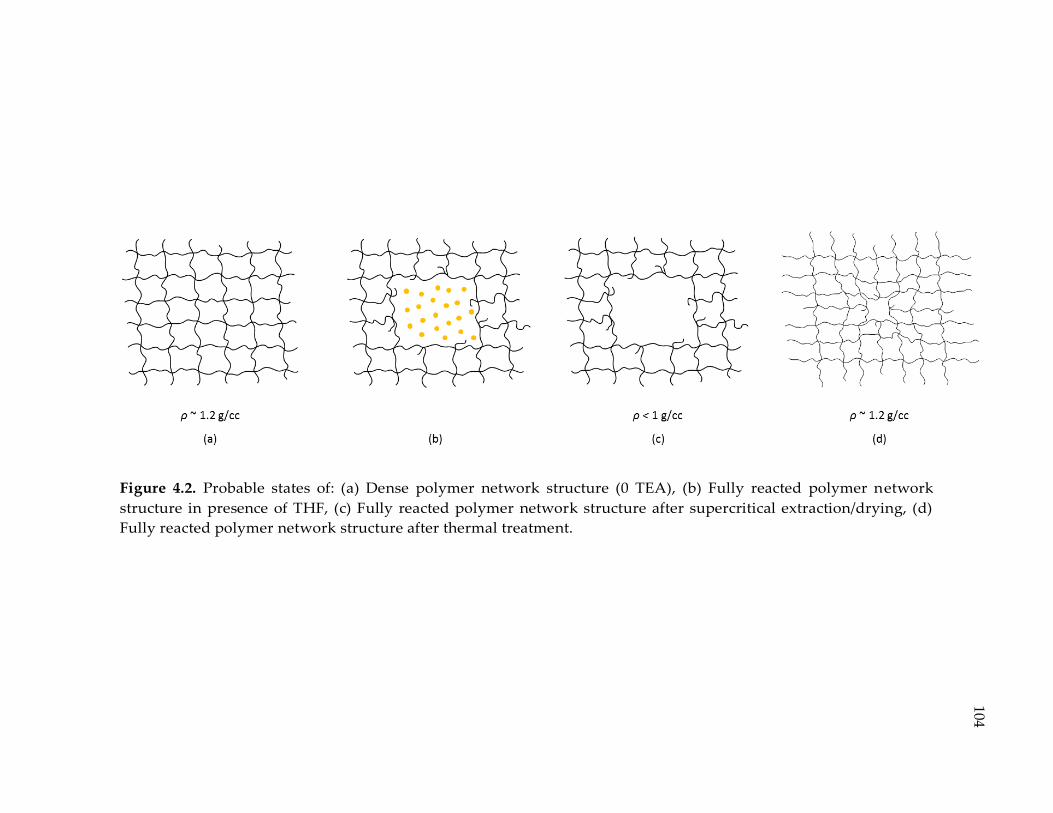
Figure 4.2. Probable states of: (a) Dense polymer network structure (0 TEA), (b) Fully reacted polymer network
structure in presence of THF, (c) Fully reacted polymer network structure after supercritical extraction/drying, (d)
Fully reacted polymer network structure after thermal treatment.
104
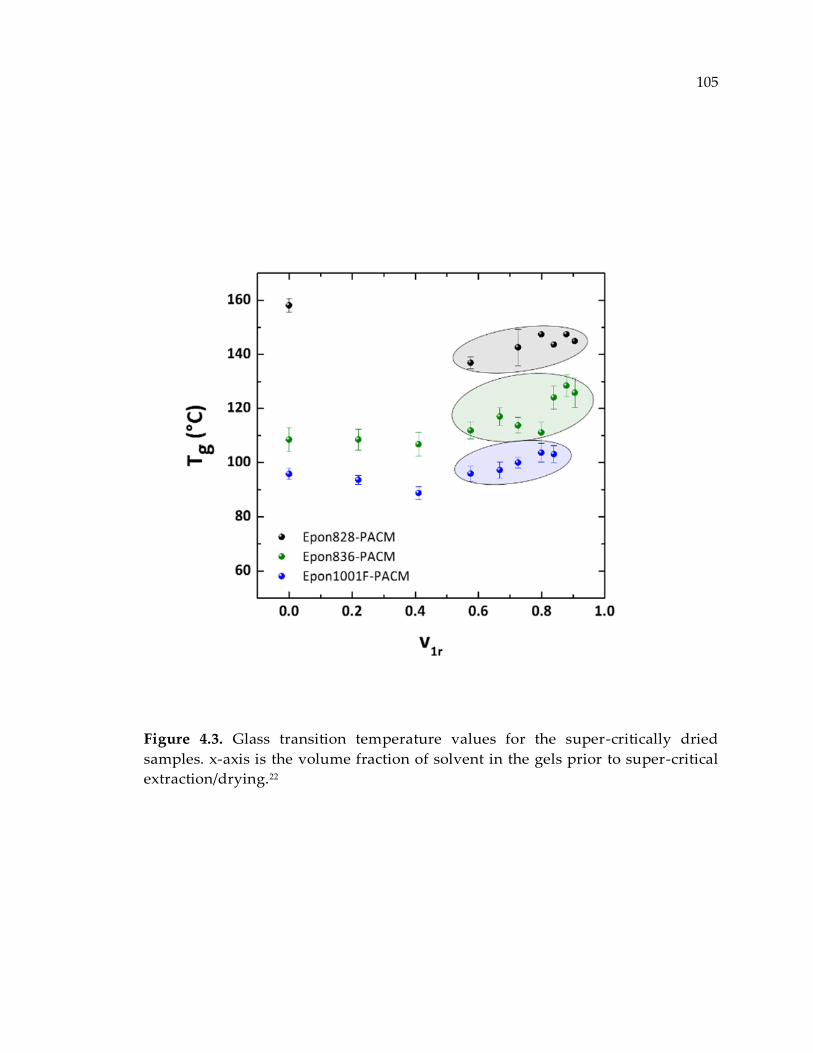
105
Figure 4.3. Glass transition temperature values for the super-critically dried
samples. x-axis is the volume fraction of solvent in the gels prior to super-critical
extraction/drying.22
106
As discussed, the aerogels that are cured with higher solvent inclusion form
polymer network structures with higher porosity. The increased porosity facilitates
the residual solvent species leaving the system in first DSC heating cycle. This
might be the reason for the apparent increase in Tg values for all the systems at 𝑣1𝑟
above 0.6. This increase in Tg is highlighted in Figure 4.3.
There is a clear difference in average Tg values for each system due to molecular
size of the resin. In accordance with the Fox and Loshaek equation,24 thermosets
made from resins with larger molecular weight typically have lower crosslinking
density. Under such conditions, the local mobility of polymer chains is higher, and
thus Tg values are lower for the crosslinked systems.
Generally, for highly crosslinked polymers, glass transition temperature is related
to the molecular size entrapped between crosslinks as expressed by the Fox and
Loshaek equation:24
𝑇𝑔 = 𝑇𝑔∞ +𝜉
𝑀𝑐 (4.7)
Here, 𝑇𝑔∞ is the glass transition temperature of the elastic chain backbone at infinite
molecular weight, and 𝜉 is proportional to the molecular weight of the monomer
resins and the molar ratio of the epoxy resin to the curing agent.25 In this study,
both 𝑇𝑔∞ and 𝜉 are unique and constant for each of the systems. For a crosslinked
107
polymer, this equation states that the higher the molecular size between crosslinks,
the lower the Tg should be.
Figure 4.4 shows the glass transition temperature vs. molecular weight between
crosslinks, 𝑀𝑐 , predicted by Dusek model. The results indicate that, for the three
systems, Tg values are insensitive to the molecular weight between crosslinks. This
is not in accordance with the predicted behavior illustrated by the Fox and Loshaek
equation described above. This discrepancy suggests that the Dusek equation is
inadequate for measuring the Mc values of crosslinked epoxy polymers formed in
highly dilute environments.
4.3.4. Modification to the Dusek model
Dusek described polymer network structures based on Flory’s description of
crosslinked systems.12 Flory visualized polymer networks as meshes that are
characterized by their number of elastic chains (𝜐). As discussed earlier, the model
does not predict the elastic behavior of gels prepared in very dilute environments.
Unlike structures prepared in the absence of solvent, elastic chains cannot be found
everywhere in the solvent-based systems. In fact, the elastic behavior of porous
networks that contain significant pore volume occupied by solvent is different than
that of dense structures. Therefore, a factor is introduced in the development of the
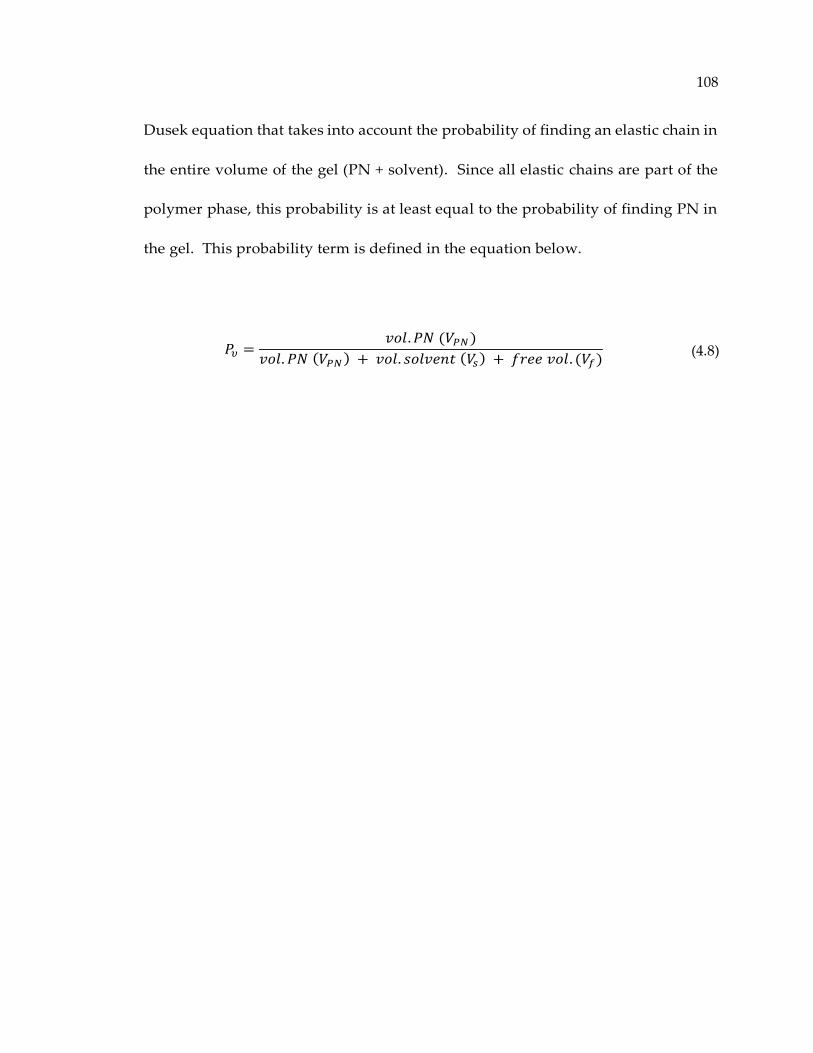
108
Dusek equation that takes into account the probability of finding an elastic chain in
the entire volume of the gel (PN + solvent). Since all elastic chains are part of the
polymer phase, this probability is at least equal to the probability of finding PN in
the gel. This probability term is defined in the equation below.
𝑃𝜐 =𝑣𝑜𝑙. 𝑃𝑁 (𝑉𝑃𝑁 )
𝑣𝑜𝑙. 𝑃𝑁 (𝑉𝑃𝑁 ) + 𝑣𝑜𝑙. 𝑠𝑜𝑙𝑣𝑒𝑛𝑡 (𝑉𝑠) + 𝑓𝑟𝑒𝑒 𝑣𝑜𝑙. (𝑉𝑓) (4.8)
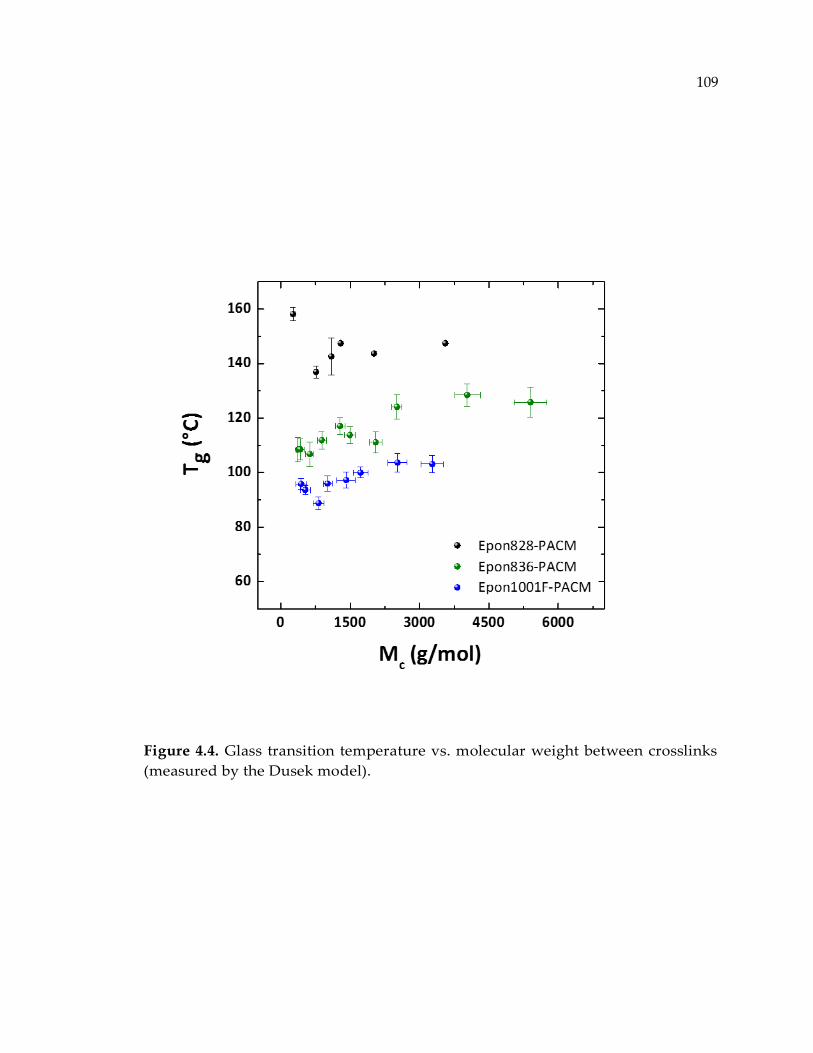
109
Figure 4.4. Glass transition temperature vs. molecular weight between crosslinks
(measured by the Dusek model).
110
The free volume in a gel is generally expected to be much lower than the volume of
the gel (𝑉𝑓 ≪ 𝑉𝑃𝑁 + 𝑉𝑠); hence, neglecting the 𝑉𝑓 term, the simplified expression is
equal to the volume fraction of PN in relaxed gel.
𝑃𝜐 =𝑣𝑜𝑙. 𝑃𝑁 (𝑉𝑃𝑁 )
𝑣𝑜𝑙. 𝑃𝑁 (𝑉𝑃𝑁 ) + 𝑣𝑜𝑙. 𝑠𝑜𝑙𝑣𝑒𝑛𝑡 (𝑉𝑠) = 𝑣2𝑟 (4.9)
In the limit of low solvent inclusion, where volume of solvent is much smaller than
the volume of PN (𝑉𝑠 ≪ 𝑉𝑃𝑁), the probability factor, 𝑃𝜐 , becomes unity, and the effect
of porosity is neglected. This was consistent with our observations of 𝑣1𝑟 < 0.2 in
Figure 4.1. By incorporating this concept into the traditional development of the
Dusek equation, 4.10 is obtained. Mathematical derivation of equation (4.10) is
shown in Appendix A.
𝑀𝑐 = −
𝑣2𝑟2 [(
𝑣2𝑠𝑣2𝑟
)
13
−12
(𝑣2𝑠𝑣2𝑟
)]
𝑣𝑝
𝑉1[ln(1 − 𝑣2𝑠) + 𝑣2𝑠 + 𝜒1𝑣2𝑠
2 ]
(4.10)
The values of molecular weight between crosslinks for each of the gel samples
previously discussed were measured based on the modified Dusek model and
plotted vs. solvent content in relaxed state, 𝑣1𝑟 , as shown in Figure 4.5. In this case,
the molecular weight between crosslinks is relatively constant for each polymer
system. This result supports the contention that the molecular structure of the
111
polymer (molecular weight between crosslinks) is not altered by the presence of the
solvent, but rather that the changes that occur pertain primarily to rearrangement
of the network topology.
In Figure 4.6, the glass transition temperature of the dried polymer phase for each
of the gels is plotted against the adjusted 𝑀𝑐 values. The results indicate that the
effect of initial solvent content on Tg and 𝑀𝑐 is minimal. In addition, the new 𝑀𝑐
values can be used to predict the Tg values via Fox and Loshaek equation,
suggesting that the adjusted Dusek model (shown in eqn. 4.10) is adequate for use
in predicting the approximate values of molecular weight between crosslinks for
the systems produced in highly dilute environments.
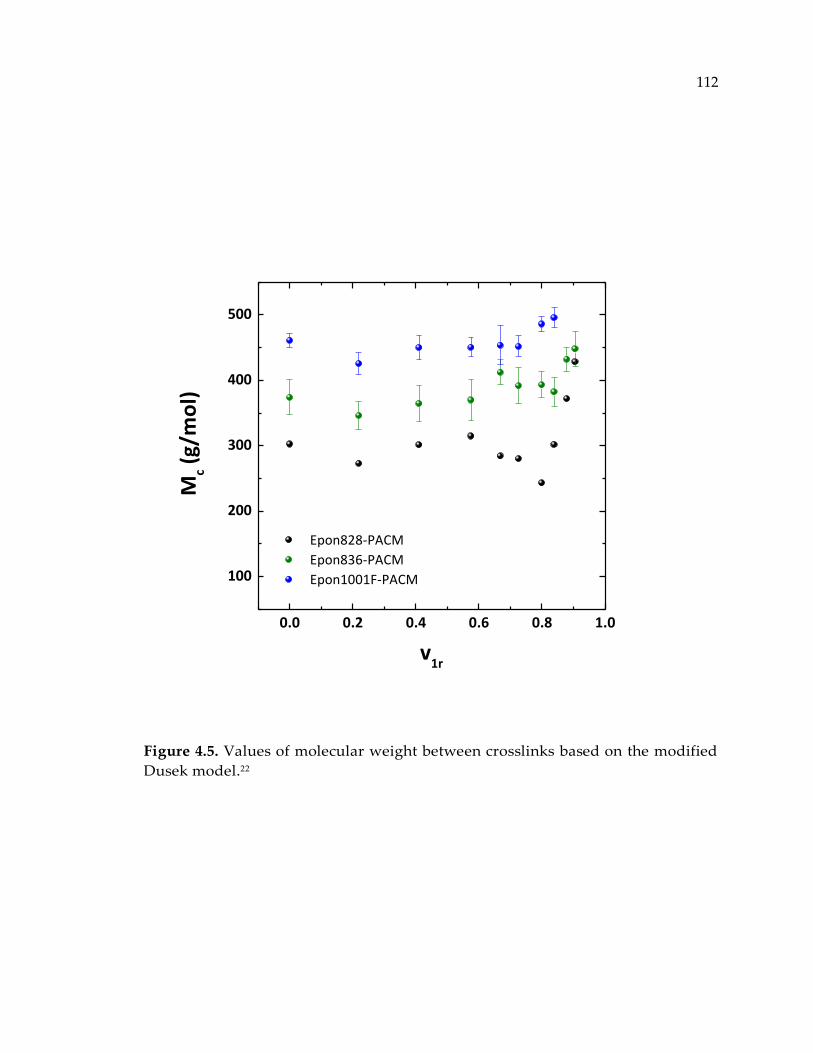
112
Figure 4.5. Values of molecular weight between crosslinks based on the modified
Dusek model.22
0.0 0.2 0.4 0.6 0.8 1.0
100
200
300
400
500
Mc (
g/m
ol)
Epon828-PACM
Epon836-PACM
Epon1001F-PACM
v1r
113
4.3.5. Effect of network structure on equilibrium swelling
According to Flory’s theory of mixing for crosslinked polymers,12 the favorable
interaction between polymer chains and fluid molecules allows a spontaneous
mixing/swelling to occur. However, as this mixing process goes forward, a
retractive force develops from the elastic nature of polymer chains that opposes the
swelling process. A state of equilibrium is reached when configurational entropy
associated with elastic retractive force and favorable interactions between solvent
species and the polymer chains provide minimum free energy for the system.
Figure 4.7 shows the equilibrium volume fraction of THF in the swollen state vs.
the corresponding quantity in relaxed state (as prepared). The increasing trend for
equilibrium volume fraction in the swollen state implies that the gels that are
formed in more dilute solutions have higher swelling capacity. This effect is only
attributed to the polymer network topology where presence of an inert solvent
during cure could affect the substitution factor 𝑘2 𝑘1⁄ ,21 or restrict the local
directions in which crosslink bonds can form.1, 2 In either case, fully cured polymer
networks with altered network topologies are forming that are capable of swelling
more than the corresponding dense structures.

114
Figure 4.6. Glass transition temperature vs. adjusted molecular weight between
crosslinks.22 (measured by eqn. 4.10)
200 300 400 500
60
80
100
120
140
160
Mc (g/mol)
Epon828-PACM
Epon836-PACM
Epon1001F-PACM
T g (°C
)
115
It was also observed that the equilibrium volume fraction of solvent in the swollen
state for the Epon1001F-PACM is higher than that of the Epon836-PACM and
Epon828-PACM. This observation can be explained by the crosslinking density and
𝑀𝑐 values. In fact, Epon1001F has a larger molecular weight than the other two
epoxy resins and thus creates polymer networks with looser crosslinking density,
or higher molecular weight between crosslinks, as shown in Figure 4.5. Therefore,
the elastic retractive force is alleviated for this system relative to the other systems
leading to more solvent swelling capacity.
Additionally, it was observed that the difference between equilibrium solvent
uptakes in swollen state is alleviated as the during-cure solvent content, 𝑣1𝑟 ,
increases. This difference is negligible for the gels prepared in very dilute
environments such as the ones with 𝑣1𝑟 > 0.8. The results in Figure 4.7 suggest that
equilibrium solvent uptake for the thermosets that are cured in very dilute
environments (𝑣1𝑟 > 0.8) are controlled by a nodular distance other than molecular
weight between crosslinks because the opposing elastic retractive forces seem to be
comparable regardless of the resin type. According to the concept of the
“topological distance”, which was introduced in Chapter 3 and the published work
by Sharifi et al.2 elastic properties of polymer networks cured in the presence of
excess inert solvent can be determined by this quantity. As proposed, since at high
solvent contents, this quantity is much larger than the size of 𝑀𝑐 for a homogeneous
116
polymer network, it explains why the difference between equilibrium solvent
uptakes is mitigated with the increase of 𝑣1𝑟 . In fact, in this case, the elastic
retractive force is dominantly determined by topological distance rather than 𝑀𝑐 .
This concept is pointed out in Figure 4.7.
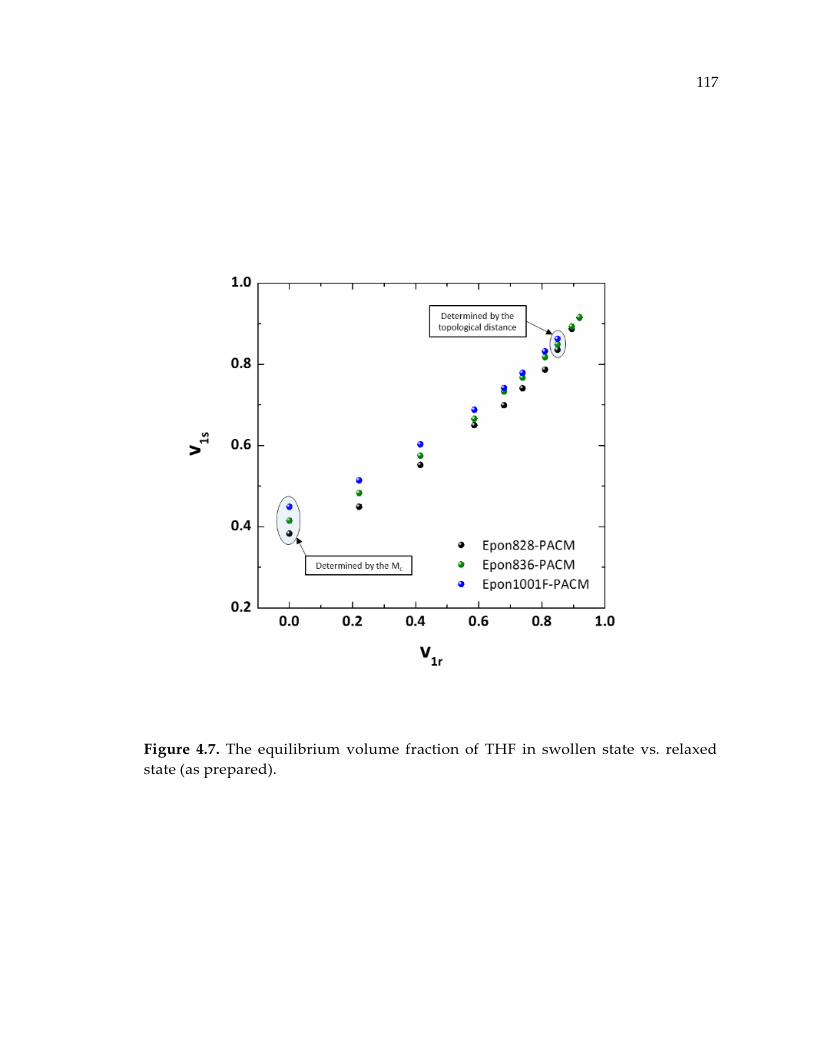
117
Figure 4.7. The equilibrium volume fraction of THF in swollen state vs. relaxed
state (as prepared).
118
4.4. Conclusion
Equilibrium swelling and glass transition temperature were used to characterize
polymer network structures that were cured in the presence of an inert solvent.
Three different epoxy resins with varying molecular sizes were cured with the same
curing agent. According to the Dusek equation, the equilibrium solvent uptake
suggests that during cure the inert solvent species affects polymer network
structures by increasing the molecular weight between crosslinks for the very dilute
samples, 𝑣1𝑟 > 0.8. However, Tg values of the resulting aerogels (based on the Fox
and Loshaek equation) were not consistent with the observed 𝑀𝑐 values. The
discrepancy suggests that the Dusek equation is inadequate to measure the 𝑀𝑐
values for crosslinked polymers when cured in highly dilute environments. The
model was adjusted by incorporating probabilistic factor, 𝑃𝜐 , based on the
probability of finding an elastic chain in the porous structure. Consequently, the
Tg values could be predicted by the new 𝑀𝑐 values via the Fox and Loshaek
equation. The results imply that the values of molecular weight between crosslinks
are insensitive to the amount of solvent present during cure and in fact, the solvent
species create pore structures throughout the entire polymer network and alter
network topology.
119
4.5. List of References
1. Jang, C.; Sharifi, M.; Palmese, G. R.; Abrams, C. F. Polymer 2014, 55, (16), 3859-
3868.
2. Sharifi, M.; Jang, C. W.; Abrams, C. F.; Palmese, G. R. Journal of Materials
Chemistry A 2014, 2, (38), 16071-16082.
3. Sue, H. J.; Puckett, P. M.; Bertram, J. L.; Walker, L. L.; Garcia-Meitin, E. I. J. Polym.
Sci., Part B: Polym. Phys. 1999, 37, (16), 2137-2149.
4. Marks, M. J.; Verghese, N. E.; Hrovat, K. J.; Laboy-Bollinger, A.; Buck, J. C.; Rabon,
J. A., Jr.; O'Connell, C. L.; Allen, L. J. Polym. Sci., Part B: Polym. Phys. 2008, 46, (15), 1632-
1640.
5. Lin, C. J.; Bell, J. P. Journal of Applied Polymer Science 1972, 16, (7), 1721-1733.
6. Crawford, E.; Lesser, A. J. J. Polym. Sci., Part B: Polym. Phys. 1998, 36, (8), 1371-
1382.
7. Flory, P. J. J. Chem. Phys. 1950, 18, 108-11.
8. Flory, P. J.; Erman, B. Macromolecules 1982, 15, (3), 800-6.
9. Flory, P. J.; Rehner, J., Jr. J. Chem. Phys. 1943, 11, 512-20.
10. Frenkel, J. Rubber Chemistry and Technology 1940, 13, (2), 264-274.
11. Flory, P. J.; Rehner Jr, J. The Journal of Chemical Physics 1943, 11, 521.
12. Flory, P. J., Principles of Polymer Chemistry. Cornell Univ. Press: 1953; p 672 pp.
13. Dušek, K. Journal of Polymer Science Part B: Polymer Letters 1965, 3, (3), 209-212.
14. Dušek, K. In Phase separation during the formation of three‐dimensional
polymers, Journal of Polymer Science Part C: Polymer Symposia, 1967; Wiley Online
Library: 1967; pp 1289-1299.
120
15. Bray, J. C.; Merrill, E. W. J. Appl. Polym. Sci. 1973, 17, (Copyright (C) 2012
American Chemical Society (ACS). All Rights Reserved.), 3781-96.
16. Peppas, N. A.; Hilt, J. Z.; Khademhosseini, A.; Langer, R. Advanced Materials 2006,
18, (11), 1345-1360.
17. Langer, R.; Peppas, N. A. AIChE Journal 2003, 49, (12), 2990-3006.
18. Raman, V. I.; Palmese, G. R. Colloids Surf., A 2004, 241, (1-3), 119-125.
19. Raman, V. I. Design of nanoporous polymer networks using a reactive
encapsulation of solvent (RES) technique. Drexel University, Philadelphia, PA, 2005.
20. Mijovic, J.; Andjelic, S. Macromolecules 1995, 28, (8), 2787-2796.
21. Raman, V. I.; Palmese, G. R. Macromolecules 2005, 38, (16), 6923-6930.
22. Ghorpade, K. A. Swelling Behavior of Nanoporous Epoxy-Amine Gels. Drexel
University, Philadelphia, PA, 2006.
23. Hansen, C. M., Hansen solubility parameters: a user's handbook. CRC press: 2007.
24. Fox, T. G.; Loshaek, S. J. Polym. Sci. 1955, 15, (Copyright (C) 2012 American
Chemical Society (ACS). All Rights Reserved.), 371-90.
25. Vakil, U. M.; Martin, G. C. J. Appl. Polym. Sci. 1992, 46, (12), 2089-99.
121
Chapter 5. Synthesis and Characterization of Polymer Network Isomers
using Diamine-functionalized Partially Reacted Substructures (dPRS)
5.1. Introduction
Topology-based toughening was introduced and developed in Chapter 3. It was
shown that the mechanical performance, particularly ductility, of an epoxy
thermosetting system can be substantially adjusted without degrading other
essential properties such as strength, modulus, and Tg. However, the use of solvent
and the drying and annealing stages of the RESD method limit its applicability to
small parts with thin cross-sections. Finding a solvent-free methodology that grant
synthesis of samples at larger quantities is essential in order to scale-up topology-
based toughening as a reliable method that could compete with other existing
toughening methods such as: di-block copolymers,1 tri-block copolymers,2
interpenetrating networks,3 core/shell particles,4 rubber particles,5 elastomers,6 as
well as incorporation of thermoplastics,7, 8 titania, alumia,9 silica,10 graphene
platelets,11 carbon-nanotubes,12 fullerene,13 POSS,14 etc.
Within the study in this Chapter, it was demonstrated that the toughening of a
thermosetting epoxy system through the rearrangement of network topology,
122
creates network isomers that possess the same overall composition but have
concomitantly improved fracture toughness and Tg. This work is motivated by the
recently proposed and novel approach to toughening thermosets demonstrated
through a series of coarse-grained molecular simulations,15, 16 which suggested that
upon tensile extension, a void-opening or surface-drawing mechanism in highly
crosslinked polymers enhances the material’s ductility without affecting tensile
strength. The fundamentals of this study, similar to the discussions in Chapter 3
and Sharifi et al.17, is to embed nano-structures in the polymer networks that could
mimic the role of the molecular surfaces (or “protovoids”), without using solvent.
The void-opening mechanism improves material ductility and toughness without
affecting yield strength, modulus and even Tg, yet the new method for controlling
the network topology does not rely on the use of a solvent so that it can be widely
applied in industrial settings.
The method, termed the “Partially Reacted Substructure (PRS)” method, involves
sub-gel partial curing of a relatively low-Tg diamine/epoxy system followed by its
blending and complete curing in a high-Tg diamine/epoxy system while
maintaining overall stoichiometry. Network isomers are therefore prepared by
varying the degree of cure for the low-Tg diamine/epoxy system (PRS) before it is
co-reacted with the high-Tg monomers. The base isomer for comparison is
prepared by mixing all reactants without pre-reaction. PRS overcomes the
123
limitation of RESD in that it does not involve sacrificial solvent, thereby allowing
fabrication of samples of any size and geometry, and enabling measurement of
plane-strain fracture toughness using linear elastic fracture mechanics (LEFM). We
demonstrate significant toughness improvements using the PRS method without
sacrificing strength and with increased Tg. We further demonstrate that the degree
of toughness enhancement is correlated to the degree of partial curing.
5.2. Experimental
5.2.1. Materials
Diglycidyl ether of bisphenol-A (DGEBA, EPON 825 – Miller-Stephensen), n=0.07,
was used as the epoxy resin. In addition, poly(propylene-oxide)diamine (PPODA,
Jeffamine D-series – Huntsman), x=33, x=68, and diethyltoluenediamine (DETDA,
EPIKURE W – Miller-Stephensen) were used as the curing agents. The molecular
structures of these materials are shown in Figure 5.1.
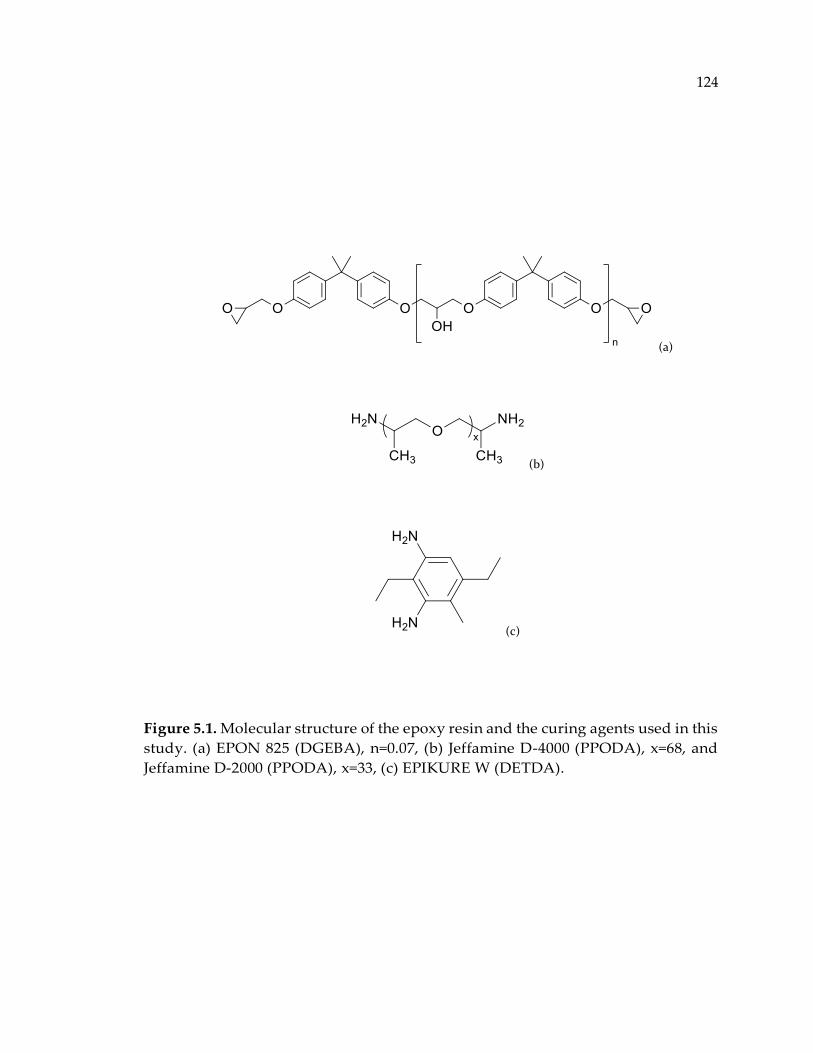
124
(a)
(b)
(c)
Figure 5.1. Molecular structure of the epoxy resin and the curing agents used in this
study. (a) EPON 825 (DGEBA), n=0.07, (b) Jeffamine D-4000 (PPODA), x=68, and
Jeffamine D-2000 (PPODA), x=33, (c) EPIKURE W (DETDA).
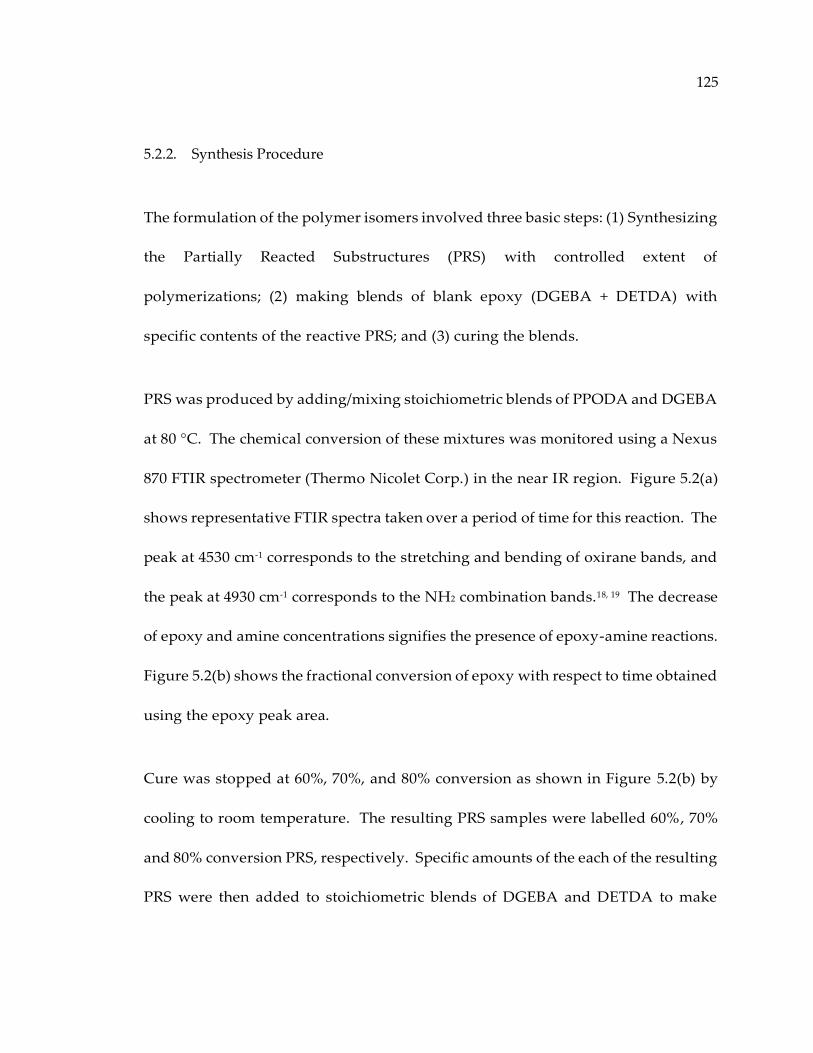
125
5.2.2. Synthesis Procedure
The formulation of the polymer isomers involved three basic steps: (1) Synthesizing
the Partially Reacted Substructures (PRS) with controlled extent of
polymerizations; (2) making blends of blank epoxy (DGEBA + DETDA) with
specific contents of the reactive PRS; and (3) curing the blends.
PRS was produced by adding/mixing stoichiometric blends of PPODA and DGEBA
at 80 °C. The chemical conversion of these mixtures was monitored using a Nexus
870 FTIR spectrometer (Thermo Nicolet Corp.) in the near IR region. Figure 5.2(a)
shows representative FTIR spectra taken over a period of time for this reaction. The
peak at 4530 cm-1 corresponds to the stretching and bending of oxirane bands, and
the peak at 4930 cm-1 corresponds to the NH2 combination bands.18, 19 The decrease
of epoxy and amine concentrations signifies the presence of epoxy-amine reactions.
Figure 5.2(b) shows the fractional conversion of epoxy with respect to time obtained
using the epoxy peak area.
Cure was stopped at 60%, 70%, and 80% conversion as shown in Figure 5.2(b) by
cooling to room temperature. The resulting PRS samples were labelled 60%, 70%
and 80% conversion PRS, respectively. Specific amounts of the each of the resulting
PRS were then added to stoichiometric blends of DGEBA and DETDA to make
126
solutions of 10%, 15%, and 20% by weight of PRS. The cured samples were called
PRS-modified samples and were labelled according to their PRS chemical
conversion. Additionally, batches with 10%, 15%, and 20% by weight of PRS were
prepared without PRS reaction taking place (i.e. 0% conversion). The resulting
cured samples were called PRS-control samples (labelled “0% conversion PRS”).
Samples with the same PRS content for any PRS chemical conversion were termed
polymer network isomers because they possess the same overall chemical
composition but differ in molecular arrangement of network building blocks. For
additional comparison, PPODA-free samples (blank samples) were also prepared
by curing stoichiometric blends of DGEBA and DETDA. All blends were well
mixed and degassed with a centrifugal mixer. They were then oven-cured at 80 °C
for 24 hours and post-cured at 160 °C for 4 hours.
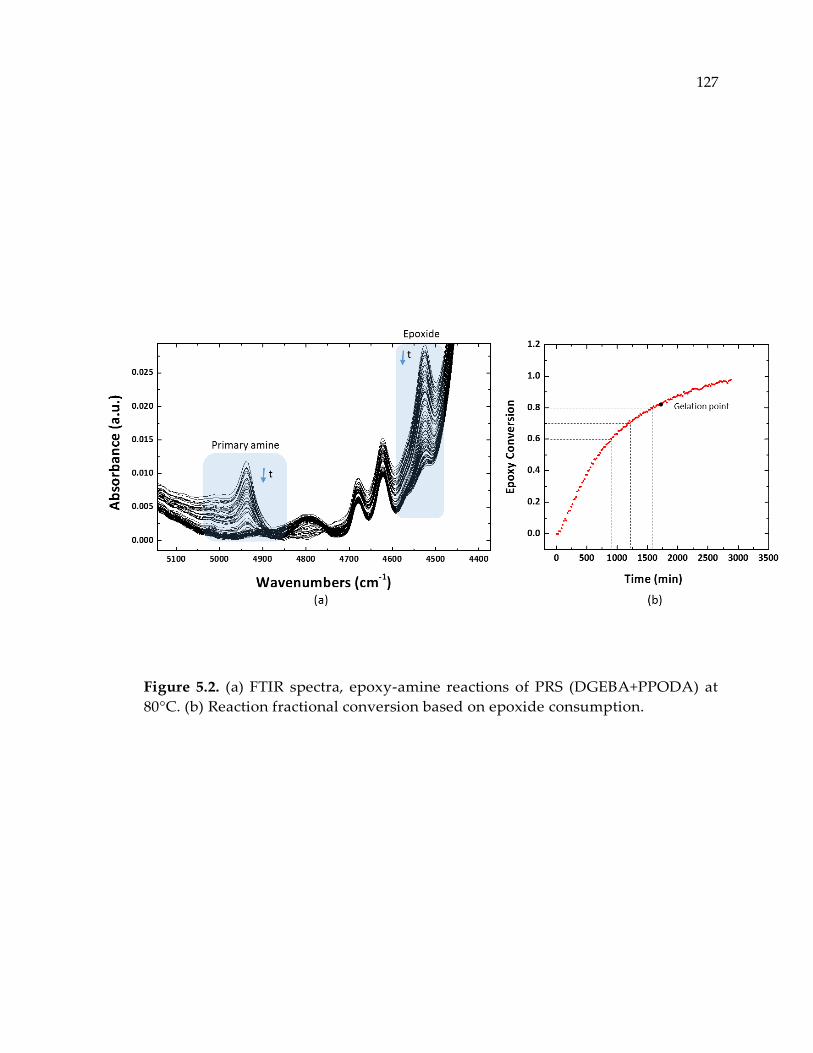
127
Figure 5.2. (a) FTIR spectra, epoxy-amine reactions of PRS (DGEBA+PPODA) at
80°C. (b) Reaction fractional conversion based on epoxide consumption.
128
5.2.3. Molecular Dynamics Simulations
MD systems of mixtures of DGEBA, PPODA, and DETDA were modeled using the
generalized Amber force field,20, 21 and simulated using LAMMPS.22 Crosslinked
systems were generated using the capture-radius approach previously utilized.23, 24
Tg’s were measured with a temperature ramp between 145 K and 700 K at a ramp
rate of 15 K/2ns. All observables were measured as averages of three replicas.
5.2.4. Uniaxial Compression
Once the samples were cured, they were cut into 6-by-6 cm rectangular sheets of 1
mm thickness. The sheets were then core-drilled to get disc-shaped samples of 8
mm in diameter and 1 mm in thickness. The error-bars associated with each of the
data-points in the compression results were measured from at least six replicates
(six identical specimens).
A servo-hydraulic INSTRON machine was used to perform the uniaxial
compression test on the resulting thermosets under quasi-static strain rates. To get
consistent results, the crosshead speed was set to 0.03 mm/s. The gauge section is
demonstrated in Figure 5.3(a).
129
To study the rate dependent mechanical behavior of the polymer isomers, the
similar disc-shape specimens were tested at high strain rates using a Kolsky bar in
direct impact mode, as shown in Figure 5.3(b). The quasi-static strain rate was
about 0.05 1/s, whereas the high strain rate was measured to be around 2000 1/s.
There were two limitations for this study. The INSTRON apparatus (or similar
facilities) are not capable of running beyond 1/s strain rates. Alternately, Kolsky
bars in UDCCM facilities could not provide any strain rates under 500 1/s.
Additionally, the momentum of the striker bar was never enough to provide stress-
strain information beyond elastic limit. Hence, we only reported and compared the
small-strain mechanical properties i.e. compressive modulus and yield strength.
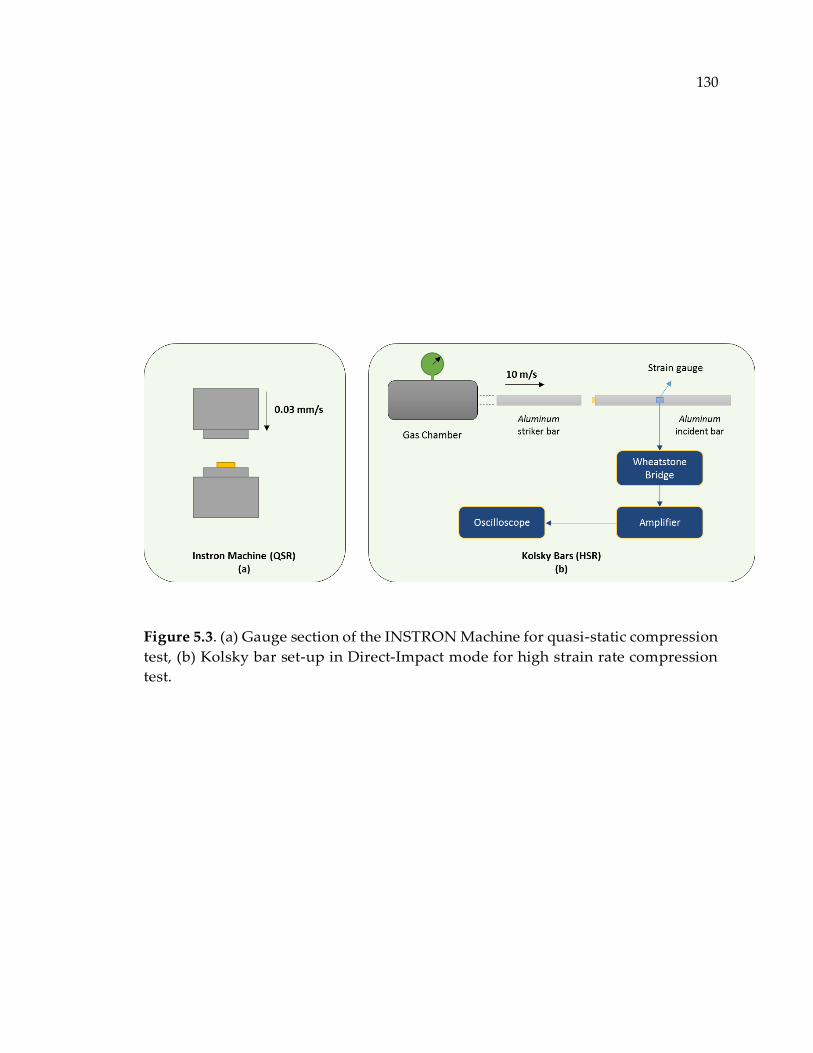
130
Figure 5.3. (a) Gauge section of the INSTRON Machine for quasi-static compression
test, (b) Kolsky bar set-up in Direct-Impact mode for high strain rate compression
test.
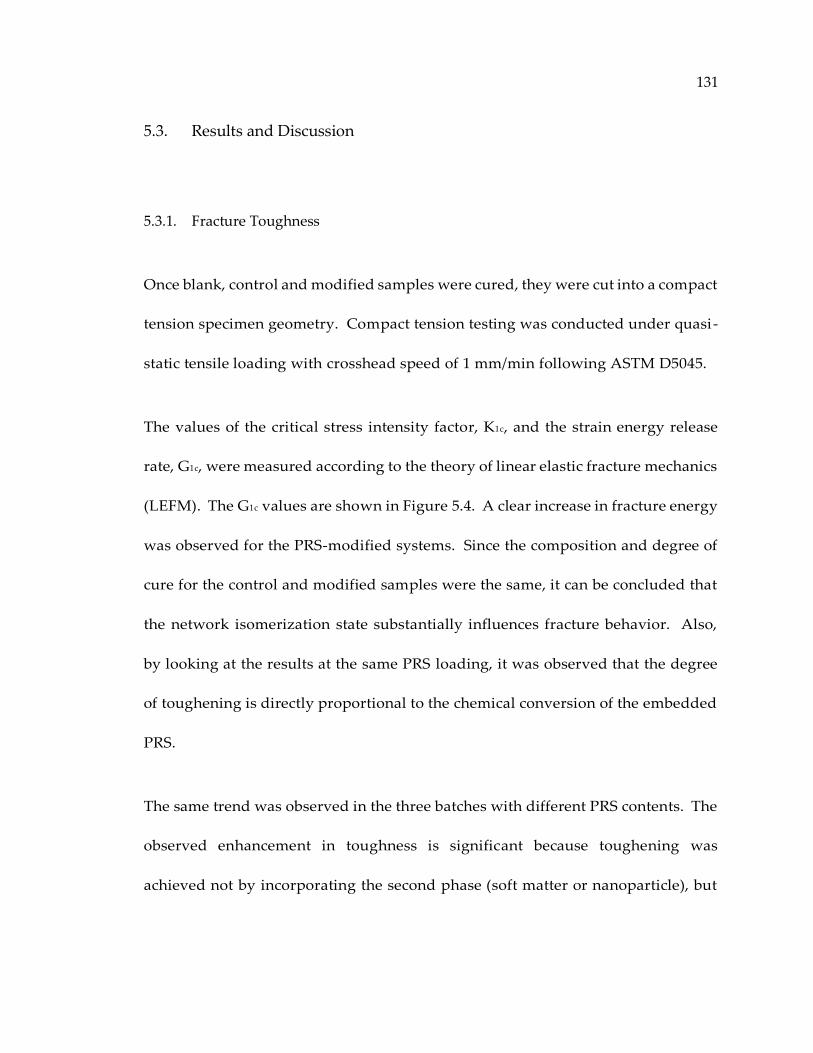
131
5.3. Results and Discussion
5.3.1. Fracture Toughness
Once blank, control and modified samples were cured, they were cut into a compact
tension specimen geometry. Compact tension testing was conducted under quasi-
static tensile loading with crosshead speed of 1 mm/min following ASTM D5045.
The values of the critical stress intensity factor, K1c, and the strain energy release
rate, G1c, were measured according to the theory of linear elastic fracture mechanics
(LEFM). The G1c values are shown in Figure 5.4. A clear increase in fracture energy
was observed for the PRS-modified systems. Since the composition and degree of
cure for the control and modified samples were the same, it can be concluded that
the network isomerization state substantially influences fracture behavior. Also,
by looking at the results at the same PRS loading, it was observed that the degree
of toughening is directly proportional to the chemical conversion of the embedded
PRS.
The same trend was observed in the three batches with different PRS contents. The
observed enhancement in toughness is significant because toughening was
achieved not by incorporating the second phase (soft matter or nanoparticle), but
132
by means of rearranging the network structure. The results indicate that adding an
additional processing step, i.e. the pre-reaction of some of the components,
increased the fracture toughness of the material by well over 100%. This can be
clearly observed by comparing the 0% conversion PRS to the corresponding 80%
conversion PRS isomers.
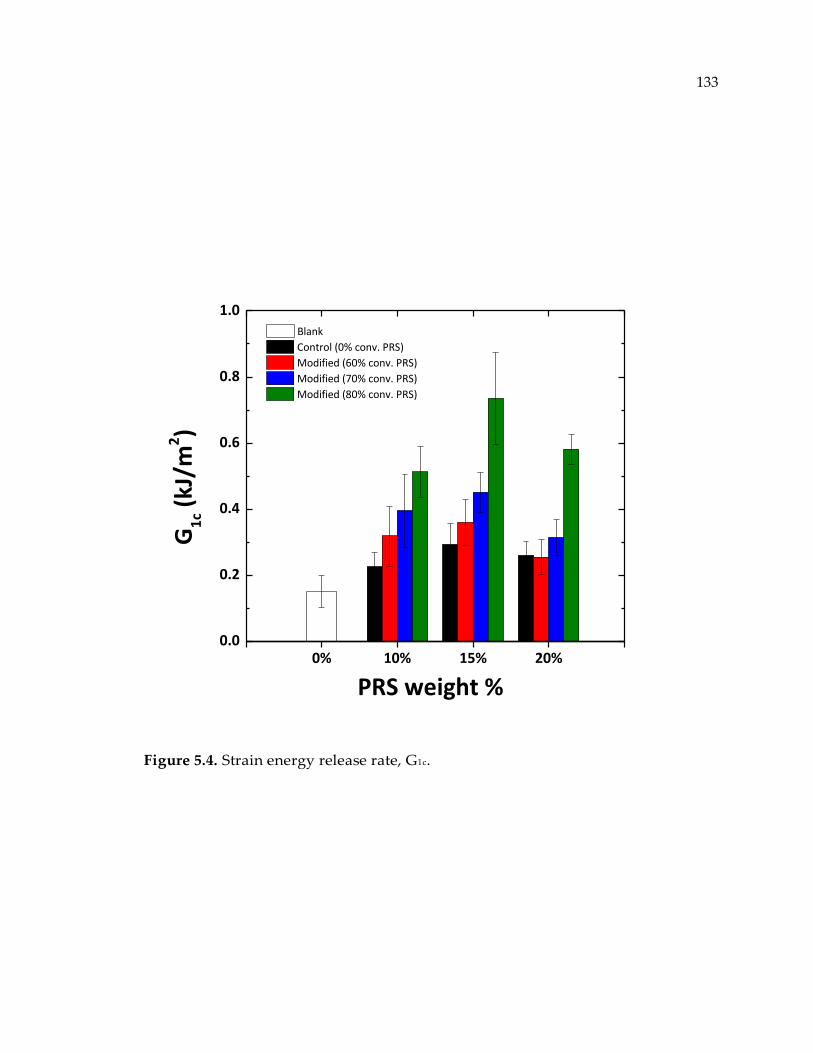
133
Figure 5.4. Strain energy release rate, G1c.
0% 10% 15% 20%0.0
0.2
0.4
0.6
0.8
1.0
Control (0% conv. PRS)
Modified (60% conv. PRS)
Modified (70% conv. PRS)
Modified (80% conv. PRS)
PRS weight %
G1
c (kJ
/m2)
Blank
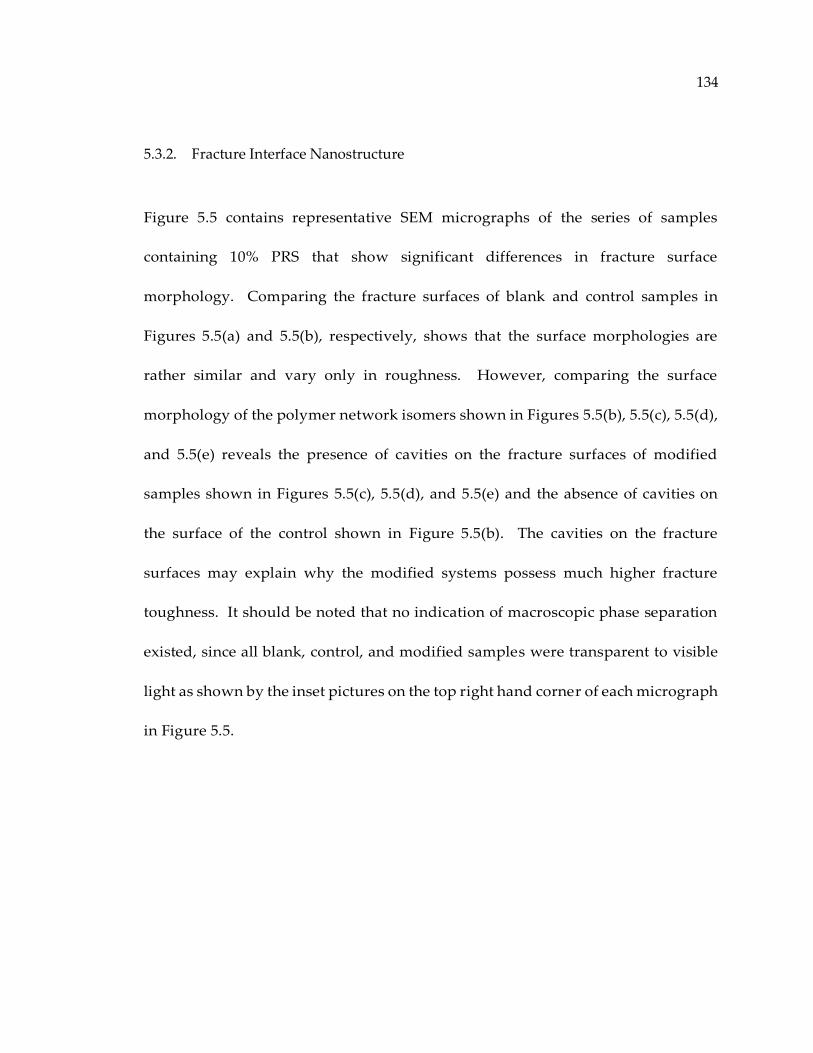
134
5.3.2. Fracture Interface Nanostructure
Figure 5.5 contains representative SEM micrographs of the series of samples
containing 10% PRS that show significant differences in fracture surface
morphology. Comparing the fracture surfaces of blank and control samples in
Figures 5.5(a) and 5.5(b), respectively, shows that the surface morphologies are
rather similar and vary only in roughness. However, comparing the surface
morphology of the polymer network isomers shown in Figures 5.5(b), 5.5(c), 5.5(d),
and 5.5(e) reveals the presence of cavities on the fracture surfaces of modified
samples shown in Figures 5.5(c), 5.5(d), and 5.5(e) and the absence of cavities on
the surface of the control shown in Figure 5.5(b). The cavities on the fracture
surfaces may explain why the modified systems possess much higher fracture
toughness. It should be noted that no indication of macroscopic phase separation
existed, since all blank, control, and modified samples were transparent to visible
light as shown by the inset pictures on the top right hand corner of each micrograph
in Figure 5.5.
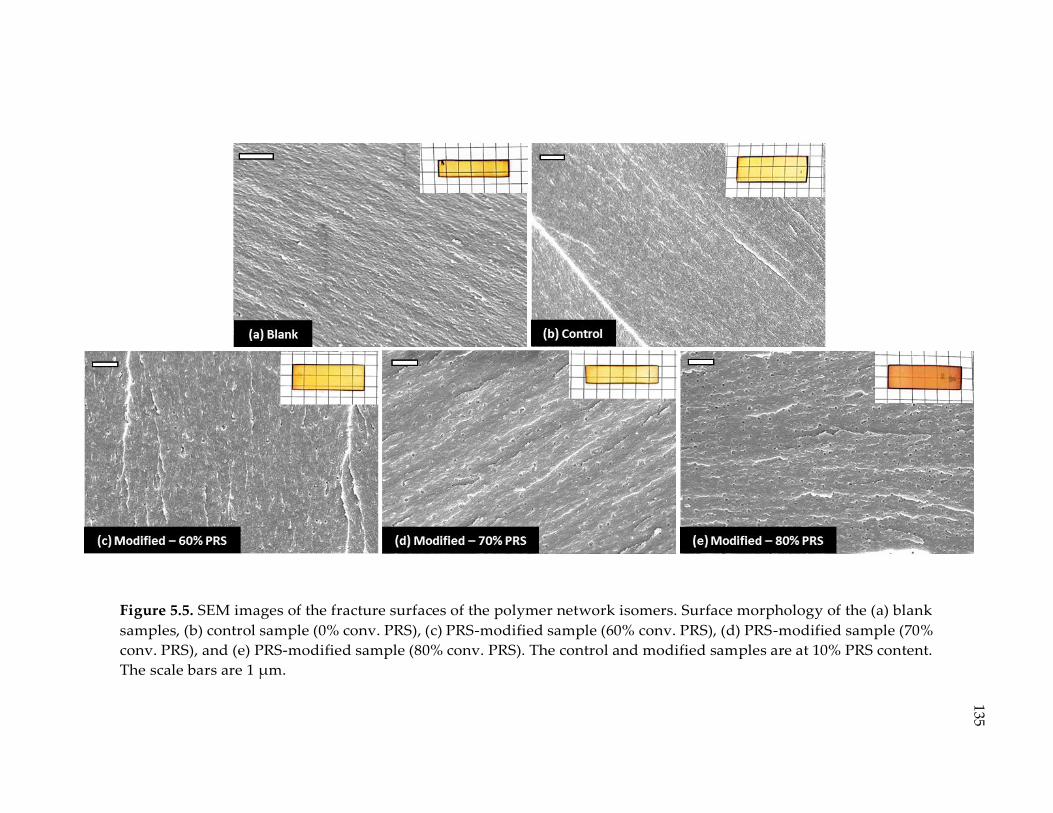
135
Figure 5.5. SEM images of the fracture surfaces of the polymer network isomers. Surface morphology of the (a) blank
samples, (b) control sample (0% conv. PRS), (c) PRS-modified sample (60% conv. PRS), (d) PRS-modified sample (70%
conv. PRS), and (e) PRS-modified sample (80% conv. PRS). The control and modified samples are at 10% PRS content.
The scale bars are 1 µm.
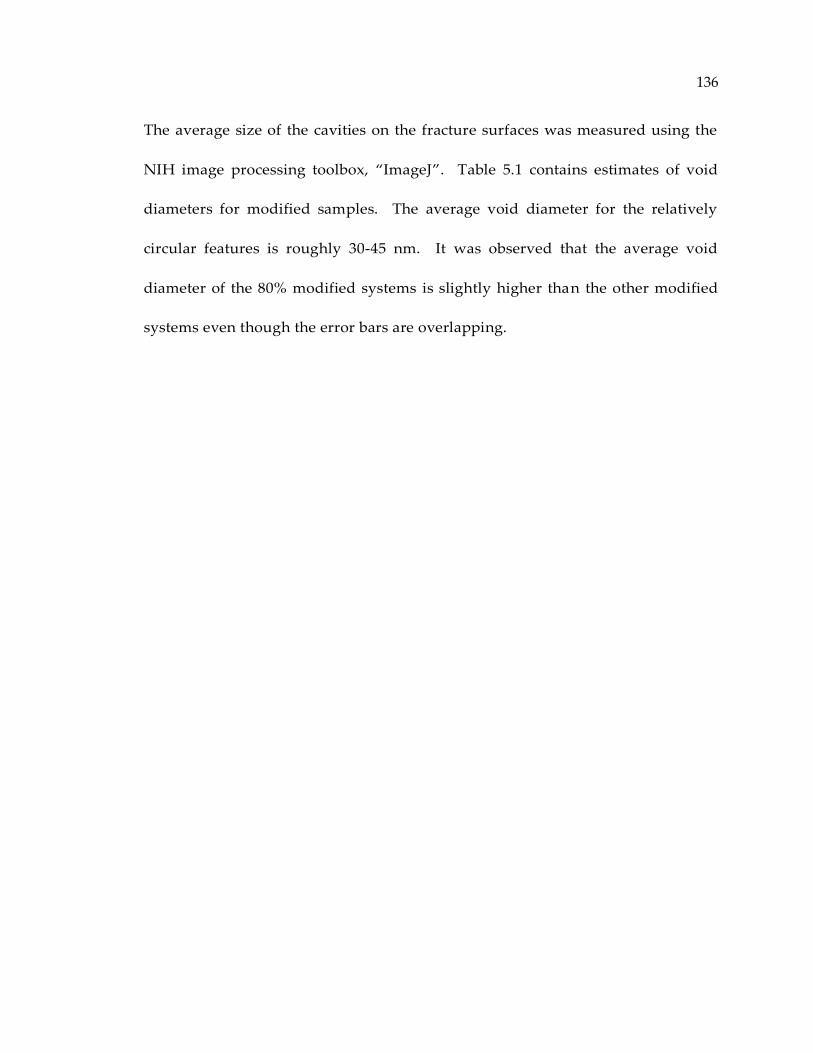
136
The average size of the cavities on the fracture surfaces was measured using the
NIH image processing toolbox, “ImageJ”. Table 5.1 contains estimates of void
diameters for modified samples. The average void diameter for the relatively
circular features is roughly 30-45 nm. It was observed that the average void
diameter of the 80% modified systems is slightly higher than the other modified
systems even though the error bars are overlapping.
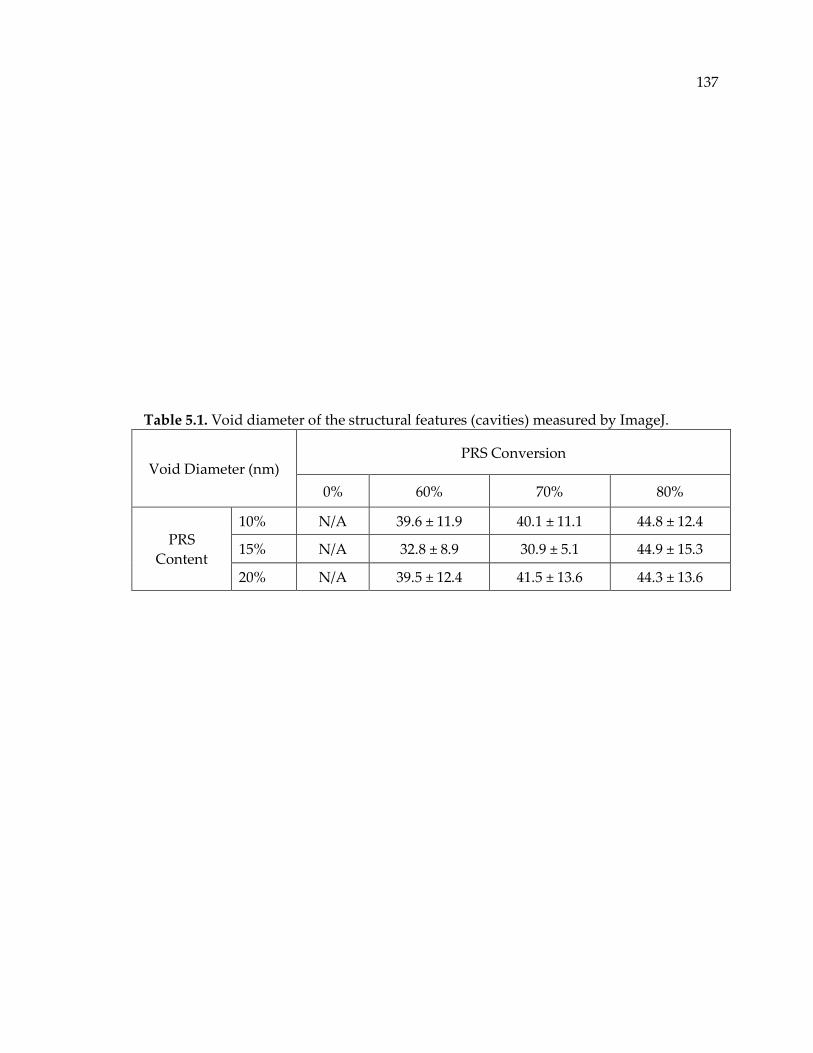
137
Table 5.1. Void diameter of the structural features (cavities) measured by ImageJ.
Void Diameter (nm) PRS Conversion
0% 60% 70% 80%
PRS
Content
10% N/A 39.6 ± 11.9 40.1 ± 11.1 44.8 ± 12.4
15% N/A 32.8 ± 8.9 30.9 ± 5.1 44.9 ± 15.3
20% N/A 39.5 ± 12.4 41.5 ± 13.6 44.3 ± 13.6
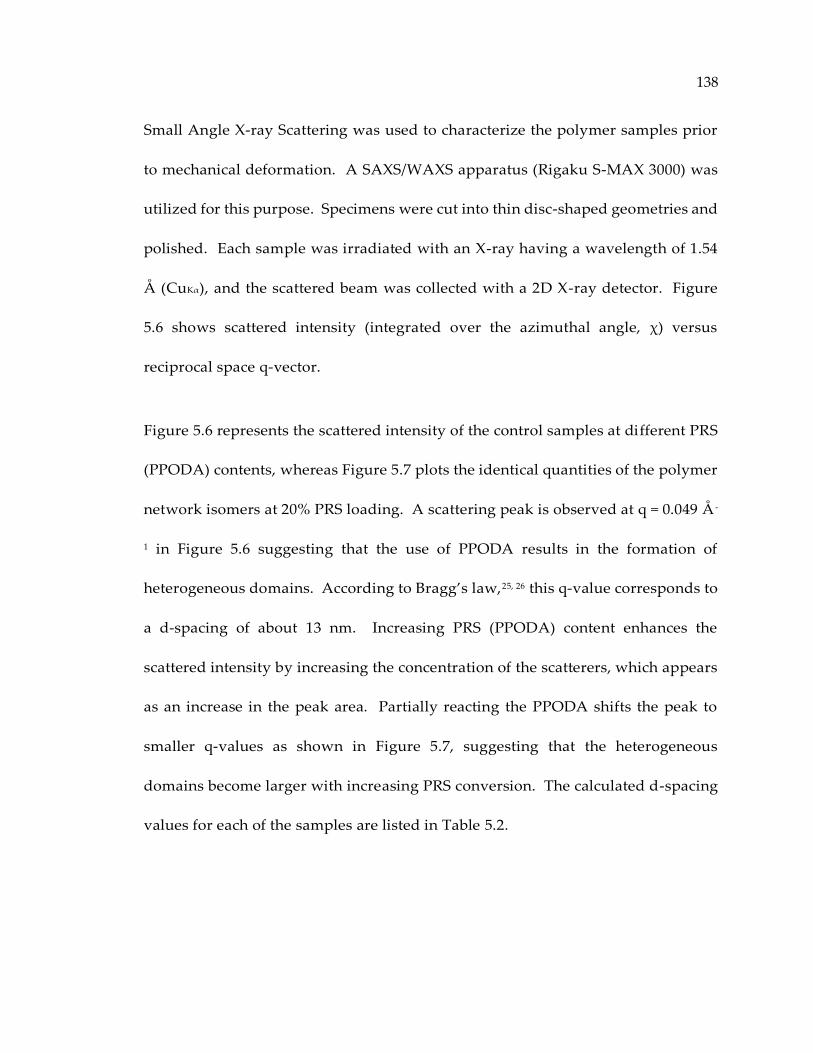
138
Small Angle X-ray Scattering was used to characterize the polymer samples prior
to mechanical deformation. A SAXS/WAXS apparatus (Rigaku S-MAX 3000) was
utilized for this purpose. Specimens were cut into thin disc-shaped geometries and
polished. Each sample was irradiated with an X-ray having a wavelength of 1.54
Å (CuKα), and the scattered beam was collected with a 2D X-ray detector. Figure
5.6 shows scattered intensity (integrated over the azimuthal angle, χ) versus
reciprocal space q-vector.
Figure 5.6 represents the scattered intensity of the control samples at different PRS
(PPODA) contents, whereas Figure 5.7 plots the identical quantities of the polymer
network isomers at 20% PRS loading. A scattering peak is observed at q = 0.049 Å -
1 in Figure 5.6 suggesting that the use of PPODA results in the formation of
heterogeneous domains. According to Bragg’s law,25, 26 this q-value corresponds to
a d-spacing of about 13 nm. Increasing PRS (PPODA) content enhances the
scattered intensity by increasing the concentration of the scatterers, which appears
as an increase in the peak area. Partially reacting the PPODA shifts the peak to
smaller q-values as shown in Figure 5.7, suggesting that the heterogeneous
domains become larger with increasing PRS conversion. The calculated d-spacing
values for each of the samples are listed in Table 5.2.
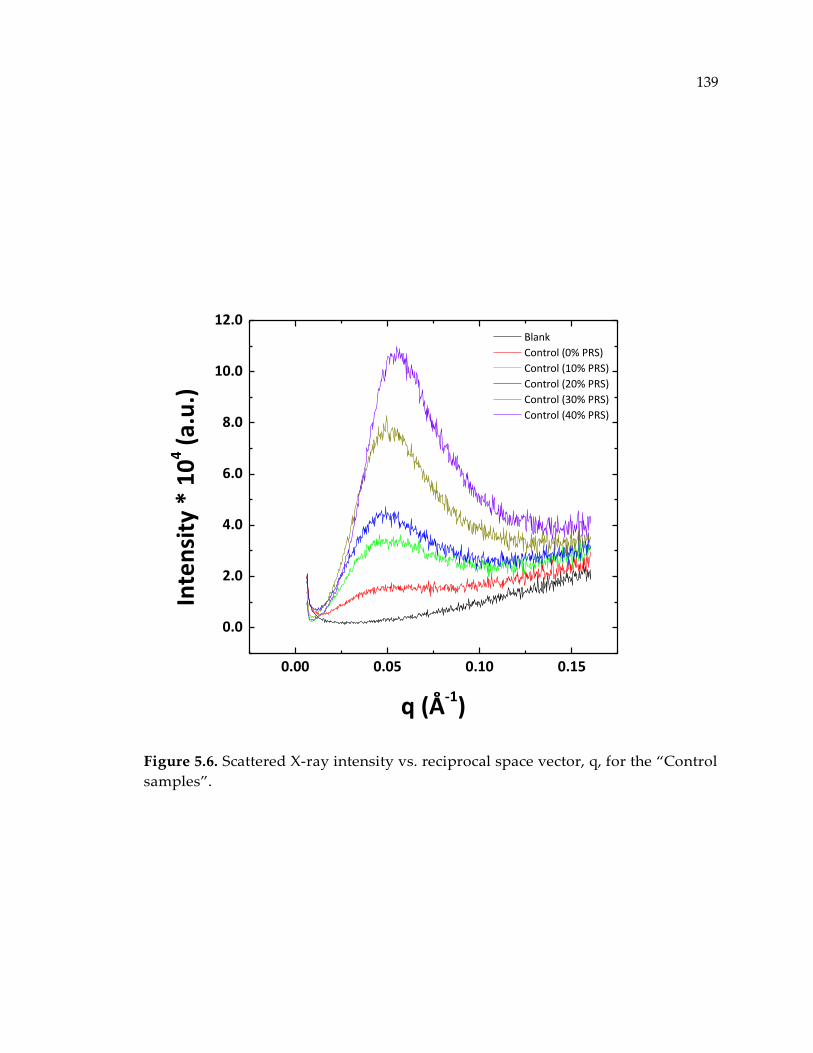
139
Figure 5.6. Scattered X-ray intensity vs. reciprocal space vector, q, for the “Control
samples”.
0.00 0.05 0.10 0.15
0.0
2.0
4.0
6.0
8.0
10.0
12.0 Blank
Control (0% PRS)
Control (10% PRS)
Control (20% PRS)
Control (30% PRS)
Control (40% PRS)
Inte
nsi
ty *
10
4 (
a.u
.)
q (Å-1)
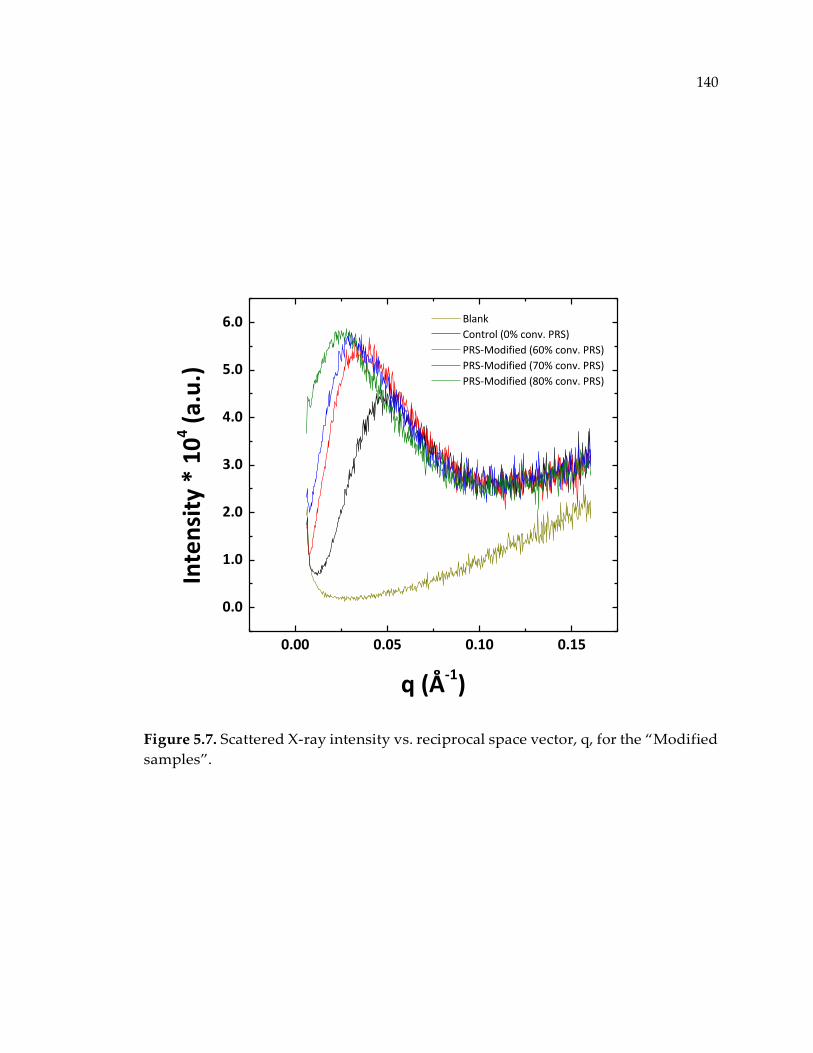
140
Figure 5.7. Scattered X-ray intensity vs. reciprocal space vector, q, for the “Modified
samples”.
0.00 0.05 0.10 0.15
0.0
1.0
2.0
3.0
4.0
5.0
6.0 Blank
Control (0% conv. PRS)
PRS-Modified (60% conv. PRS)
PRS-Modified (70% conv. PRS)
PRS-Modified (80% conv. PRS)
Inte
nsi
ty *
10
4 (
a.u
.)
q (Å-1)
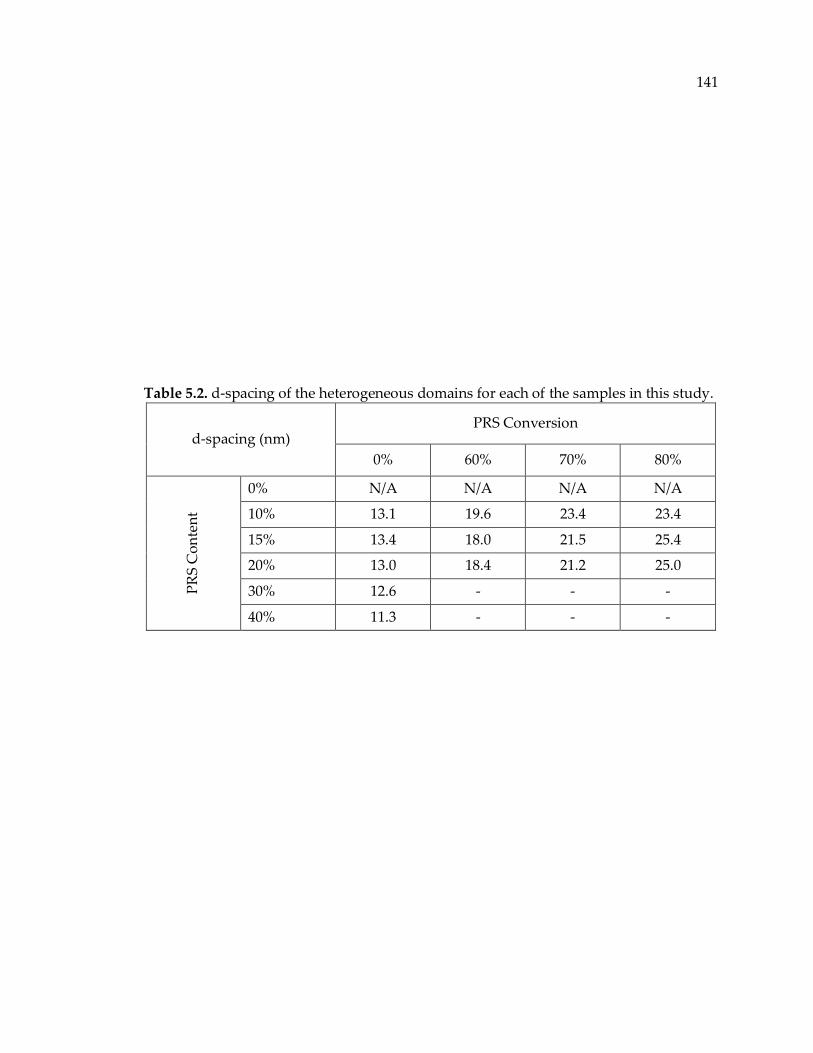
141
Table 5.2. d-spacing of the heterogeneous domains for each of the samples in this study.
d‐spacing (nm) PRS Conversion
0% 60% 70% 80%
PR
S C
on
ten
t
0% N/A N/A N/A N/A
10% 13.1 19.6 23.4 23.4
15% 13.4 18.0 21.5 25.4
20% 13.0 18.4 21.2 25.0
30% 12.6 ‐ ‐ ‐
40% 11.3 ‐ ‐ ‐
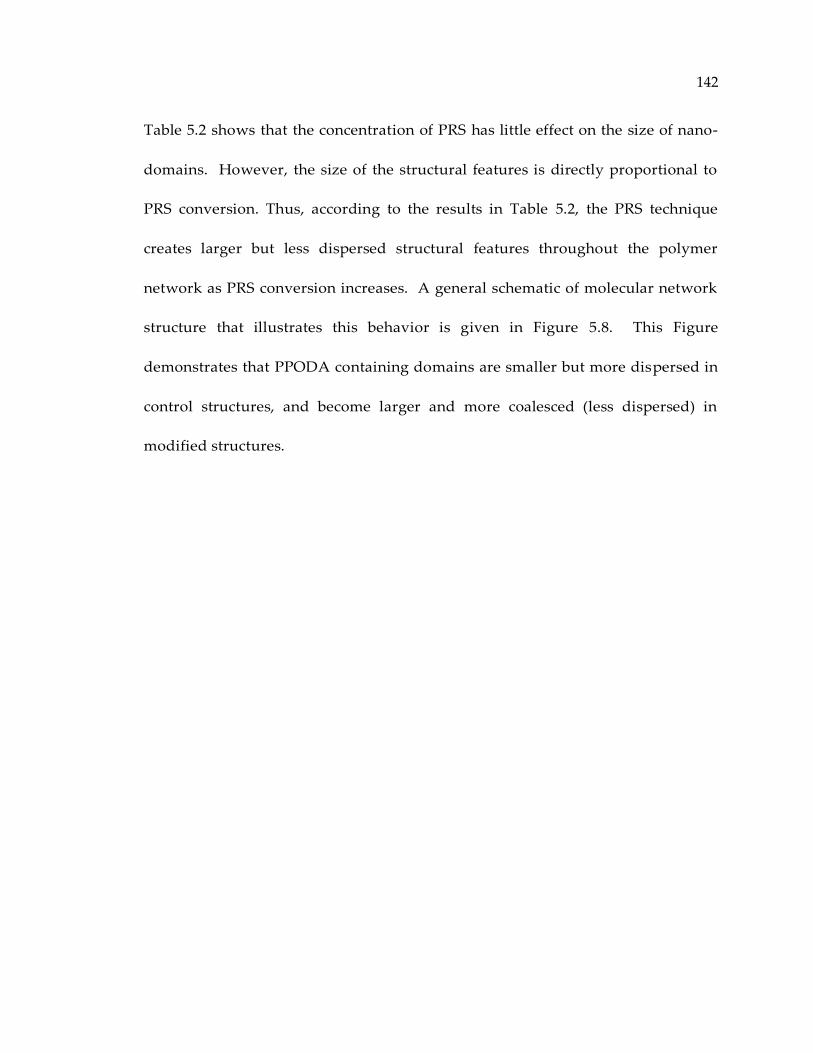
142
Table 5.2 shows that the concentration of PRS has little effect on the size of nano-
domains. However, the size of the structural features is directly proportional to
PRS conversion. Thus, according to the results in Table 5.2, the PRS technique
creates larger but less dispersed structural features throughout the polymer
network as PRS conversion increases. A general schematic of molecular network
structure that illustrates this behavior is given in Figure 5.8. This Figure
demonstrates that PPODA containing domains are smaller but more dispersed in
control structures, and become larger and more coalesced (less dispersed) in
modified structures.
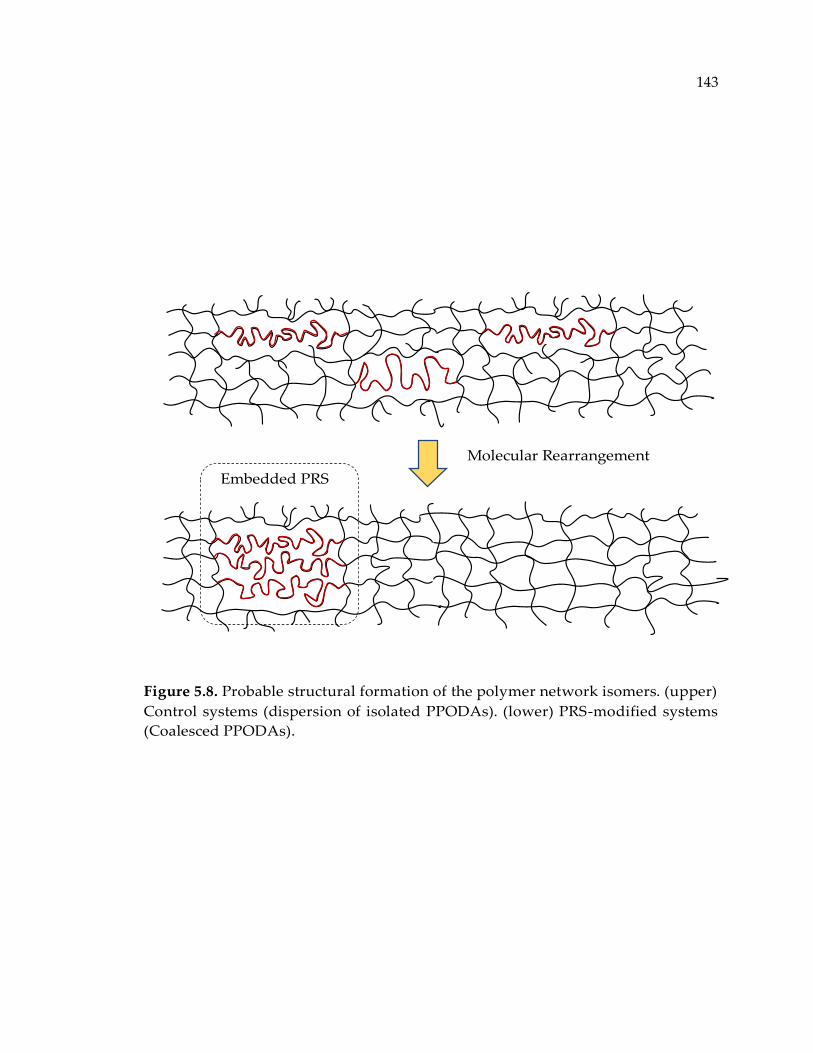
143
Figure 5.8. Probable structural formation of the polymer network isomers. (upper)
Control systems (dispersion of isolated PPODAs). (lower) PRS-modified systems
(Coalesced PPODAs).
144
5.3.3. Fracture Mechanism
In highly-crosslinked epoxy polymers, there is little evidence of crazing; instead,
considerable evidence of plastic shear deformation is observed.27, 28 In PRS
modified systems considerable evidence of cavitation is found. It appears that the
PRS-modified polymer networks behave like rubber-toughened epoxies in which
energy dissipation occurs via cavitation (void formation) in the heterogeneous soft
micro domains aided by plastic shear yielding around the particles,27, 29 even though
the observed cavities for PRS systems are much smaller nano-cavities. Cavitation
with plastic shear yielding, substantially promotes fracture energy. Larger void
growth enhances toughness, and larger PRS domains promote the formation of
larger cavities, as is the case for 80% PRS-modified systems (Table 5.1) resulting in
greater toughness improvements (Figure 5.4). Since the soft PRS domains are
covalently bound parts of the polymer network, interface debonding commonly
found in other toughening systems methods does not occur. This is clearly shown
by the uniquely ragged edges of the voids on the fracture surfaces. SEM
micrographs clearly show cavitation and enhanced plastic shear-yielding. The
extent of the cavitation can be inferred by comparing the d-spacing obtained by
SAXS given in Table 5.2 to the void sized measured using image analysis in Table

145
5.1. This concept along with the measured sizes (heterogeneous domains/voids) is
demonstrated in Figure 5.9.
146
Figure 5.9. Schematic representation of nano-cavitation and shear-yielding in the plastic zone at the control and PRS-
modified systems.
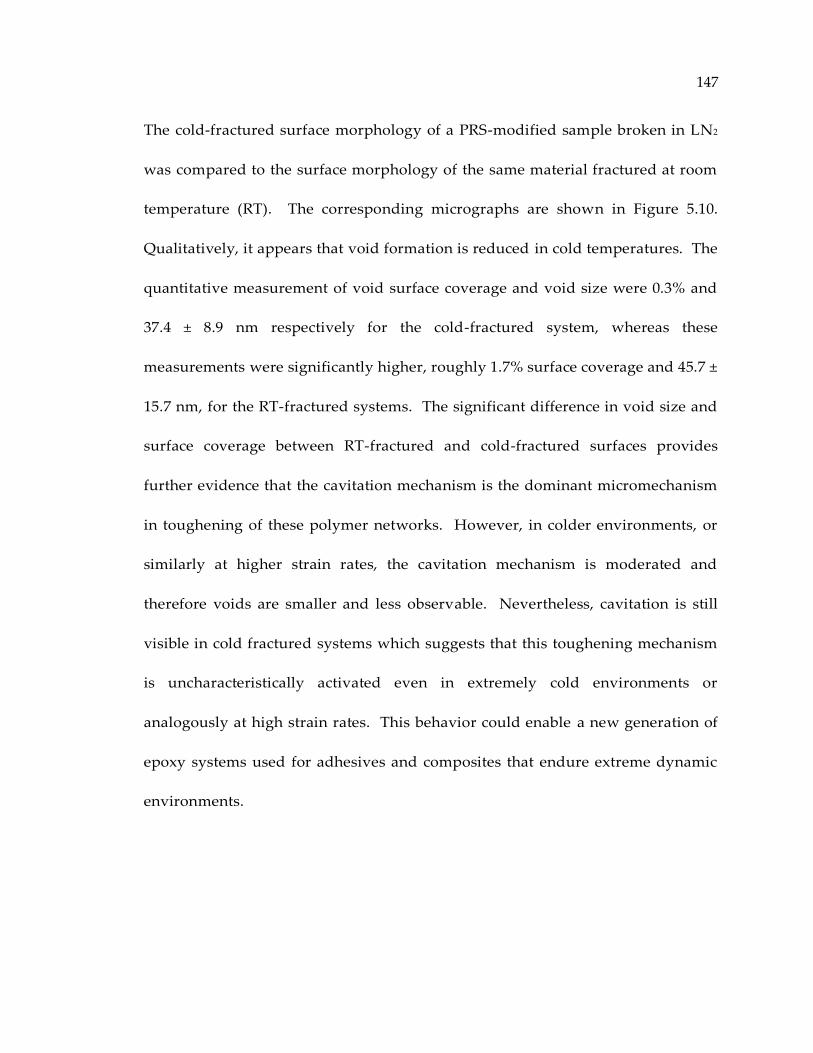
147
The cold-fractured surface morphology of a PRS-modified sample broken in LN2
was compared to the surface morphology of the same material fractured at room
temperature (RT). The corresponding micrographs are shown in Figure 5.10.
Qualitatively, it appears that void formation is reduced in cold temperatures. The
quantitative measurement of void surface coverage and void size were 0.3% and
37.4 ± 8.9 nm respectively for the cold-fractured system, whereas these
measurements were significantly higher, roughly 1.7% surface coverage and 45.7 ±
15.7 nm, for the RT-fractured systems. The significant difference in void size and
surface coverage between RT-fractured and cold-fractured surfaces provides
further evidence that the cavitation mechanism is the dominant micromechanism
in toughening of these polymer networks. However, in colder environments, or
similarly at higher strain rates, the cavitation mechanism is moderated and
therefore voids are smaller and less observable. Nevertheless, cavitation is still
visible in cold fractured systems which suggests that this toughening mechanism
is uncharacteristically activated even in extremely cold environments or
analogously at high strain rates. This behavior could enable a new generation of
epoxy systems used for adhesives and composites that endure extreme dynamic
environments.
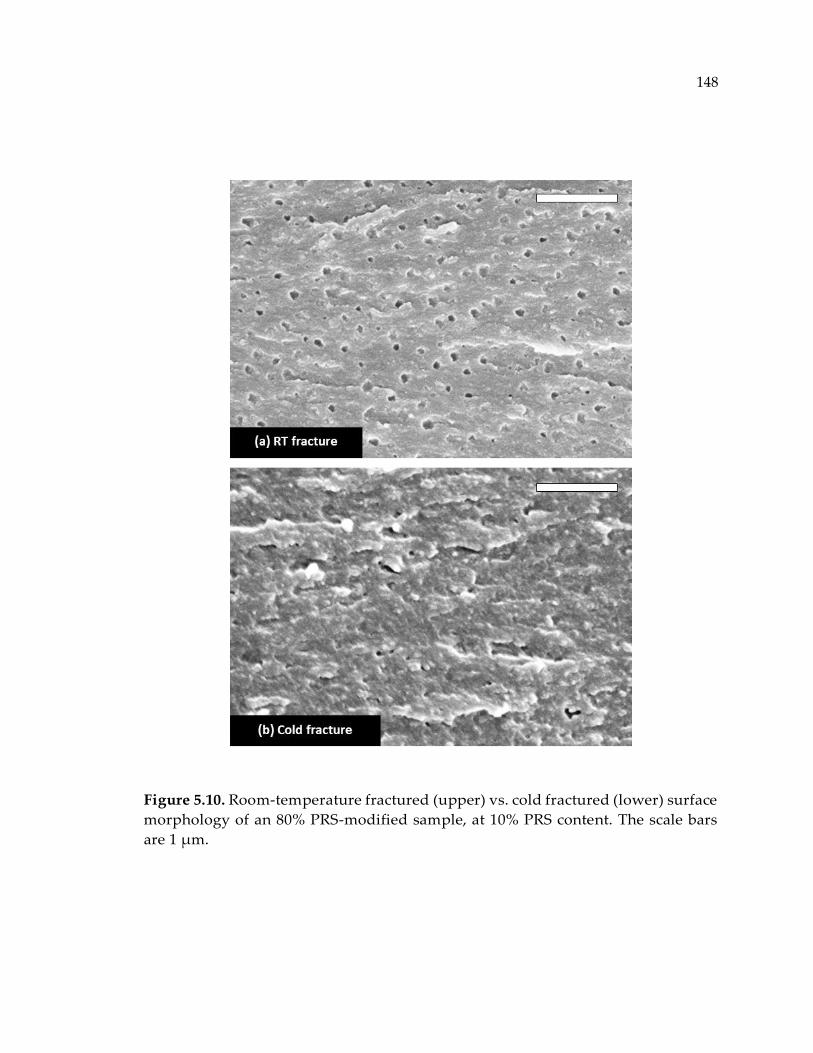
148
Figure 5.10. Room-temperature fractured (upper) vs. cold fractured (lower) surface
morphology of an 80% PRS-modified sample, at 10% PRS content. The scale bars
are 1 µm.
149
5.3.4. Glass Transition Temperature
The glass transition temperature for the polymer networks being investigated was
measured using a TA-Q800 dynamic mechanical analyzer in single cantilever
mode. DMA specimens were heated at a ramp rate of 2 °C/min under cyclic loading
with a frequency of 1 Hz and amplitude of 15 µm. Tg values were obtained from
the peak position of the tan δ curves. It is interesting to note that the Tg values were
not the same for the system isomers. In fact, the PRS-modified systems revealed
higher Tg values compared to the corresponding control systems. Figure 5.11
shows the tan δ curves of the blank, control, and modified samples at 10% PRS
content. It was observed that the Tg values of the control systems follow the linear
trend as predicted by Fox.30 However, the Tg values of the PRS-modified systems
deviate from the linear fit (Fox model) beyond 60% PRS conversions. These striking
results are shown in Figure 5.12 where many formulations show Tg well above the
Fox model predictions.
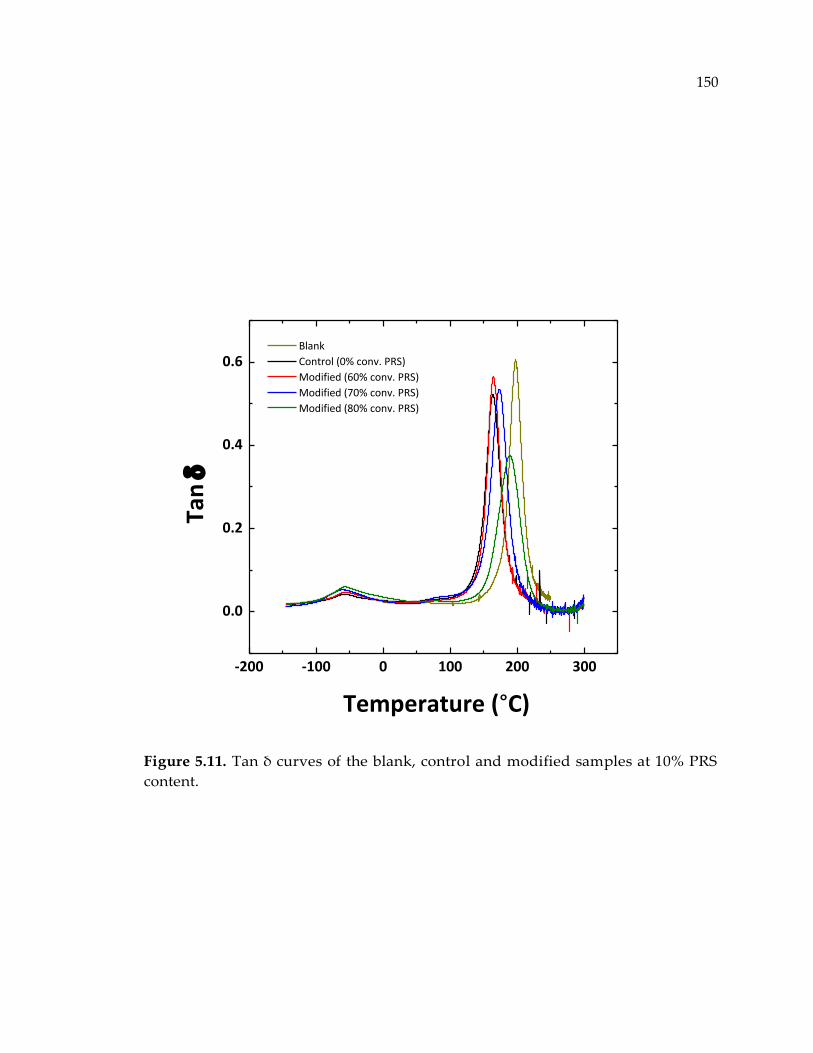
150
Figure 5.11. Tan δ curves of the blank, control and modified samples at 10% PRS
content.
-200 -100 0 100 200 300
0.0
0.2
0.4
0.6
Temperature (°C)
Blank
Control (0% conv. PRS)
Modified (60% conv. PRS)
Modified (70% conv. PRS)
Modified (80% conv. PRS)
Tan
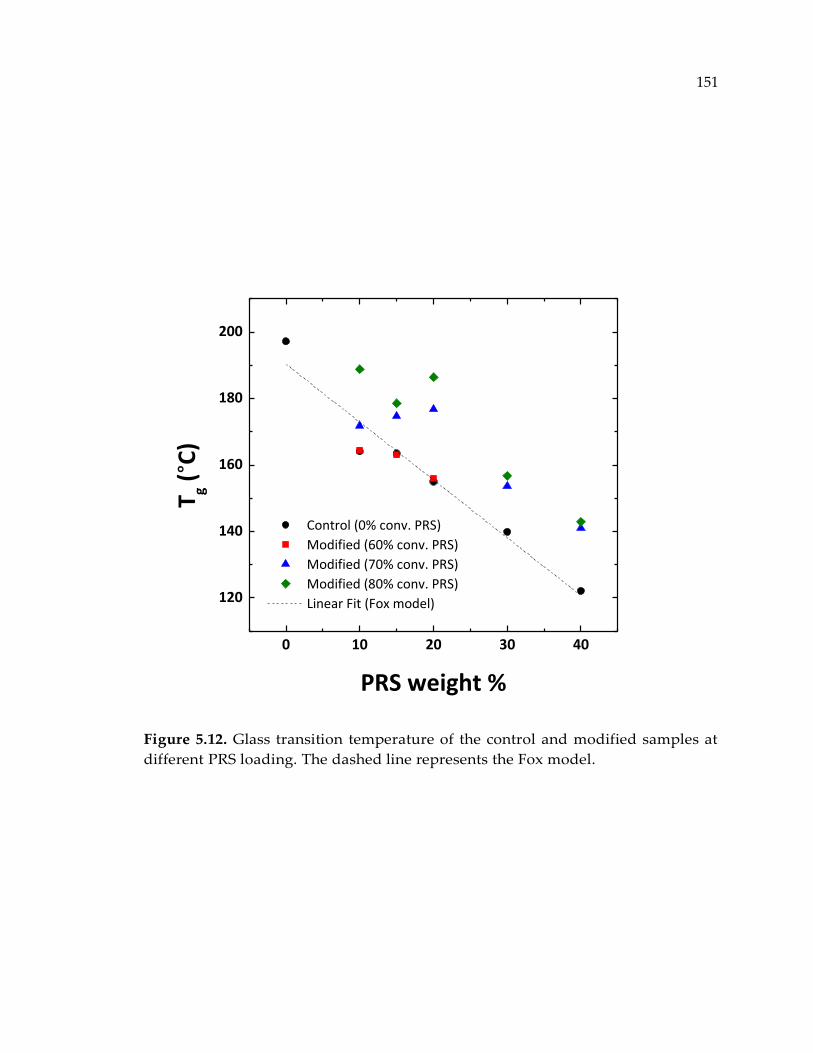
151
Figure 5.12. Glass transition temperature of the control and modified samples at
different PRS loading. The dashed line represents the Fox model.
0 10 20 30 40
120
140
160
180
200
Control (0% conv. PRS)
Modified (60% conv. PRS)
Modified (70% conv. PRS)
Modified (80% conv. PRS)
Linear Fit (Fox model)
T g (°C
)
PRS weight %
152
One explanation for the elevated Tg in the modified systems compared to the
corresponding control systems could be the dispersion of PPODA molecules within
the networks. When relatively dilute, each PPODA monomer is likely surrounded
by DEDTA and DEGBA, but when coalesced into PRS regions, each PPODA
monomer is likely surrounded by other PPODA monomers. As PPODA has a
flexible backbone, it likely enhances the mobility of its neighbors in the network.
Dilute PPODA enhances the mobility of more DEDTA than does coalesced PPODA,
thereby degrading Tg relative to pure DEDTA/DEGBA networks in the former case
much more than in the latter. This is consistent with the observation that the control
systems in which PPODA is dilute reveal lower glass transition temperatures than
the corresponding modified systems.
5.3.5. Atomistic Molecular Dynamic Simulation
The structural formation of control and PRS-modified systems were modelled
using atomistic molecular dynamic (MD) simulations. Mixtures of the two
diamines, PPODA and DETDA, were used together with DGEBA, to compare the
two blending protocols at constant overall DGEBA/DETDA/PPODA 2:1
amine:epoxy stoichiometry. The control involves curing DGEBA with both
DETDA and PPODA, and the modified involves first partially curing DGEBA with
PPODA and then adding DETDA and DGEBA to continue to a fully cured sample.
153
In this study, the 15 wt% PRS at 0% and 80% partial cure was modeled, and they
labelled “control” and “modified”, respectively.
The glass transition temperatures from control and modified systems were
obtained from a specific volume versus temperature curve by averaging over three
independent replicas per system as shown in Figure 5.13. Predicted Tg was 410 K
for the control systems and 425 K for the modified systems. This trend agrees with
the results of the experiments. Possibly, this difference in Tg is a result of greater
molecular flexibility in the control systems compared with the PRS-modified
systems.
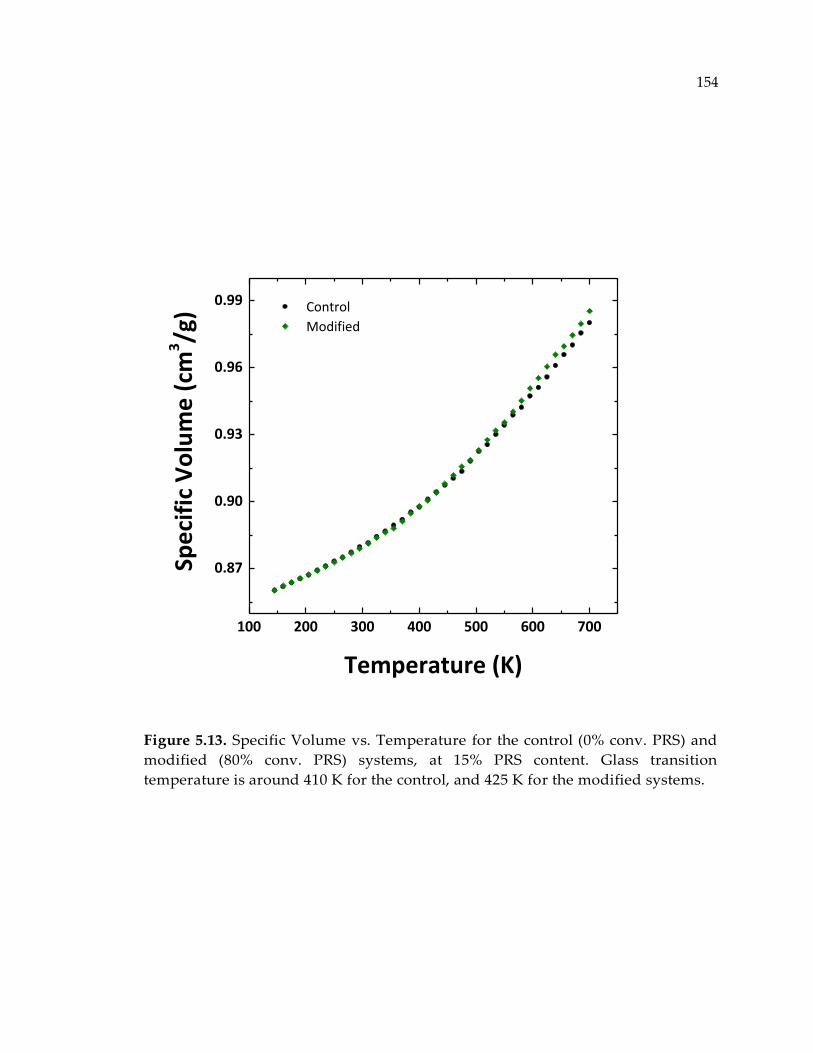
154
Figure 5.13. Specific Volume vs. Temperature for the control (0% conv. PRS) and
modified (80% conv. PRS) systems, at 15% PRS content. Glass transition
temperature is around 410 K for the control, and 425 K for the modified systems.
100 200 300 400 500 600 700
0.87
0.90
0.93
0.96
0.99 Control
Modified
Spe
cifi
c V
olu
me
(cm
3/g
)
Temperature (K)
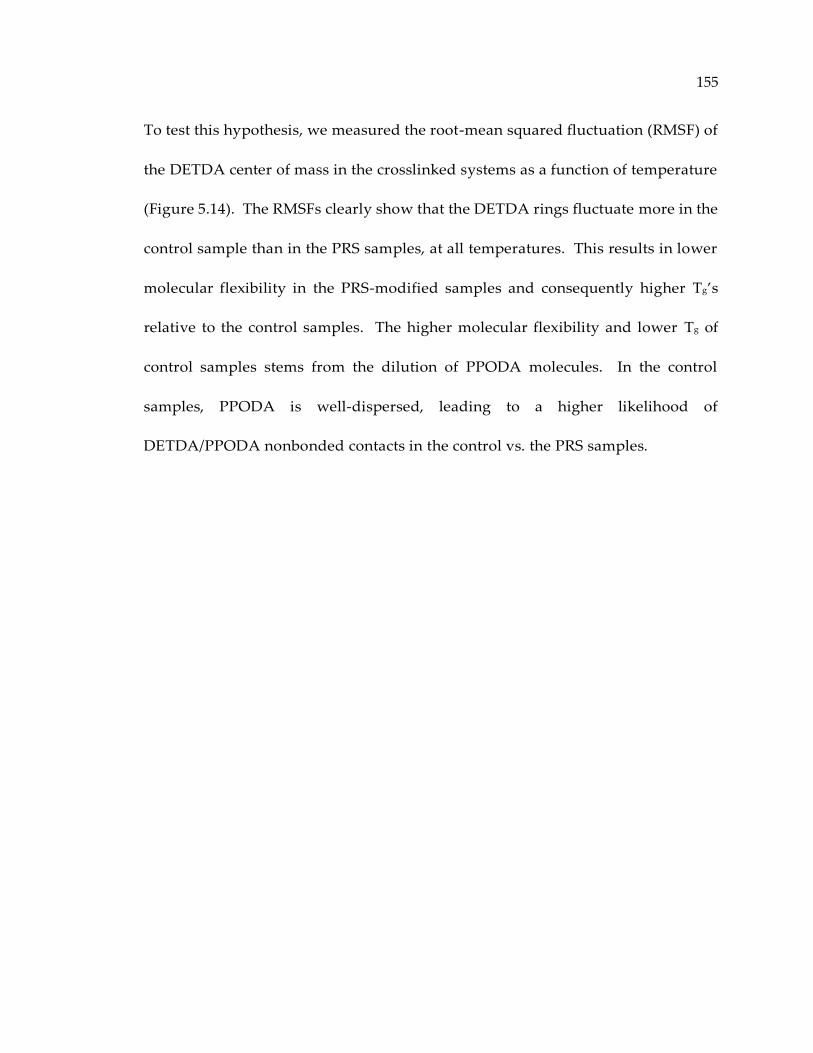
155
To test this hypothesis, we measured the root-mean squared fluctuation (RMSF) of
the DETDA center of mass in the crosslinked systems as a function of temperature
(Figure 5.14). The RMSFs clearly show that the DETDA rings fluctuate more in the
control sample than in the PRS samples, at all temperatures. This results in lower
molecular flexibility in the PRS-modified samples and consequently higher Tg’s
relative to the control samples. The higher molecular flexibility and lower Tg of
control samples stems from the dilution of PPODA molecules. In the control
samples, PPODA is well-dispersed, leading to a higher likelihood of
DETDA/PPODA nonbonded contacts in the control vs. the PRS samples.
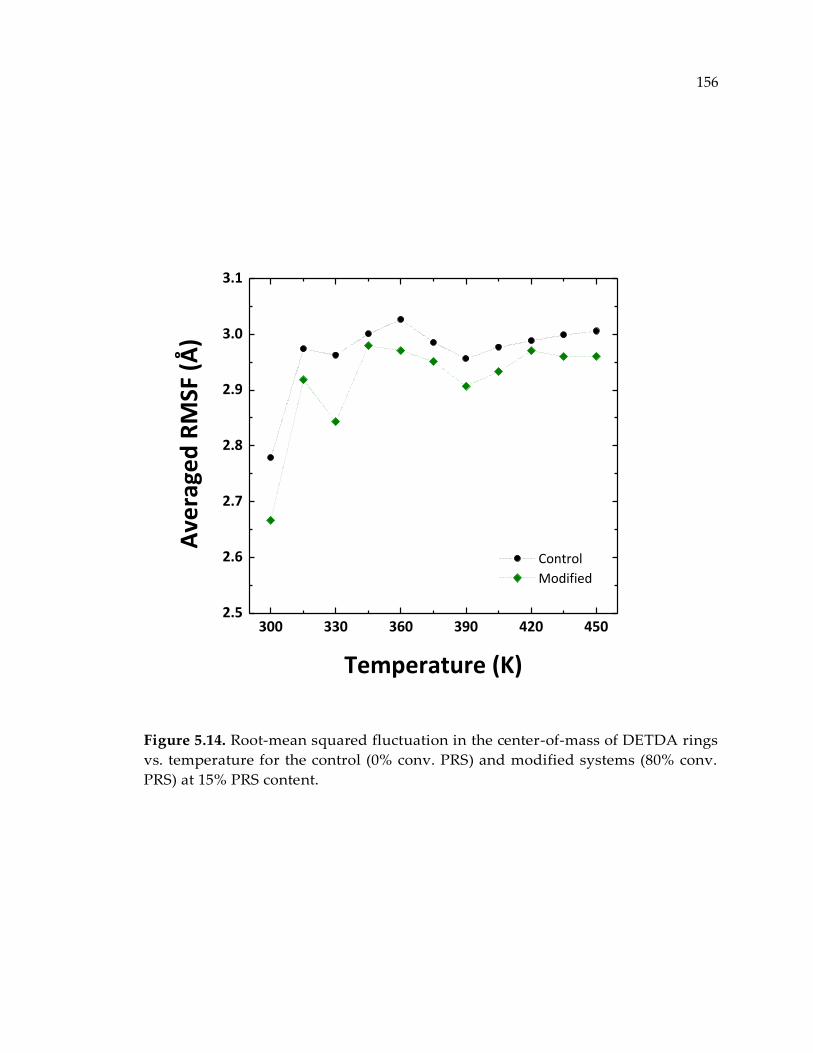
156
Figure 5.14. Root-mean squared fluctuation in the center-of-mass of DETDA rings
vs. temperature for the control (0% conv. PRS) and modified systems (80% conv.
PRS) at 15% PRS content.
300 330 360 390 420 4502.5
2.6
2.7
2.8
2.9
3.0
3.1
Control
Modified
Ave
rage
d R
MSF
(Å
)
Temperature (K)
157
5.3.6. Quasi-Static Mechanical Properties
So far, it has been shown that the modified samples are tougher and have more
elevated glass transition temperatures than the corresponding control samples.
Earlier, coarse-grained molecular simulations,15, 16 atomistic simulations,23 and
experiments,17 were used to show that topology-based toughening does not
sacrifice mechanical strength or material stiffness. To test this theory on the
network isomers considered in this study, quasi-static mechanical testing was
performed in uniaxial extension mode using the servo-hydraulic INSTRON
apparatus.
At least 8 dog-bone shaped tensile coupons were produced, and the stress-strain
curves were collected from at least six samples in each batch. The results are
presented in Table 5.3. Additionally, the representative stress-strain curves of the
PRS-modified samples and the corresponding control samples (at 10% PRS
loading) are shown in Figure 5.15. It was found that increasing PRS content
generally increases failure strain and reduces Young’s modulus and tensile
strength. However, the data show that these properties do not vary appreciably
within sets of isomers. This is particularly clear at 10% PRS content.
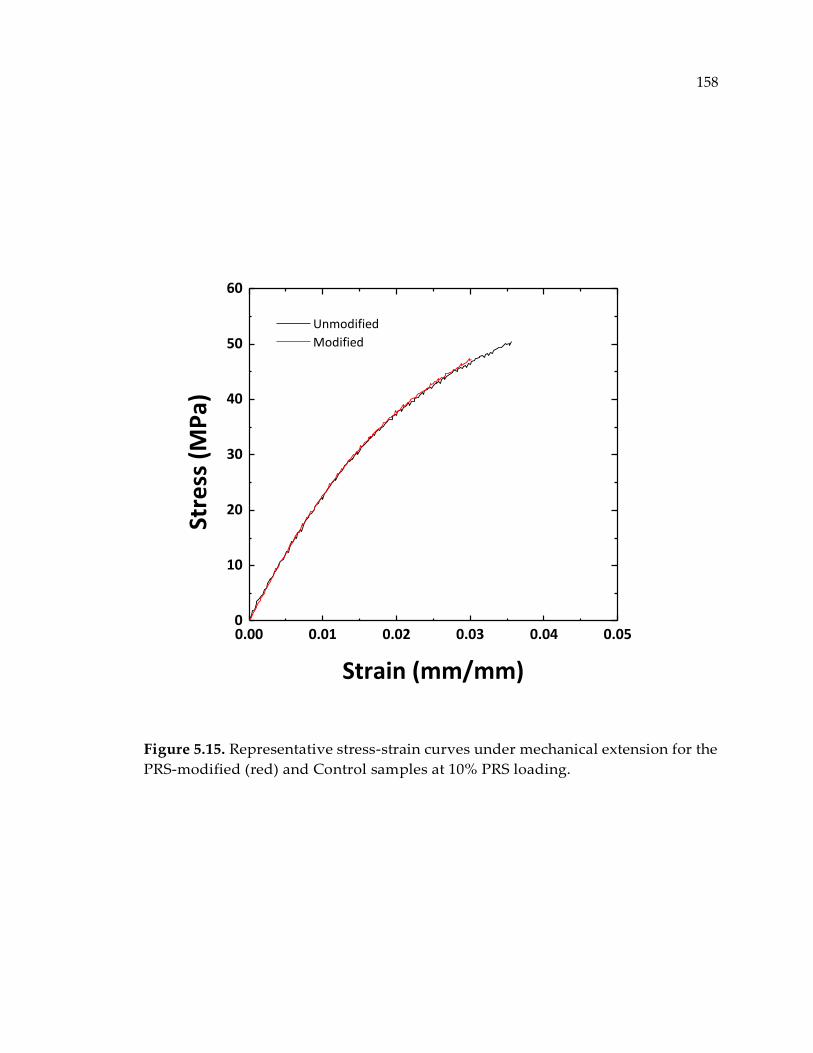
158
Figure 5.15. Representative stress-strain curves under mechanical extension for the
PRS-modified (red) and Control samples at 10% PRS loading.
0.00 0.01 0.02 0.03 0.04 0.050
10
20
30
40
50
60
Unmodified
Modified
Stre
ss (
MP
a)
Strain (mm/mm)
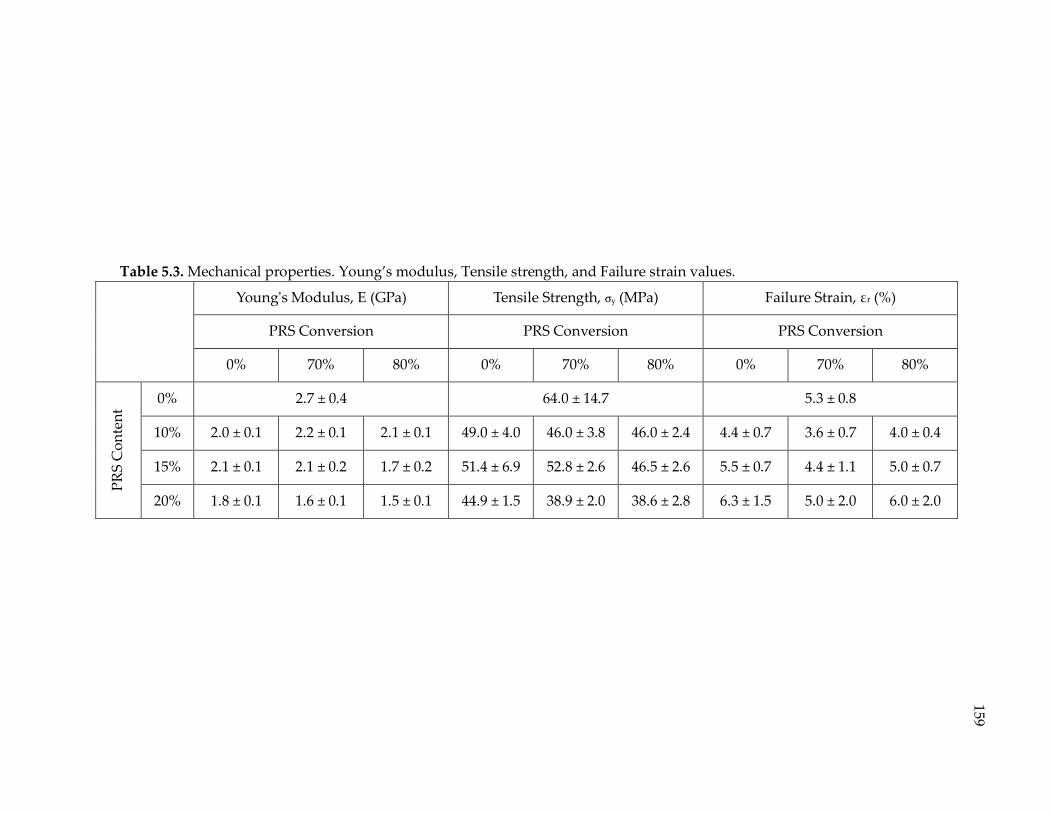
159
Table 5.3. Mechanical properties. Young’s modulus, Tensile strength, and Failure strain values.
Young's Modulus, E (GPa) Tensile Strength, σy (MPa) Failure Strain, εr (%)
PRS Conversion PRS Conversion PRS Conversion
0% 70% 80% 0% 70% 80% 0% 70% 80%
PR
S C
on
ten
t
0% 2.7 ± 0.4 64.0 ± 14.7 5.3 ± 0.8
10% 2.0 ± 0.1 2.2 ± 0.1 2.1 ± 0.1 49.0 ± 4.0 46.0 ± 3.8 46.0 ± 2.4 4.4 ± 0.7 3.6 ± 0.7 4.0 ± 0.4
15% 2.1 ± 0.1 2.1 ± 0.2 1.7 ± 0.2 51.4 ± 6.9 52.8 ± 2.6 46.5 ± 2.6 5.5 ± 0.7 4.4 ± 1.1 5.0 ± 0.7
20% 1.8 ± 0.1 1.6 ± 0.1 1.5 ± 0.1 44.9 ± 1.5 38.9 ± 2.0 38.6 ± 2.8 6.3 ± 1.5 5.0 ± 2.0 6.0 ± 2.0
160
5.3.7. Effect of Chain Length
Thus far the effect of PRS content and PRS chemical conversion on mechanical
performance and glass transition temperature has been explored. However, the
effect of chain length or the molecular weight of the flexible curative, Jeffamine,
was not investigated.
To understand the effect of the molecular weight of the flexible curing agent, similar
samples were prepared, as discussed earlier, except the PRS were made from
Jeffamine D-2000. Using Jeffamine D-2000 instead of Jeffamine D-4000 in
formulation creates nano-structures, similar to the ones formed in the Jeffamine D-
4000 samples, except crosslinking density of the heterogeneous domains are higher.
Here we examine the effect of PRS chemical conversion on fracture behavior and
glass transition temperature of the modified systems. The chemical compounds,
processing, and curing protocol were exactly the same as the systems with
Jeffamine D-4000, except PRS chemical conversion for the Jeffamine D-2000 was
selected at 0%, 50%, and 60%, respectively. Combined FTIR-rheology experiments
revealed delay in gelation (than the theoretical limits), for the systems that were
composed of curing agents with relatively large AHEW, such as the PRS made from
Jeffamine D-4000. The plots of coupled viscosity - reaction conversion versus
161
reaction time are shown in Appendix H. This phenomena was due to the formation
of cyclic chains as well as the steric hindrance effect due to existence of non-reactive
backbone of the Jeffamine molecules. In the limiting case, when AHEW is very
large, the system never forms a crosslinked structure. This concept scrutinized in
section 7.3.6.
Figure 5.16 shows the average strain energy release rates for the stoichiometric
blends of DGEBA (EPON 825) and DETDA reinforced with PRS made from DGEBA
and Jeffamine D-2000. A moderate increase in fracture energy for the PRS-modified
systems with 50% and 60% PRS conversion was noticed when comparing the
polymer network isomers at some fixed PRS weight percent, though the toughness
enhancement was not as high as the system isomers composed of Jeffamine D-4000.
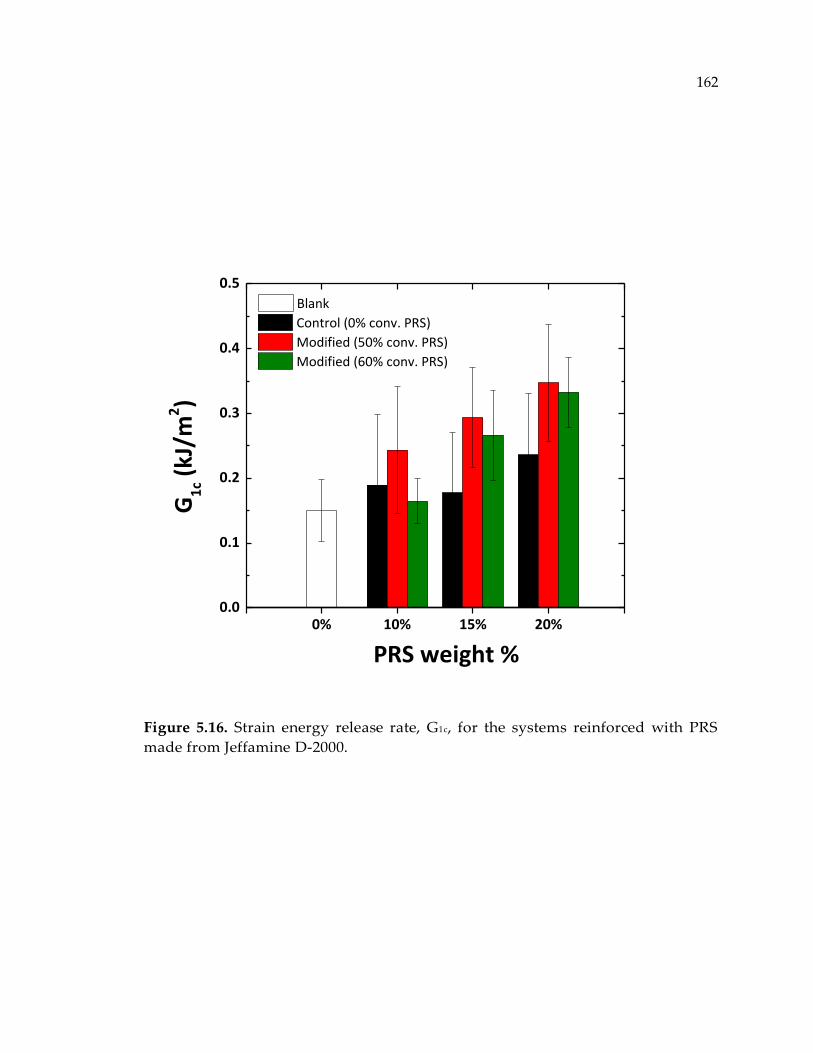
162
Figure 5.16. Strain energy release rate, G1c, for the systems reinforced with PRS
made from Jeffamine D-2000.
0% 10% 15% 20%0.0
0.1
0.2
0.3
0.4
0.5
Control (0% conv. PRS)
Modified (50% conv. PRS)
Modified (60% conv. PRS)
PRS weight %
G1
c (kJ
/m2)
Blank
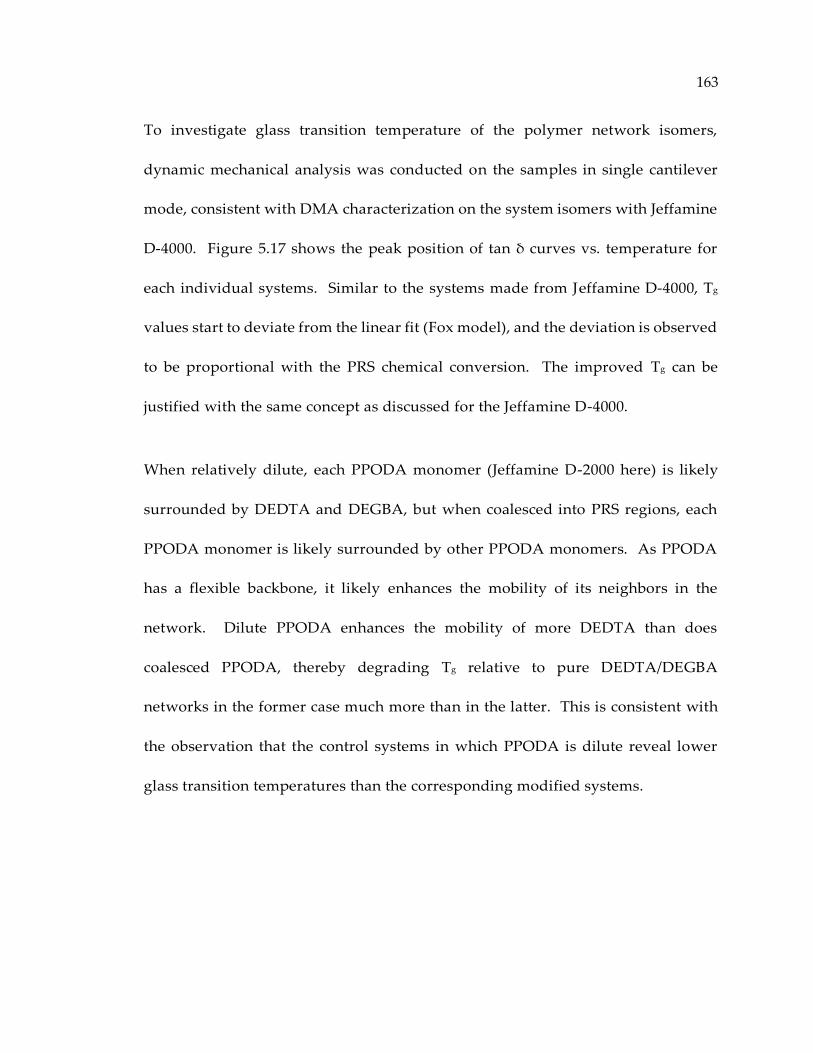
163
To investigate glass transition temperature of the polymer network isomers,
dynamic mechanical analysis was conducted on the samples in single cantilever
mode, consistent with DMA characterization on the system isomers with Jeffamine
D-4000. Figure 5.17 shows the peak position of tan δ curves vs. temperature for
each individual systems. Similar to the systems made from Jeffamine D-4000, Tg
values start to deviate from the linear fit (Fox model), and the deviation is observed
to be proportional with the PRS chemical conversion. The improved Tg can be
justified with the same concept as discussed for the Jeffamine D-4000.
When relatively dilute, each PPODA monomer (Jeffamine D-2000 here) is likely
surrounded by DEDTA and DEGBA, but when coalesced into PRS regions, each
PPODA monomer is likely surrounded by other PPODA monomers. As PPODA
has a flexible backbone, it likely enhances the mobility of its neighbors in the
network. Dilute PPODA enhances the mobility of more DEDTA than does
coalesced PPODA, thereby degrading Tg relative to pure DEDTA/DEGBA
networks in the former case much more than in the latter. This is consistent with
the observation that the control systems in which PPODA is dilute reveal lower
glass transition temperatures than the corresponding modified systems.
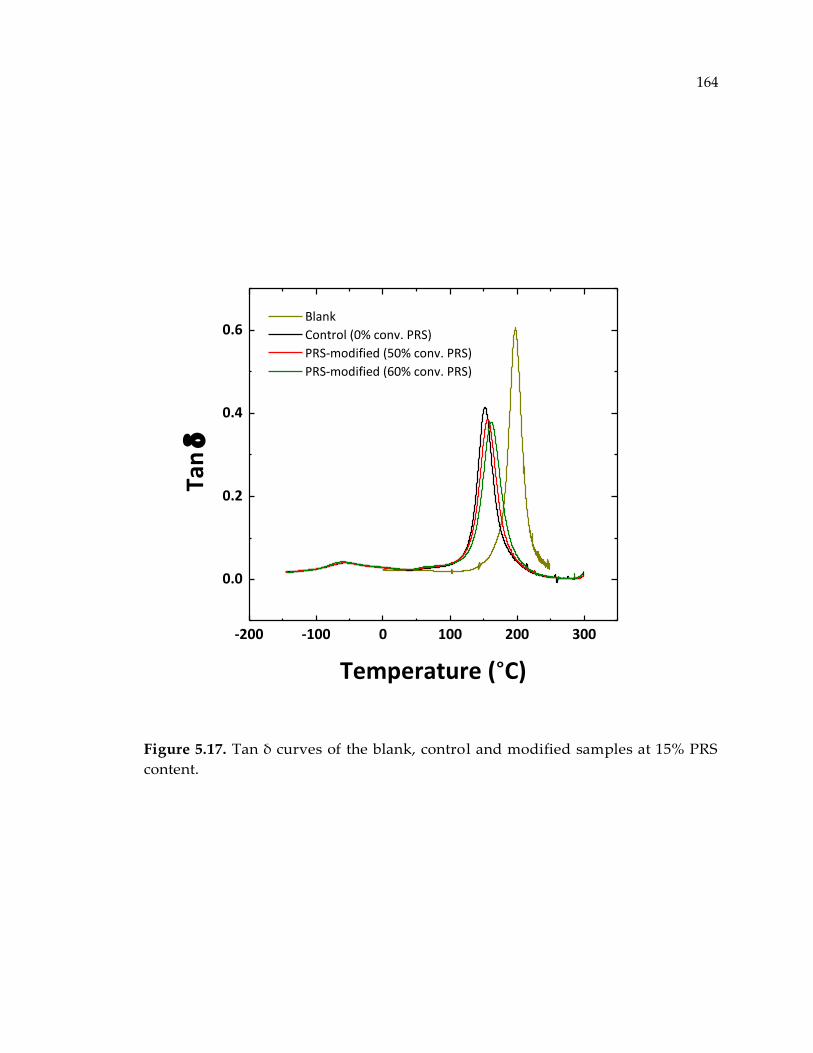
164
Figure 5.17. Tan δ curves of the blank, control and modified samples at 15% PRS
content.
-200 -100 0 100 200 300
0.0
0.2
0.4
0.6 Blank
Control (0% conv. PRS)
PRS-modified (50% conv. PRS)
PRS-modified (60% conv. PRS)
Tan
Temperature (°C)
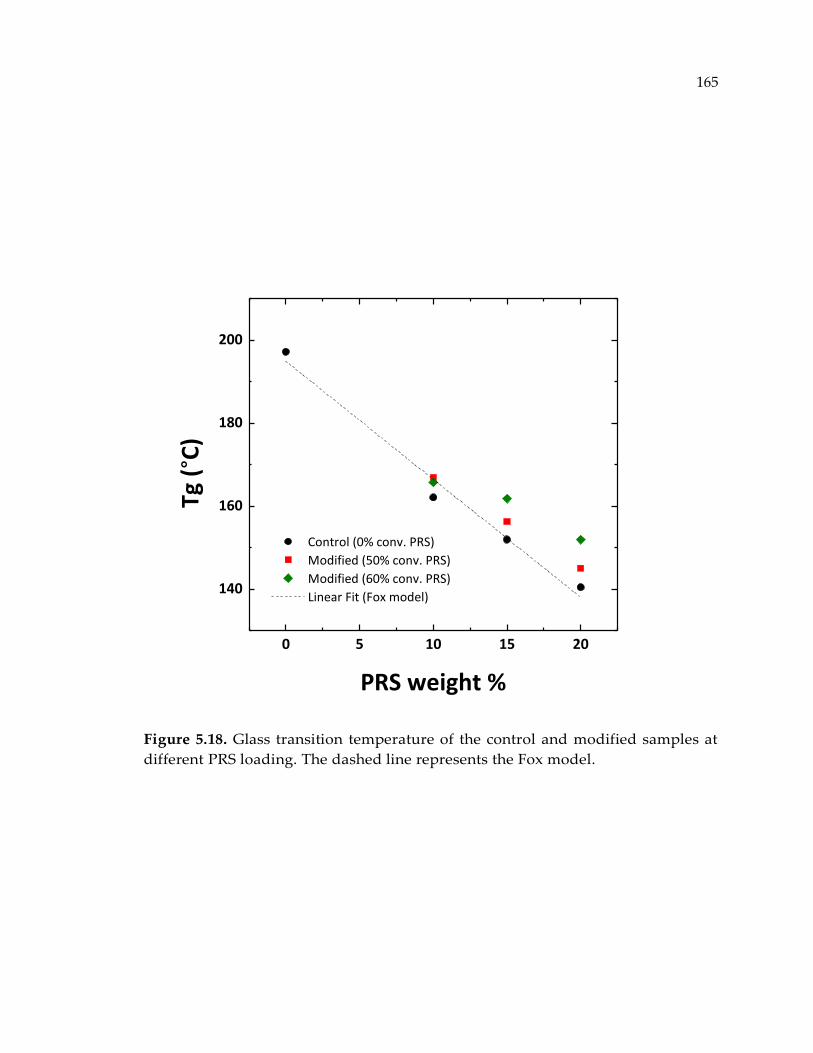
165
Figure 5.18. Glass transition temperature of the control and modified samples at
different PRS loading. The dashed line represents the Fox model.
0 5 10 15 20
140
160
180
200
Control (0% conv. PRS)
Modified (50% conv. PRS)
Modified (60% conv. PRS)
Linear Fit (Fox model)
Tg (
°C)
PRS weight %
166
5.3.8. Time Temperature Superposition (TTS)
One thought on the elevated glass transition is due to presence of a secondary
transition between α and β transitions. In other words, existence of a transition
between α and β could cause a delay in the appearance of α transition at a fixed
temperature ramp, thus showing the glass transition temperature of the PRS-
modified samples at slightly higher Tg. To test this hypothesis, we measured the
energy required for a given system to enter the rubbery state from glassy state using
Time Temperature Superposition (TTS). Presence of any secondary transition, even
a weak one, reduces the amount of energy required to activate the segmental
motion necessary to enter the rubbery state.
As discussed in the background, the TTS principle states that time and temperature
are identical to the extent that data at one temperature can be superimposed on
data at another temperature by shifting the curves along the time axis.31 The
activation energy required for a system to pass a transition state can be measured
by the Arrhenius equation as following:
log 𝑎𝑇 =𝐸𝑎
𝑅(1
𝑇−
1
𝑇𝑟) (5.1)
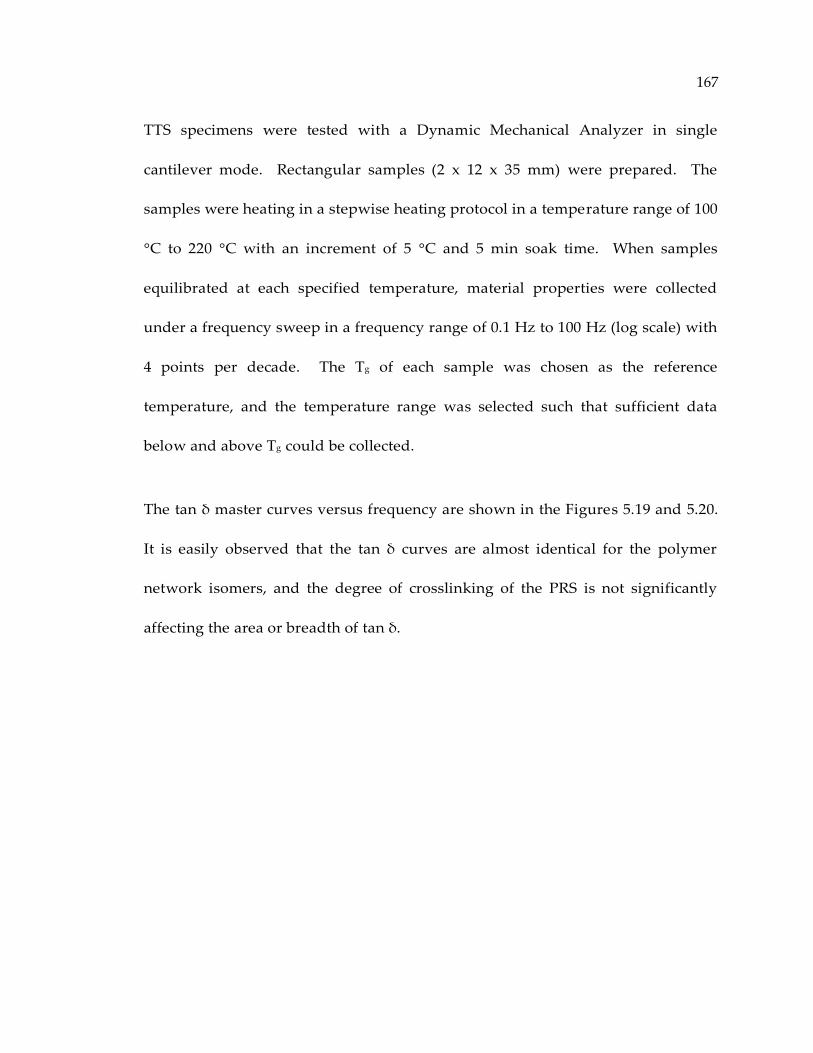
167
TTS specimens were tested with a Dynamic Mechanical Analyzer in single
cantilever mode. Rectangular samples (2 x 12 x 35 mm) were prepared. The
samples were heating in a stepwise heating protocol in a temperature range of 100
°C to 220 °C with an increment of 5 °C and 5 min soak time. When samples
equilibrated at each specified temperature, material properties were collected
under a frequency sweep in a frequency range of 0.1 Hz to 100 Hz (log scale) with
4 points per decade. The Tg of each sample was chosen as the reference
temperature, and the temperature range was selected such that sufficient data
below and above Tg could be collected.
The tan δ master curves versus frequency are shown in the Figures 5.19 and 5.20.
It is easily observed that the tan δ curves are almost identical for the polymer
network isomers, and the degree of crosslinking of the PRS is not significantly
affecting the area or breadth of tan δ.
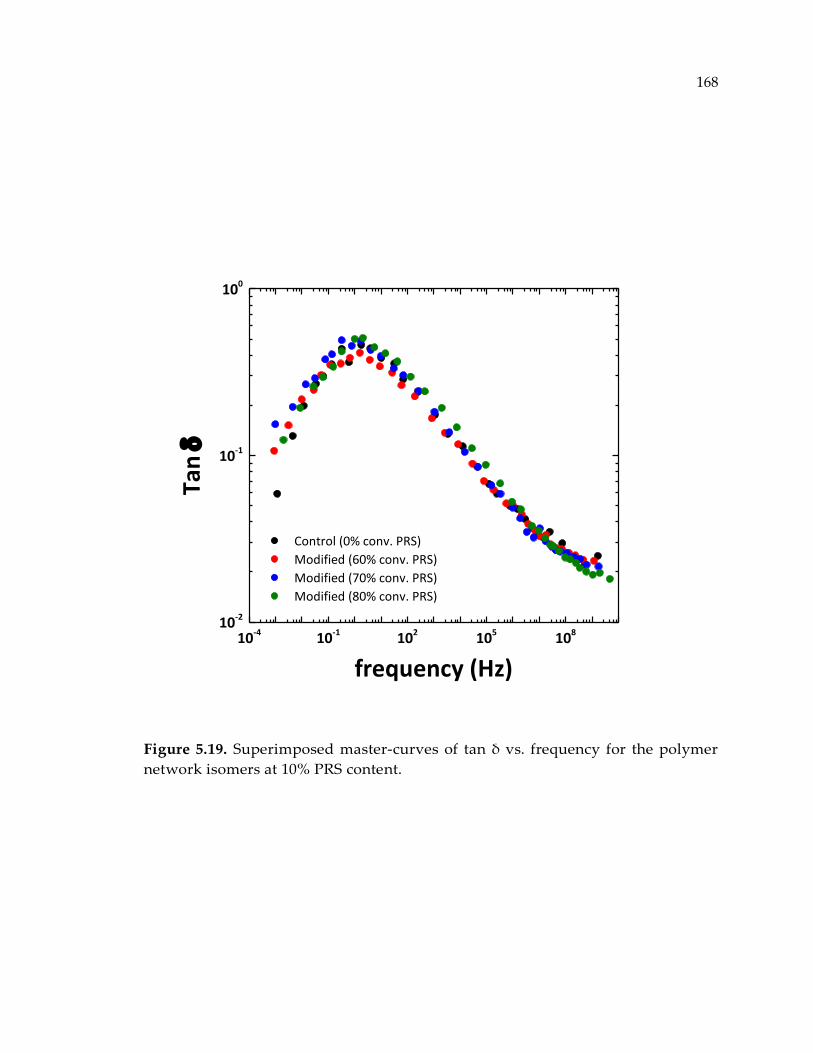
168
Figure 5.19. Superimposed master-curves of tan δ vs. frequency for the polymer
network isomers at 10% PRS content.
10-4 10-1 102 105 10810-2
10-1
100
Control (0% conv. PRS)
Modified (60% conv. PRS)
Modified (70% conv. PRS)
Modified (80% conv. PRS)
Tan
frequency (Hz)
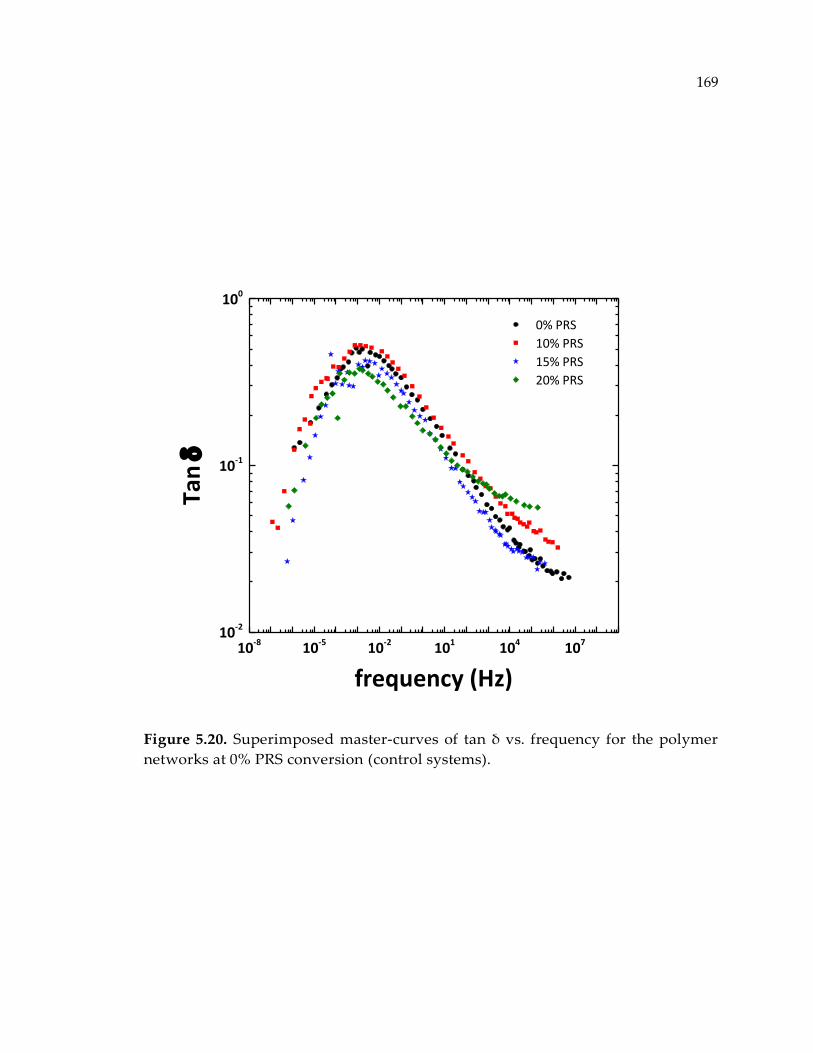
169
Figure 5.20. Superimposed master-curves of tan δ vs. frequency for the polymer
networks at 0% PRS conversion (control systems).
10-8 10-5 10-2 101 104 10710-2
10-1
100
0% PRS
10% PRS
15% PRS
20% PRS
Tan
frequency (Hz)
170
While the tan δ vs. frequency graphs look identical (Figure 5.19), the tan δ graphs
of the control samples at various PRS content represent a reduction in peak area as
PRS content goes up (Figure 5.20).
Accordingly, the activation energy of the α-transition was measured for each of the
systems based on the equation (5.1). The values of Ea are shown in Figures 5.21 and
5.22 for the PRS made from Jeffamine D-4000 and Jeffamine D-2000, respectively.
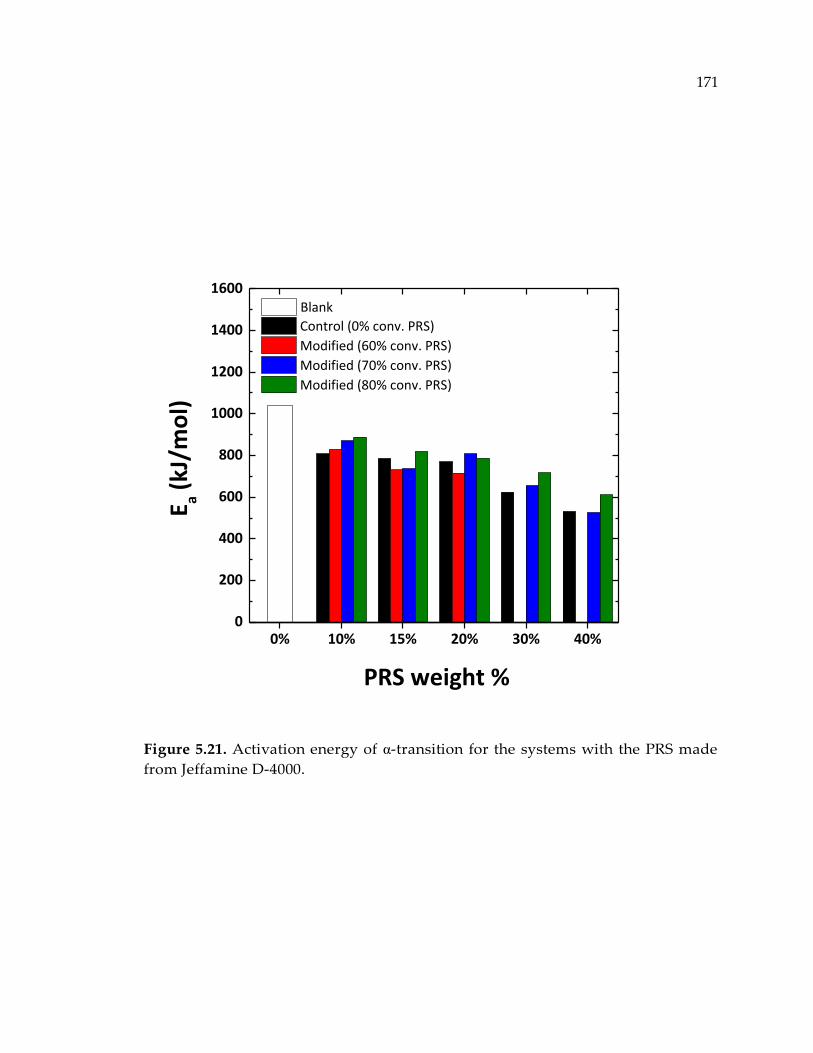
171
Figure 5.21. Activation energy of α-transition for the systems with the PRS made
from Jeffamine D-4000.
0% 10% 15% 20% 30% 40%0
200
400
600
800
1000
1200
1400
1600
Control (0% conv. PRS)
Modified (60% conv. PRS)
Modified (70% conv. PRS)
Modified (80% conv. PRS)
PRS weight %
E a (kJ
/mo
l)
Blank
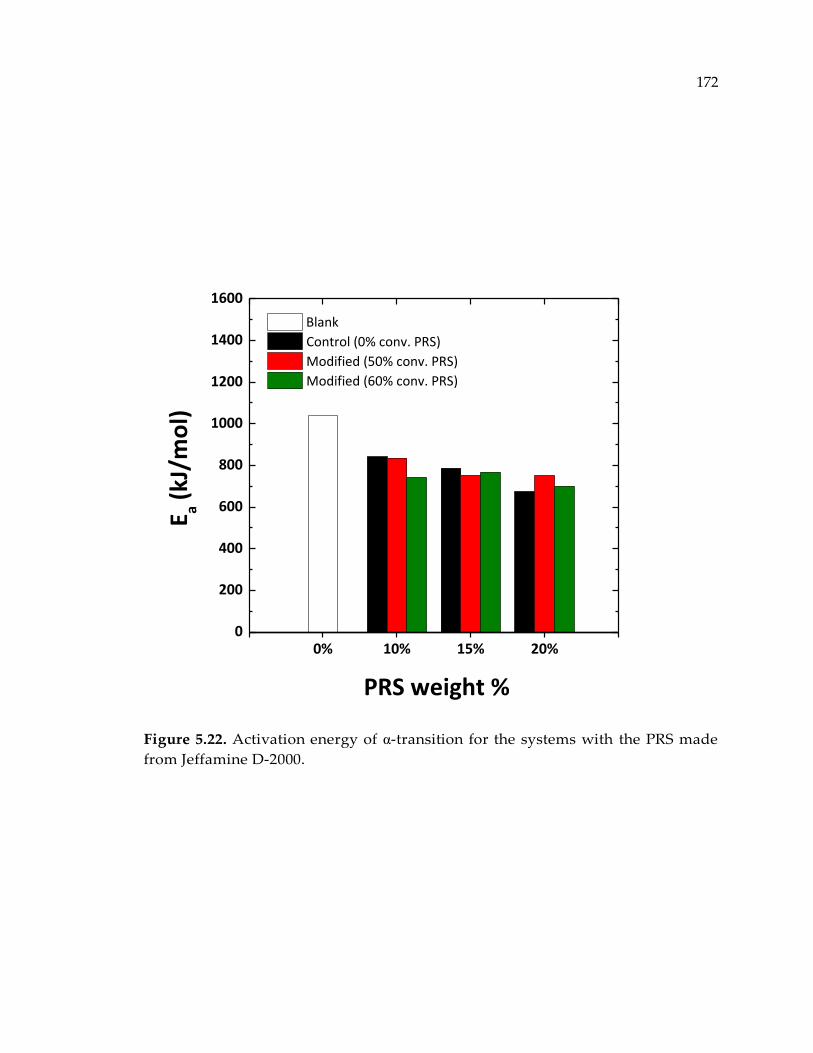
172
Figure 5.22. Activation energy of α-transition for the systems with the PRS made
from Jeffamine D-2000.
0% 10% 15% 20%0
200
400
600
800
1000
1200
1400
1600
Control (0% conv. PRS)
Modified (50% conv. PRS)
Modified (60% conv. PRS)
PRS weight %
E a (kJ
/mo
l)
Blank
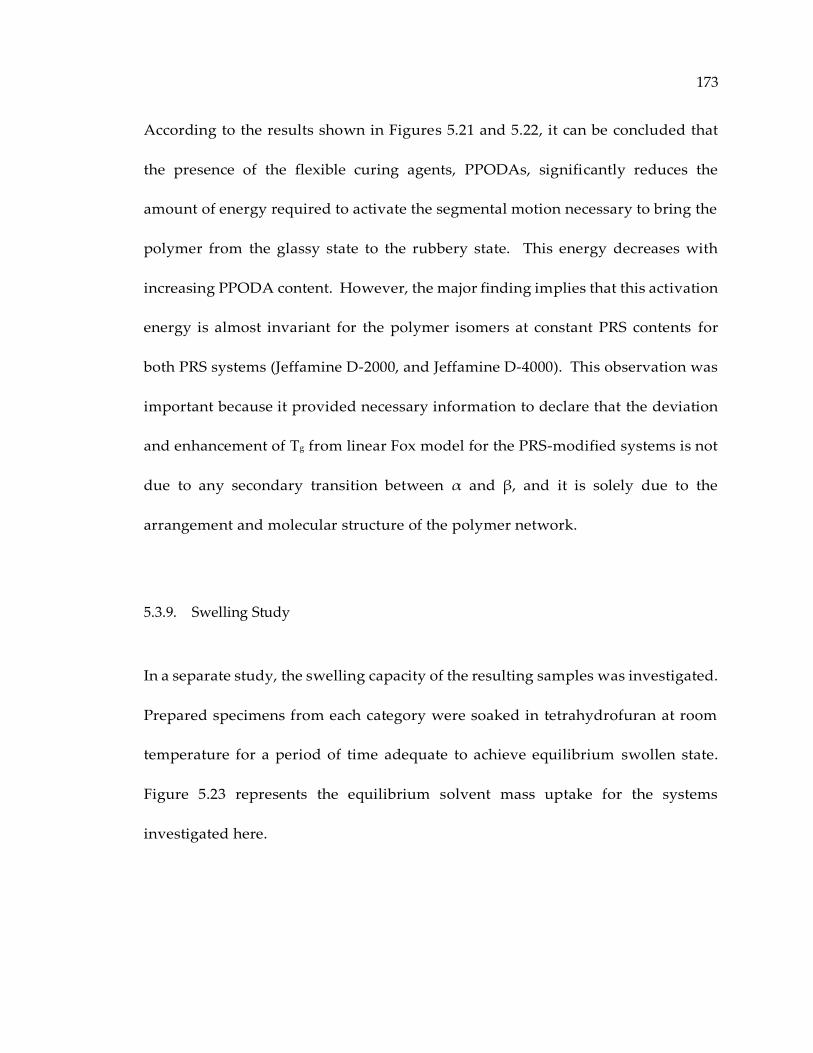
173
According to the results shown in Figures 5.21 and 5.22, it can be concluded that
the presence of the flexible curing agents, PPODAs, significantly reduces the
amount of energy required to activate the segmental motion necessary to bring the
polymer from the glassy state to the rubbery state. This energy decreases with
increasing PPODA content. However, the major finding implies that this activation
energy is almost invariant for the polymer isomers at constant PRS contents for
both PRS systems (Jeffamine D-2000, and Jeffamine D-4000). This observation was
important because it provided necessary information to declare that the deviation
and enhancement of Tg from linear Fox model for the PRS-modified systems is not
due to any secondary transition between α and β, and it is solely due to the
arrangement and molecular structure of the polymer network.
5.3.9. Swelling Study
In a separate study, the swelling capacity of the resulting samples was investigated.
Prepared specimens from each category were soaked in tetrahydrofuran at room
temperature for a period of time adequate to achieve equilibrium swollen state.
Figure 5.23 represents the equilibrium solvent mass uptake for the systems
investigated here.
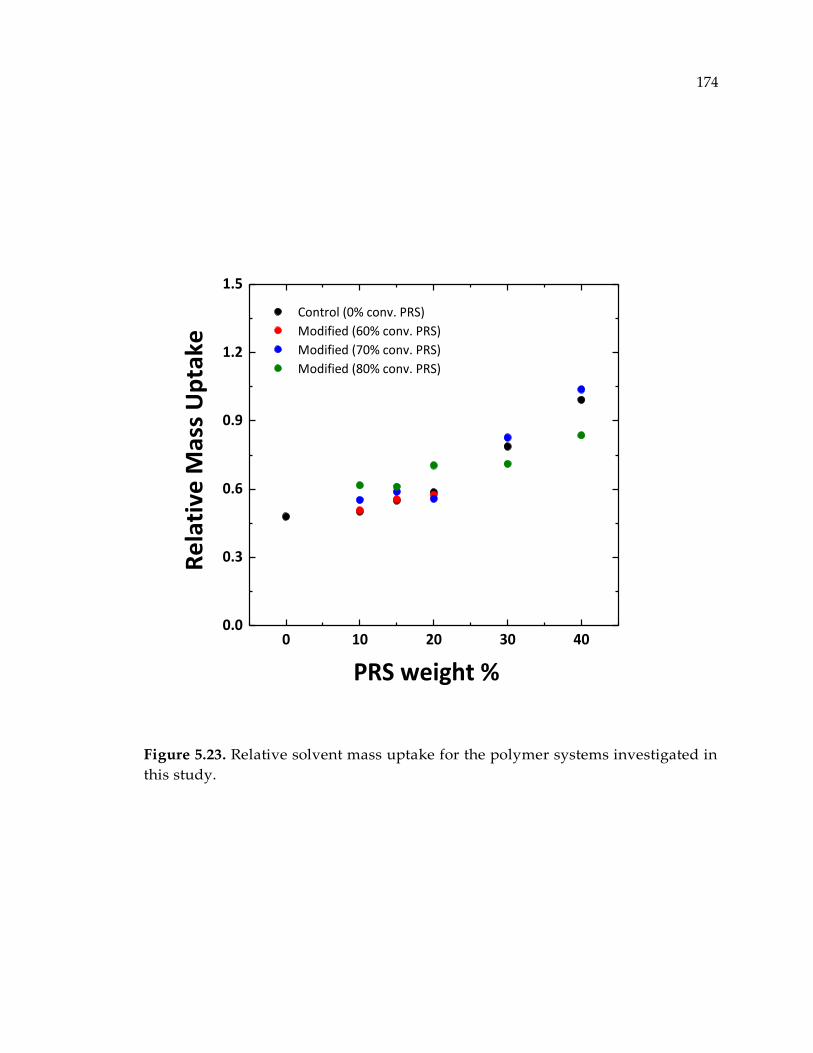
174
Figure 5.23. Relative solvent mass uptake for the polymer systems investigated in
this study.
0 10 20 30 400.0
0.3
0.6
0.9
1.2
1.5
Control (0% conv. PRS)
Modified (60% conv. PRS)
Modified (70% conv. PRS)
Modified (80% conv. PRS)
Re
lati
ve M
ass
Up
take
PRS weight %
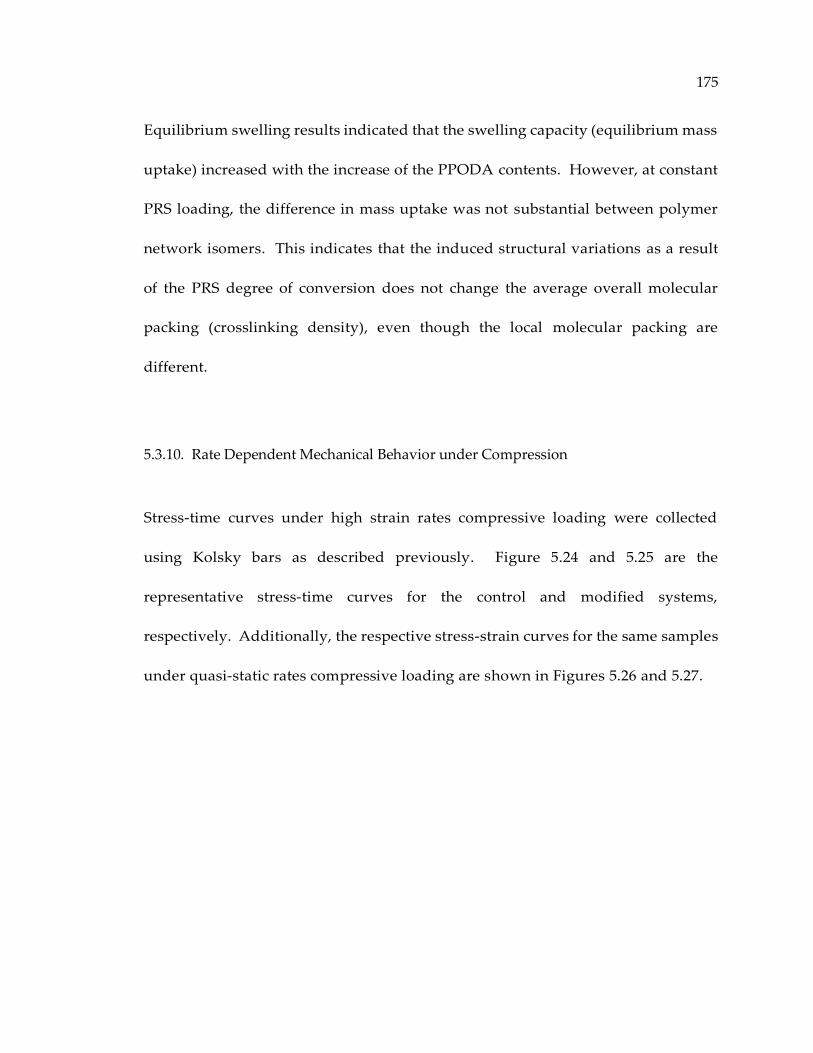
175
Equilibrium swelling results indicated that the swelling capacity (equilibrium mass
uptake) increased with the increase of the PPODA contents. However, at constant
PRS loading, the difference in mass uptake was not substantial between polymer
network isomers. This indicates that the induced structural variations as a result
of the PRS degree of conversion does not change the average overall molecular
packing (crosslinking density), even though the local molecular packing are
different.
5.3.10. Rate Dependent Mechanical Behavior under Compression
Stress-time curves under high strain rates compressive loading were collected
using Kolsky bars as described previously. Figure 5.24 and 5.25 are the
representative stress-time curves for the control and modified systems,
respectively. Additionally, the respective stress-strain curves for the same samples
under quasi-static rates compressive loading are shown in Figures 5.26 and 5.27.
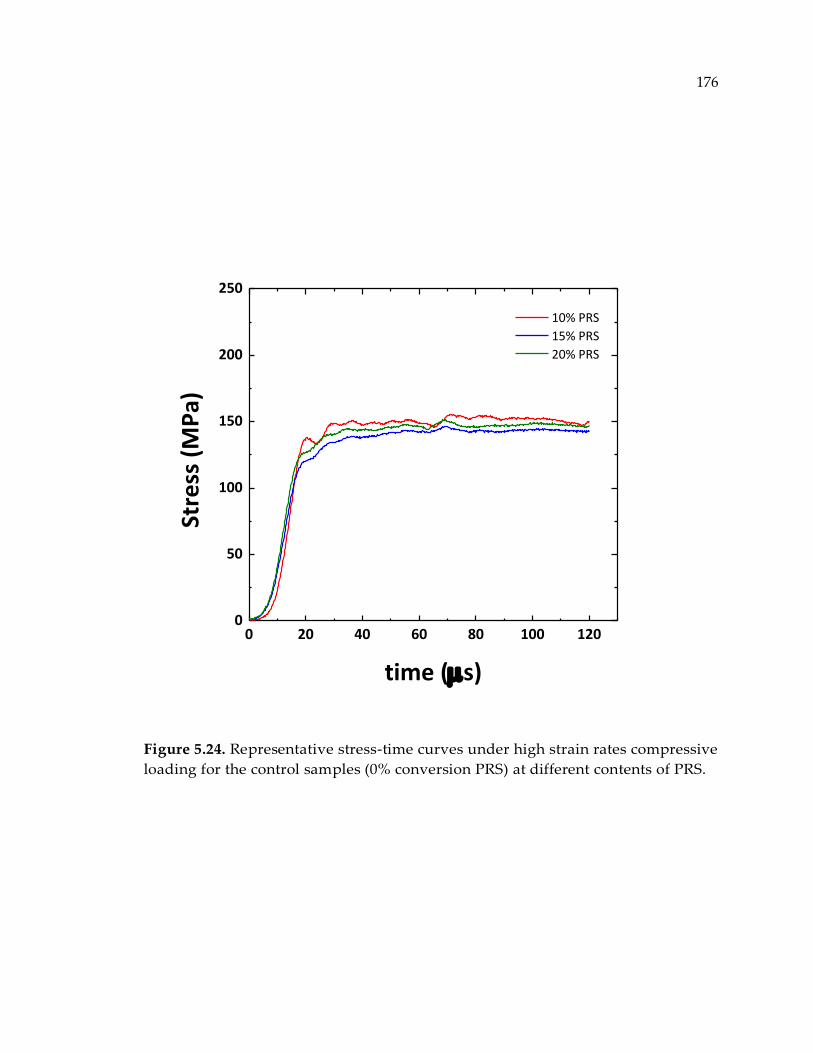
176
Figure 5.24. Representative stress-time curves under high strain rates compressive
loading for the control samples (0% conversion PRS) at different contents of PRS.
0 20 40 60 80 100 1200
50
100
150
200
250
10% PRS
15% PRS
20% PRS
Stre
ss (
MP
a)
time (s)
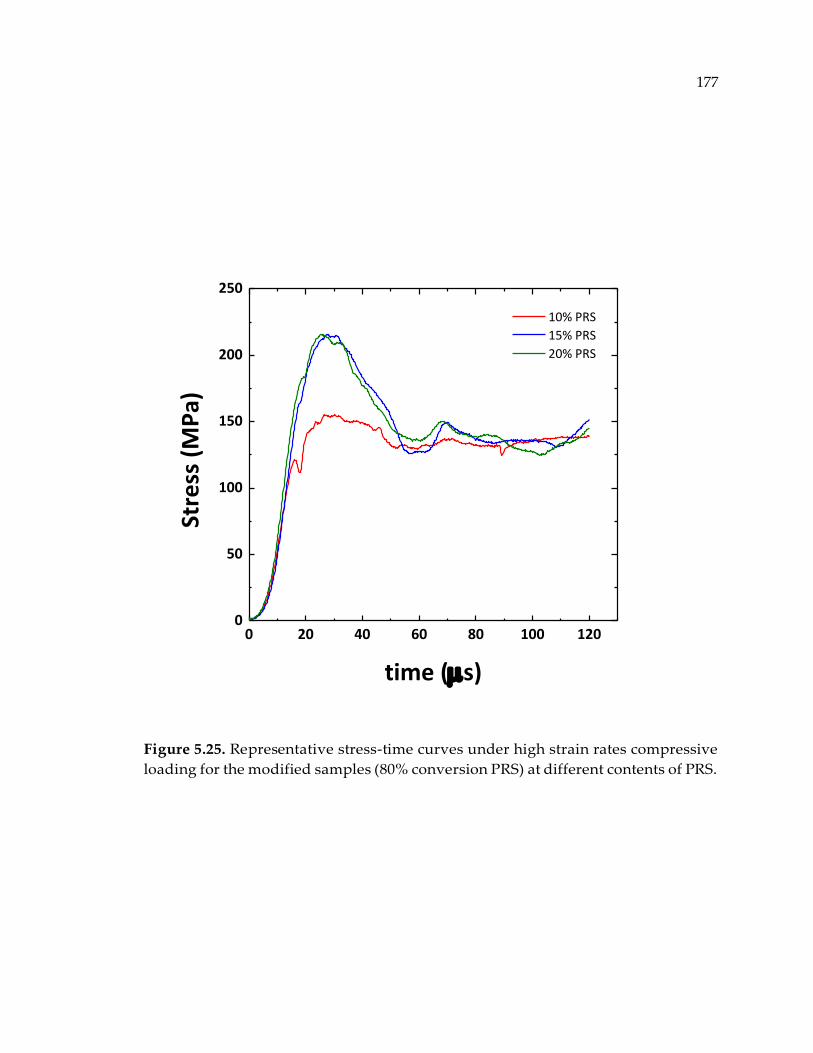
177
Figure 5.25. Representative stress-time curves under high strain rates compressive
loading for the modified samples (80% conversion PRS) at different contents of PRS.
0 20 40 60 80 100 1200
50
100
150
200
250
10% PRS
15% PRS
20% PRS
Stre
ss (
MP
a)
time (s)
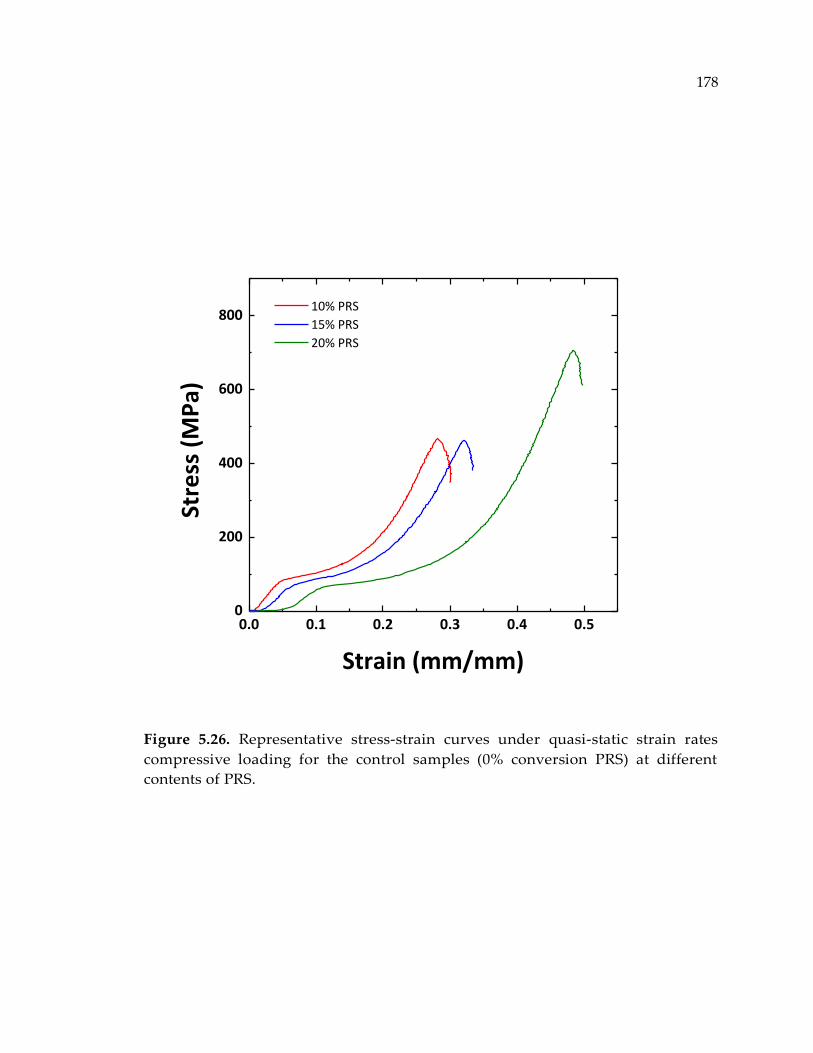
178
Figure 5.26. Representative stress-strain curves under quasi-static strain rates
compressive loading for the control samples (0% conversion PRS) at different
contents of PRS.
0.0 0.1 0.2 0.3 0.4 0.50
200
400
600
800 10% PRS
15% PRS
20% PRS
Stre
ss (
MP
a)
Strain (mm/mm)
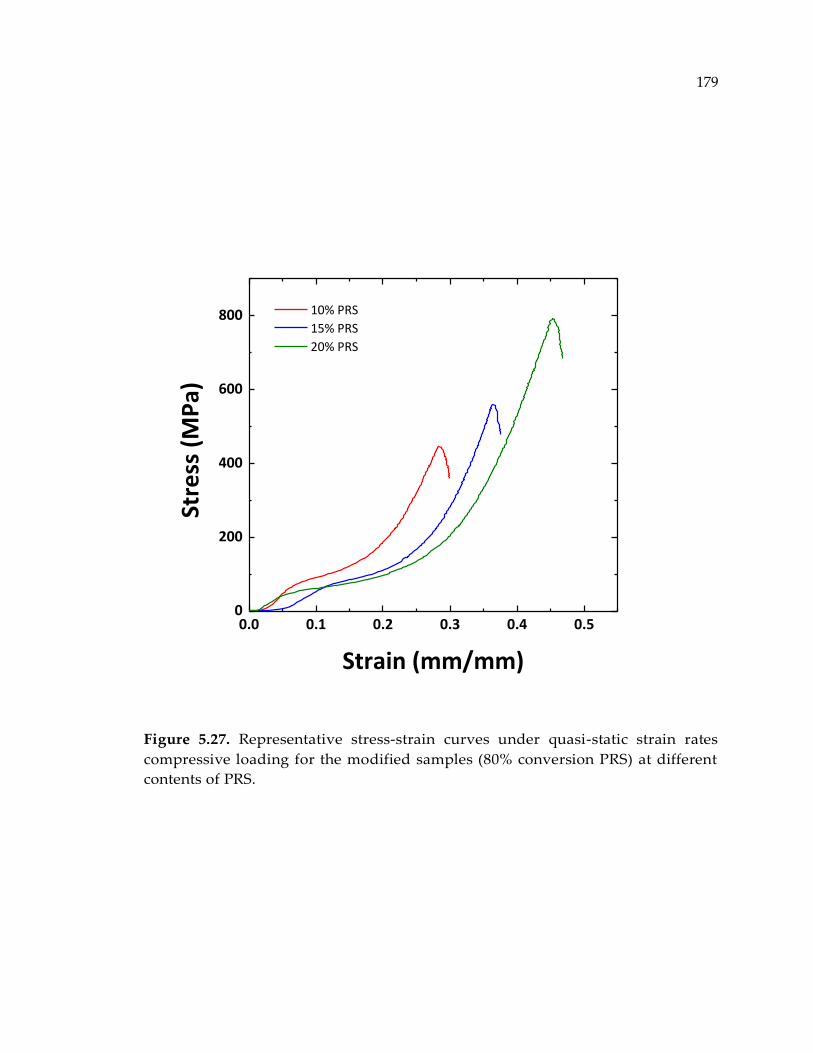
179
Figure 5.27. Representative stress-strain curves under quasi-static strain rates
compressive loading for the modified samples (80% conversion PRS) at different
contents of PRS.
0.0 0.1 0.2 0.3 0.4 0.50
200
400
600
800 10% PRS
15% PRS
20% PRS
Stre
ss (
MP
a)
Strain (mm/mm)

180
Accordingly, Figures 5.28 and 5.29 show the average values of Young’s modulus
for each of the synthesized polymer networks under quasi-static strain rates and
high strain rates, respectively. The error bars associated with each data point are
measured from at least 6 replicates. Results clearly imply that increasing the
Jeffamine content decreases the elastic modulus for both quasi-static strain rates
and high strain rates.
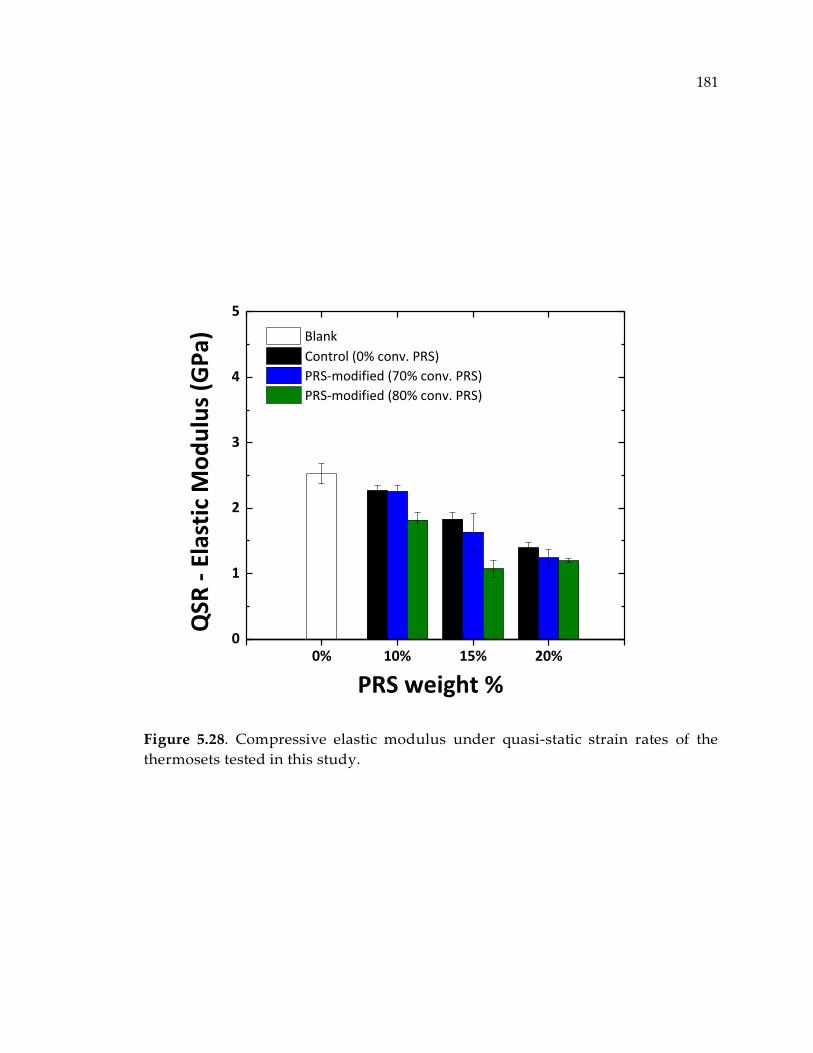
181
Figure 5.28. Compressive elastic modulus under quasi-static strain rates of the
thermosets tested in this study.
0% 10% 15% 20%0
1
2
3
4
5
Control (0% conv. PRS)
PRS-modified (70% conv. PRS)
PRS-modified (80% conv. PRS)
PRS weight %
QSR
- E
last
ic M
od
ulu
s (G
Pa)
Blank
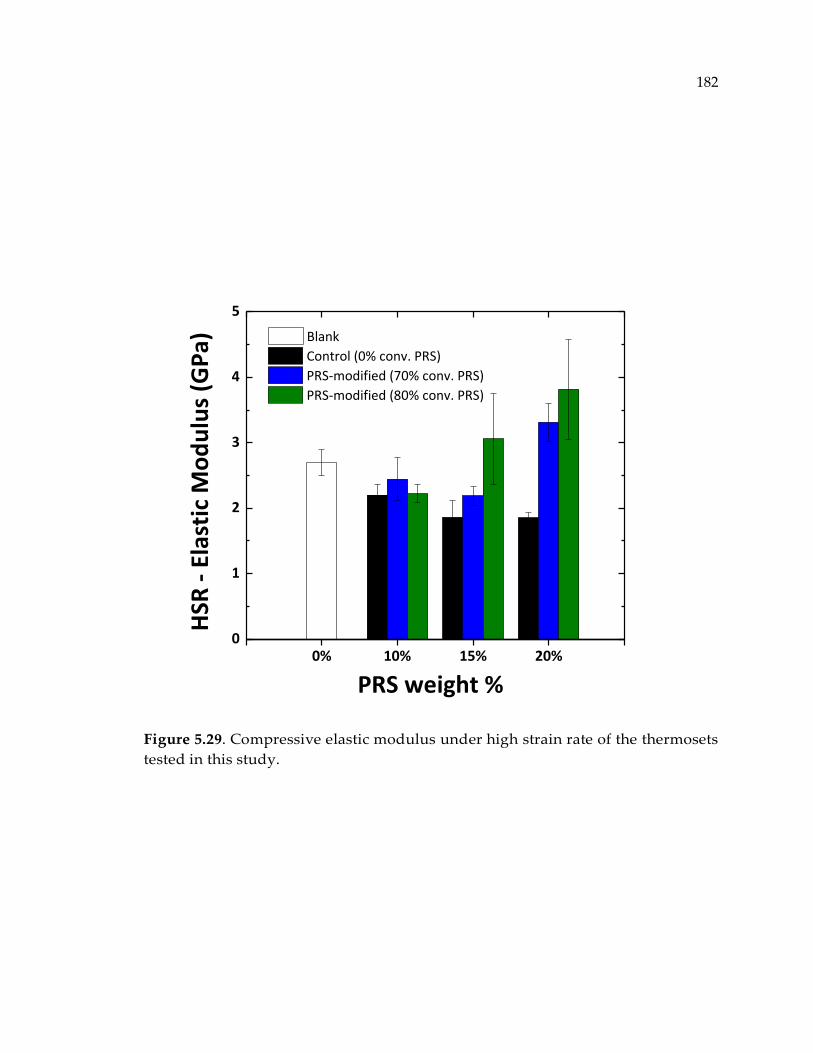
182
Figure 5.29. Compressive elastic modulus under high strain rate of the thermosets
tested in this study.
0% 10% 15% 20%0
1
2
3
4
5
PRS weight %
HSR
- E
last
ic M
od
ulu
s (G
Pa)
Control (0% conv. PRS)
PRS-modified (70% conv. PRS)
PRS-modified (80% conv. PRS)
Blank
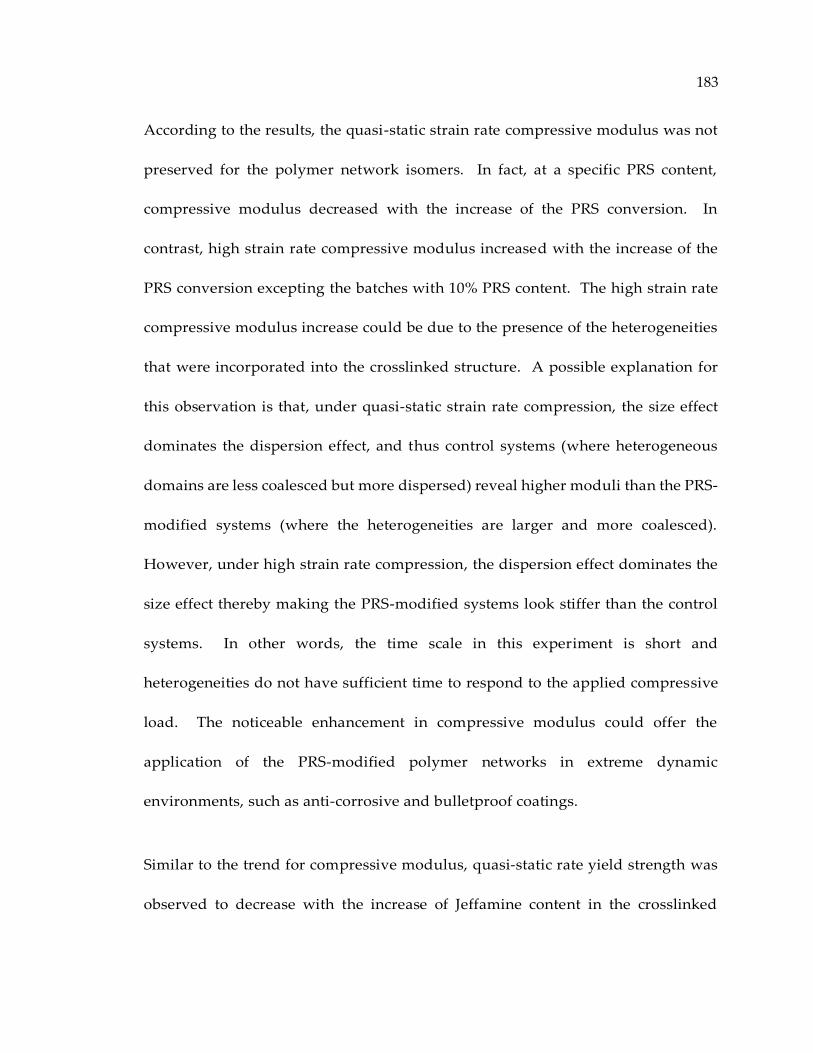
183
According to the results, the quasi-static strain rate compressive modulus was not
preserved for the polymer network isomers. In fact, at a specific PRS content,
compressive modulus decreased with the increase of the PRS conversion. In
contrast, high strain rate compressive modulus increased with the increase of the
PRS conversion excepting the batches with 10% PRS content. The high strain rate
compressive modulus increase could be due to the presence of the heterogeneities
that were incorporated into the crosslinked structure. A possible explanation for
this observation is that, under quasi-static strain rate compression, the size effect
dominates the dispersion effect, and thus control systems (where heterogeneous
domains are less coalesced but more dispersed) reveal higher moduli than the PRS-
modified systems (where the heterogeneities are larger and more coalesced).
However, under high strain rate compression, the dispersion effect dominates the
size effect thereby making the PRS-modified systems look stiffer than the control
systems. In other words, the time scale in this experiment is short and
heterogeneities do not have sufficient time to respond to the applied compressive
load. The noticeable enhancement in compressive modulus could offer the
application of the PRS-modified polymer networks in extreme dynamic
environments, such as anti-corrosive and bulletproof coatings.
Similar to the trend for compressive modulus, quasi-static rate yield strength was
observed to decrease with the increase of Jeffamine content in the crosslinked
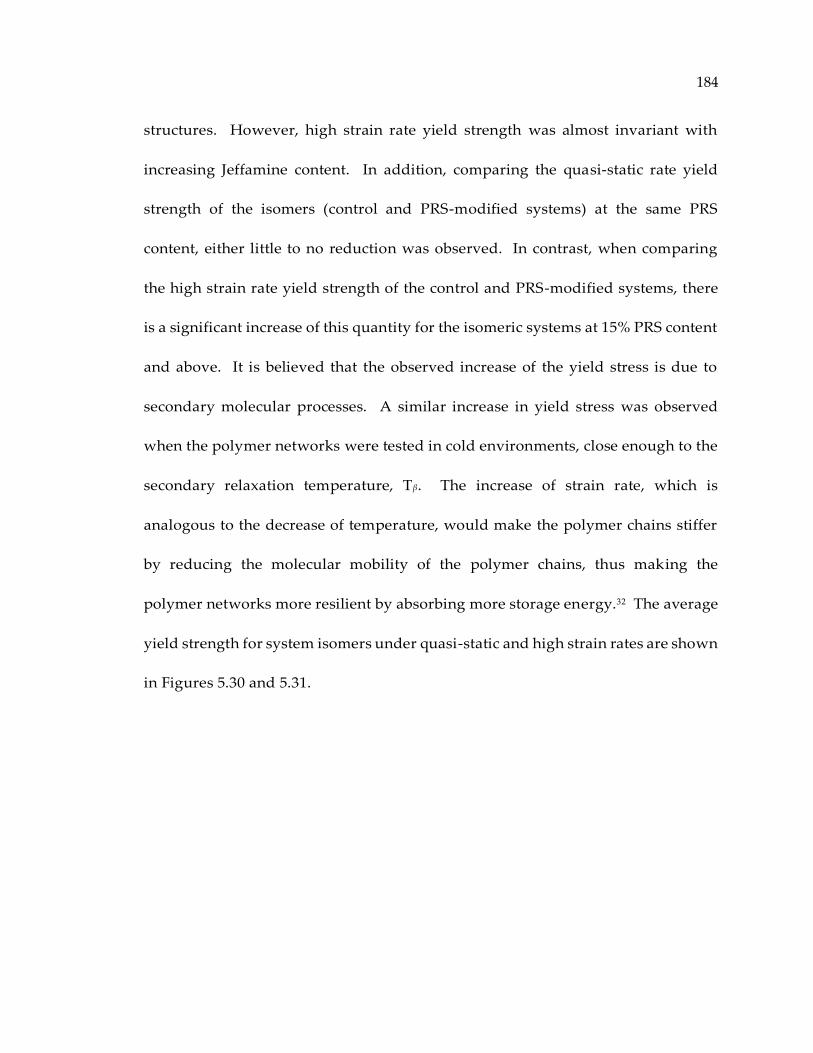
184
structures. However, high strain rate yield strength was almost invariant with
increasing Jeffamine content. In addition, comparing the quasi-static rate yield
strength of the isomers (control and PRS-modified systems) at the same PRS
content, either little to no reduction was observed. In contrast, when comparing
the high strain rate yield strength of the control and PRS-modified systems, there
is a significant increase of this quantity for the isomeric systems at 15% PRS content
and above. It is believed that the observed increase of the yield stress is due to
secondary molecular processes. A similar increase in yield stress was observed
when the polymer networks were tested in cold environments, close enough to the
secondary relaxation temperature, Tβ. The increase of strain rate, which is
analogous to the decrease of temperature, would make the polymer chains stiffer
by reducing the molecular mobility of the polymer chains, thus making the
polymer networks more resilient by absorbing more storage energy.32 The average
yield strength for system isomers under quasi-static and high strain rates are shown
in Figures 5.30 and 5.31.
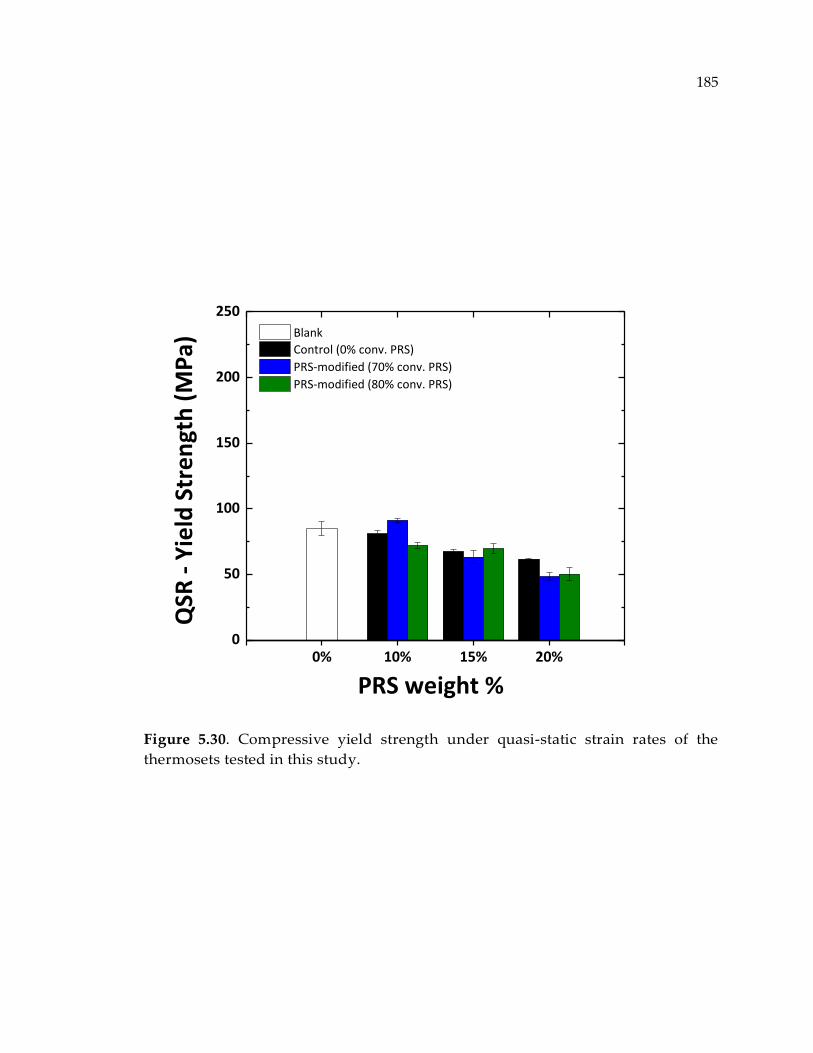
185
Figure 5.30. Compressive yield strength under quasi-static strain rates of the
thermosets tested in this study.
0% 10% 15% 20%0
50
100
150
200
250
Control (0% conv. PRS)
PRS-modified (70% conv. PRS)
PRS-modified (80% conv. PRS)
PRS weight %
QSR
- Y
ield
Str
en
gth
(M
Pa)
Blank
186
Figure 5.31. Compressive yield strength under high strain rates of the thermosets
tested in this study.
0% 10% 15% 20%0
50
100
150
200
250
PRS weight %
HSR
- Y
ield
Str
en
gth
(M
Pa)
Control (0% conv. PRS)
PRS-modified (70% conv. PRS)
PRS-modified (80% conv. PRS)
Blank
187
In addition to the compression tests, SAXS was conducted on the disc-shape
specimens before and after quasi-static compression using a Rigaku SAXS
apparatus in the centralized research facilities at Drexel University. The specimens
before compression were labelled as “relaxed” samples. These samples were
deformed under a uniaxial compressive loading (using an INSTRON apparatus)
up to certain strain values of about 30%. The resulting specimens were labelled as
“compressed” samples.
For some of the samples, Small Angle X-ray Scattering (SAXS) was conducted
before and after compression test. These results are shown in the Figure 5.32. It
was shown that the peak positions do not significantly shift to lower or higher q
values, meaning that the size of the heterogeneities are essentially invariant during
compression, even though their shapes might vary.
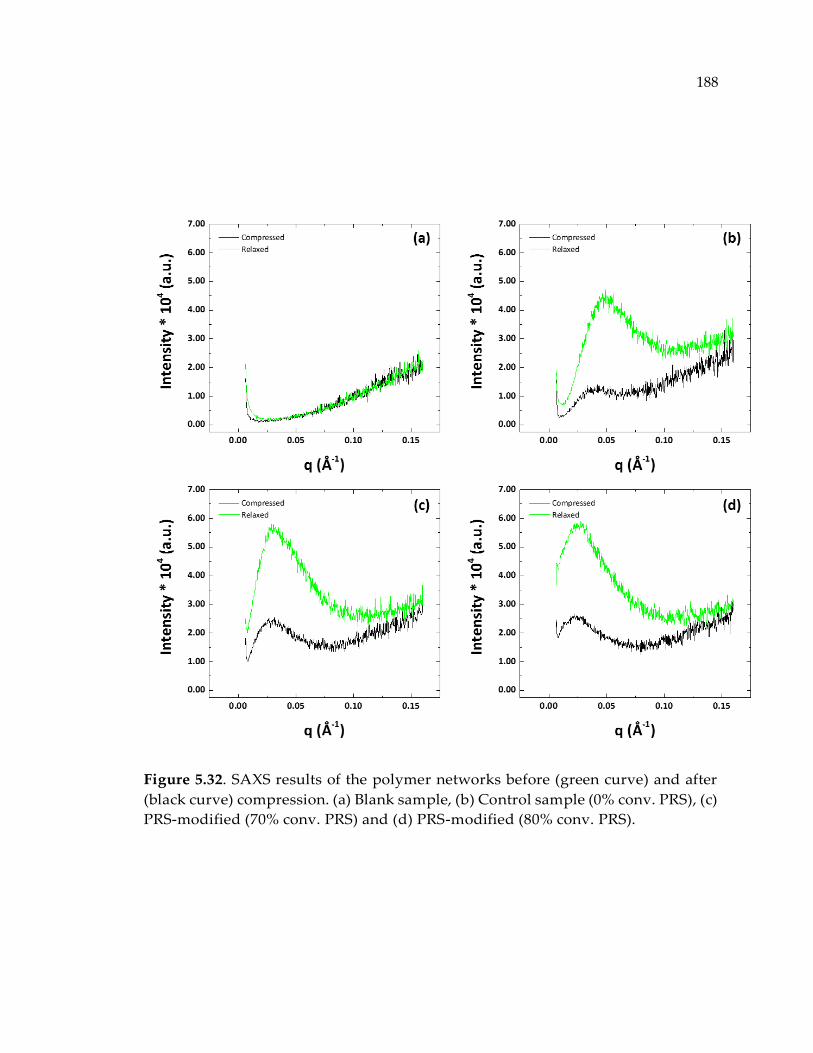
188
Figure 5.32. SAXS results of the polymer networks before (green curve) and after
(black curve) compression. (a) Blank sample, (b) Control sample (0% conv. PRS), (c)
PRS-modified (70% conv. PRS) and (d) PRS-modified (80% conv. PRS).
189
5.3.11. Effect of the Molecular Weight of the Aliphatic Curing Agents on Cure Kinetics
of Epoxy-Amine Reactions
As discussed, the extent of the epoxy-amine curing reactions were accurately
measured using FTIR in nearIR region. However, the reactivity ratio of the
functional groups “substitution effect” has not been investigated. It is well-known
from literature that the ratio of primary amine (NH2) reactivity to the secondary
amine reactivity (NH) (also known as the “substitution factor”) is critical in
determining the structural topology during reactions.19, 33
Some kinetic models assume that the reactivity of primary amines and secondary
amines are the same. Since primary amines have two reactive hydrogen atoms,
equal reactivity essentially yields k2/k1 = 0.5. However, in reality the reactivity of
primary amine is higher than that of the secondary amine resulting lower
substitution factors (< 0.5).34-36
For the systems examined here, it is important to consider the effect of substitution
factor on structural topology. Considering that both k1 and k2 as the reaction rate
constants show Arrhenius dependence to temperature:
190
𝑘1 = 𝐴1𝑒𝑥𝑝 (−𝐸𝑎,1
𝑅𝑇) (5.2)
𝑘2 = 𝐴2𝑒𝑥𝑝 (−𝐸𝑎,2
𝑅𝑇) (5.3)
Therefore,
𝑘2
𝑘1=
𝐴2
𝐴1𝑒𝑥𝑝 (
𝐸𝑎,1 − 𝐸𝑎,2
𝑅𝑇) (5.4)
where 𝐴1 𝑎𝑛𝑑 𝐴2 are the pre-exponential factors, and 𝐸𝑎,1 𝑎𝑛𝑑 𝐸𝑎,2 are the
corresponding activation energies, respectively.
Equation 5.4 shows the dependence of the substitution factor, and subsequently
network topology, to temperature. Hence, to eliminate the effect of temperature on
network topology, polymer system isomers were cured (and post-cured) at the
same curing conditions.
We have conducted in-situ FTIR spectroscopy to investigate the substitution effect
of the aliphatic curing agents, polyetheramines (PEAs), with different chain lengths
when reacting with the DGEBA at the same curing temperature of 80 °C.
Accordingly, blends of stoichiometric amounts of DGEBA and PEAs with
molecular weights of 230, 400, 2000, and 4000 g/mol were prepared. These systems

191
were labelled as DGEBA-PEA230, DGEBA-PEA400, DGEBA-PEA2000, and DGEBA-
PEA4000, respectively.
A NearIR spectrometer Nexus 870 (Thermo Nicolet Corp.) with CaF2 beam splitter
was employed for this purpose. Capillary glass tubes (ID = 1.6 + 0.05 mm) were
used to hold the samples. The nIR spectra were collected at a resolution of 4 cm -1
in absorbance mode. The resulting spectra at each time was measured from the
average of 32 individual scans. The peaks of interest were the epoxy peak at 4530
cm-1, the primary amine peak at 4925 cm-1, and the primary/secondary amine peak
at 6510 cm-1.18
Considering the reaction mechanism, the extent of epoxy-amine reactions in terms
of epoxy group (α) and N-H bands (β) from the peak area of the oxirane rings and
N-H groups in absorption mode is defined as37
𝛼𝑒 =𝐴𝑒(0) − 𝐴𝑒(𝑡)
𝐴𝑒(0) (5.5)
𝛽𝑁−𝐻 =𝐴𝑁−𝐻(0) − 𝐴𝑁−𝐻(𝑡)
𝐴𝑁−𝐻(0) (5.6)
where “A” is the absorbance peak area and subscripts “e” and “N-H” represent the
epoxy and amine, at “0” initial and “t” time t.
192
It is well-known that the epoxy-amine curing reaction are autocatalytic, which
means that presence of OH group in the reaction (either coming to the reaction
mixture as an impurity or forming during epoxy ring opening mechanisms)
catalyzes the reaction.38-40 Two kinetic schemes are generally considered for
modeling the epoxy-amine reactions. A non-catalyzed and an auto-catalyzed.
The auto-catalyzed pathway was considered for the numerical investigations, since
the non-catalyzed path poorly describes the reaction phenomenon. Accordingly,
the reaction paths are
[𝐸] + [𝑃𝐴] + [𝑂𝐻]𝑘1⇒ [𝑆𝐴] + 2[𝑂𝐻] (5.7)
[𝐸] + [𝑆𝐴] + [𝑂𝐻]𝑘2⇒ [𝑇𝐴] + 2[𝑂𝐻] (5.8)
where [𝐸], [𝑃𝐴], [𝑆𝐴], [𝑇𝐴] 𝑎𝑛𝑑 [𝑂𝐻] are the molar concentrations of the epoxy,
primary amine, secondary amine, tertiary amine, and the hydroxyl groups,
respectively.
These concentrations at each stage of polymerization can be measured from the
extents of reaction α and β, and mass balance equations as follows:
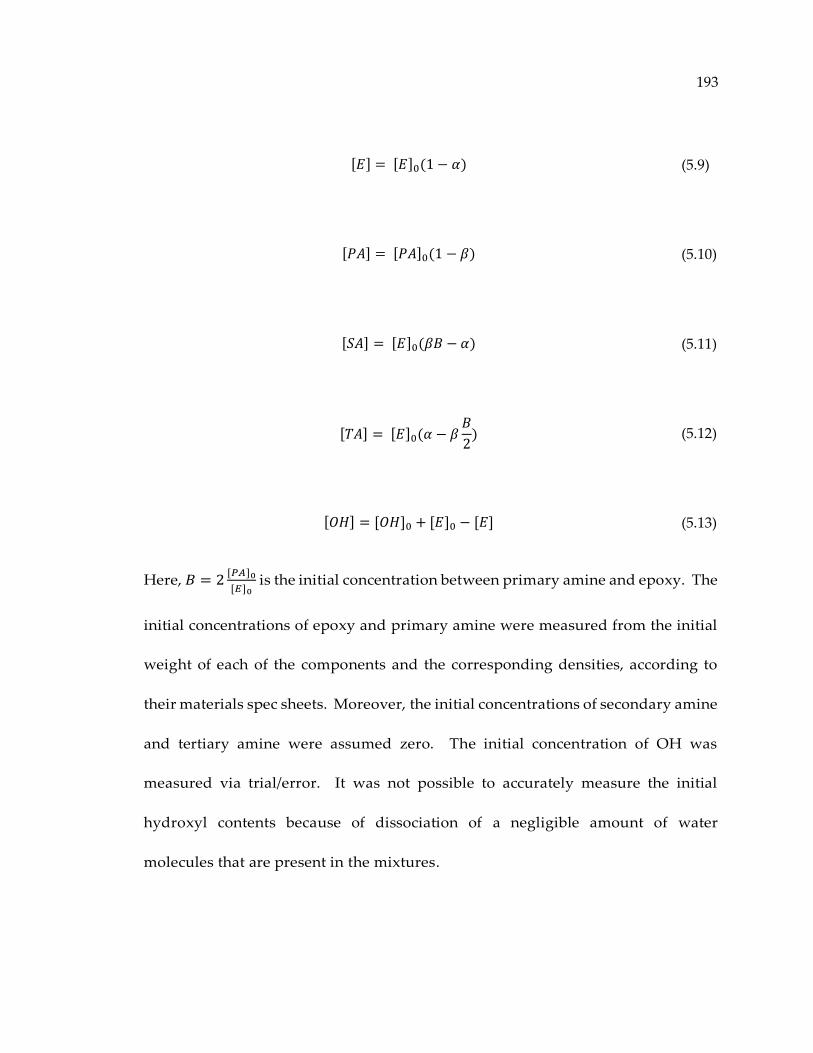
193
[𝐸] = [𝐸]0(1 − 𝛼) (5.9)
[𝑃𝐴] = [𝑃𝐴]0(1 − 𝛽) (5.10)
[𝑆𝐴] = [𝐸]0(𝛽𝐵 − 𝛼) (5.11)
[𝑇𝐴] = [𝐸]0(𝛼 − 𝛽𝐵
2) (5.12)
[𝑂𝐻] = [𝑂𝐻]0 + [𝐸]0 − [𝐸] (5.13)
Here, 𝐵 = 2[𝑃𝐴]0
[𝐸]0 is the initial concentration between primary amine and epoxy. The
initial concentrations of epoxy and primary amine were measured from the initial
weight of each of the components and the corresponding densities, according to
their materials spec sheets. Moreover, the initial concentrations of secondary amine
and tertiary amine were assumed zero. The initial concentration of OH was
measured via trial/error. It was not possible to accurately measure the initial
hydroxyl contents because of dissociation of a negligible amount of water
molecules that are present in the mixtures.
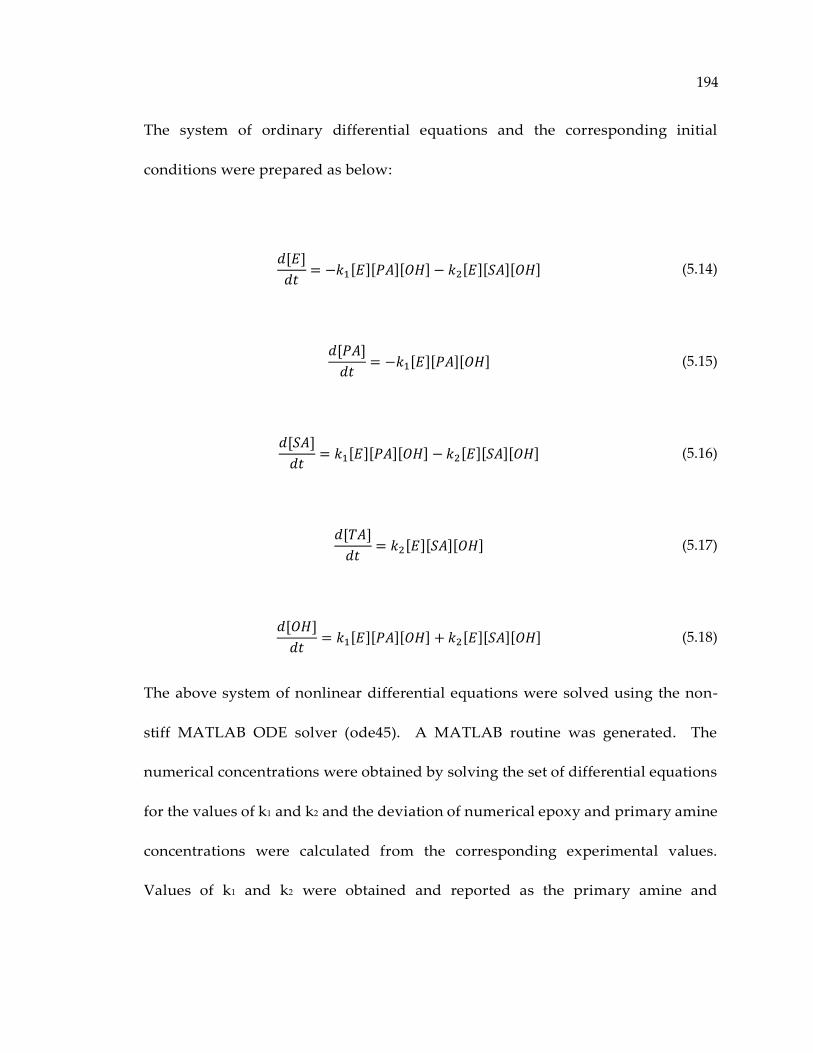
194
The system of ordinary differential equations and the corresponding initial
conditions were prepared as below:
𝑑[𝐸]
𝑑𝑡= −𝑘1[𝐸][𝑃𝐴][𝑂𝐻] − 𝑘2[𝐸][𝑆𝐴][𝑂𝐻] (5.14)
𝑑[𝑃𝐴]
𝑑𝑡= −𝑘1[𝐸][𝑃𝐴][𝑂𝐻] (5.15)
𝑑[𝑆𝐴]
𝑑𝑡= 𝑘1[𝐸][𝑃𝐴][𝑂𝐻] − 𝑘2[𝐸][𝑆𝐴][𝑂𝐻] (5.16)
𝑑[𝑇𝐴]
𝑑𝑡= 𝑘2[𝐸][𝑆𝐴][𝑂𝐻] (5.17)
𝑑[𝑂𝐻]
𝑑𝑡= 𝑘1[𝐸][𝑃𝐴][𝑂𝐻] + 𝑘2[𝐸][𝑆𝐴][𝑂𝐻] (5.18)
The above system of nonlinear differential equations were solved using the non-
stiff MATLAB ODE solver (ode45). A MATLAB routine was generated. The
numerical concentrations were obtained by solving the set of differential equations
for the values of k1 and k2 and the deviation of numerical epoxy and primary amine
concentrations were calculated from the corresponding experimental values.
Values of k1 and k2 were obtained and reported as the primary amine and
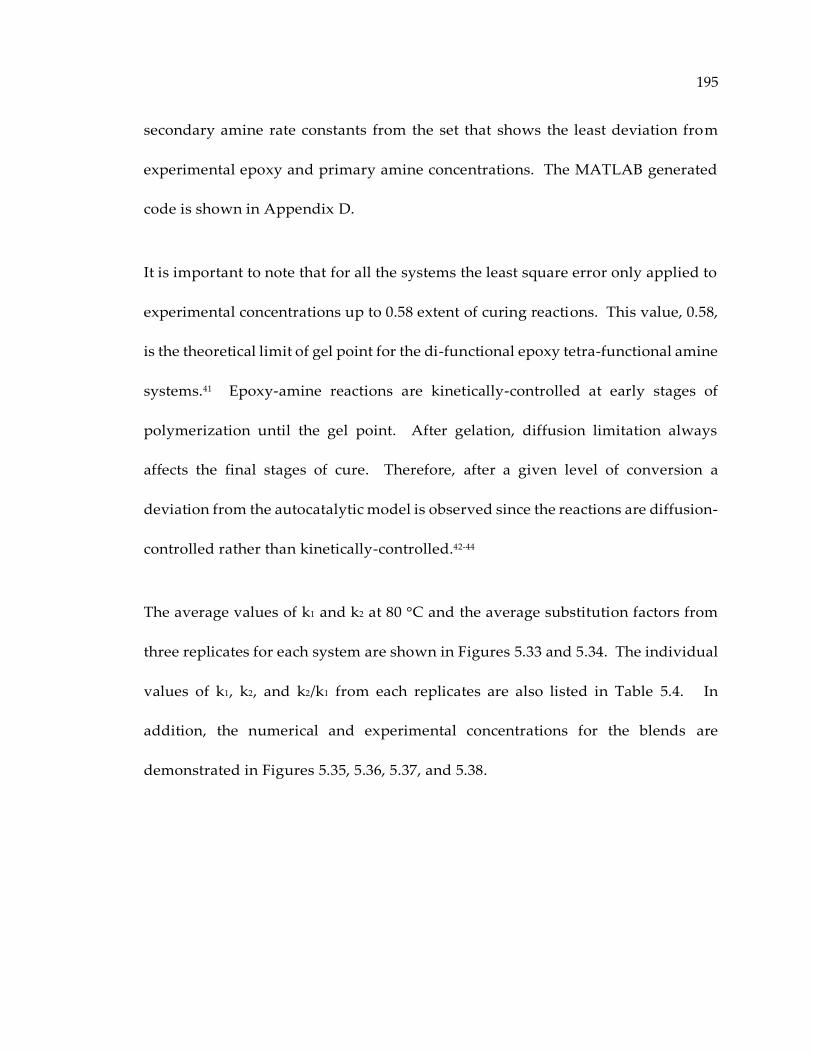
195
secondary amine rate constants from the set that shows the least deviation from
experimental epoxy and primary amine concentrations. The MATLAB generated
code is shown in Appendix D.
It is important to note that for all the systems the least square error only applied to
experimental concentrations up to 0.58 extent of curing reactions. This value, 0.58,
is the theoretical limit of gel point for the di-functional epoxy tetra-functional amine
systems.41 Epoxy-amine reactions are kinetically-controlled at early stages of
polymerization until the gel point. After gelation, diffusion limitation always
affects the final stages of cure. Therefore, after a given level of conversion a
deviation from the autocatalytic model is observed since the reactions are diffusion-
controlled rather than kinetically-controlled.42-44
The average values of k1 and k2 at 80 °C and the average substitution factors from
three replicates for each system are shown in Figures 5.33 and 5.34. The individual
values of k1, k2, and k2/k1 from each replicates are also listed in Table 5.4. In
addition, the numerical and experimental concentrations for the blends are
demonstrated in Figures 5.35, 5.36, 5.37, and 5.38.
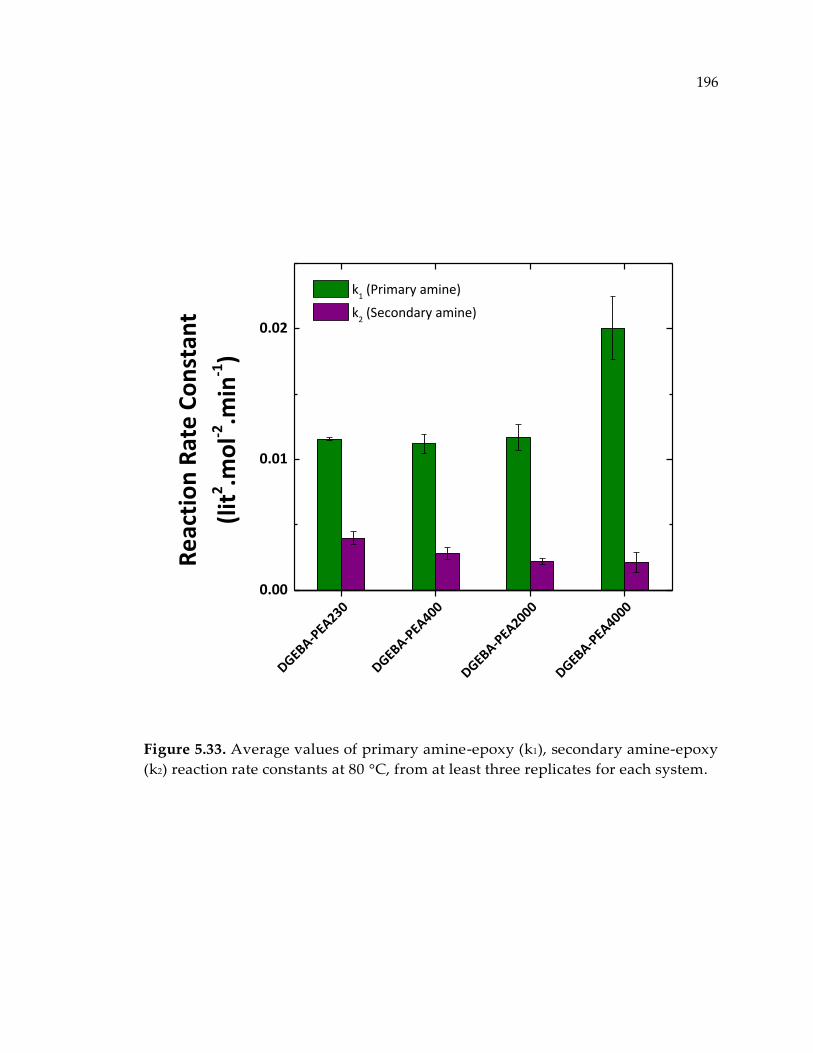
196
Figure 5.33. Average values of primary amine-epoxy (k1), secondary amine-epoxy
(k2) reaction rate constants at 80 °C, from at least three replicates for each system.
DGEBA-PEA230
DGEBA-PEA400
DGEBA-PEA2000
DGEBA-PEA4000
0.00
0.01
0.02
k1 (Primary amine)
k2 (Secondary amine)
Re
acti
on
Rat
e C
on
stan
t
(lit
2.m
ol-2
.min
-1)
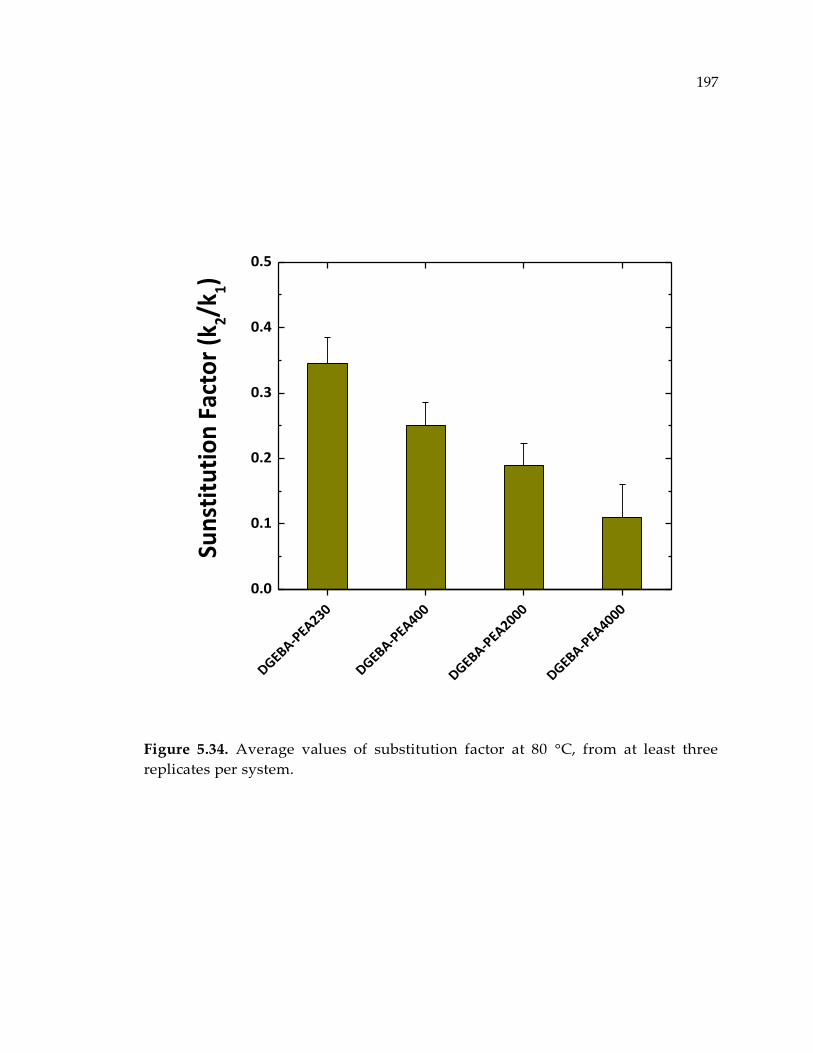
197
Figure 5.34. Average values of substitution factor at 80 °C, from at least three
replicates per system.
DGEBA-PEA230
DGEBA-PEA400
DGEBA-PEA2000
DGEBA-PEA4000
0.0
0.1
0.2
0.3
0.4
0.5
Sun
stit
uti
on
Fac
tor
(k2/k
1)
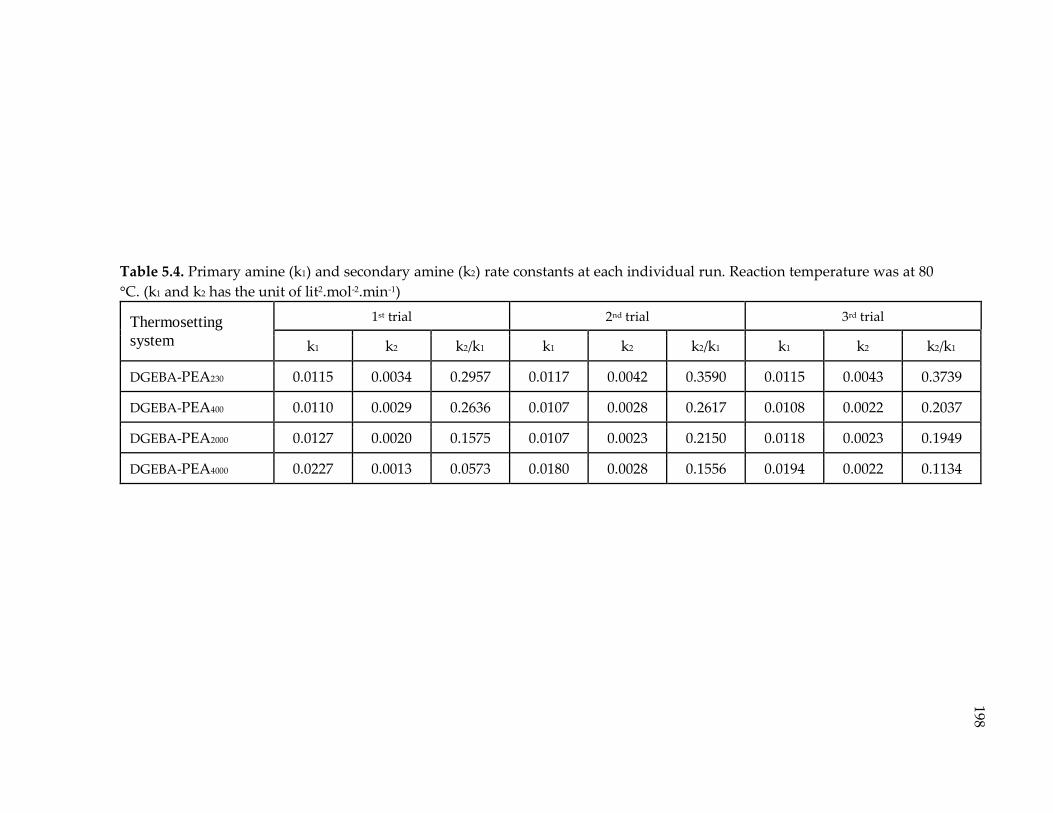
198
Table 5.4. Primary amine (k1) and secondary amine (k2) rate constants at each individual run. Reaction temperature was at 80
°C. (k1 and k2 has the unit of lit2.mol-2.min-1)
Thermosetting
system
1st trial 2nd trial 3rd trial
k1 k2 k2/k1 k1 k2 k2/k1 k1 k2 k2/k1
DGEBA‐PEA230 0.0115 0.0034 0.2957 0.0117 0.0042 0.3590 0.0115 0.0043 0.3739
DGEBA‐PEA400 0.0110 0.0029 0.2636 0.0107 0.0028 0.2617 0.0108 0.0022 0.2037
DGEBA‐PEA2000 0.0127 0.0020 0.1575 0.0107 0.0023 0.2150 0.0118 0.0023 0.1949
DGEBA‐PEA4000 0.0227 0.0013 0.0573 0.0180 0.0028 0.1556 0.0194 0.0022 0.1134
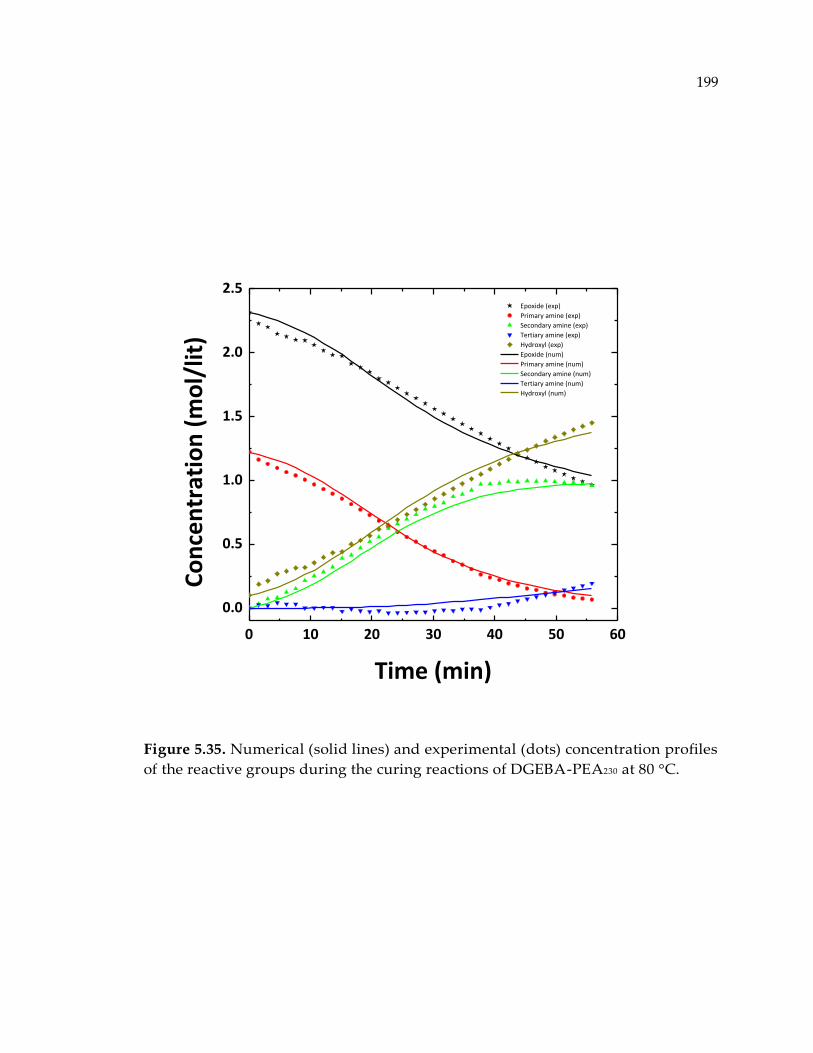
199
Figure 5.35. Numerical (solid lines) and experimental (dots) concentration profiles
of the reactive groups during the curing reactions of DGEBA-PEA230 at 80 °C.
0 10 20 30 40 50 60
0.0
0.5
1.0
1.5
2.0
2.5 Epoxide (exp)
Primary amine (exp)
Secondary amine (exp)
Tertiary amine (exp)
Hydroxyl (exp)
Epoxide (num)
Primary amine (num)
Secondary amine (num)
Tertiary amine (num)
Hydroxyl (num)
Co
nce
ntr
atio
n (
mo
l/lit
)
Time (min)

200
Figure 5.36. Numerical (solid lines) and experimental (dots) concentration profiles
of the reactive groups during the curing reactions of DGEBA-PEA400 at 80 °C.
0 20 40 60 80 100 1200.0
0.5
1.0
1.5
2.0
2.5
3.0
3.5
4.0 Epoxide (exp)
Primary amine (exp)
Secondary amine (exp)
Tertiary amine (exp)
Hydroxyl (exp)
Epoxide (num)
Primary amine (num)
Secondary amine (num)
Tertiary amine (num)
Hydroxyl (num)
Co
nce
ntr
atio
n (
mo
l/lit
)
Time (min)
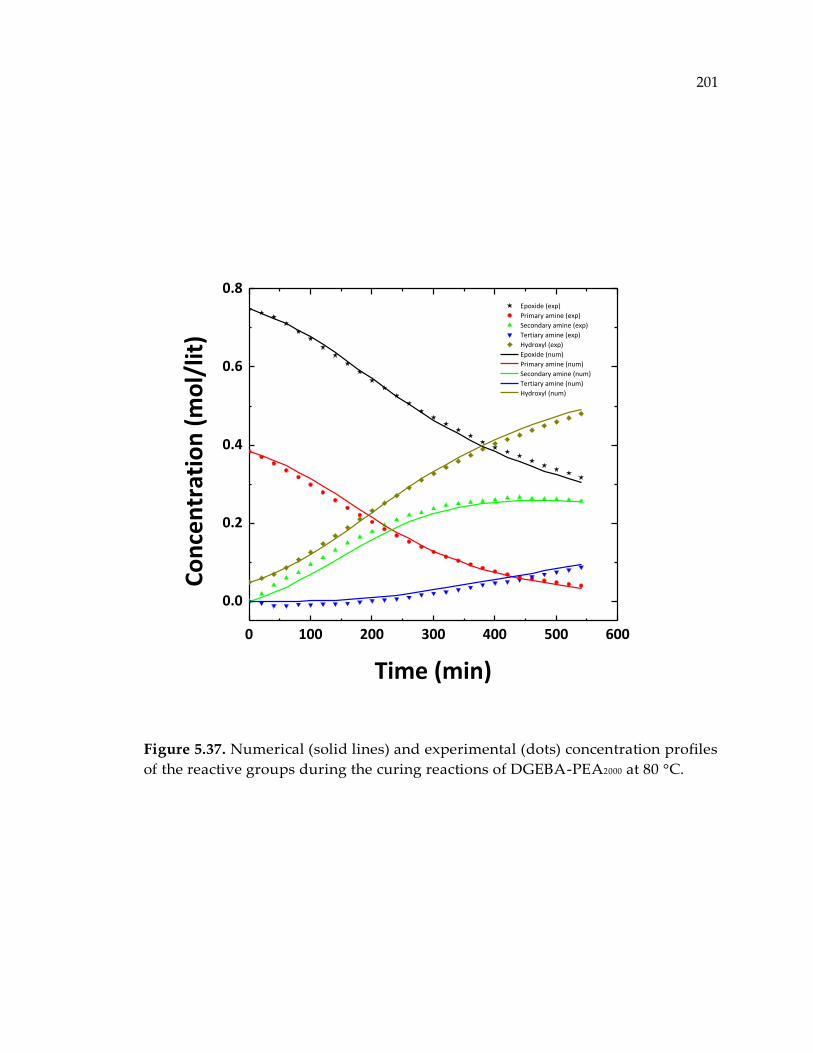
201
Figure 5.37. Numerical (solid lines) and experimental (dots) concentration profiles
of the reactive groups during the curing reactions of DGEBA-PEA2000 at 80 °C.
0 100 200 300 400 500 600
0.0
0.2
0.4
0.6
0.8 Epoxide (exp)
Primary amine (exp)
Secondary amine (exp)
Tertiary amine (exp)
Hydroxyl (exp)
Epoxide (num)
Primary amine (num)
Secondary amine (num)
Tertiary amine (num)
Hydroxyl (num)
Co
nce
ntr
atio
n (
mo
l/lit
)
Time (min)
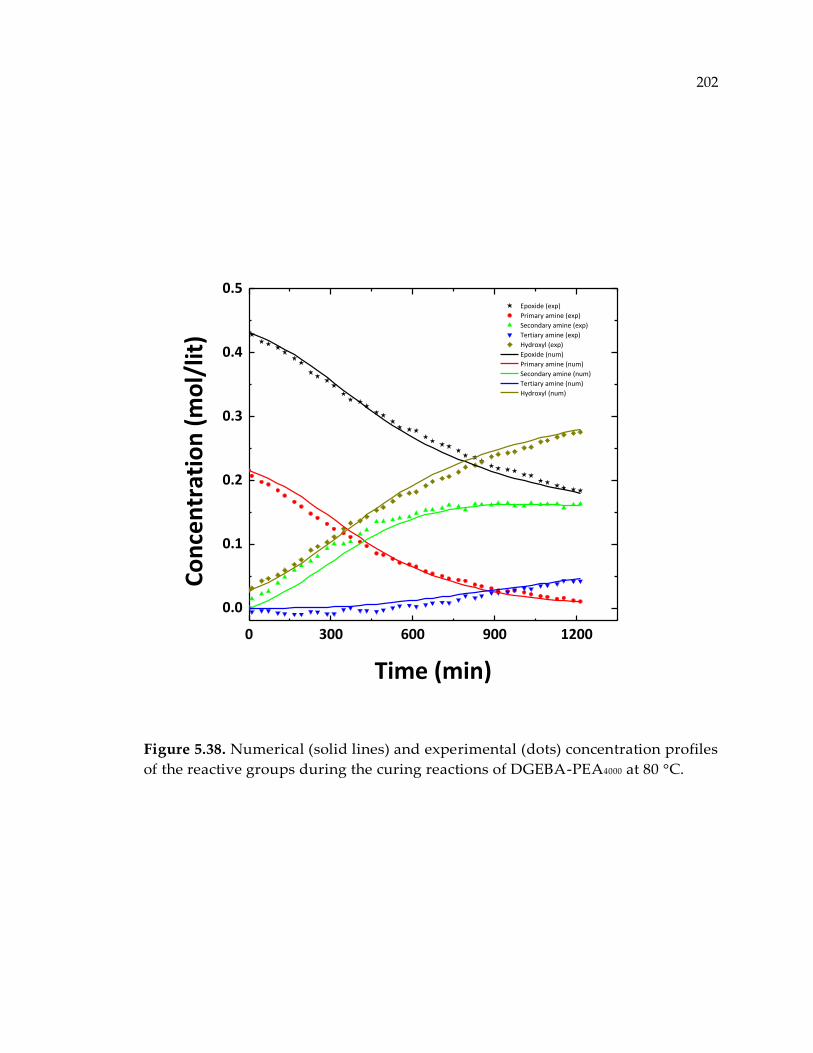
202
Figure 5.38. Numerical (solid lines) and experimental (dots) concentration profiles
of the reactive groups during the curing reactions of DGEBA-PEA4000 at 80 °C.
0 300 600 900 1200
0.0
0.1
0.2
0.3
0.4
0.5 Epoxide (exp)
Primary amine (exp)
Secondary amine (exp)
Tertiary amine (exp)
Hydroxyl (exp)
Epoxide (num)
Primary amine (num)
Secondary amine (num)
Tertiary amine (num)
Hydroxyl (num)
Co
nce
ntr
atio
n (
mo
l/lit
)
Time (min)

203
As discussed, reactivity of primary amines is generally higher than reactivity of the
secondary amines for all systems investigated here (k1 > k2). However, as shown in
Figure 5.34 and Table 5.4, the substitution factor showed a decreasing trend as the
molecular weight of the curing agent, PEA, became larger.
One probable explanation is that nucleophilic character of the hydrogen atoms on
primary amines are higher than nucleophilic character of the hydrogen atoms on
secondary amines. Therefore, epoxy-primary amine ring opening reaction is faster
than epoxy-secondary amine. This phenomena could explain why epoxy-primary
amine reactions are faster than epoxy-secondary amine reactions, however, it
cannot explain why substitution effect is reduced as the molecular weight of the
curing agent gets larger.
The most probable explanation for this observation is the steric hindrance effect
due to the addition of one epoxy to a primary amine. Even for smaller molecules
such as PEA230 and PEA400, this addition reactions causes k2 to be lower than k1,
causing the substitution factor to be lower than the theoretical limit of 0.5. The same
description is valid for explaining why substitution factor is decreasing with the
increase of PEA molecular weight. In fact, when primary amines react with
epoxides, the additional reactions of the forming secondary amines are hindered
by the non-reactive backbone of the molecule, thus showing a lower k2 at the same

204
reaction conditions. Consequently, the larger the size of curing agents, the bulkier
the non-reactive backbones, the smaller the reactivity of secondary amines will be.
5.4. Conclusion
A novel processing technique for toughening thermosets was introduced through
which partially reacted substructures of a low-Tg thermoset at different extents of
polymerization were embedded into a high-Tg majority-phase thermoset. It was
shown that the PRS-modified samples are tougher than the corresponding controls,
and the toughness is directly proportional to the chemical conversion of the
embedded PRS. The 80% conversion PRS-modified samples were almost twice as
tough as the corresponding control samples. SEM micrographs from fracture
surfaces of the modified samples showed voids, whereas none were seen on the
fracture surfaces of the control samples. This implies that the principal energy
dissipating mechanism during fracture in the modified structures is cavitation with
associated plastic shear yielding. SAXS results represented the existence of
heterogeneous domains of about 12-25 nm. The domain size increased with
increasing of PRS conversion, indicating that the PRS technique led the PPODAs to
be more coalesced. Also observed, was that the glass transition temperatures of the
modified systems were higher than those of the control systems. In addition, quasi-
205
static mechanical extension did not show substantial differences in mechanical
strength and modulus between system isomers. Overall, polymer network isomers
with improved thermal and mechanical properties were developed by rearranging
the molecular structures through an additional step in the processing of these
polymers. This further supports the idea that the network isomerization state can
be tuned to produce materials with improved toughness and glass transition
temperature without sacrificing essential mechanical properties such as strength
and stiffness. The results on the epoxy-amine system investigated herein can be
directly and economically applied to current industrial coating, adhesive, and
composite formulations. Although topology-based toughening was investigated
on crosslinked epoxy-amine polymers, the concept should be applicable to all
thermoset chemistries and perhaps to other brittle network forming materials.
5.5. List of References
1. Thompson, Z. J.; Hillmyer, M. A.; Liu, J.; Sue, H.-J.; Dettloff, M.; Bates, F. S.
Macromolecules 2009, 42, (7), 2333-2335.
2. Meng, F.; Zheng, S.; Zhang, W.; Li, H.; Liang, Q. Macromolecules 2006, 39, (2),
711-719.
3. Shaker, Z. G.; Browne, R. M.; Stretz, H. A.; Cassidy, P. E.; Blanda, M. T. Journal of
Applied Polymer Science 2002, 84, (12), 2283-2286.
206
4. Sue, H. J. Journal of materials science 1992, 27, (11), 3098-3107.
5. Pearson, R. A.; Yee, A. F. Journal of Materials Science 1991, 26, (14), 3828-3844.
6. Yee, A. F.; Pearson, R. A. Journal of materials science 1986, 21, (7), 2462-2474.
7. Pearson, R. A.; Yee, A. F. Polymer 1993, 34, (17), 3658-3670.
8. Kinloch, A.; Yuen, M.; Jenkins, S. Journal of Materials Science 1994, 29, (14), 3781-
3790.
9. Wetzel, B.; Rosso, P.; Haupert, F.; Friedrich, K. Engineering Fracture Mechanics
2006, 73, (16), 2375-2398.
10. Rosso, P.; Ye, L.; Friedrich, K.; Sprenger, S. Journal of Applied Polymer Science
2006, 100, (3), 1849-1855.
11. Park, Y. T.; Qian, Y.; Chan, C.; Suh, T.; Nejhad, M. G.; Macosko, C. W.; Stein, A.
Advanced Functional Materials 2014.
12. Gojny, F. H.; Wichmann, M. H. G.; Fiedler, B.; Schulte, K. Composites Science
and Technology 2005, 65, (15–16), 2300-2313.
13. Rafiee, M. A.; Yavari, F.; Rafiee, J.; Koratkar, N. Journal of Nanoparticle Research
2011, 13, (2), 733-737.
14. Kim, G. M.; Qin, H.; Fang, X.; Sun, F. C.; Mather, P. T. Journal of Polymer Science
Part B: Polymer Physics 2003, 41, (24), 3299-3313.
15. Mukherji, D.; Abrams, C. F. Physical Review E 2008, 78, (5), 050801.
16. Mukherji, D.; Abrams, C. F. Physical Review E 2009, 79, (6), 061802.
17. Sharifi, M.; Jang, C. W.; Abrams, C. F.; Palmese, G. R. J Mater Chem A 2014, 2,
(38), 16071-16082.
18. Mijovic, J.; Andjelic, S. Macromolecules 1995, 28, (8), 2787-2796.

207
19. Raman, V. I.; Palmese, G. R. Macromolecules 2005, 38, (16), 6923-6930.
20. Wang, J.; Wang, W.; Kollman, P. A.; Case, D. A. J. Mol. Graphics Modell. 2006,
25, (2), 247-260.
21. Wang, J.; Wolf, R. M.; Caldwell, J. W.; Kollman, P. A.; Case, D. A. Journal of
computational chemistry 2004, 25, (9), 1157-1174.
22. Plimpton, S. Journal of computational physics 1995, 117, (1), 1-19.
23. Jang, C.; Sharifi, M.; Palmese, G. R.; Abrams, C. F. Polymer 2014, 55, (16), 3859-
3868.
24. Jang, C.; Sirk, T. W.; Andzelm, J. W.; Abrams, C. F. Macromolecular Theory and
Simulations 2015.
25. Cowley, J. M., Diffraction physics. Elsevier: 1995.
26. Bragg, W. L. In The diffraction of short electromagnetic waves by a crystal,
Proceedings of the Cambridge Philosophical Society, 1913; 1913; p 4.
27. Kinloch, A.; Shaw, S.; Tod, D.; Hunston, D. Polymer 1983, 24, (10), 1341-1354.
28. Kinloch, A., Mechanics and mechanisms of fracture of thermosetting epoxy
polymers. In Epoxy Resins and Composites I, Springer: 1985; pp 45-67.
29. Kinloch, A.; Shaw, S.; Hunston, D. Polymer 1983, 24, (10), 1355-1363.
30. Fox Jr, T. G.; Flory, P. J. Journal of Applied Physics 1950, 21, (6), 581-591.
31. Sperling, L. H., Introduction to physical polymer science. John Wiley & Sons:
2005.
32. Richeton, J.; Ahzi, S.; Vecchio, K. S.; Jiang, F. C.; Adharapurapu, R. R.
International Journal of Solids and Structures 2006, 43, (7–8), 2318-2335.
33. Mijovic, J.; Wijaya, J. Macromolecules 1994, 27, (26), 7589-7600.
208
34. Matejka, L. Macromolecules 2000, 33, (10), 3611-3619.
35. Liu, H.; Uhlherr, A.; Varley, R. J.; Bannister, M. K. J. Polym. Sci., Part A: Polym.
Chem. 2004, 42, (13), 3143-3156.
36. Varley, R. J.; Liu, W.; Simon, G. P. J. Appl. Polym. Sci. 2006, 99, (6), 3288-3299.
37. González, M. G.; Baselga, J.; Cabanelas, J. C., Applications of FTIR on epoxy
resins-identification, monitoring the curing process, phase separation and water uptake.
INTECH Open Access Publisher: 2012.
38. Smith, I. T. Polymer 1961, 2, 95-108.
39. Horie, K.; Hiura, H.; Sawada, M.; Mita, I.; Kambe, H. J. Polym. Sci., Part A-1:
Polym. Chem. 1970, 8, (6), 1357-72.
40. Riccardi, C. C.; Adabbo, H. E.; Williams, R. J. J. J. Appl. Polym. Sci. 1984, 29, (8),
2481-92.
41. Flory, P. J. Journal of the American Chemical Society 1941, 63, (11), 3083-3090.
42. Rohr, D. F., Jr. Modeling reaction and diffusion in epoxy-amine polymerization
kinetics. 1988.
43. Rohr, D. F.; Klein, M. T. Ind. Eng. Chem. Res. 1988, 27, 1361-6.
44. Wisanrakkit, G.; Gillham, J. K. Journal of Applied Polymer Science 1990, 41, (11-
12), 2885-2929.
209
Chapter 6. Investigating the Effect of Tg on Mechanical Properties of Epoxy-
Amine Polymer Networks with Altered Topology
6.1. Introduction
Chapter 3 revealed significant ductility for a crosslinked polymer in glassy state
upon uniaxial tensile deformation, and that the observed energy absorption is due
to local molecular motions and plastic void growth of the distinct topological
structures in the form of molecular surfaces (protovoids) that were embedded in
polymer networks. Next, as discussed in Chapter 5, polymer isomers were
formulated with some distinct structural domains (PRS) throughout the network.
The modified structures with larger PRS domains revealed higher toughness, about
two-and-half times larger. However, these polymer isomers did not show
significant plastic deformation similar to the characteristics observed earlier in the
RES-modified samples, discussed in Chapter 3.
The lack of ductility in the PRS-modified systems could be due to two reasons: (1)
relatively large difference between Tg of the PRS-modified samples and testing
temperature (room temperature), or (2) absence of the molecular surfaces that could
mimic the role of the potential voids in the RES-modified systems. The first
210
hypothesis was comprehensively investigated and explained in this Chapter, while
the second is explored in the next Chapter.
Accordingly, effect of the final Tg on the mechanical performance and stress-strain
behavior of polymer networks will be discussed here. Three systems with various
Tg ranging from 60 °C – 180 °C were prepared. In addition, poly(propylene-
oxide)diamines (PPODA) with various molecular weights reacted with mono-
epoxide phenyl glycidyl ether (PGE). The resulting non-reactive adducts, referred
to as “capped PPODAs” (cPPODAs) were incorporated in the resin formulations to
create the molecular surfaces (protovoids). In this study, capped PPODAs serve as
solvent species as in Chapter 3, but they remain in polymer networks.
6.2. Experimental
6.2.1. Material
The difunctional epoxy resin used is Diglycidyl Ether of Bisphenol-A (DGEBA),
EPON 825 with n=0.07, (Miller-Stephensen). Three diamine curing agents were
used as the main curatives: (DETDA), EPIKURE W (Miller-Stephensen), and
poly(propylene-oxide)diamine, PPODA, Jeffamine D-230 and D-400 (Huntsman).
211
In addition, poly(propylene-oxide)diamine, PPODA, Jeffamine D-2000 and D-4000
(Huntsman) were used as the curing agents for phenyl glycidyl ether, PGE, (Sigma-
Aldrich) to formulate the capped PPODAs. These materials are shown in Figure
6.1.
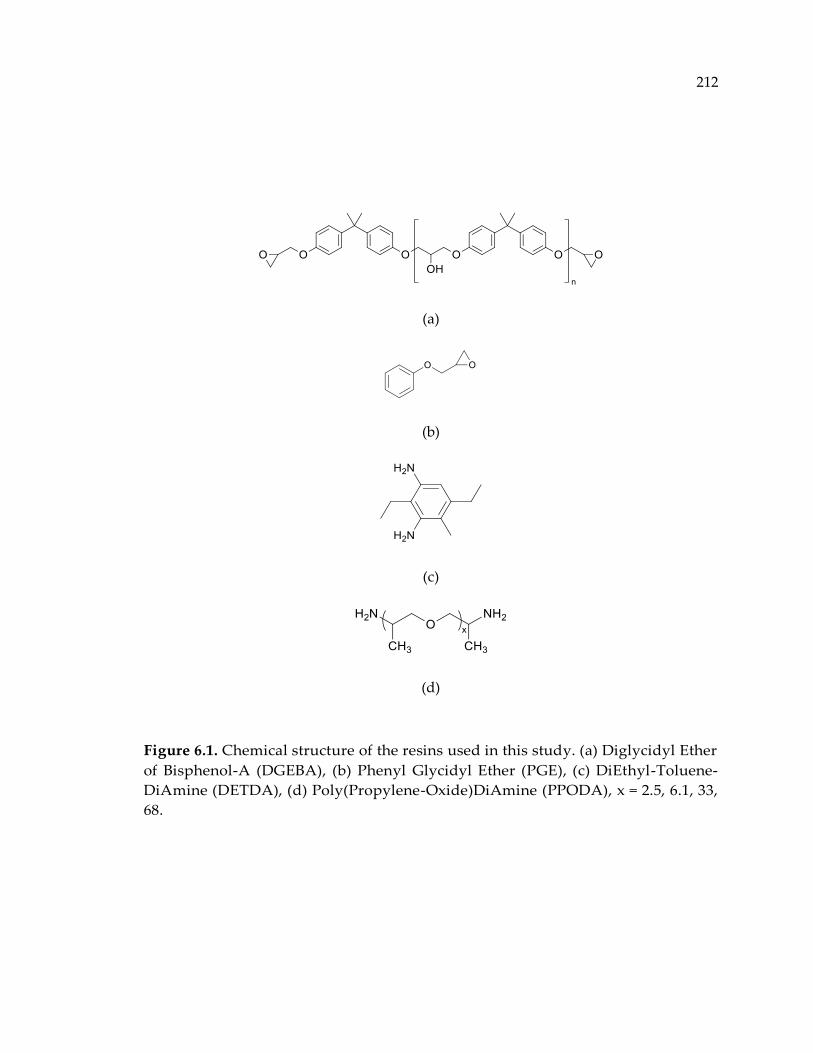
212
(a)
(b)
(c)
(d)
Figure 6.1. Chemical structure of the resins used in this study. (a) Diglycidyl Ether
of Bisphenol-A (DGEBA), (b) Phenyl Glycidyl Ether (PGE), (c) DiEthyl-Toluene-
DiAmine (DETDA), (d) Poly(Propylene-Oxide)DiAmine (PPODA), x = 2.5, 6.1, 33,
68.
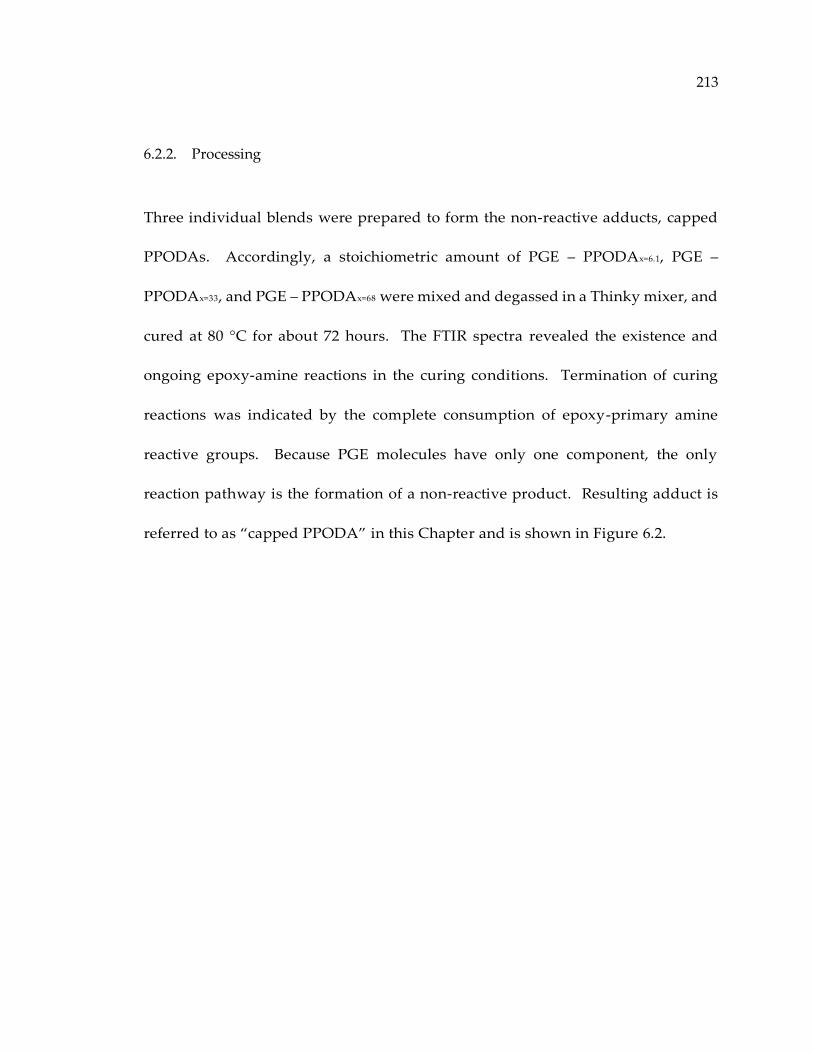
213
6.2.2. Processing
Three individual blends were prepared to form the non-reactive adducts, capped
PPODAs. Accordingly, a stoichiometric amount of PGE – PPODAx=6.1, PGE –
PPODAx=33, and PGE – PPODAx=68 were mixed and degassed in a Thinky mixer, and
cured at 80 °C for about 72 hours. The FTIR spectra revealed the existence and
ongoing epoxy-amine reactions in the curing conditions. Termination of curing
reactions was indicated by the complete consumption of epoxy-primary amine
reactive groups. Because PGE molecules have only one component, the only
reaction pathway is the formation of a non-reactive product. Resulting adduct is
referred to as “capped PPODA” in this Chapter and is shown in Figure 6.2.
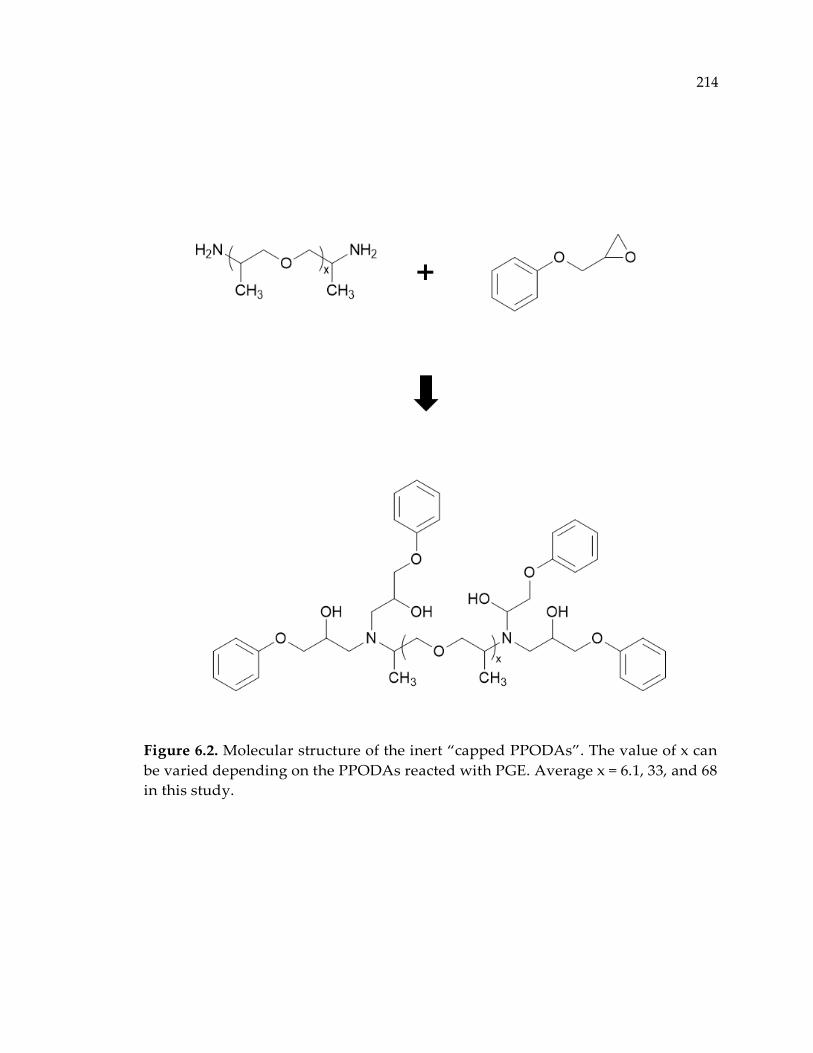
214
Figure 6.2. Molecular structure of the inert “capped PPODAs”. The value of x can
be varied depending on the PPODAs reacted with PGE. Average x = 6.1, 33, and 68
in this study.
215
Depending on the chain length of the capped PPODA, the viscosity of adducts were
different. The capped PPODAx=6.1 showed highest viscosity where the capped
PPODAx=68 exhibited the lowest, at room temperature. Viscosity of these systems is
primarily determined by the intermolecular interactions. When smaller PPODAs
are used, more PGE was required to maintain the stoichiometric ratio. Therefore,
molar concentration of the aromatic rings (present in the molecular structure of
PGEs) was higher in the structure of adducts in this case. The π-stacking
interactions increase and result in higher viscosity at room temperature.
Aside from preparation of the capped PPODAs, three thermosetting systems with
various Tg, were studied in this work. Stoichiometric amounts of DGEBA –
DETDA, DGEBA – PPODAx=2.5, and DGEBA – PPODAx=6.1 were prepared. Then 5%
by weight from each of the capped PPODAs was added to the blends. Additionally,
blank samples were prepared by mixing the stoichiometric amount of each of the
above systems. Resulting mixtures were oven-dried and cured at 80 °C for 12 hours
followed by a post-curing step at 160 °C for 4 hours.
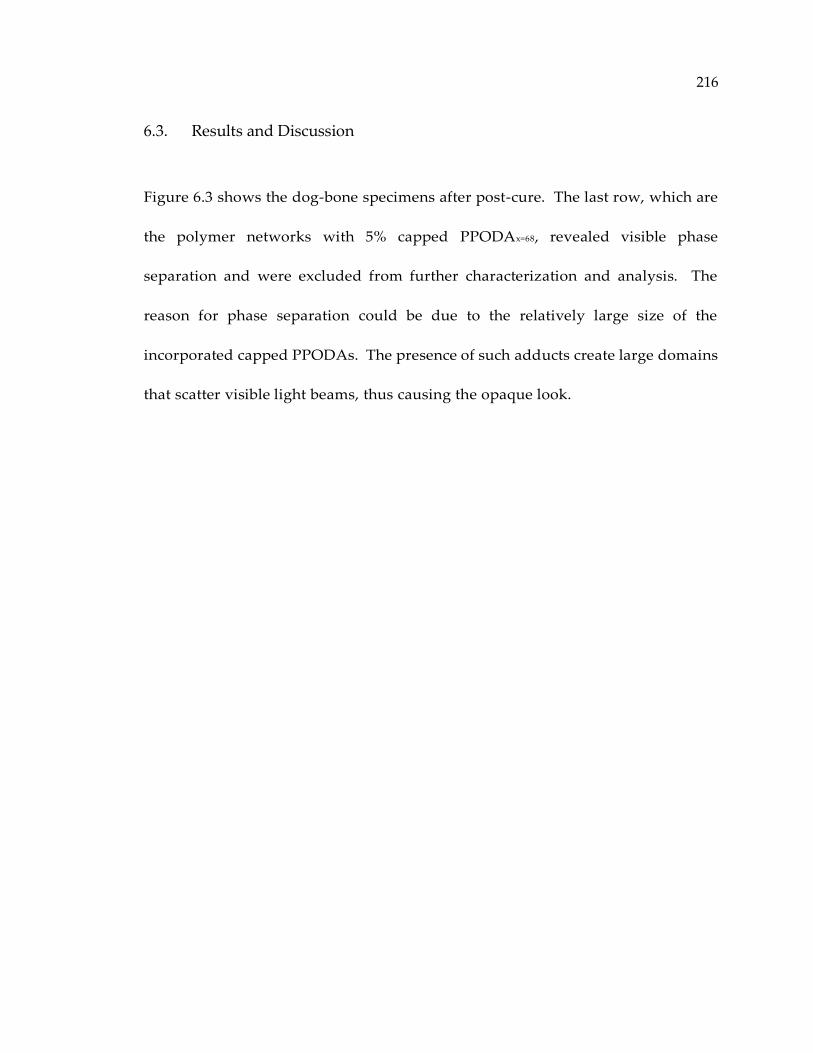
216
6.3. Results and Discussion
Figure 6.3 shows the dog-bone specimens after post-cure. The last row, which are
the polymer networks with 5% capped PPODAx=68, revealed visible phase
separation and were excluded from further characterization and analysis. The
reason for phase separation could be due to the relatively large size of the
incorporated capped PPODAs. The presence of such adducts create large domains
that scatter visible light beams, thus causing the opaque look.
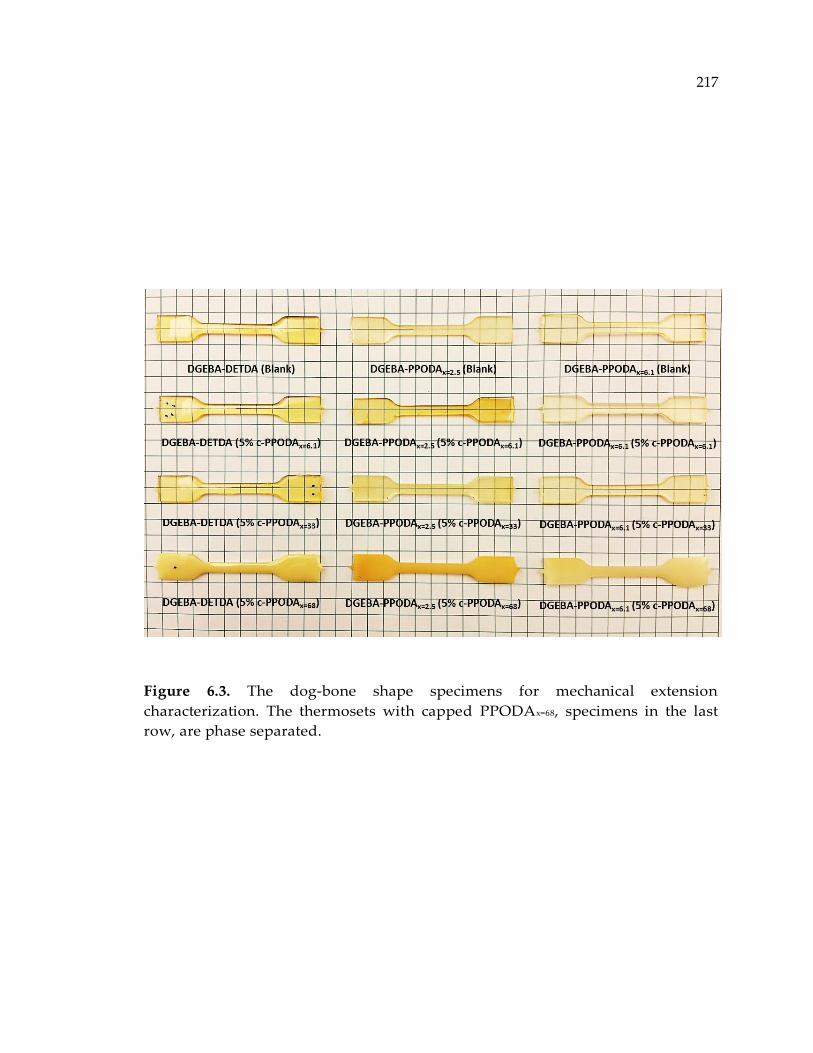
217
Figure 6.3. The dog-bone shape specimens for mechanical extension
characterization. The thermosets with capped PPODAx=68, specimens in the last
row, are phase separated.
218
The probable structural formation of the polymer networks are shown in Figure
6.4. These systems are identical to the systems described in Chapter 3, yet the
resulting samples cannot be called polymer isomers because compositions are
different. If we could extract the capped PPODAs after cure, the resulting
structures would have been called “polymer isomers”.
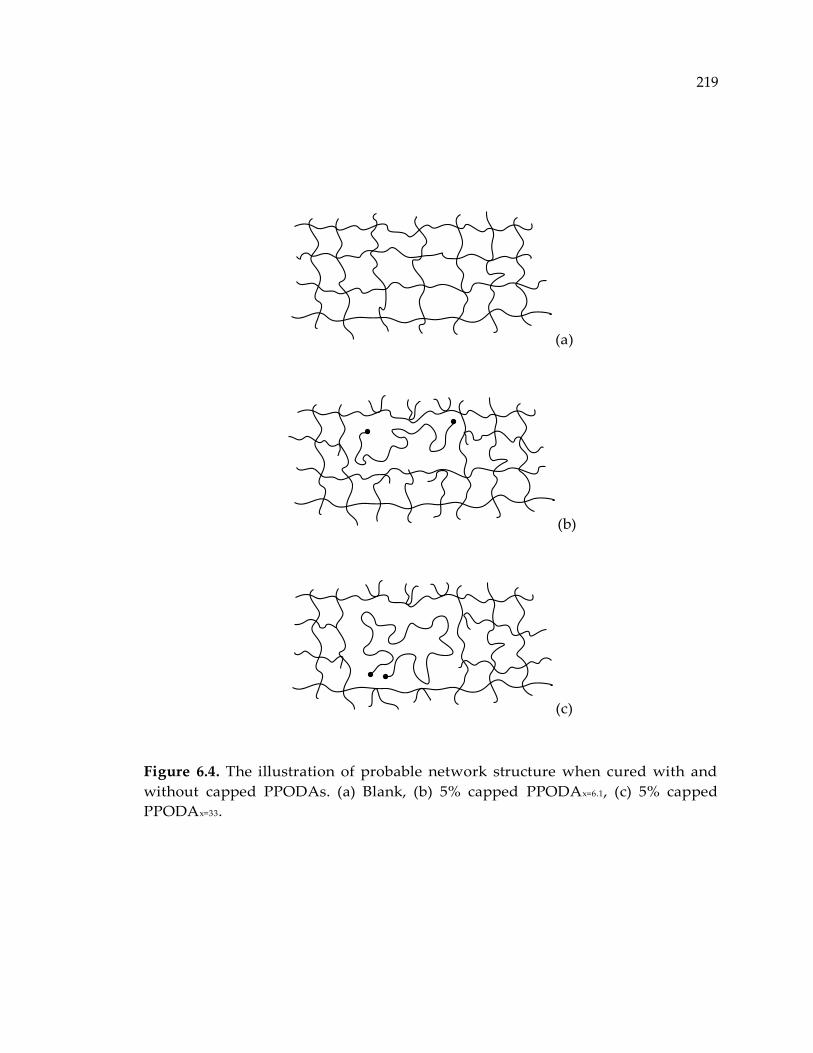
219
(a)
(b)
(c)
Figure 6.4. The illustration of probable network structure when cured with and
without capped PPODAs. (a) Blank, (b) 5% capped PPODAx=6.1, (c) 5% capped
PPODAx=33.
220
From previous studies, it is comprehensively understood that the presence of a soft
phase in polymer network structures reduces tensile strength, modulus, and glass
transition temperature. However, in this study we aimed to explore if topological
variations could affect stress-strain behavior for systems with various Tg’s, similar
to the systems previously discussed in Chapter 3. Here, capped PPODAs perform
the role of inert solvent species. During polymerization capped PPODAs are
encapsulated by thermosets without any covalent bond formation in the
directionality where the capped PPODAs are present. This results in the creation
of molecular surfaces (protovoids), and subsequently variations in network
topology. The effects of topology on behavioral characteristics of thermosetting
systems in a broad range of Tg is discussed herein.
6.3.1. Glass Transition Temperature
A dynamic mechanical analyzer, DMA TA-Q800 instrument was used to measure
the viscoelastic properties. Single cantilever specimens (35x12x2 mm) were loaded
under a cyclic loading with an amplitude of 15 µm and a frequency of 1 Hz. The
viscoelastic properties were measured at a heating rate of 2 °C/min. The
temperature range was varied depending on the type of thermoset that was
analyzed.
221
Tg values were measure from the position of the tan δ peak. Figure 6.5 shows a
representative tan δ for the polymer networks composed of DGEBA and DETDA.
As expected, and unlike the RES-modified systems, Tg values were not the same
here. The system with 5% inclusion of capped PPODAx=33 exhibited the lowest Tg
and the highest peak breadth. A summary of peak analysis on tan δ vs. temperature
curves is listed in Table 6.1.
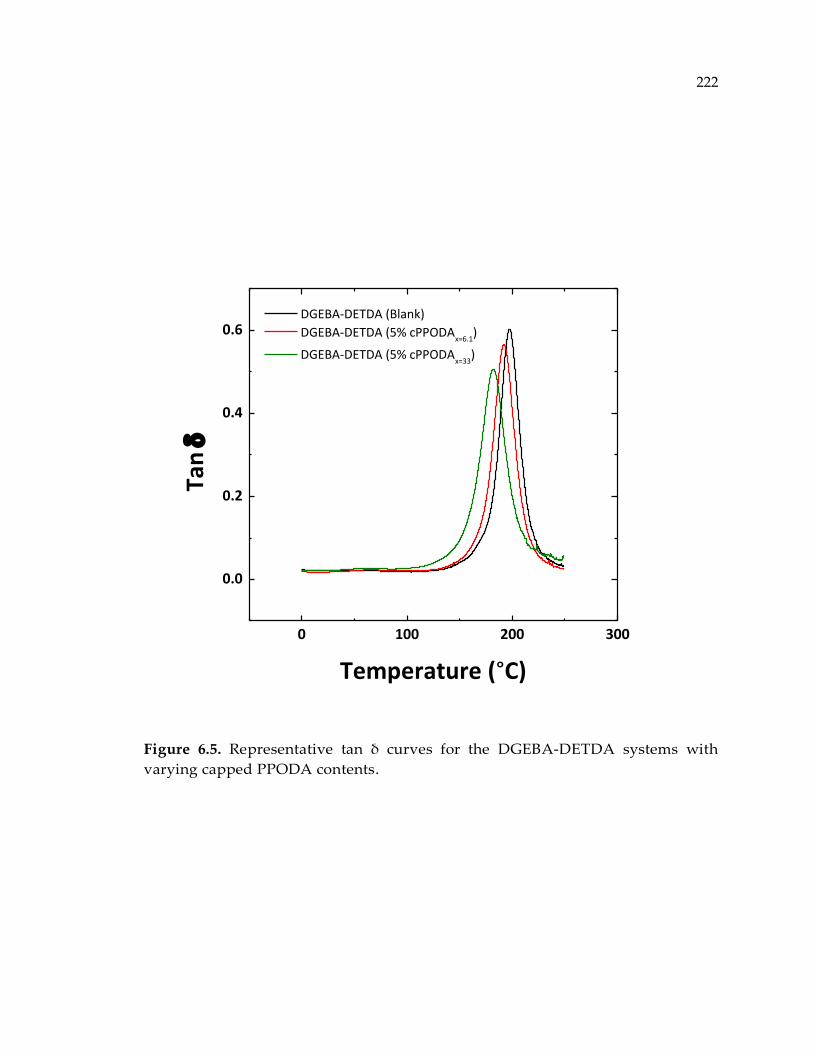
222
Figure 6.5. Representative tan δ curves for the DGEBA-DETDA systems with
varying capped PPODA contents.
0 100 200 300
0.0
0.2
0.4
0.6 DGEBA-DETDA (Blank)
DGEBA-DETDA (5% cPPODAx=6.1
)
DGEBA-DETDA (5% cPPODAx=33
)
Tan
Temperature (°C)
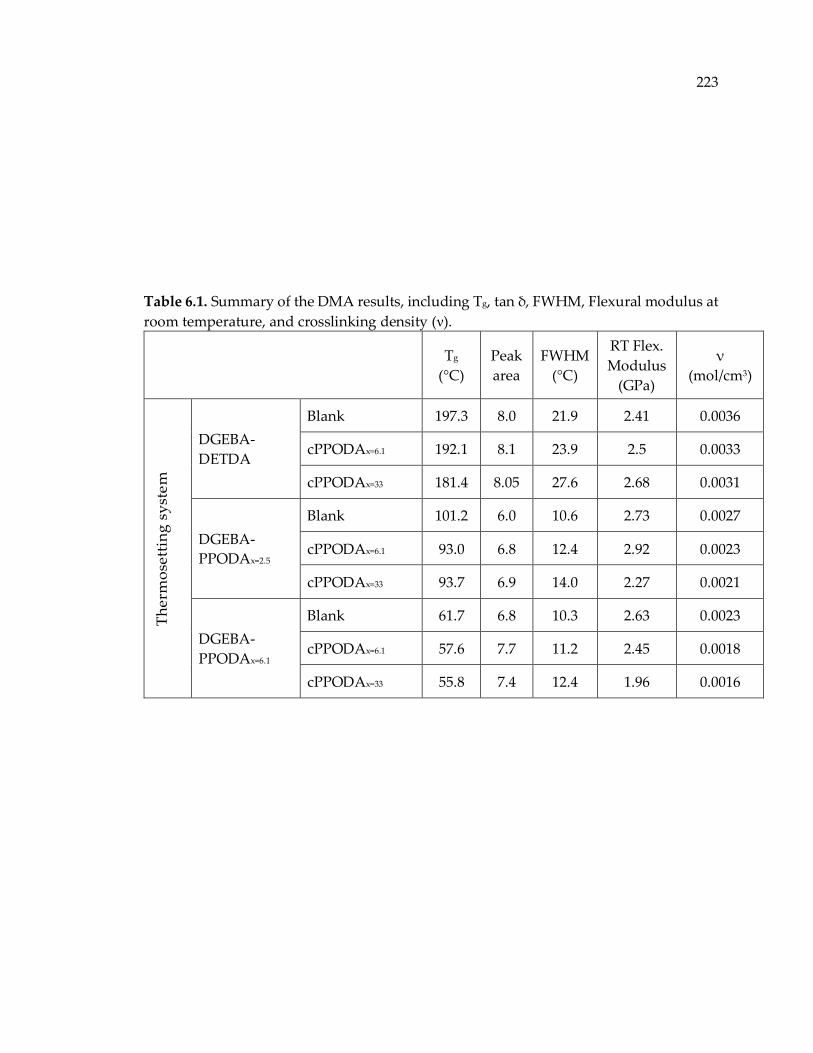
223
Table 6.1. Summary of the DMA results, including Tg, tan δ, FWHM, Flexural modulus at
room temperature, and crosslinking density (ν).
Tg
(°C)
Peak
area
FWHM
(°C)
RT Flex.
Modulus
(GPa)
ν
(mol/cm3)
Th
erm
ose
ttin
g s
yst
em
DGEBA-
DETDA
Blank 197.3 8.0 21.9 2.41 0.0036
cPPODAx=6.1 192.1 8.1 23.9 2.5 0.0033
cPPODAx=33 181.4 8.05 27.6 2.68 0.0031
DGEBA-
PPODAx=2.5
Blank 101.2 6.0 10.6 2.73 0.0027
cPPODAx=6.1 93.0 6.8 12.4 2.92 0.0023
cPPODAx=33 93.7 6.9 14.0 2.27 0.0021
DGEBA-
PPODAx=6.1
Blank 61.7 6.8 10.3 2.63 0.0023
cPPODAx=6.1 57.6 7.7 11.2 2.45 0.0018
cPPODAx=33 55.8 7.4 12.4 1.96 0.0016
224
According to the data provided in Table 6.1, in all the systems studied, Full-Width-
Half-Maximum (FWHM) increased where crosslinking density decreased as the
size of the capped PPODA grew. The results implied that, for fully cured
thermosets, inter-molecular packing reduced and polymer networks became less
homogenous when larger capped PPODAs are incorporated.
6.3.2. Mechanical Properties
The principle objective of this study was to investigate the effect of topological
features on stress-strain behavior of thermosetting systems. The dog-bone shape
specimens, as shown in Figure 6.3, were loaded with an INSTRON apparatus under
uniaxial extension with a crosshead speed of 1 mm/min at room temperature.
Figures 6.6, 6.7, and 6.8 are the representative engineering stress-strain curves for
DGEBA – DETDA, DGEBA – PPODAx=2.5, and DGEBA – PPODAx=6.1, respectively.
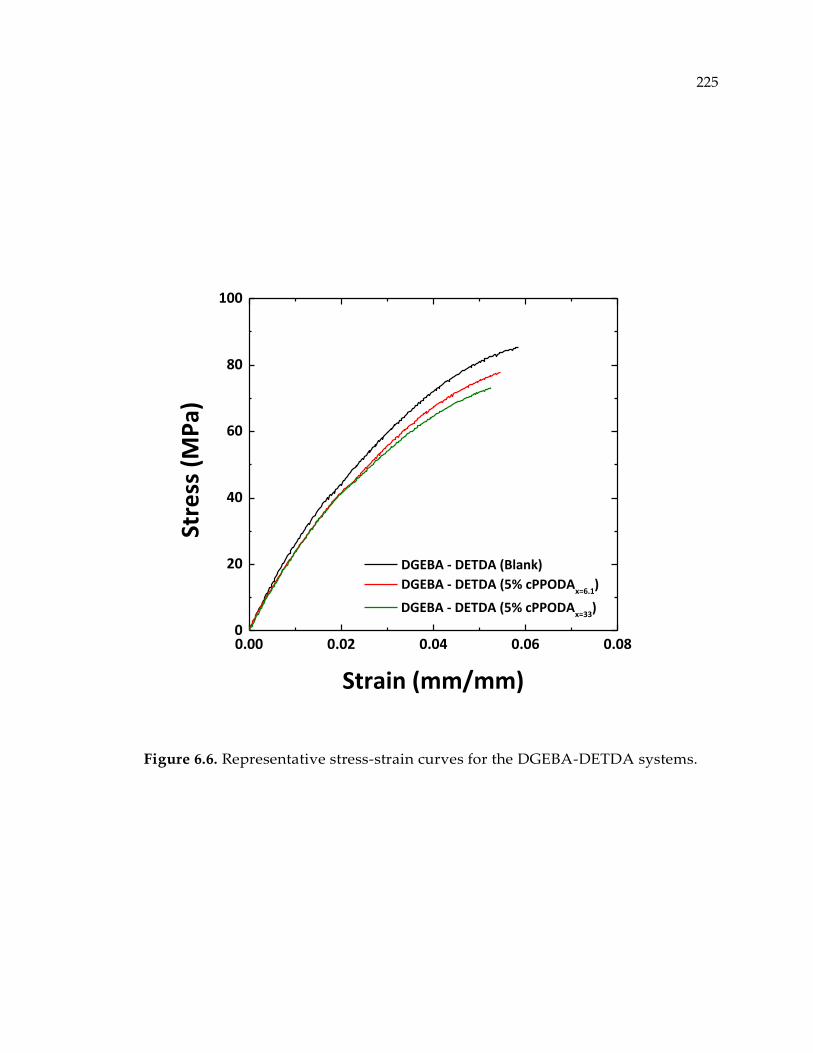
225
Figure 6.6. Representative stress-strain curves for the DGEBA-DETDA systems.
0.00 0.02 0.04 0.06 0.080
20
40
60
80
100
DGEBA - DETDA (Blank)
DGEBA - DETDA (5% cPPODAx=6.1
)
DGEBA - DETDA (5% cPPODAx=33
)
Stre
ss (
MP
a)
Strain (mm/mm)
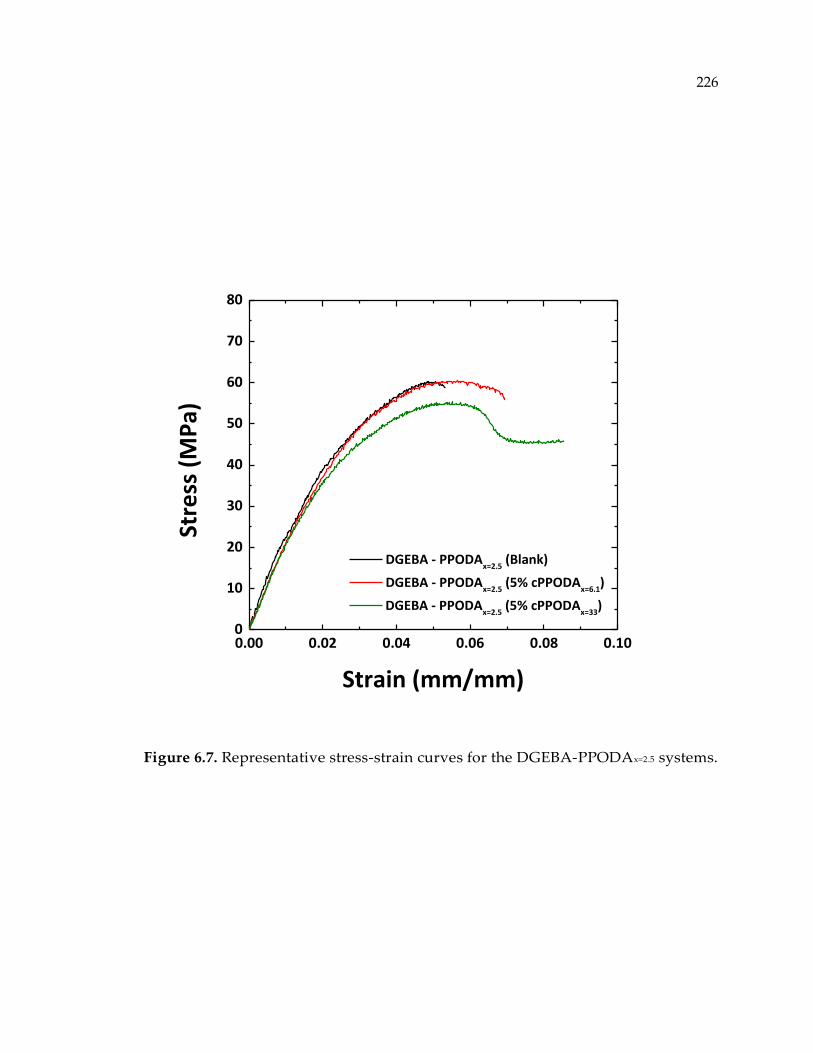
226
Figure 6.7. Representative stress-strain curves for the DGEBA-PPODAx=2.5 systems.
0.00 0.02 0.04 0.06 0.08 0.100
10
20
30
40
50
60
70
80
DGEBA - PPODAx=2.5
(Blank)
DGEBA - PPODAx=2.5
(5% cPPODAx=6.1
)
DGEBA - PPODAx=2.5
(5% cPPODAx=33
)
Stre
ss (
MP
a)
Strain (mm/mm)
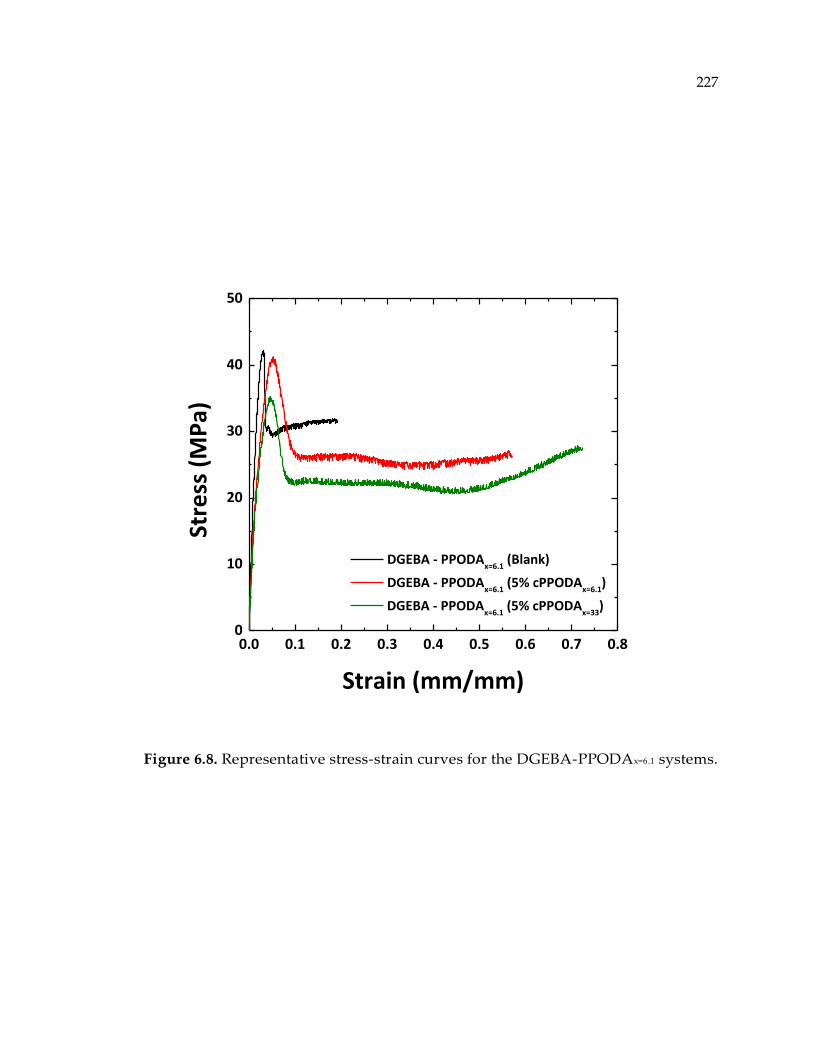
227
Figure 6.8. Representative stress-strain curves for the DGEBA-PPODAx=6.1 systems.
0.0 0.1 0.2 0.3 0.4 0.5 0.6 0.7 0.80
10
20
30
40
50
DGEBA - PPODAx=6.1
(Blank)
DGEBA - PPODAx=6.1
(5% cPPODAx=6.1
)
DGEBA - PPODAx=6.1
(5% cPPODAx=33
)
Stre
ss (
MP
a)
Strain (mm/mm)
228
It was shown that the systems that are composed of DGEBA – DETDA have the
highest Tg among the thermosetting systems investigated here. The stress-strain
curves for these systems did not show large ductility, thus samples broke before
yielding. In contrast, systems that were composed of DGEBA – PPODAx=2.5, and
DGEBA – PPODAx=6.1 exhibited larger ductility beyond yielding and before failure.
After comparing these three thermosetting systems (Blank curves), one can
conclude that the major difference between these systems is Tg. In general, Tg is the
stress-strain shape determining factor for thermosetting systems. When testing
temperature (at which mechanical characterization is conducting) gets closer to the
Tg of the testing samples, polymer chains have more freedom for local motion,
dissipating the applied stress and delaying the strains at which covalent bonds
break. Therefore, the effect of topological variations would be more observable in
systems with Tg’s closer to the testing temperature. For the thermosetting systems
studied in this Chapter, the ones made from DGEBA – PPODAx=6.1 had this feature.
Values of Young’s modulus, tensile strength, and failure strain for all the systems
are listed in Table 6.2. The average values and the associated standard deviations
were measured from at least 8 replicates for each data point.
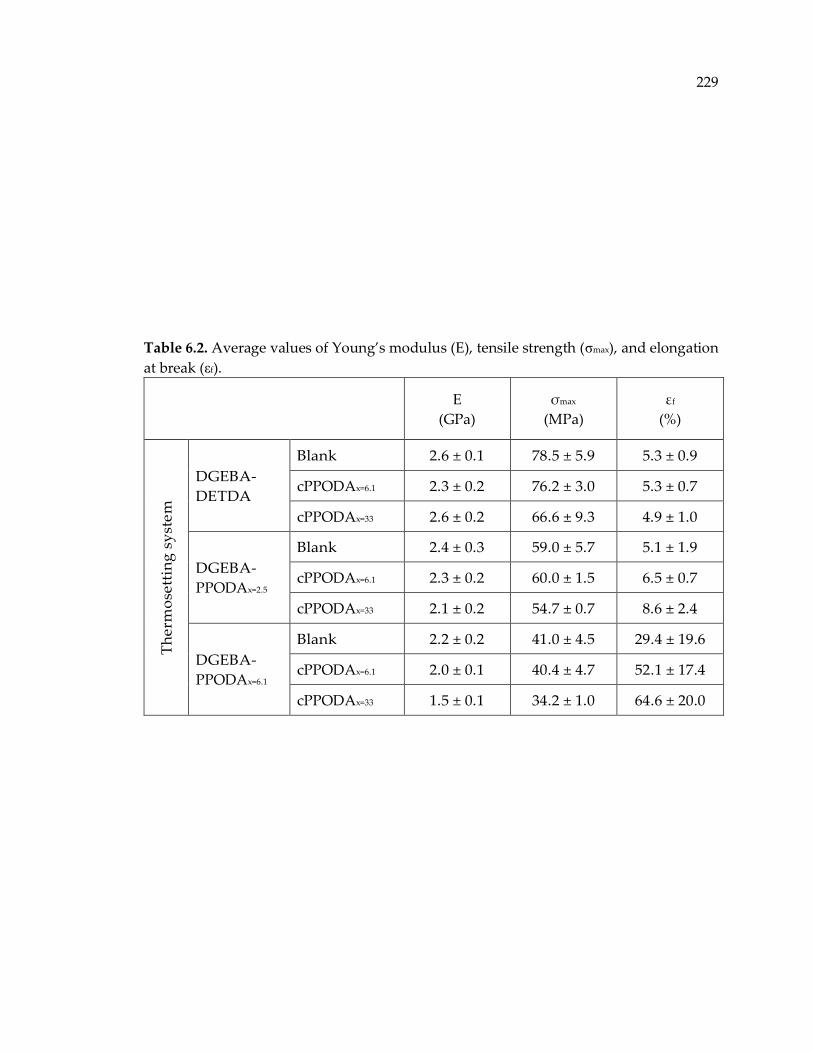
229
Table 6.2. Average values of Young’s modulus (E), tensile strength (σmax), and elongation
at break (εf).
E
(GPa)
σmax
(MPa)
εf
(%)
Th
erm
ose
ttin
g s
yst
em
DGEBA-
DETDA
Blank 2.6 ± 0.1 78.5 ± 5.9 5.3 ± 0.9
cPPODAx=6.1 2.3 ± 0.2 76.2 ± 3.0 5.3 ± 0.7
cPPODAx=33 2.6 ± 0.2 66.6 ± 9.3 4.9 ± 1.0
DGEBA-
PPODAx=2.5
Blank 2.4 ± 0.3 59.0 ± 5.7 5.1 ± 1.9
cPPODAx=6.1 2.3 ± 0.2 60.0 ± 1.5 6.5 ± 0.7
cPPODAx=33 2.1 ± 0.2 54.7 ± 0.7 8.6 ± 2.4
DGEBA-
PPODAx=6.1
Blank 2.2 ± 0.2 41.0 ± 4.5 29.4 ± 19.6
cPPODAx=6.1 2.0 ± 0.1 40.4 ± 4.7 52.1 ± 17.4
cPPODAx=33 1.5 ± 0.1 34.2 ± 1.0 64.6 ± 20.0
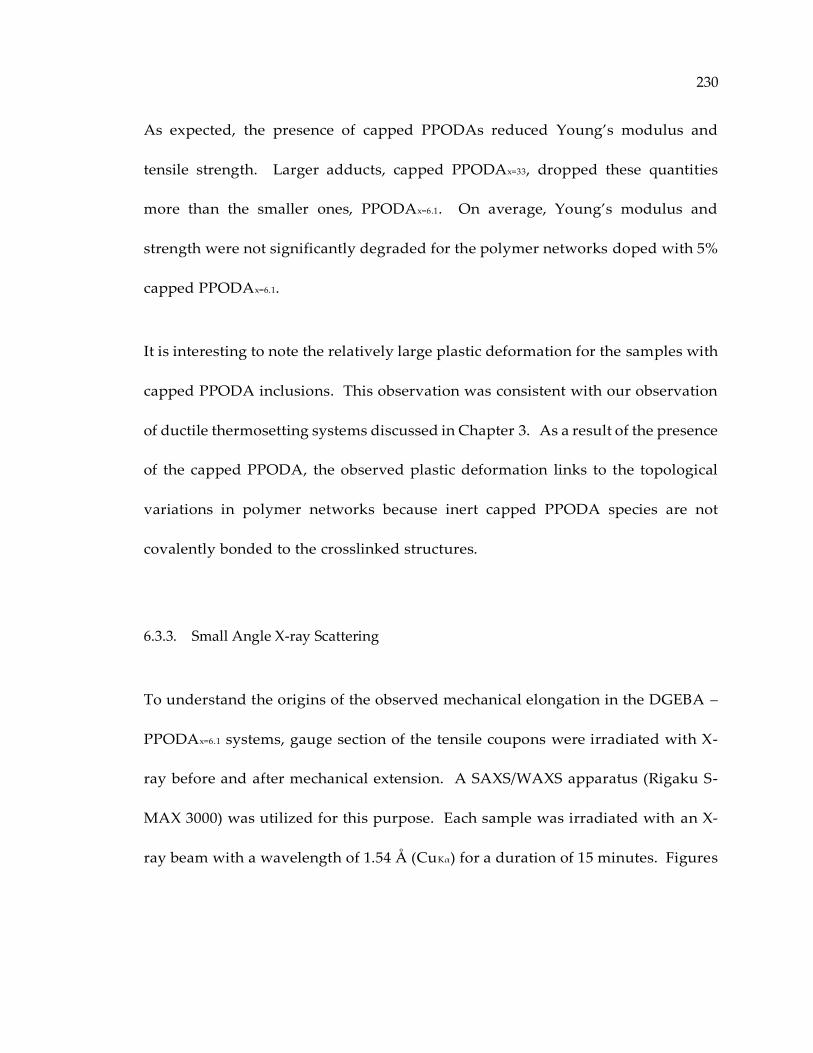
230
As expected, the presence of capped PPODAs reduced Young’s modulus and
tensile strength. Larger adducts, capped PPODAx=33, dropped these quantities
more than the smaller ones, PPODAx=6.1. On average, Young’s modulus and
strength were not significantly degraded for the polymer networks doped with 5%
capped PPODAx=6.1.
It is interesting to note the relatively large plastic deformation for the samples with
capped PPODA inclusions. This observation was consistent with our observation
of ductile thermosetting systems discussed in Chapter 3. As a result of the presence
of the capped PPODA, the observed plastic deformation links to the topological
variations in polymer networks because inert capped PPODA species are not
covalently bonded to the crosslinked structures.
6.3.3. Small Angle X-ray Scattering
To understand the origins of the observed mechanical elongation in the DGEBA –
PPODAx=6.1 systems, gauge section of the tensile coupons were irradiated with X-
ray before and after mechanical extension. A SAXS/WAXS apparatus (Rigaku S-
MAX 3000) was utilized for this purpose. Each sample was irradiated with an X-
ray beam with a wavelength of 1.54 Å (CuKα) for a duration of 15 minutes. Figures

231
6.9 and 6.10 show scattered intensity (integrated over the azimuthal angle, χ) versus
reciprocal space q-vector before and after deformation, respectively.
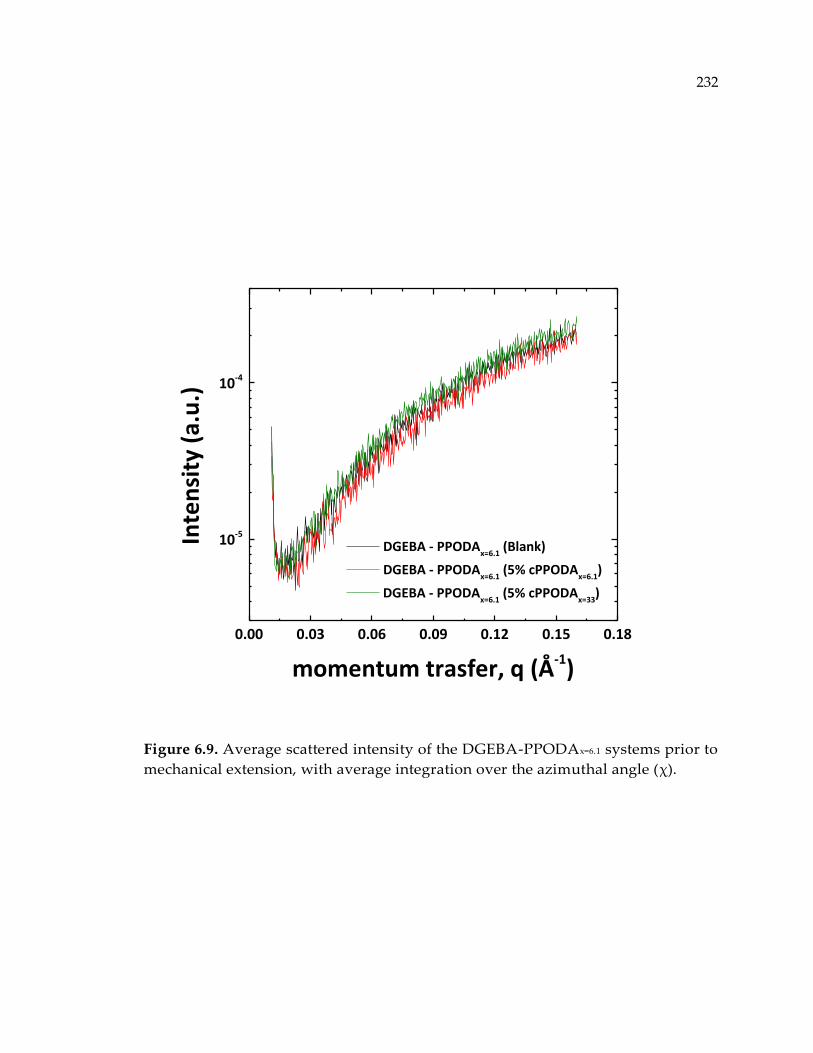
232
Figure 6.9. Average scattered intensity of the DGEBA-PPODAx=6.1 systems prior to
mechanical extension, with average integration over the azimuthal angle (χ).
0.00 0.03 0.06 0.09 0.12 0.15 0.18
10-5
10-4
DGEBA - PPODAx=6.1
(Blank)
DGEBA - PPODAx=6.1
(5% cPPODAx=6.1
)
DGEBA - PPODAx=6.1
(5% cPPODAx=33
)
Inte
nsi
ty (
a.u
.)
momentum trasfer, q (Å-1)

233
Figure 6.10. Average scattered intensity of the DGEBA-PPODAx=6.1 systems after to
mechanical extension, with average integration over the azimuthal angle (χ).
0.00 0.03 0.06 0.09 0.12 0.15 0.18
10-5
10-4
DGEBA - PPODAx=6.1
(Blank)
DGEBA - PPODAx=6.1
(5% cPPODAx=6.1
)
DGEBA - PPODAx=6.1
(5% cPPODAx=33
)
Inte
nsi
ty (
a.u
.)
momentum trasfer, q (Å-1)
234
The results prior to mechanical deformation revealed no differences between the
blank sample and the modified ones (doped with 5% capped PPODA) suggesting
that in unstressed situations, the non-bonded heterogeneities do not tend to scatter
X-ray beams. However, the graph for the same samples after mechanical extension,
revealed significant differences between the blank sample and the samples with 5%
inclusion of capped PPODAs. It is evident that a peak in the q-range of 0.015 – 0.05
Å-1 starts to appear for the systems with capped PPODAs inclusions. This could be
due to the change in size of the heterogeneous domains, and supports the fact that
void opening mechanism causes the observed ductility in glassy state. Upon plastic
deformation, molecular surfaces that are formed due to the presence of inert
capped PPODAs begin to distort, change in size, and create pore structures around
the capped PPODAs. The overall packing (density) reduces in this case. The
distorted heterogeneous phase, capped PPODAs, are distinguishable by X-ray
beams. The difference between blank samples and modified samples (with 5%
capped PPODAs) in the Porod limit, q-value of about 0.16 Å-1, was also detected by
X-ray. The difference in shape-factor parameter (S) implies that shape of the
heterogeneous domains alter upon mechanical extension.
235
6.4. Conclusion
Three thermosetting systems with Tg’s ranging from 60 °C – 180 °C were
investigated. For each individual resin, three blends were prepared, blank, with
5% capped PPODAx=6.1 inclusion, and with 5% capped PPODAx=33 inclusion.
Dynamic mechanical analysis revealed that, per each thermoset, the ones
containing 5% capped PPODAx=33 show the lowest crosslinking density and Tg.
Quasi-static tensile properties implied that Tg is the stress-strain shape determining
factor. For the thermosetting systems with Tg’s close to testing temperature, the
effect of induced molecular surfaces (due to presence of the inert capped PPODA)
significantly enhanced plastic deformation beyond yielding and prior to rupture.
This effect was substantially minimized for the high-Tg thermosets. Because the
crosslinkers are stiff in this case, plastic deformation is not likely to occur because
molecular motion, localized shear yielding, and void opening mechanisms are
considerably restricted though the molecular surfaces are present. SAXS study
indicated the deformation (in both size and shape) of the heterogeneous domains
upon mechanical extension.
236
Chapter 7. Synthesis and Characterization of Polymer Network Isomers
using Monoamine-functionalized Partially Reacted Substructures (mPRS)
7.1. Introduction
The effect of network structure on mechanical performance of thermosetting
polymers was investigated. It was shown that the presence of distinct molecular
surfaces (also known as protovoids) improves a material’s ductility without
affecting Young’s modulus, strength or glass transition temperature (Chapters 3
and 6). In addition, it was shown that rearranging the molecular structures such
that flexible agents create loosely crosslinked domains, rather than randomly
dispersed, significantly improved the fracture toughness (Chapter 5). Regardless
of the unique thermal and mechanical properties of the polymer network isomers,
discussed in Chapter 5, stress-strain curves of these systems did not show plastic
deformation in glassy state that was observed in the RES-modified systems
(Chapter 3).
It was determined that the lack of plastic deformation for thermosetting systems in
glassy state could be due to either relatively high Tg, or the absence of molecular
surfaces that allow molecular motions without bond breaking.

237
The effect of Tg was discussed in the previous Chapter. It was shown that Tg is the
major shape-determining parameter for the stress-strain curves of thermosetting
polymers in glassy state. Accordingly, the substantial plastic deformation in
modified polymer networks can never be observed if the crosslinkers are stiff, or
polymer Tg is high, even though molecular surfaces are present in the systems. The
reason was shown to be due to restriction in molecular motions, localized shear
yielding, and void opening.
The material discussed in Chapter 6 provides the preliminary investigation for the
studies in this Chapter. Although the results were promising, comparing the
mechanical properties of the systems with capped PPODAs was not satisfactory
because compositions, and subsequently Tg’s, were not the same due to presence of
the inert capped PPODAs. In this Chapter, the effect of the molecular surfaces in
high Tg thermosets will be investigated. Polymer network isomers with similar
compositions and varied molecular structures were synthesized and characterized.
The concepts and procedures in this Chapter are very similar to the studies in
Chapter 5, excepting that different PRS were used.
Figure 7.1 illustrates the difference between the molecular structures of the systems
discussed here and the ones discussed in Chapter 5. The difference between the

238
systems is the embedded PRS. One was prepared by using diamine curing agents,
while the other was prepared by incorporating monoamine curing agents.
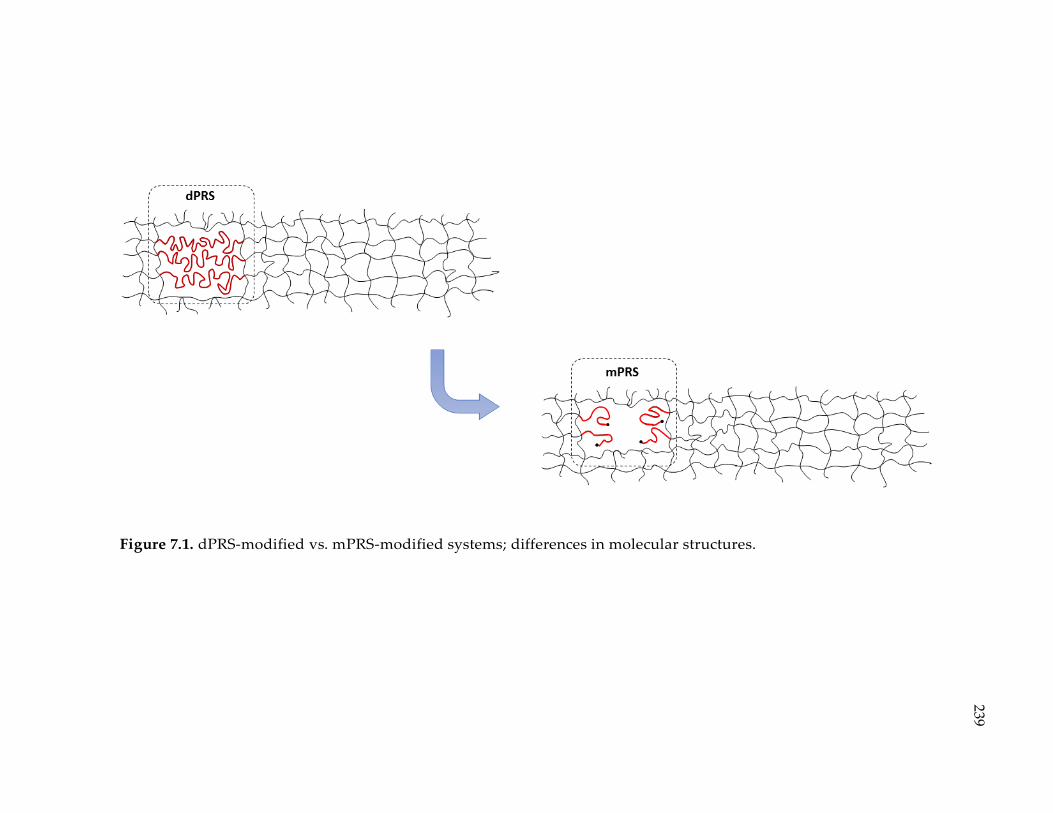
239
Figure 7.1. dPRS-modified vs. mPRS-modified systems; differences in molecular structures.
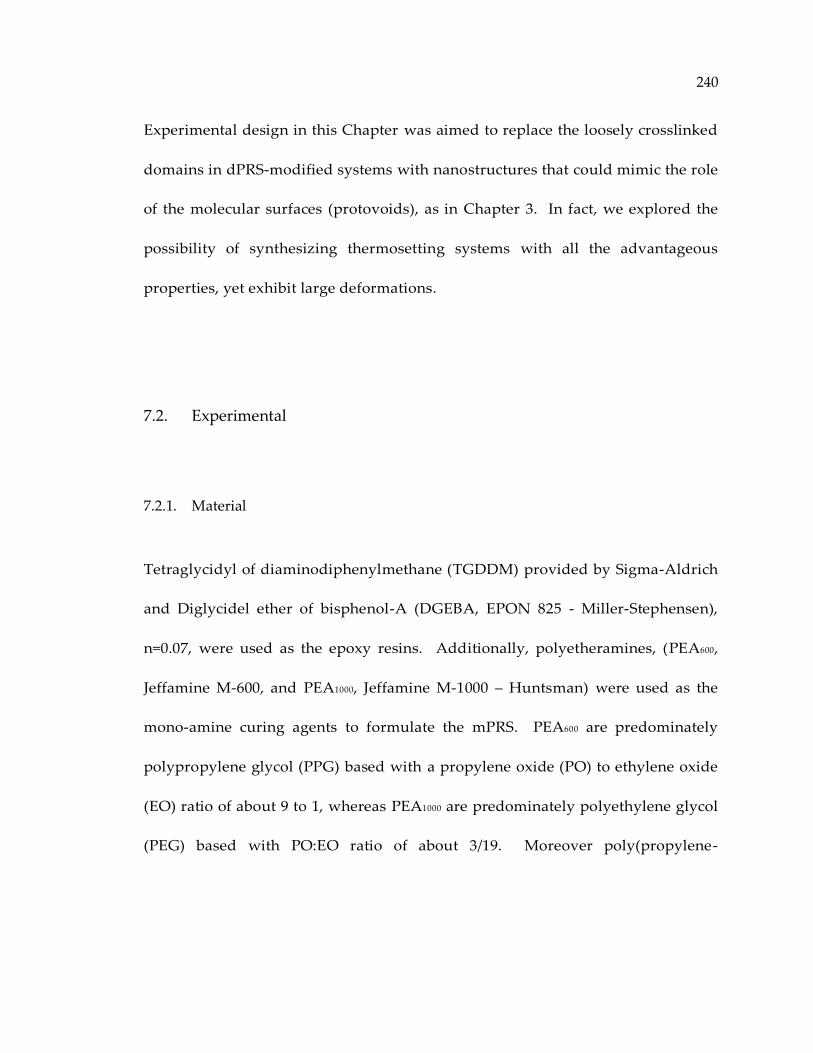
240
Experimental design in this Chapter was aimed to replace the loosely crosslinked
domains in dPRS-modified systems with nanostructures that could mimic the role
of the molecular surfaces (protovoids), as in Chapter 3. In fact, we explored the
possibility of synthesizing thermosetting systems with all the advantageous
properties, yet exhibit large deformations.
7.2. Experimental
7.2.1. Material
Tetraglycidyl of diaminodiphenylmethane (TGDDM) provided by Sigma-Aldrich
and Diglycidel ether of bisphenol-A (DGEBA, EPON 825 - Miller-Stephensen),
n=0.07, were used as the epoxy resins. Additionally, polyetheramines, (PEA600,
Jeffamine M-600, and PEA1000, Jeffamine M-1000 – Huntsman) were used as the
mono-amine curing agents to formulate the mPRS. PEA600 are predominately
polypropylene glycol (PPG) based with a propylene oxide (PO) to ethylene oxide
(EO) ratio of about 9 to 1, whereas PEA1000 are predominately polyethylene glycol
(PEG) based with PO:EO ratio of about 3/19. Moreover poly(propylene-

241
oxide)diamine (PPODAx=2.5, Jeffamine D230 – Huntsman) was used as the primary
curing agent. The molecular structures of these materials are shown in Figure 7.2.
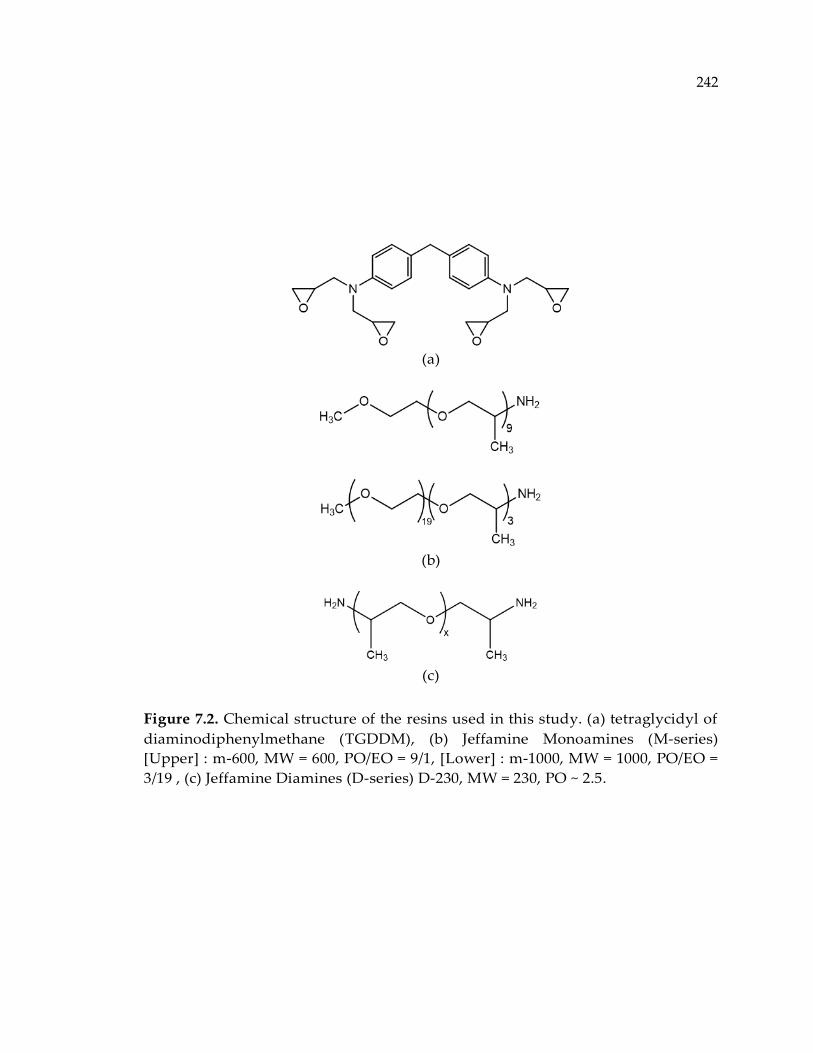
242
(a)
(b)
(c)
Figure 7.2. Chemical structure of the resins used in this study. (a) tetraglycidyl of
diaminodiphenylmethane (TGDDM), (b) Jeffamine Monoamines (M-series)
[Upper] : m-600, MW = 600, PO/EO = 9/1, [Lower] : m-1000, MW = 1000, PO/EO =
3/19 , (c) Jeffamine Diamines (D-series) D-230, MW = 230, PO ~ 2.5.
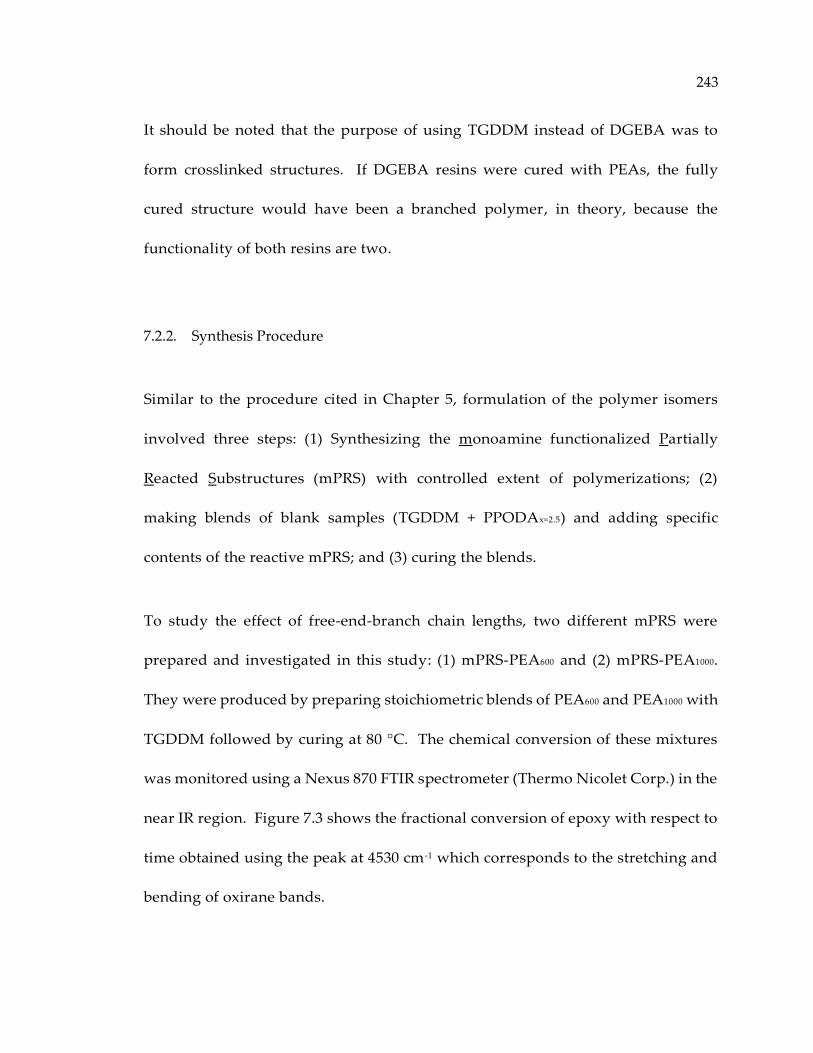
243
It should be noted that the purpose of using TGDDM instead of DGEBA was to
form crosslinked structures. If DGEBA resins were cured with PEAs, the fully
cured structure would have been a branched polymer, in theory, because the
functionality of both resins are two.
7.2.2. Synthesis Procedure
Similar to the procedure cited in Chapter 5, formulation of the polymer isomers
involved three steps: (1) Synthesizing the monoamine functionalized Partially
Reacted Substructures (mPRS) with controlled extent of polymerizations; (2)
making blends of blank samples (TGDDM + PPODAx=2.5) and adding specific
contents of the reactive mPRS; and (3) curing the blends.
To study the effect of free-end-branch chain lengths, two different mPRS were
prepared and investigated in this study: (1) mPRS-PEA600 and (2) mPRS-PEA1000.
They were produced by preparing stoichiometric blends of PEA600 and PEA1000 with
TGDDM followed by curing at 80 °C. The chemical conversion of these mixtures
was monitored using a Nexus 870 FTIR spectrometer (Thermo Nicolet Corp.) in the
near IR region. Figure 7.3 shows the fractional conversion of epoxy with respect to
time obtained using the peak at 4530 cm-1 which corresponds to the stretching and
bending of oxirane bands.
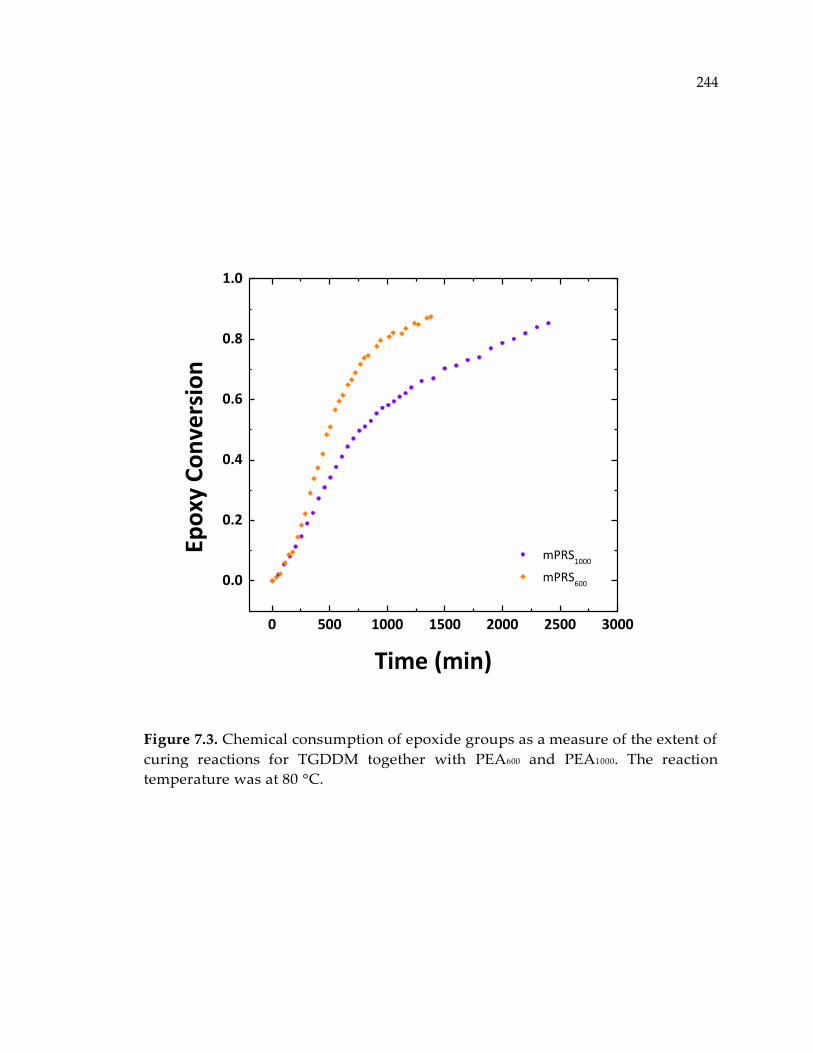
244
Figure 7.3. Chemical consumption of epoxide groups as a measure of the extent of
curing reactions for TGDDM together with PEA600 and PEA1000. The reaction
temperature was at 80 °C.
0 500 1000 1500 2000 2500 3000
0.0
0.2
0.4
0.6
0.8
1.0
mPRS1000
mPRS600
Epo
xy C
on
vers
ion
Time (min)

245
Curing reactions were stopped at 60% and 80% chemical conversion by removing
the samples from reaction condition and cooling to room temperature. The
resulting mPRS samples were labelled 60% and 80% conversion mPRS,
respectively. Specific amounts of each of the resulting mPRS were then added to
stoichiometric blends of TGDDM and PPODAx=2.5 to make solutions of 10% and 20%
by weight of mPRS. The cured samples were called mPRS-modified samples and
were labelled according to their mPRS chemical conversion. Additionally, batches
with 10% and 20% by weight of mPRS were prepared without the partial curing
step (i.e. 0% conversion). The resulting cured samples were called mPRS-control
samples (labelled “0% conversion mPRS”). Samples with the same mPRS content
for any mPRS chemical conversion were termed polymer network isomers because
they possessed the same overall chemical composition but differ in molecular
arrangement of network building blocks. For additional comparison, PEA-free
samples (blank samples) were also prepared by curing stoichiometric blends of
TGDDM and PPODAx=2.5. All blends were well mixed and degassed with a
centrifugal mixer. They were then oven-cured at 80 °C for 24 hours and post-cured
at 160 °C for 4 hours.
The importance of consistency should be noted during the curing procedure. If the
resin blends for polymer isomers were cured at different curing protocols, i.e.
different curing and post-curing temperatures, then topological structure of the
246
resulting polymers could have differed as a result of changing the substitution
factor, k2/k1, as discussed in Chapter 5. Accordingly, k1 and k2 are temperature
dependent, Arrhenius effect. If curing temperature of the control systems was
different than curing temperature of the corresponding modified isomers, the
differences in network topology could not claim to be solely due to the induced
mPRS nanostructures.
7.3. Results and Discussion
7.3.1. Glass Transition Temperature
Similar to the dPRS-modified system isomers, Tg values for the mPRS-modified
system isomers were measured using the TA-Q800 dynamic mechanical analyzer
in single cantilever mode. DMA specimens were heated at a temperature ramp rate
of 2 °C/min under a cyclic displacement with a frequency of 1 Hz and amplitude of
15 µm. Reported Tg values were based on the peak position of tan δ curves. Similar
to the dPRS systems, Tg values of the polymer isomers were not the same here.
Systems with the highest degree of PRS conversion had the highest Tg. Figures 7.4
and 7.5 show the tan δ curves of the blank, control, and modified samples at 10%

247
and 20% mPRS-PEA1000 content. The reason for the elevated Tg of the modified
polymer networks was discussed comprehensively in Chapter 5, and is not
discussed herein.
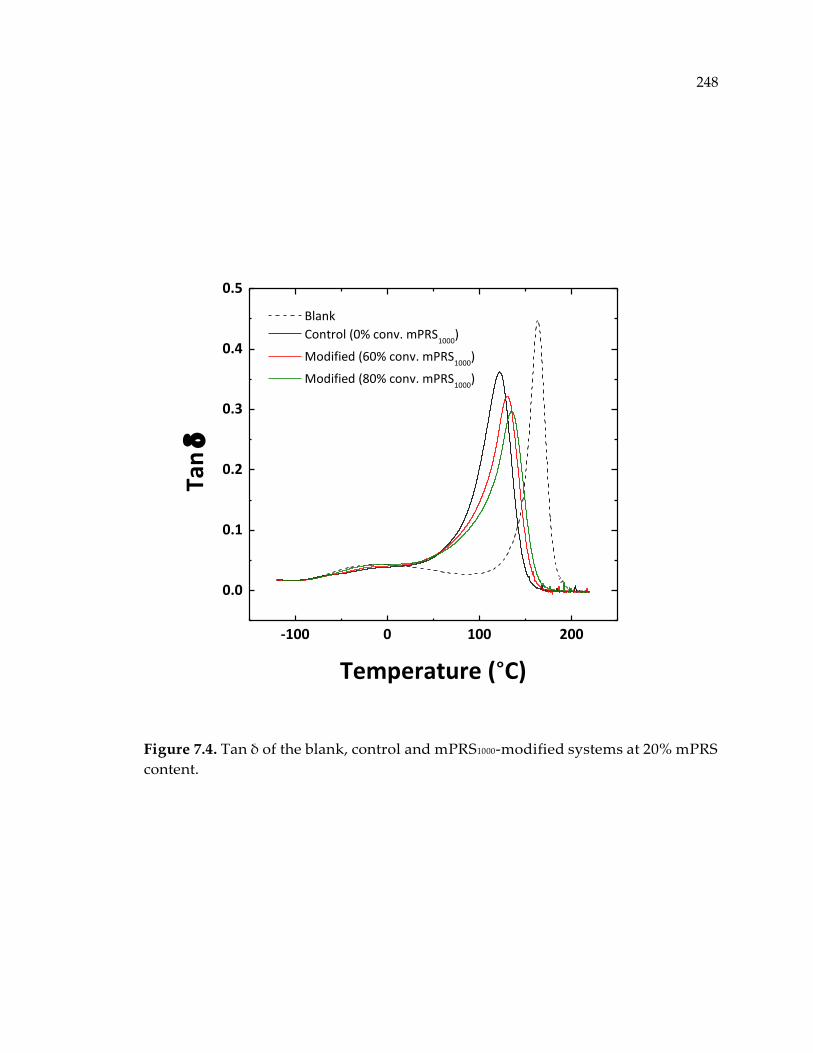
248
Figure 7.4. Tan δ of the blank, control and mPRS1000-modified systems at 20% mPRS
content.
-100 0 100 200
0.0
0.1
0.2
0.3
0.4
0.5
Blank
Control (0% conv. mPRS1000
)
Modified (60% conv. mPRS1000
)
Modified (80% conv. mPRS1000
)
Tan
Temperature (°C)
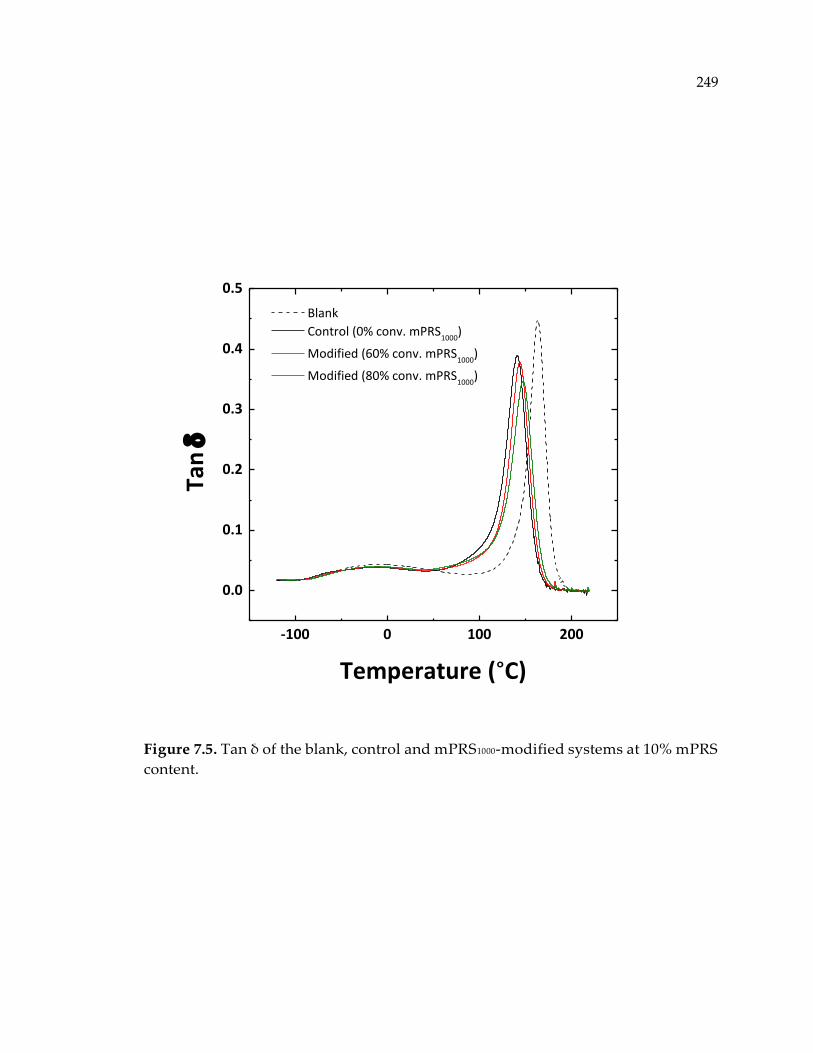
249
Figure 7.5. Tan δ of the blank, control and mPRS1000-modified systems at 10% mPRS
content.
-100 0 100 200
0.0
0.1
0.2
0.3
0.4
0.5
Blank
Control (0% conv. mPRS1000
)
Modified (60% conv. mPRS1000
)
Modified (80% conv. mPRS1000
)
Tan
Temperature (°C)
250
Moreover, tan δ curves for the corresponding polymer isomers reinforced with 10%
and 20% mPRS600 are shown in Figure 7.6 and 7.7. Similar to the observations on
dPRS systems (dPRS4000 vs dPRS2000), Tg difference between the control and the
modified systems was mitigated when smaller PEAs molecules (PEA600) were used.
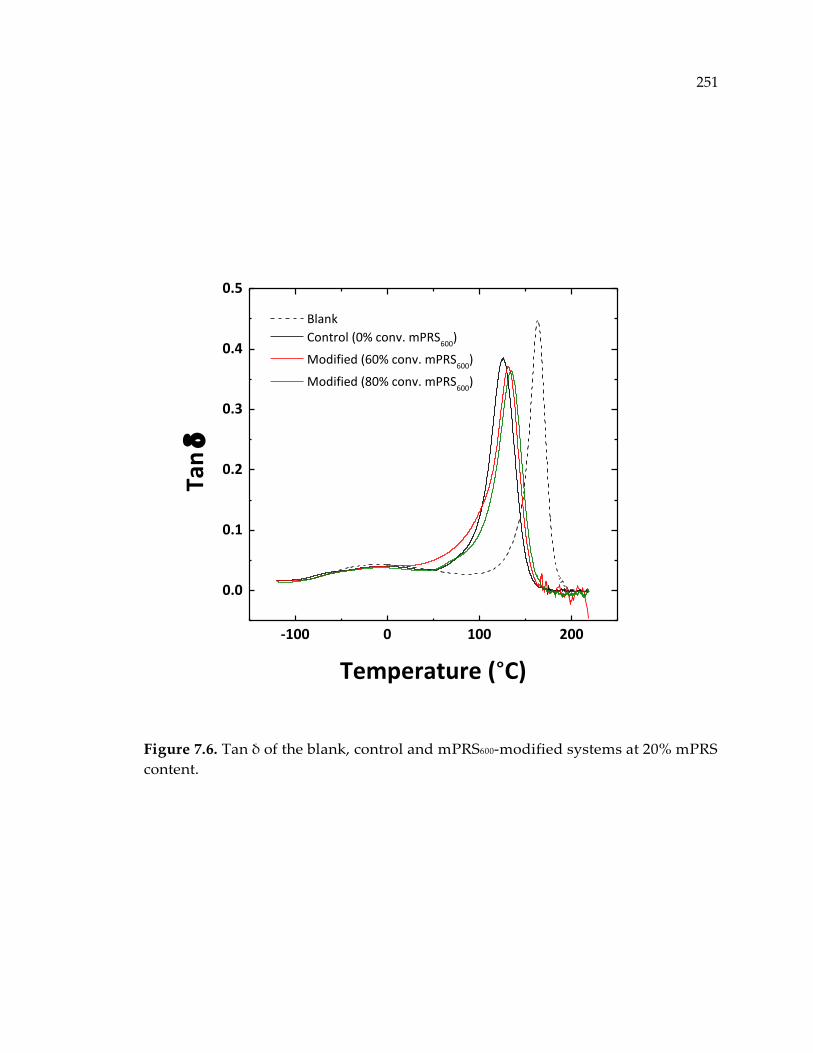
251
Figure 7.6. Tan δ of the blank, control and mPRS600-modified systems at 20% mPRS
content.
-100 0 100 200
0.0
0.1
0.2
0.3
0.4
0.5
Blank
Control (0% conv. mPRS600
)
Modified (60% conv. mPRS600
)
Modified (80% conv. mPRS600
)
Tan
Temperature (°C)
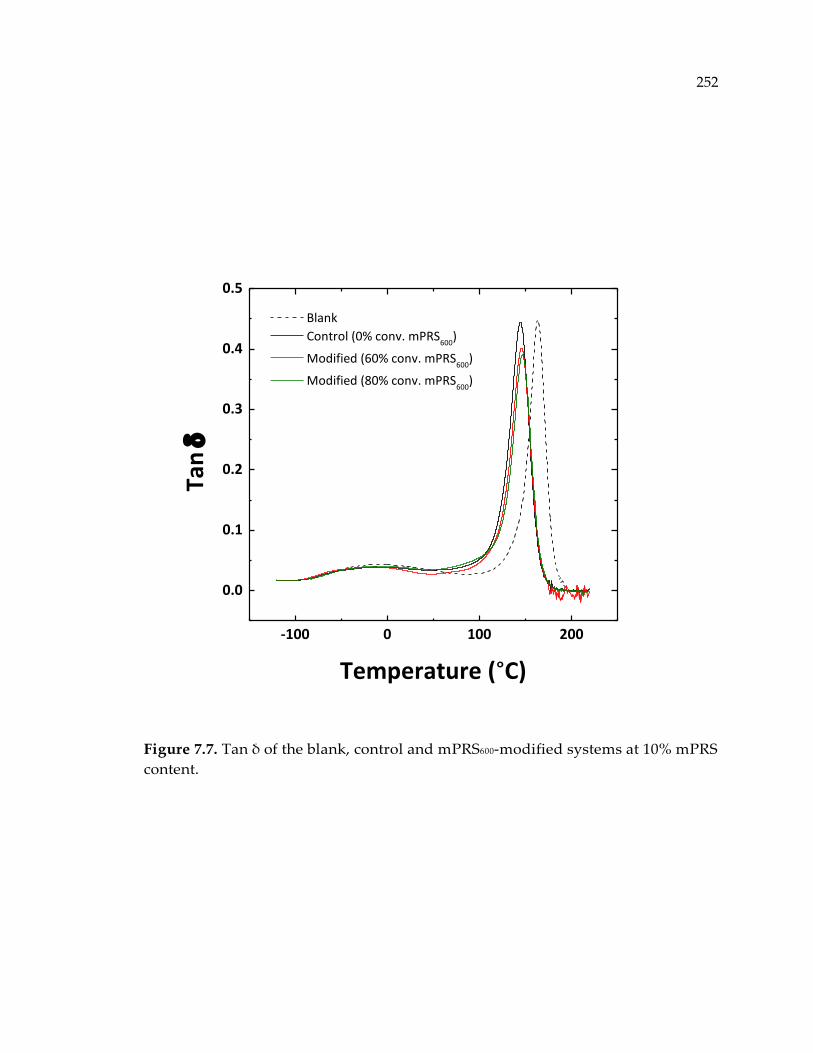
252
Figure 7.7. Tan δ of the blank, control and mPRS600-modified systems at 10% mPRS
content.
-100 0 100 200
0.0
0.1
0.2
0.3
0.4
0.5
Blank
Control (0% conv. mPRS600
)
Modified (60% conv. mPRS600
)
Modified (80% conv. mPRS600
)
Tan
Temperature (°C)

253
The glass transition temperature of the thermosetting systems studied here are
listed in Tables 7.1 and 7.2. The reported Tg values are based on the position of
peak of tan δ curves.
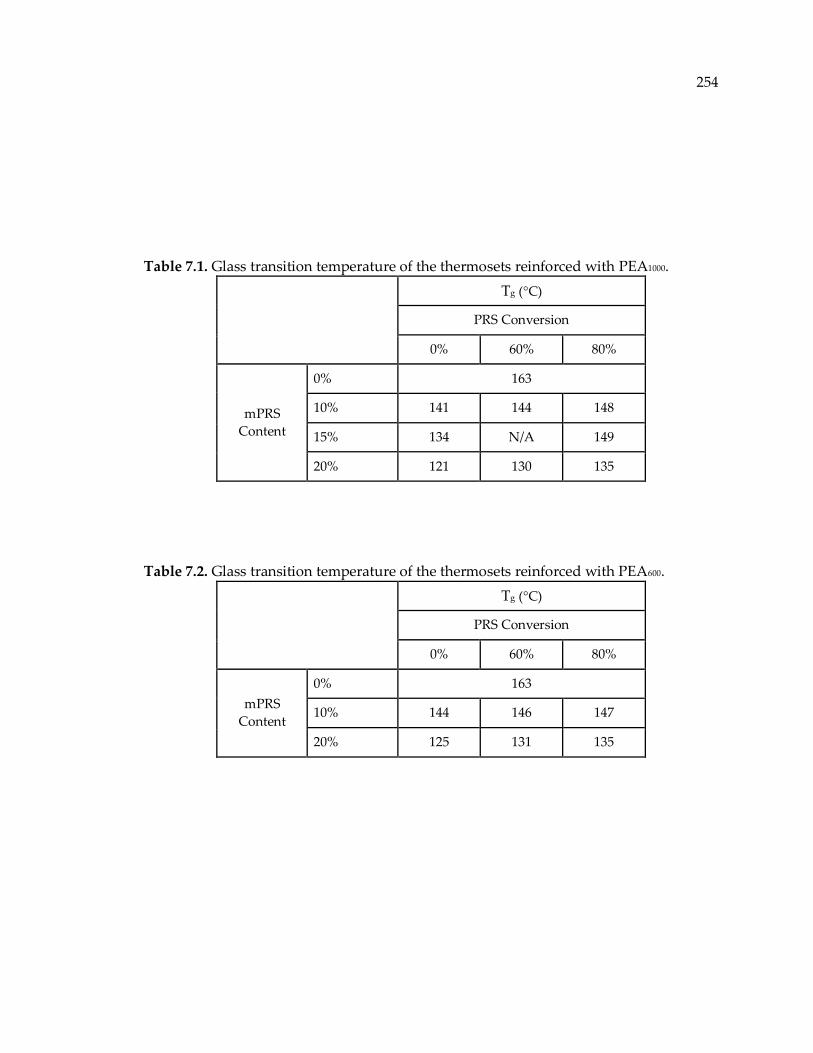
254
Table 7.1. Glass transition temperature of the thermosets reinforced with PEA1000.
Tg (°C)
PRS Conversion
0% 60% 80%
mPRS
Content
0% 163
10% 141 144 148
15% 134 N/A 149
20% 121 130 135
Table 7.2. Glass transition temperature of the thermosets reinforced with PEA600.
Tg (°C)
PRS Conversion
0% 60% 80%
mPRS
Content
0% 163
10% 144 146 147
20% 125 131 135

255
7.3.2. Fracture Toughness
Once samples were fully cured, they were cut into compact tension specimen
geometries. A compact tension test was performed under quasi-static tensile
loading with the crosshead speed of 1 mm/min following the ASTM D5045.
Values of critical strain energy release rate, G1c, were measured using linear elastic
fracture mechanics (LEFM). These values are shown in Figures 7.8 and 7.9 for
mPRS1000 and mPRS600, respectively. Average values and the corresponding
deviation for each data point were measured from at least 8 replicates.
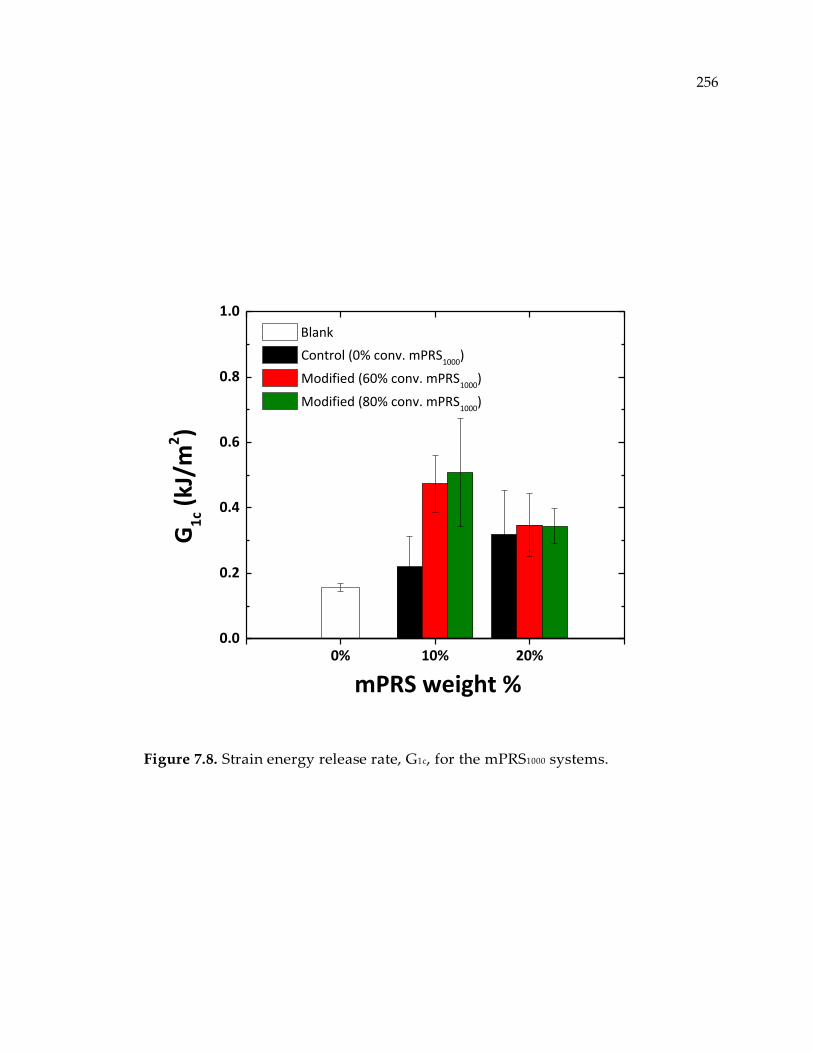
256
Figure 7.8. Strain energy release rate, G1c, for the mPRS1000 systems.
0% 10% 20%0.0
0.2
0.4
0.6
0.8
1.0
Control (0% conv. mPRS1000
)
Modified (60% conv. mPRS1000
)
Modified (80% conv. mPRS1000
)
mPRS weight %
G1
c (kJ
/m2)
Blank
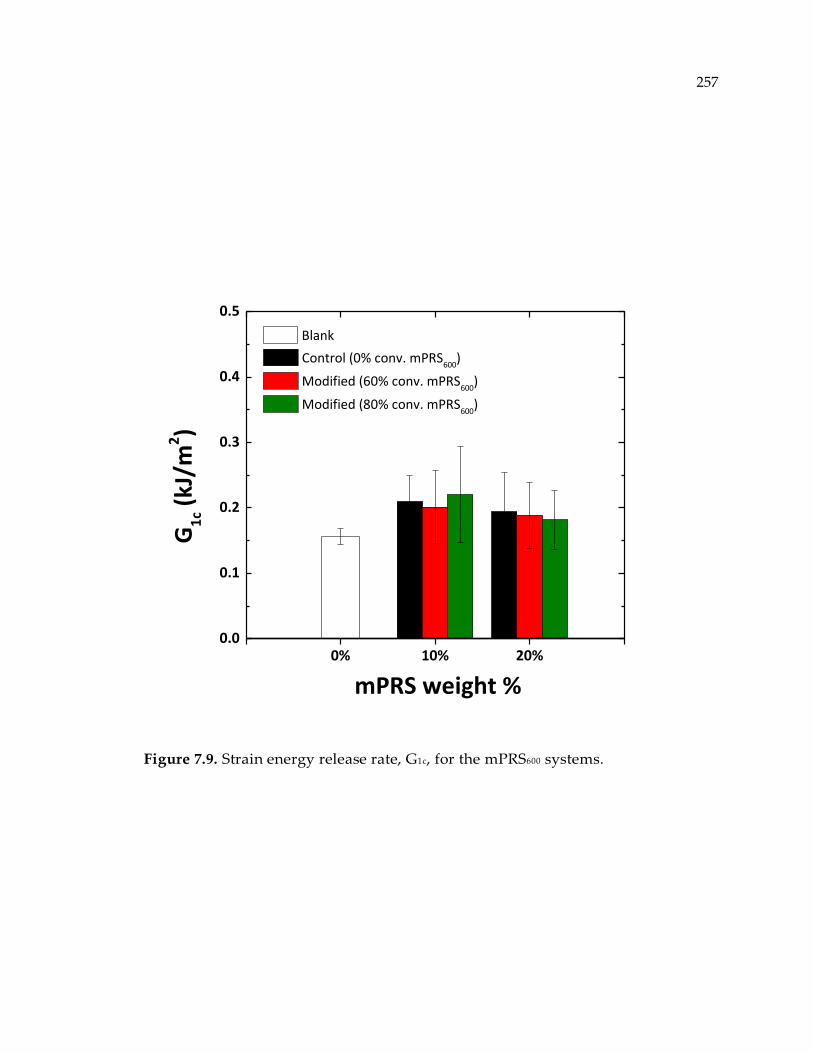
257
Figure 7.9. Strain energy release rate, G1c, for the mPRS600 systems.
0% 10% 20%0.0
0.1
0.2
0.3
0.4
0.5
mPRS weight %
G1
c (kJ
/m2)
Control (0% conv. mPRS600
)
Modified (60% conv. mPRS600
)
Modified (80% conv. mPRS600
)
Blank
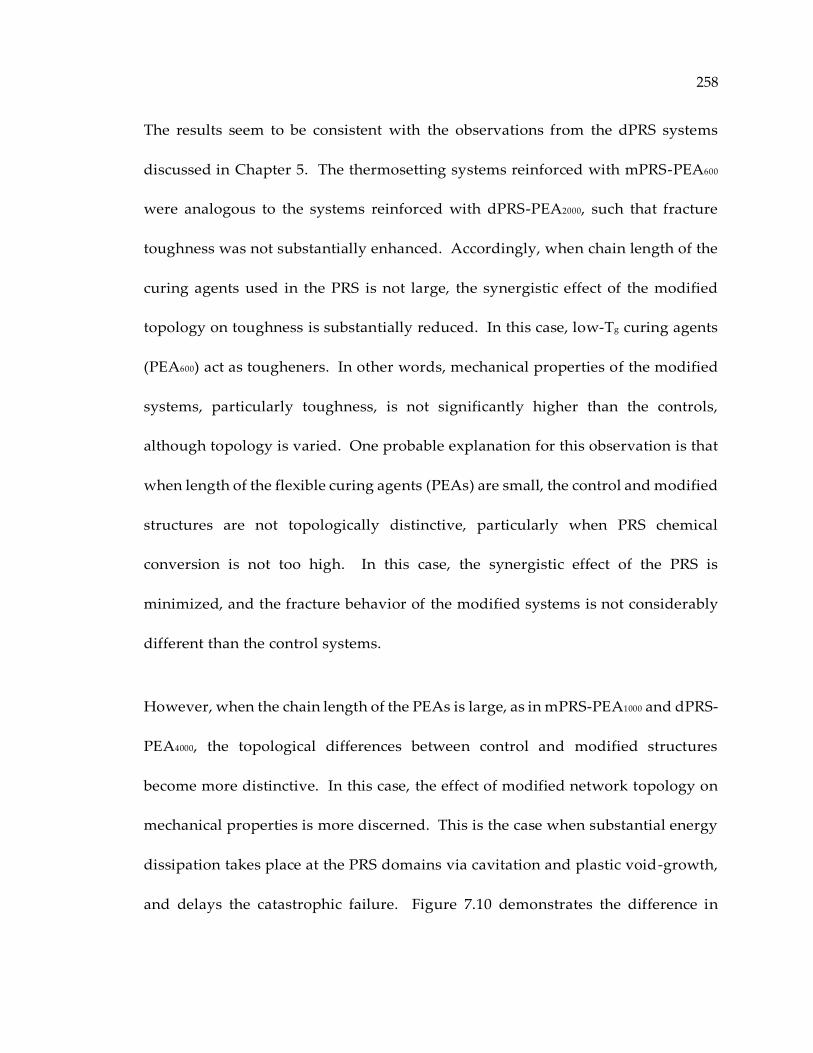
258
The results seem to be consistent with the observations from the dPRS systems
discussed in Chapter 5. The thermosetting systems reinforced with mPRS-PEA600
were analogous to the systems reinforced with dPRS-PEA2000, such that fracture
toughness was not substantially enhanced. Accordingly, when chain length of the
curing agents used in the PRS is not large, the synergistic effect of the modified
topology on toughness is substantially reduced. In this case, low-Tg curing agents
(PEA600) act as tougheners. In other words, mechanical properties of the modified
systems, particularly toughness, is not significantly higher than the controls,
although topology is varied. One probable explanation for this observation is that
when length of the flexible curing agents (PEAs) are small, the control and modified
structures are not topologically distinctive, particularly when PRS chemical
conversion is not too high. In this case, the synergistic effect of the PRS is
minimized, and the fracture behavior of the modified systems is not considerably
different than the control systems.
However, when the chain length of the PEAs is large, as in mPRS-PEA1000 and dPRS-
PEA4000, the topological differences between control and modified structures
become more distinctive. In this case, the effect of modified network topology on
mechanical properties is more discerned. This is the case when substantial energy
dissipation takes place at the PRS domains via cavitation and plastic void-growth,
and delays the catastrophic failure. Figure 7.10 demonstrates the difference in

259
structural topology between mPRS-modified thermosets and the corresponding
controls.
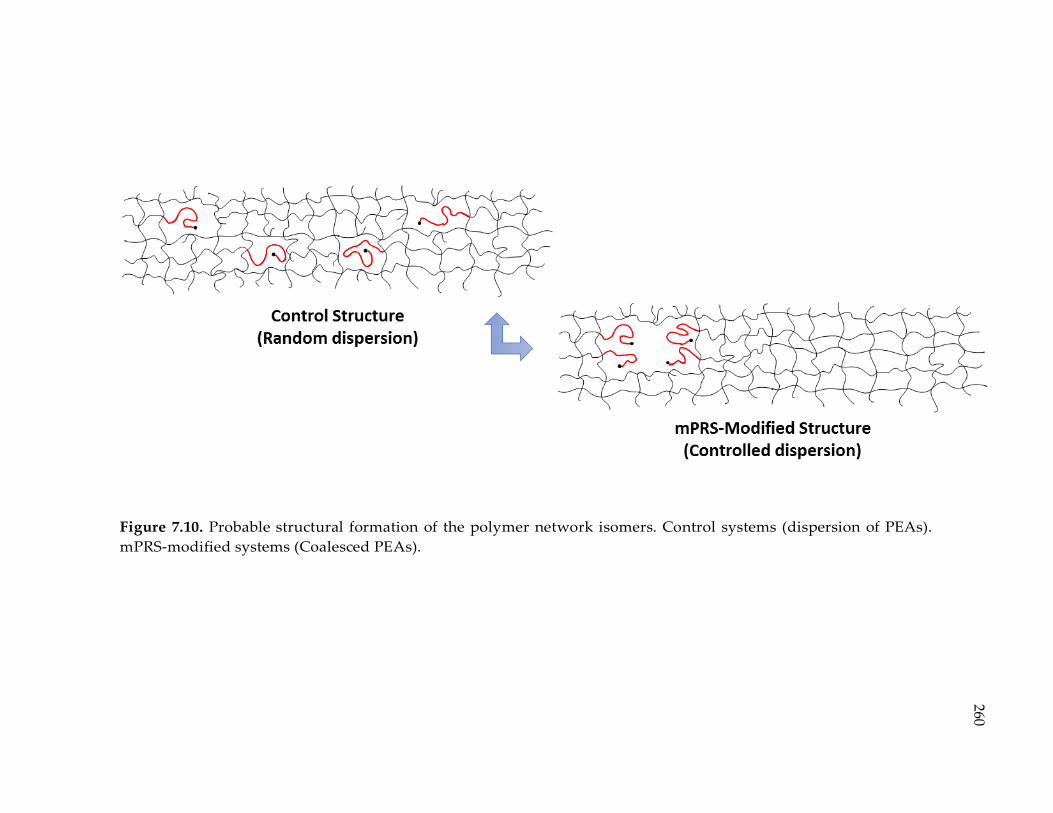
260
Figure 7.10. Probable structural formation of the polymer network isomers. Control systems (dispersion of PEAs).
mPRS-modified systems (Coalesced PEAs).

261
Figure 7.11 shows the representative SEM micrographs from the fracture surfaces
of the blank, control, and mPRS-modified samples, respectively. The control and
modified samples were at 10% mPRS content. Fracture surface morphologies of
the blank and control samples only varied in roughness. However, fracture surface
morphology of the polymer isomers, control vs. mPRS-modified, indicated the
presence of cavities. As a result, void opening is the governing mechanism
resulting in higher toughness for the mPRS-modified systems.
262
Figure 7.11. SEM micrographs from the fracture surfaces of Blank, Control, and Modified structures. The control and
modified samples were at 10% mPRS content, and the mPRS conversion was at 80%. Scale bars are 1µm in size.
263
A question arises as to why the increase of PRS chemical conversion is not affecting
the G1c values for the batches with 20% mPRS loading. In fact, the same behavior
was observed when dPRS was used. In the case of dPRS systems, insensitivity of
toughness to PRS conversion was observed above 20% dPRS inclusions. These
results are shown in Appendix E. One possible explanation for this observation
could be due to the nature of the cracks. As PRS content goes up, final Tg decreases.
Considering that testing temperature is constant (room temperature), the samples
with relatively high-Tg (when temperature difference between Tg and testing
temperature is large) reveals “brittle stable” cracks. As the Tg of the testing samples
gets closer to the testing temperature, “brittle unstable” and “ductile” cracks are
observed, respectively.1, 2 The 20% mPRS samples, similar to the 30% dPRS
samples, exhibited brittle unstable (stick/slip) cracks. In these cases, initial
failure/slip happened at smaller loadings than the identical systems at lower mPRS
contents, hence lower fracture toughness values observed. This observation is
justifiable when one recognizes that the tensile strength of the systems with lower
mPRS content is lower than that of the systems with higher mPRS content. Lower
tensile strength is equivalent to lower load-bearing maximum in a polymer, and
subsequently lower fracture toughness. Therefore, unlike PRS conversion, PRS
content is not favorable for improving mechanical performance and fracture
behavior.
264
7.3.3. Quasi-Static Tensile Properties
Thus far, it has been shown that the incorporation of mPRS with elevated mPRS
chemical conversion improves fracture toughness. However, the fundamental
question as to what extent the existing molecular surfaces in the mPRS-modified
systems can improve material’s elongation when material’s Tg is relatively high,
has yet to be answered.
Dog-bone shape coupons from blank, control and modified resins were casted and
cured following the same procedure as described in the “synthesis procedure” of
this Chapter. At least 6 specimens from each batch were loaded under a uniaxial
extension with a crosshead speed of 1 mm/min using a hydraulic INSTRON
apparatus.
Figure 7.12, shows the representative stress-strain curves of the polymer network
isomers reinforced with mPRS1000 at 20% mPRS loading. Interestingly, the
embedded molecular surfaces enhanced the failure strains by more than 100%.
Considering the absorbed energy (area under the stress-strain curve), the difference
between control and modified systems was even greater. To our knowledge, this
stress-strain behavior for high-Tg thermosetting systems below Tg (in glassy state)
has never been observed elsewhere. This remarkable elongation in mPRS-modified
systems originates from localized polymer chain motions and void opening at the
265
molecular surfaces. The induced molecular surfaces in polymer network structures
allow limited molecular motions without bond breaking. Overall, the mPRS-
modified system revealed higher elongation, higher Tg, and higher fracture
toughness than the corresponding control systems, where tensile strength and
modulus were almost equivalent.
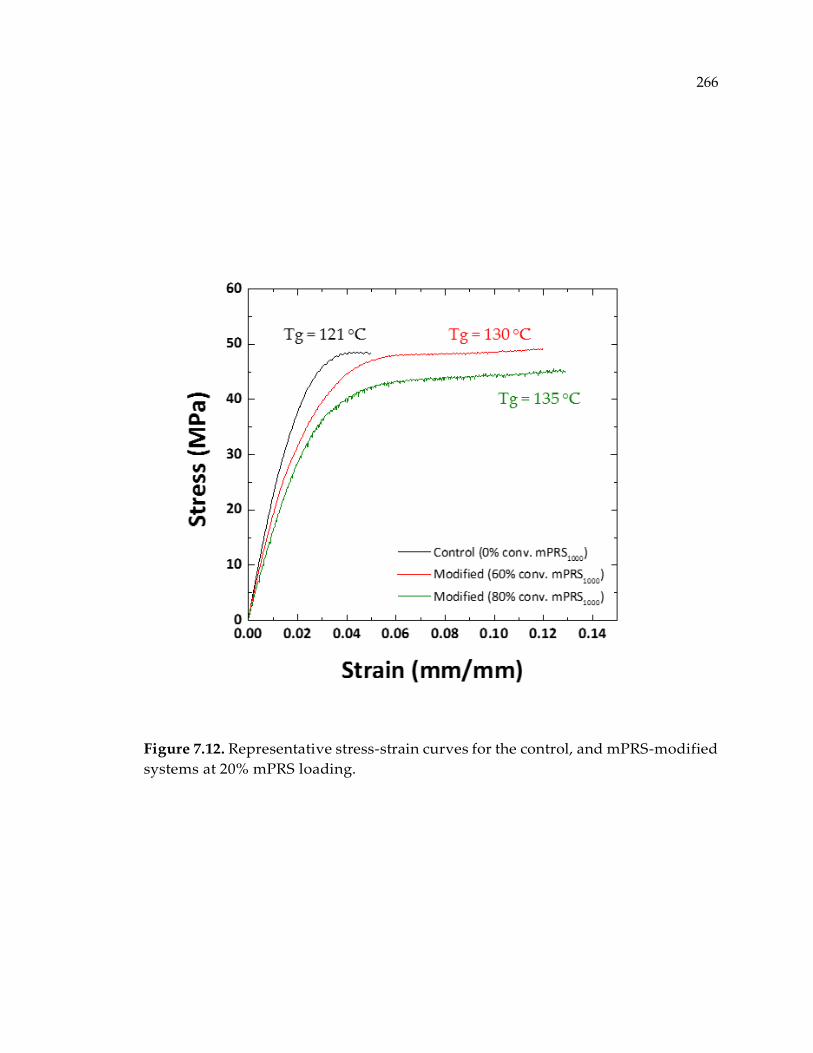
266
Figure 7.12. Representative stress-strain curves for the control, and mPRS-modified
systems at 20% mPRS loading.
267
Figure 7.13 and 7.14 show the representative stress-strain curves of the control and
modified systems at different mPRS content. As expected, increasing the mPRS
content clearly reduces Young’s modulus and strength; however, the enhanced
elongation that was captured in the modified systems was never observed in the
controls.
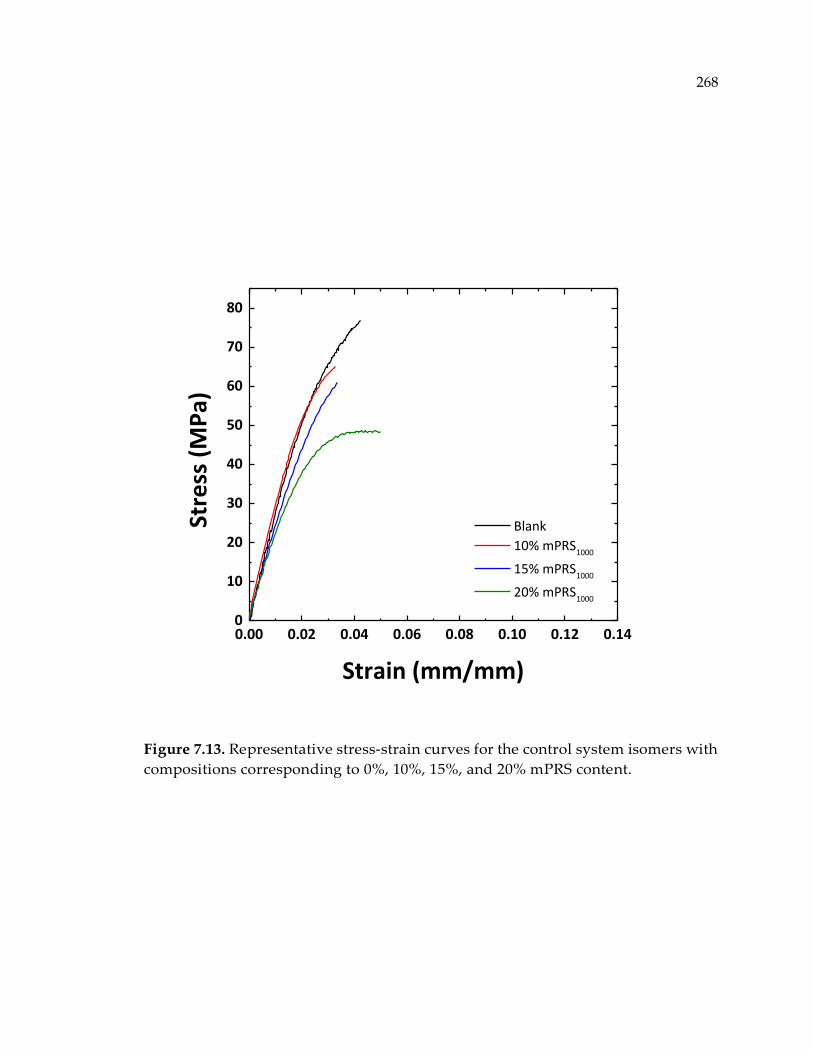
268
Figure 7.13. Representative stress-strain curves for the control system isomers with
compositions corresponding to 0%, 10%, 15%, and 20% mPRS content.
0.00 0.02 0.04 0.06 0.08 0.10 0.12 0.140
10
20
30
40
50
60
70
80
Blank
10% mPRS1000
15% mPRS1000
20% mPRS1000
Stre
ss (
MP
a)
Strain (mm/mm)
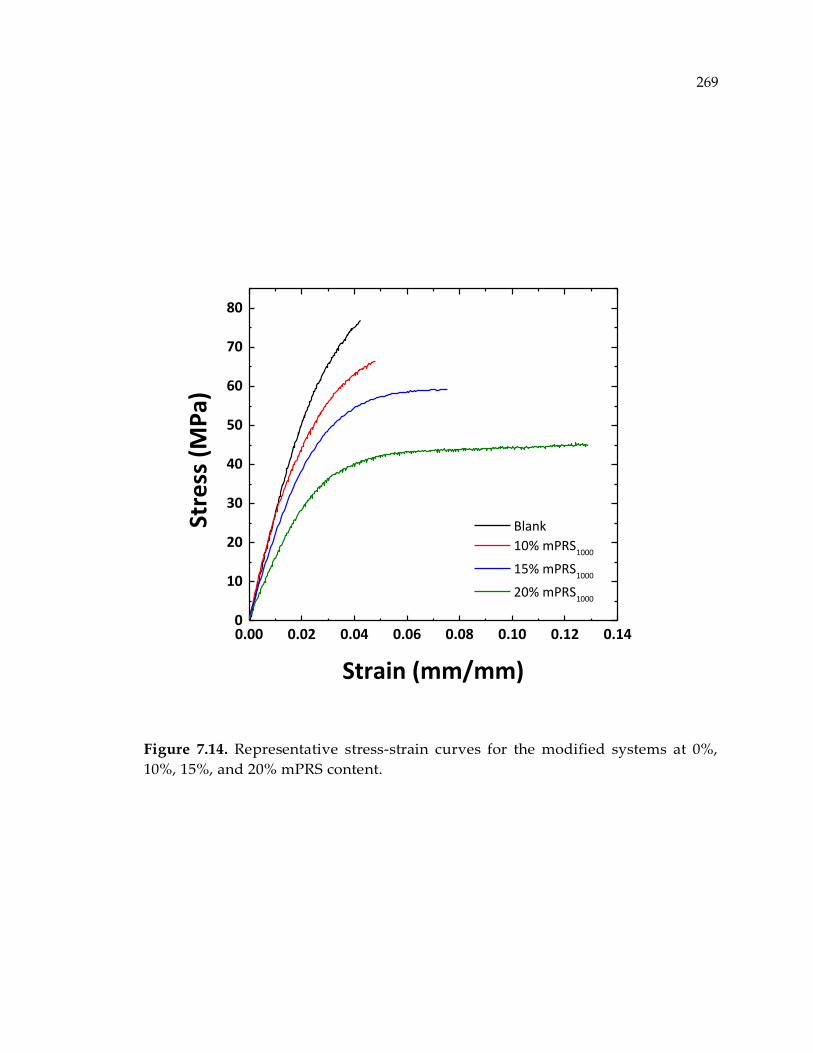
269
Figure 7.14. Representative stress-strain curves for the modified systems at 0%,
10%, 15%, and 20% mPRS content.
0.00 0.02 0.04 0.06 0.08 0.10 0.12 0.140
10
20
30
40
50
60
70
80
Blank
10% mPRS1000
15% mPRS1000
20% mPRS1000
Stre
ss (
MP
a)
Strain (mm/mm)
270
Table 7.3, and 7.4 list the average values of Young’s modulus, tensile strength, and
failure strain of the polymer networks reinforced with mPRS1000 and mPRS600,
respectively. The enhanced elongation was not observed for the systems reinforced
with mPRS600 or the ones with 10% content of mPRS1000. The insignificant difference
in stress-strain behavior of control and mPRS600-modified samples was attributed
to the relatively indistinguishable network topologies. When shorter PEAs are
used, the effect of network topology on mechanical behavior of thermosetting
systems is minimized because differences in network topology are rather small and
relatively indistinguishable. However, the lack of large deformation for the
samples at 10% mPRS content was not expected. Although a slight increase in
failure strain was observed for modified samples in this case, results suggest that
mPRS content seems to be a critical factor in determining the level of elongation.

271
Table 7.3. Average values of Young’s modulus, Tensile strength, and failure strain for the systems reinforced with PEA1000.
Young's Modulus, E (GPa) Tensile Strength, σy (MPa) Failure Strain, εr (%)
PRS Conversion PRS Conversion PRS Conversion
0% 60% 80% 0% 60% 80% 0% 60% 80%
mPRS
Content
0% 2.7 ± 0.1 73.7 ± 6.6 4.5 ± 0.3
10% 2.8 ± 0.1 2.5 ± 0.1 2.6 ± 0.2 61.7 ± 6.6 66.2 ± 2.5 63.5 ± 2.4 3.3 ± 0.9 5.3 ± 0.8 4.6 ± 0.3
15% 2.4 ± 0.1 N/A 2.1 ± 0.1 61.1 ± 3.4 N/A 58.9 ± 2.3 3.4 ± 1.3 N/A 7.3 ± 2.2
20% 2.0 ± 0.2 1.8 ± 0.1 1.6 ± 0.1 47.9 ± 0.6 48.4 ± 0.8 45.1 ± 0.6 5.4 ± 1.9 9.7 ± 1.6 8.9 ± 2.7
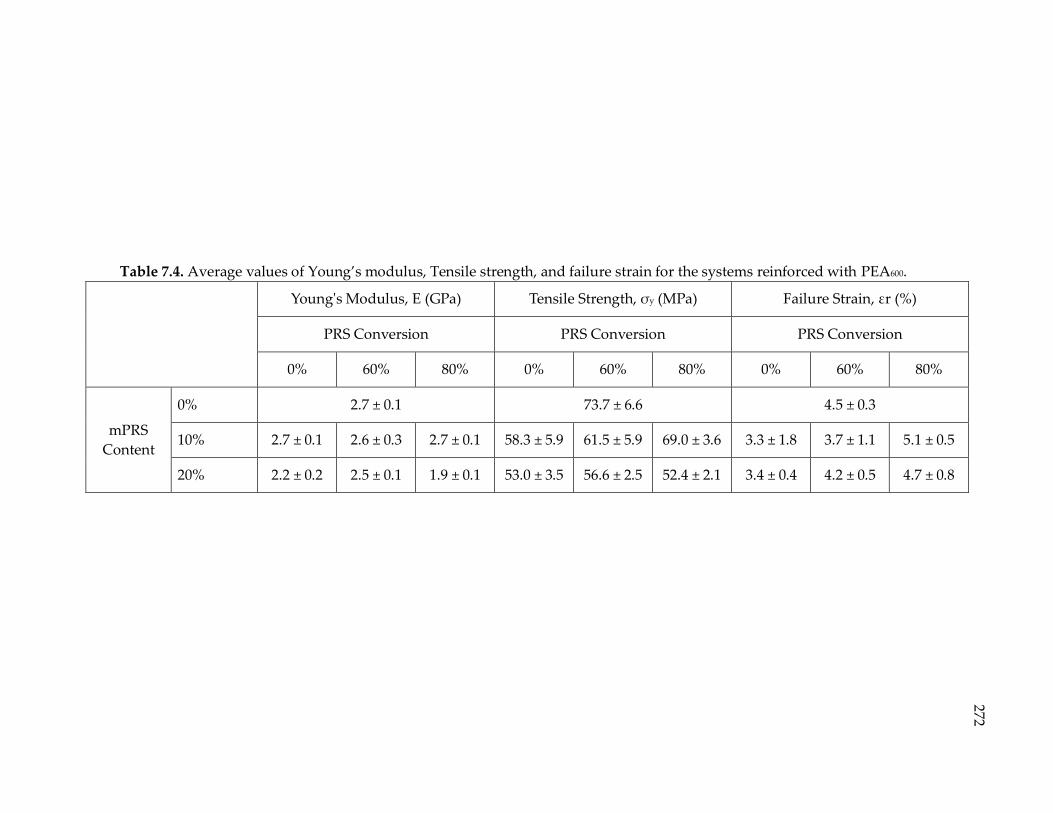
272
Table 7.4. Average values of Young’s modulus, Tensile strength, and failure strain for the systems reinforced with PEA600.
Young's Modulus, E (GPa) Tensile Strength, σy (MPa) Failure Strain, εr (%)
PRS Conversion PRS Conversion PRS Conversion
0% 60% 80% 0% 60% 80% 0% 60% 80%
mPRS
Content
0% 2.7 ± 0.1 73.7 ± 6.6 4.5 ± 0.3
10% 2.7 ± 0.1 2.6 ± 0.3 2.7 ± 0.1 58.3 ± 5.9 61.5 ± 5.9 69.0 ± 3.6 3.3 ± 1.8 3.7 ± 1.1 5.1 ± 0.5
20% 2.2 ± 0.2 2.5 ± 0.1 1.9 ± 0.1 53.0 ± 3.5 56.6 ± 2.5 52.4 ± 2.1 3.4 ± 0.4 4.2 ± 0.5 4.7 ± 0.8
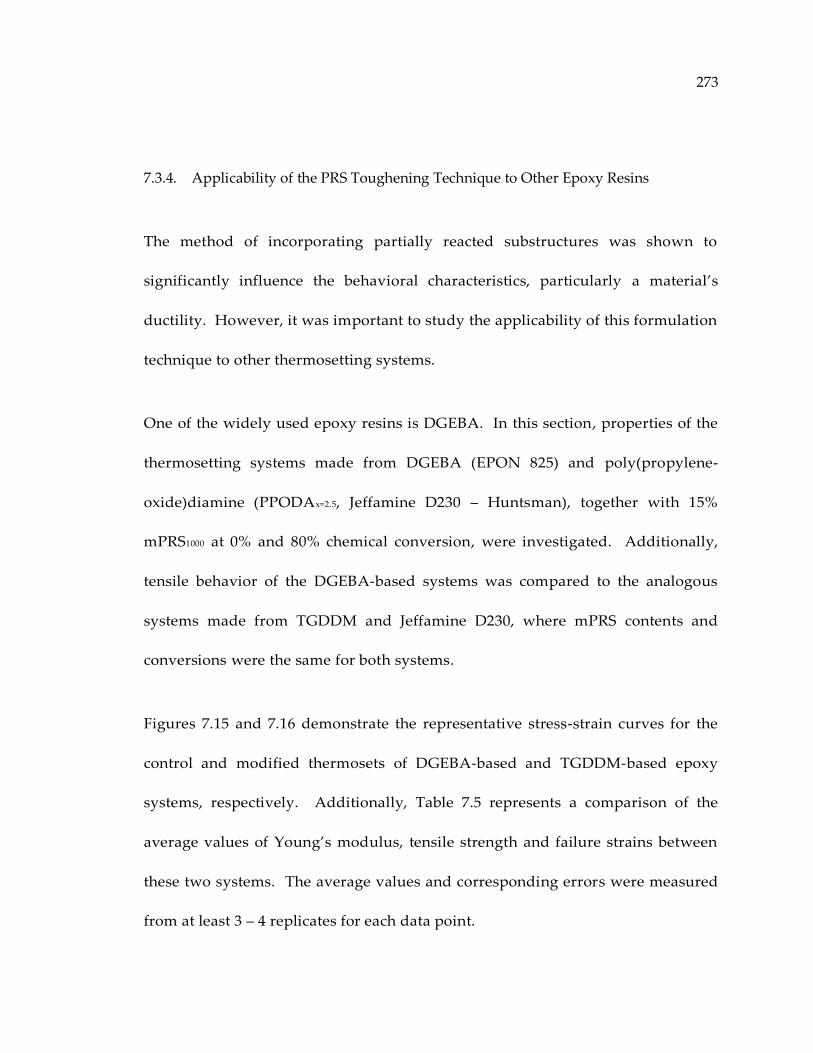
273
7.3.4. Applicability of the PRS Toughening Technique to Other Epoxy Resins
The method of incorporating partially reacted substructures was shown to
significantly influence the behavioral characteristics, particularly a material’s
ductility. However, it was important to study the applicability of this formulation
technique to other thermosetting systems.
One of the widely used epoxy resins is DGEBA. In this section, properties of the
thermosetting systems made from DGEBA (EPON 825) and poly(propylene-
oxide)diamine (PPODAx=2.5, Jeffamine D230 – Huntsman), together with 15%
mPRS1000 at 0% and 80% chemical conversion, were investigated. Additionally,
tensile behavior of the DGEBA-based systems was compared to the analogous
systems made from TGDDM and Jeffamine D230, where mPRS contents and
conversions were the same for both systems.
Figures 7.15 and 7.16 demonstrate the representative stress-strain curves for the
control and modified thermosets of DGEBA-based and TGDDM-based epoxy
systems, respectively. Additionally, Table 7.5 represents a comparison of the
average values of Young’s modulus, tensile strength and failure strains between
these two systems. The average values and corresponding errors were measured
from at least 3 – 4 replicates for each data point.
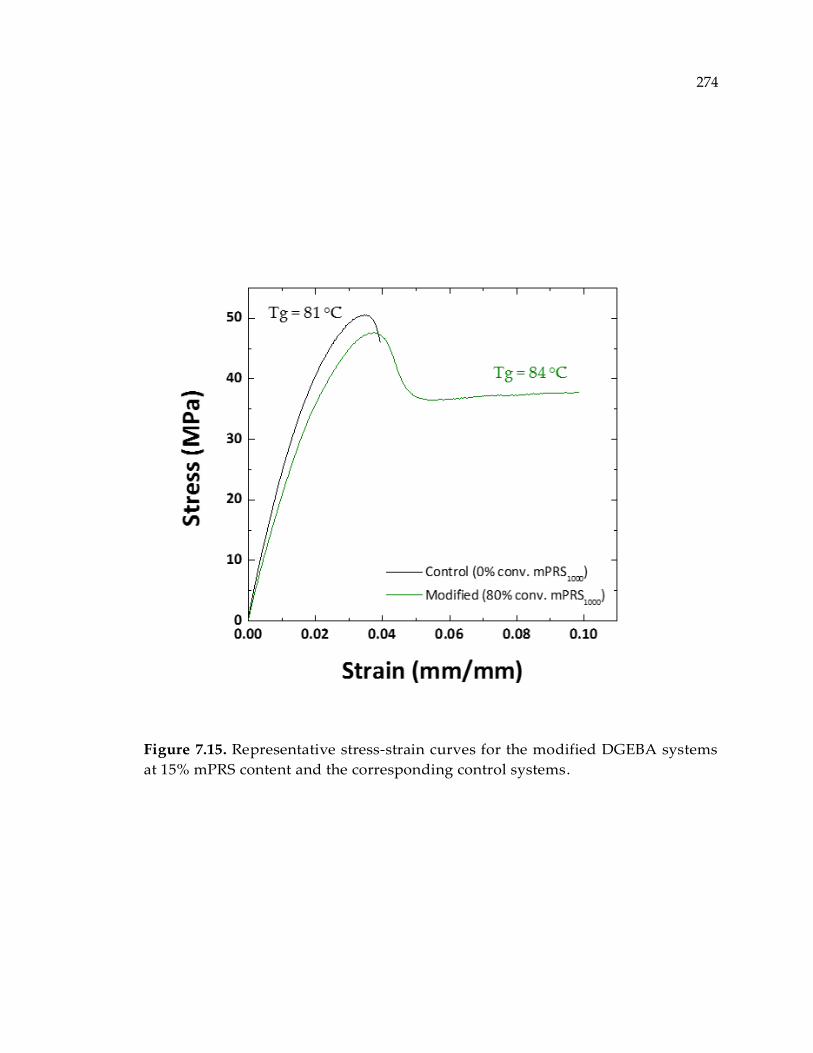
274
Figure 7.15. Representative stress-strain curves for the modified DGEBA systems
at 15% mPRS content and the corresponding control systems.
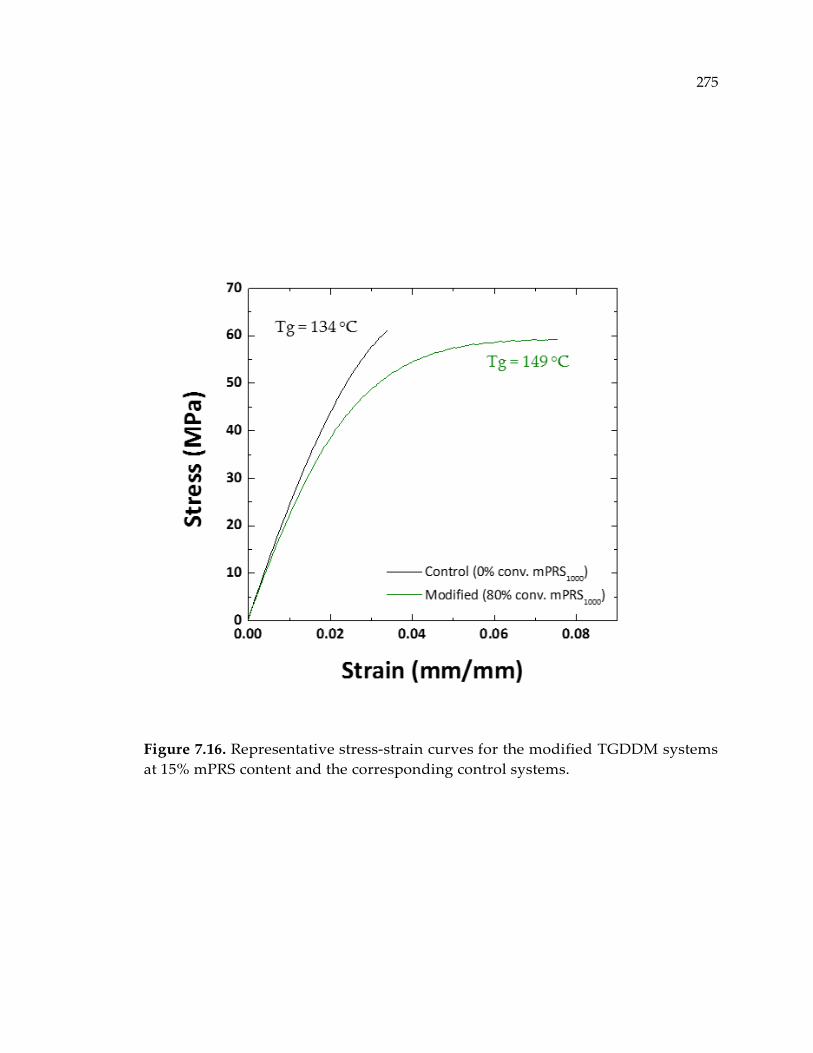
275
Figure 7.16. Representative stress-strain curves for the modified TGDDM systems
at 15% mPRS content and the corresponding control systems.
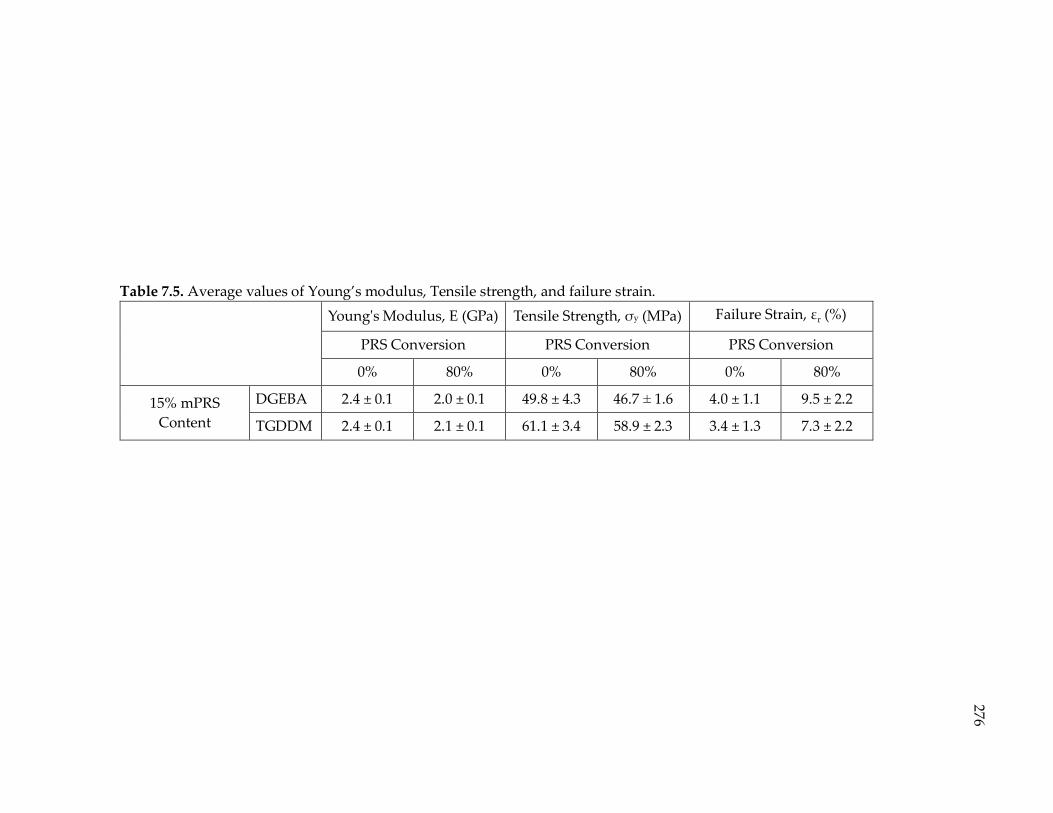
276
Table 7.5. Average values of Young’s modulus, Tensile strength, and failure strain.
Young's Modulus, E (GPa) Tensile Strength, σy (MPa) Failure Strain, εr (%)
PRS Conversion PRS Conversion PRS Conversion
0% 80% 0% 80% 0% 80%
15% mPRS
Content
DGEBA 2.4 ± 0.1 2.0 ± 0.1 49.8 ± 4.3 46.7 ± 1.6 4.0 ± 1.1 9.5 ± 2.2
TGDDM 2.4 ± 0.1 2.1 ± 0.1 61.1 ± 3.4 58.9 ± 2.3 3.4 ± 1.3 7.3 ± 2.2
277
The results clearly indicate the applicability of the mPRS toughening technique to
the DGEBA systems. A substantially large deformation was observed for the
modified DGEBA systems (more than two times larger than the controls), while
modulus and tensile strength were almost identical. This observation was
consistent with our earlier observation of TGDDM systems.
However, an indication of strain softening (necking) was noticed in the DGEBA
modified systems while no indication was seen in the TGDDM modified systems.
The necking could be related to the Tg of the systems, as discussed in Chapter 6.
The DGEBA systems revealed Tg values of about 81 °C and 84 °C for the control
and modified samples, respectively, whereas the values were 134 °C and 149 °C for
the samples made from TGDDM. The difference in stress-strain behavior could
also be due to the difference in the chemical structure and functionality of the epoxy
resins. TGDDM is a tetra-functional resin, as opposed to the di-functional DGEBA.
It is also smaller in molecular size than DGEBA. Consequently, fully cured
TGDDM systems have a significantly higher crosslinking density and lower
molecular weight between crosslinks than DGEBA systems. This might be the
reason why the deformation in the modified DGEBA systems is permanent (plastic
deformation), while the deformation in the modified TGDDM systems recovered
(elastic deformation). In fact, the mPRS-modified systems exhibited nonlinear
elastic behavior and behaved like a super elastomer. More in-depth investigation
278
(molecular simulations) is necessary to elucidate the relationship between the
chemical structure of the epoxy resins and the stress-strain behavior for this
particular thermosetting system to determine why mechanical behavior of the
mPRS-modified DGEBA systems is different than that of the TGDDM systems”.
7.3.5. Advantages of mPRS Resins
The key factor in synthesis and formulation of the PRS (dPRS or mPRS) was to
consider the ease of processing. To be largely applicable in industrial settings, the
PRS resins must have low viscosity, and low reactivity after reaching a certain
chemical conversion. It must show good miscibility with the commercially
available resins and curing agents. So far, we have shown that the dPRS4000 and
mPRS1000 are the preferred PRS resins. Although both are known to effectively
improve thermal and mechanical properties, mPRS1000 is preferable. Experimental
rheology on both samples revealed that the room-temperature viscosity of mPRS1000
is lower than that that of the dPRS4000 at the same level of chemical conversion. This
is very advantageous from a manufacturing perspective as it significantly ease the
material’s processing.
On the other hand, a major concern regarding this technology is the PRS shelf life,
while mPRS1000 is preferred due to its longer shelf life. Both PEA1000 and mPRS1000
279
crystalize at room temperature. The crystallization and melting point of mPRS1000
are shown in the DSC thermograph in Appendix F. Therefore, curing reactions are
extremely suppressed in solid phase. As a result, reactive PRS remain at the
specified chemical conversion, even after very long period of time.
7.3.6. Gelation Delay in the PRS
Another observation during curing reactions of DGEBA/TGDDM and PEAs was
the delay (from the theoretical value) in gelation point. Our earlier studies of the
dPRS systems indicated delay in gelation points as well. According to Flory-
Stockmayer,3, 4 for a bimodal mixture, the critical extent of reaction at gel point can
be measured from the below equation, assuming the reactants are mixed at
stoichiometric amounts, and the functional groups have equal reactivity,
𝑋𝑔𝑒𝑙 =1
√(𝑓 − 1)(𝑔 − 1) (7.1)
where 𝑓 and 𝑔 are the functionality of the reactive groups. To get crosslinked
structures for the PRS, functionality of at least one of the monomers should be
greater than two. Accordingly, for the thermosetting systems studied in Chapter 5
and 7, one monomer has a functionality of two, and the other has four. Therefore,
280
the theoretical gel point for these systems is approximately 0.5773. However, the
observed gelation points for these systems were higher than the theoretical value.
In this study, the approximate gel point was measured using a steady shear
viscosity measurement during curing reactions. Gelation is known to happen at
the point where steady shear viscosity suddenly jumps to infinity.5, 6 The plots of
simultaneous chemical conversion and viscosity (combined FTIR-Rheometer)
versus reaction time are shown in Appendix H. The experimental gelation points
for the DGEBA-PPODAx=33 and DGEBA-PPODAx=68 systems were 0.65 and 0.835,
respectively.
We have conducted the same measurement for the mPRS systems composed of
TGDDM and PEAs. The PEAs used had a rough molecular sizes of 600 g/mol, 1000
g/mol, and 2000 g/mol, respectively. They are labelled as PEA600, PEA1000, and
PEA2070 herein. The molecular structure of PEA600 and PEA1000 was described earlier
in this Chapter. PEA2070 has the same monoamine structure (with one primary
amine at one end) which is predominately polyethylene glycol based with PO:EO
ratio of about 10/31.
The results of simultaneous chemical conversion and steady shear viscosity
measurement vs. reaction time for each individual system are shown in Figures
7.17, 7.18, 7.19, and 7.20, respectively. It was clearly observed that the gelation
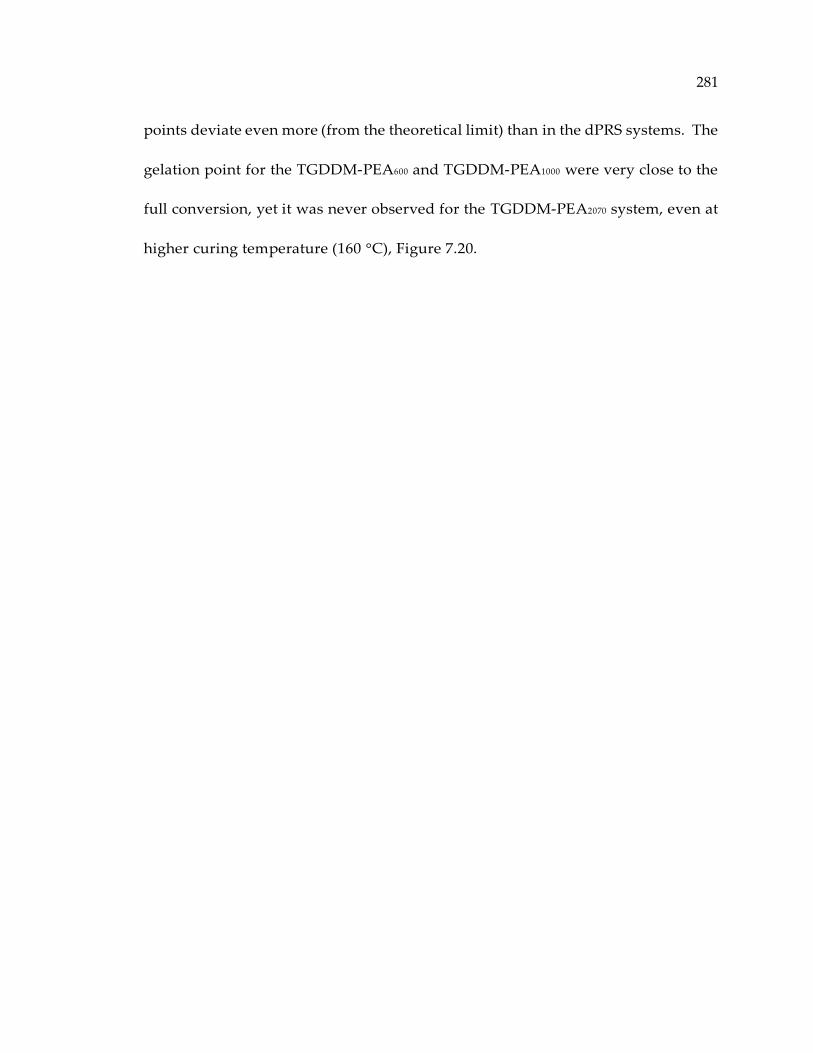
281
points deviate even more (from the theoretical limit) than in the dPRS systems. The
gelation point for the TGDDM-PEA600 and TGDDM-PEA1000 were very close to the
full conversion, yet it was never observed for the TGDDM-PEA2070 system, even at
higher curing temperature (160 °C), Figure 7.20.
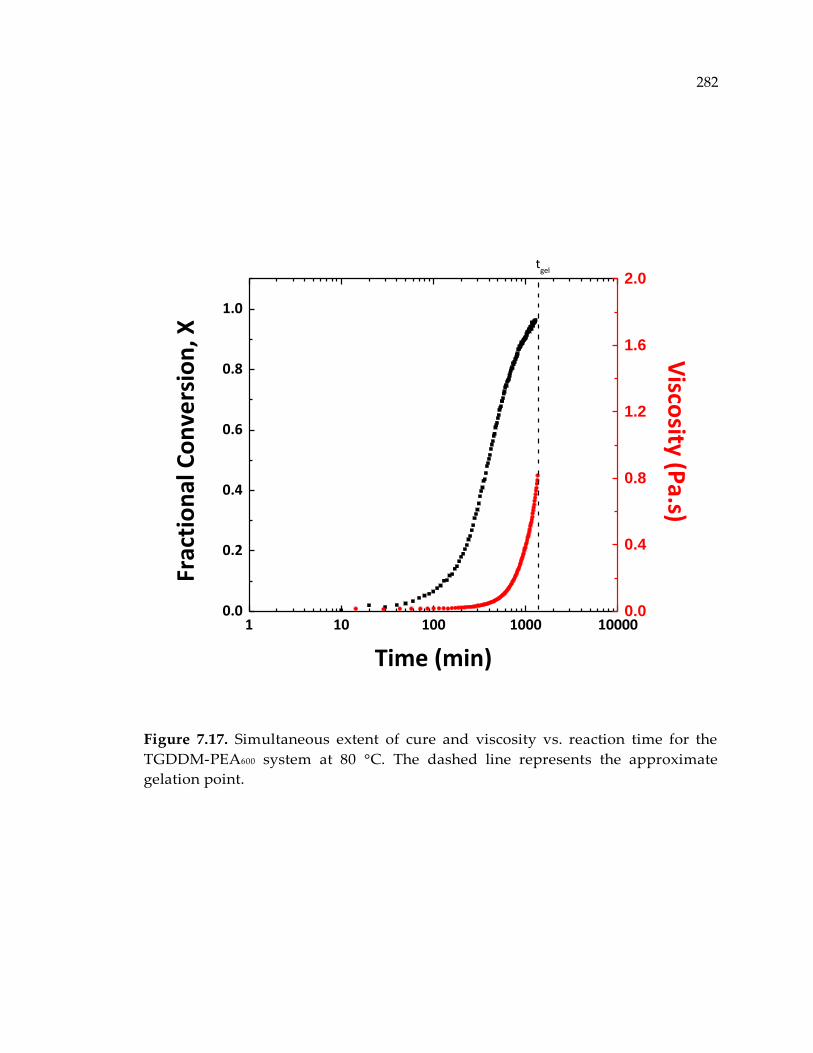
282
Figure 7.17. Simultaneous extent of cure and viscosity vs. reaction time for the
TGDDM-PEA600 system at 80 °C. The dashed line represents the approximate
gelation point.
1 10 100 1000 100000.0
0.2
0.4
0.6
0.8
1.0
0.0
0.4
0.8
1.2
1.6
2.0
Frac
tio
nal
Co
nve
rsio
n, X
Time (min)
tgel
Visco
sity (Pa.s)
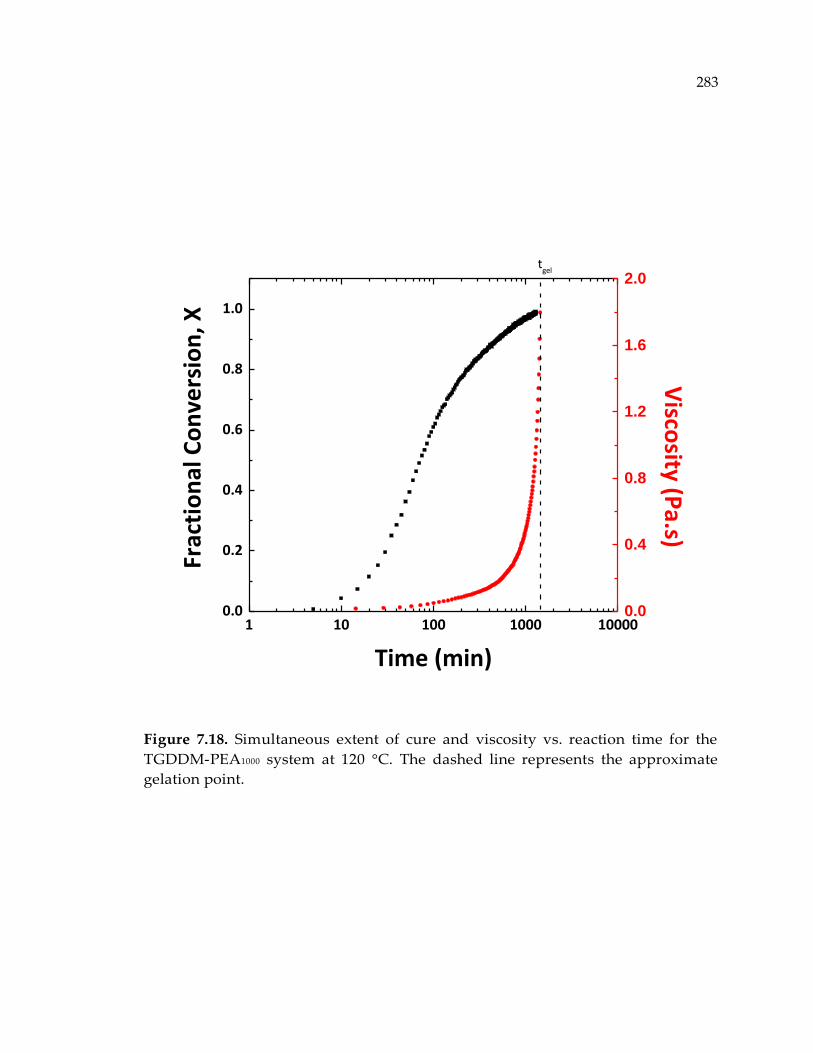
283
Figure 7.18. Simultaneous extent of cure and viscosity vs. reaction time for the
TGDDM-PEA1000 system at 120 °C. The dashed line represents the approximate
gelation point.
1 10 100 1000 100000.0
0.2
0.4
0.6
0.8
1.0
0.0
0.4
0.8
1.2
1.6
2.0
Frac
tio
nal
Co
nve
rsio
n, X
Time (min)
tgel
Visco
sity (Pa.s)
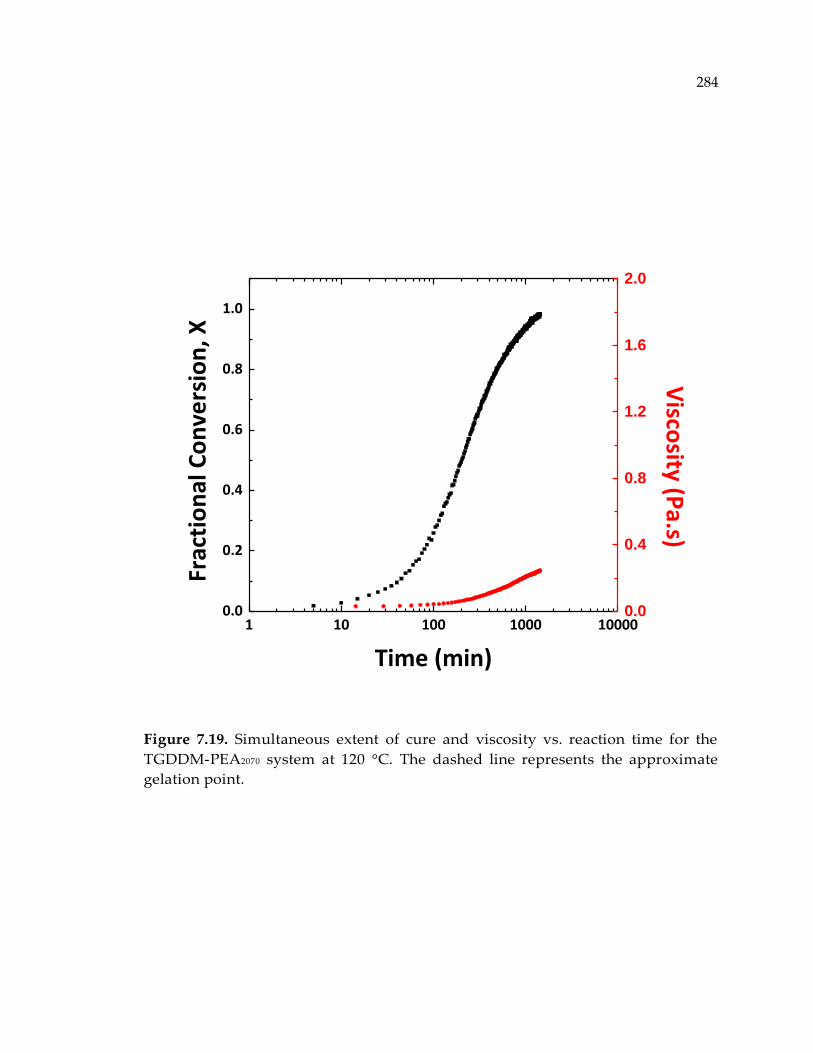
284
Figure 7.19. Simultaneous extent of cure and viscosity vs. reaction time for the
TGDDM-PEA2070 system at 120 °C. The dashed line represents the approximate
gelation point.
1 10 100 1000 100000.0
0.2
0.4
0.6
0.8
1.0
0.0
0.4
0.8
1.2
1.6
2.0
Frac
tio
nal
Co
nve
rsio
n, X
Time (min)
Visco
sity (Pa.s)

285
Figure 7.20. Simultaneous extent of cure and viscosity vs. reaction time for the
TGDDM-PEA2070 system at 160 °C. The dashed line represents the approximate
gelation point.
1 10 100 1000 100000.0
0.2
0.4
0.6
0.8
1.0
0.0
0.4
0.8
1.2
1.6
2.0
Frac
tio
nal
Co
nve
rsio
n, X
Time (min)
Visco
sity (Pa.s)
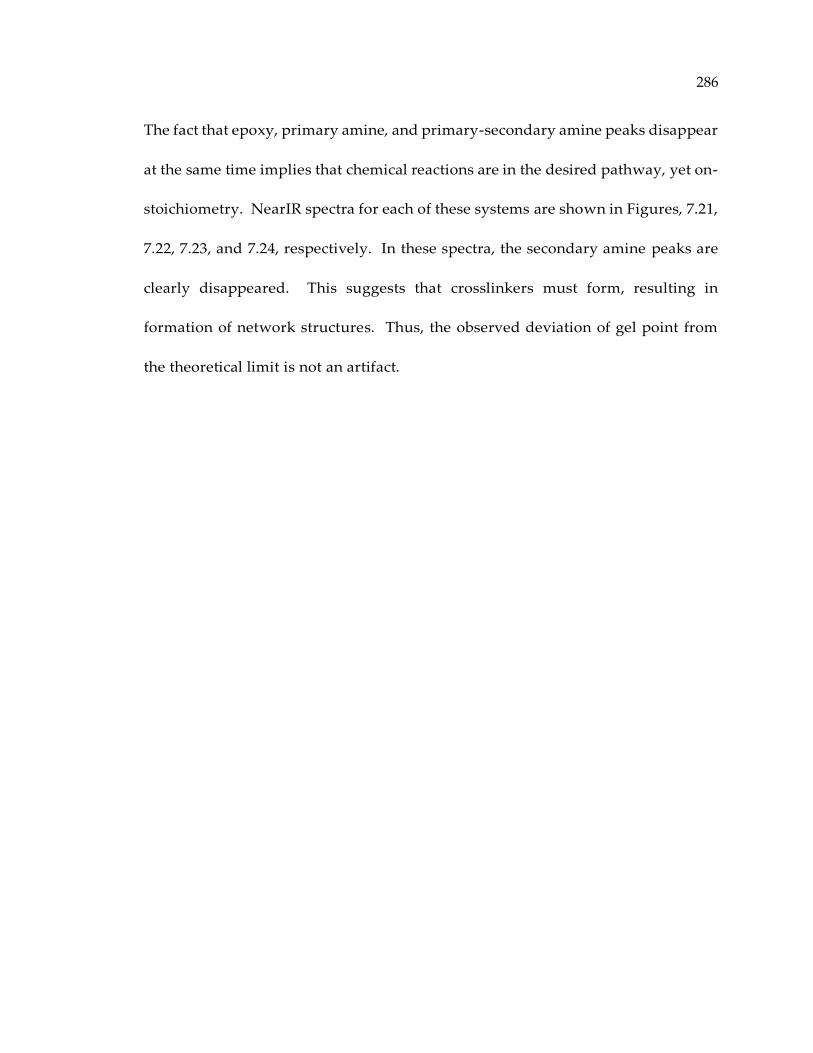
286
The fact that epoxy, primary amine, and primary-secondary amine peaks disappear
at the same time implies that chemical reactions are in the desired pathway, yet on-
stoichiometry. NearIR spectra for each of these systems are shown in Figures, 7.21,
7.22, 7.23, and 7.24, respectively. In these spectra, the secondary amine peaks are
clearly disappeared. This suggests that crosslinkers must form, resulting in
formation of network structures. Thus, the observed deviation of gel point from
the theoretical limit is not an artifact.
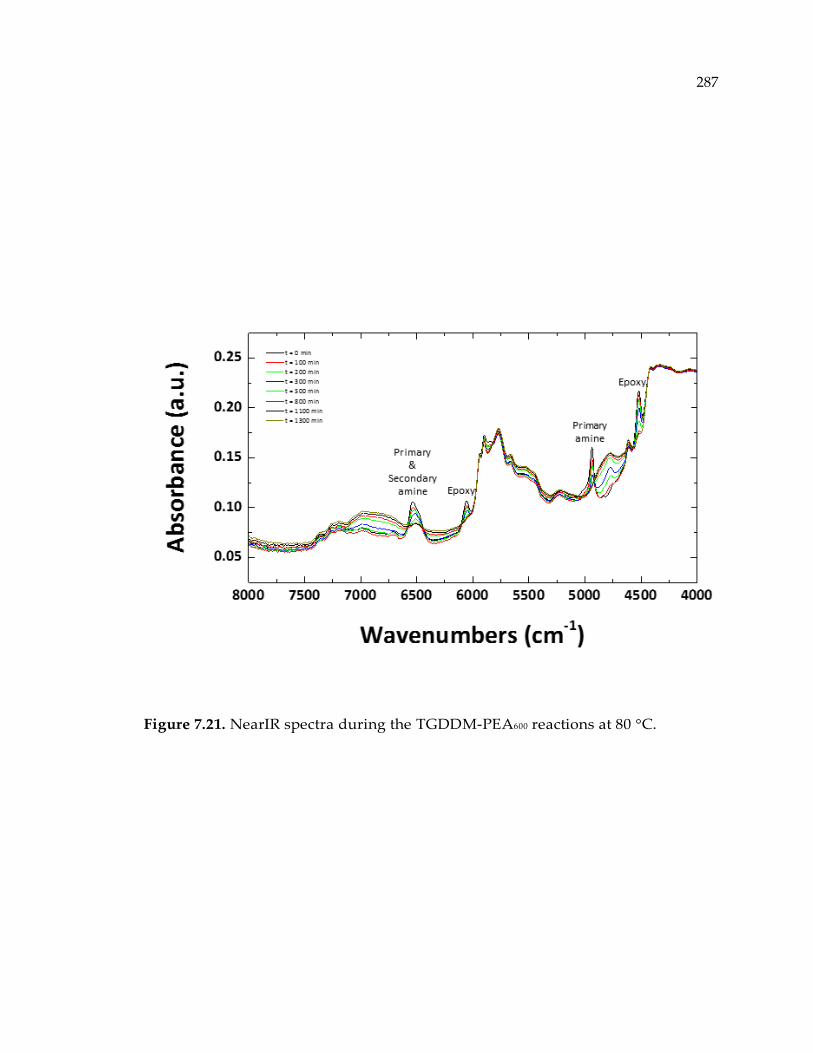
287
Figure 7.21. NearIR spectra during the TGDDM-PEA600 reactions at 80 °C.
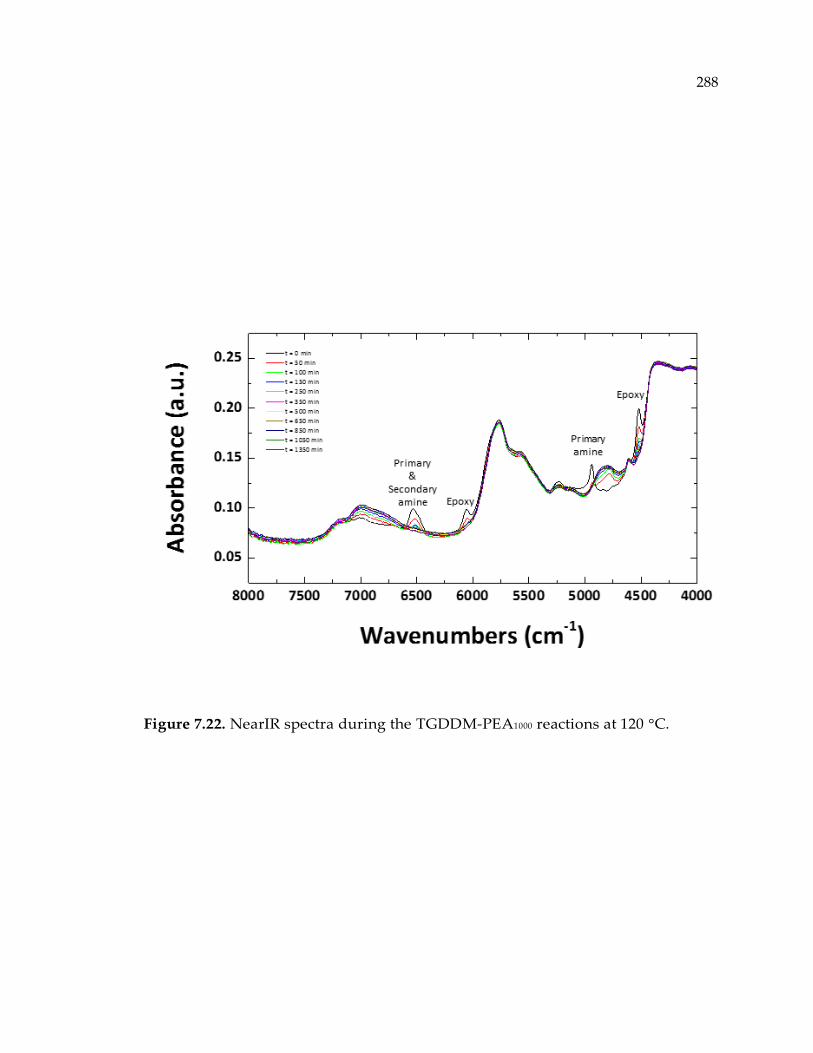
288
Figure 7.22. NearIR spectra during the TGDDM-PEA1000 reactions at 120 °C.
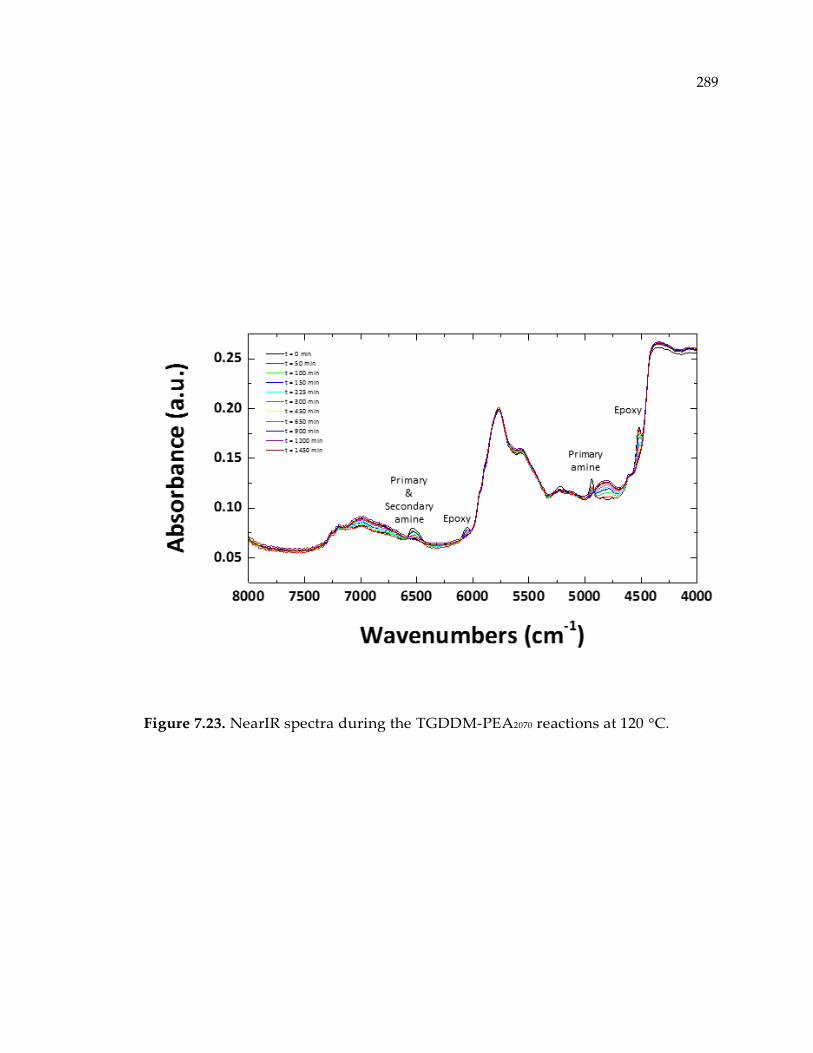
289
Figure 7.23. NearIR spectra during the TGDDM-PEA2070 reactions at 120 °C.
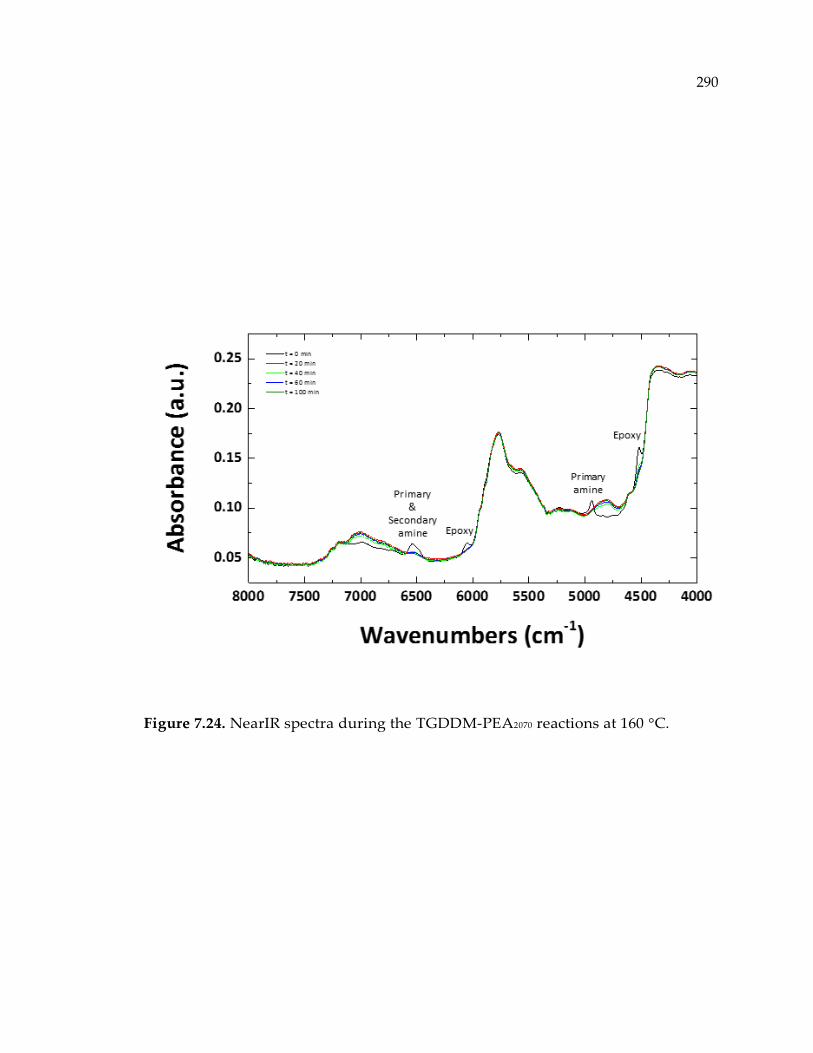
290
Figure 7.24. NearIR spectra during the TGDDM-PEA2070 reactions at 160 °C.
291
The probable explanation for the significant deviation of gel point from the
theoretical limit is chain cyclization due to lack of substitution. In Chapter 5, we
showed that the substitution factor, k2/k1, decreases with increasing molecular size
of the PEAs, explained by the steric hindrance effect. For the bulkier molecules, the
reactivity of the secondary amines are substantially suppressed when primary
amines are already reacted because the molecular collision is hindered by the
massive non-reactive backbone of the molecule. The theoretical limit assumes
equal reactivity of primary amines to secondary amines, which means that
substitution factor, k2/k1, equals to 0.5. However, when substitution factor lowers,
linear chains must appear first (primary amines react first), followed by the
subsequent crosslinking formation (secondary amines reactions) when large
fraction of primary amines already reacted. This is the case that happens in
DGEBA-dPEA2000, DGEBA-dPEA4000, TGDDM-PEA600, and TGDDM-PEA1000
systems. In the limit of dilution, as in TGDDM-PEA2070, when the molecular size is
substantially large and the molar concentration of reactive groups is small, gelation
will never happen, as shown in Figures 7.19 and 7.20. In this case, we believe each
TGDDM is capped with two PEA2070 without forming a network structure, even
though the functionality of TGDDM is 4. The inert structure from the resulting
adduct in this reaction is illustrated in Figure 7.25. For this reason, PEA2070 was not
used in the preparation of mPRS, even though the molecular size was large and, in

292
theory, could potentially improve the thermal and mechanical behavior of the
cured thermosets.
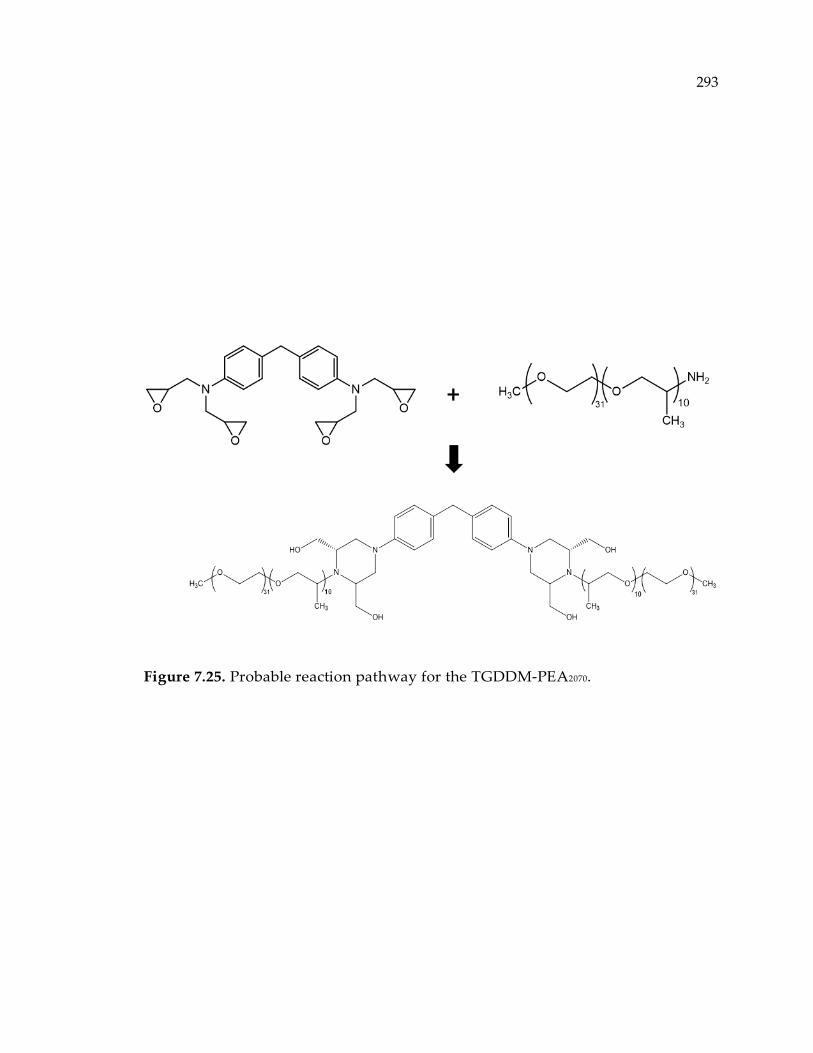
293
Figure 7.25. Probable reaction pathway for the TGDDM-PEA2070.
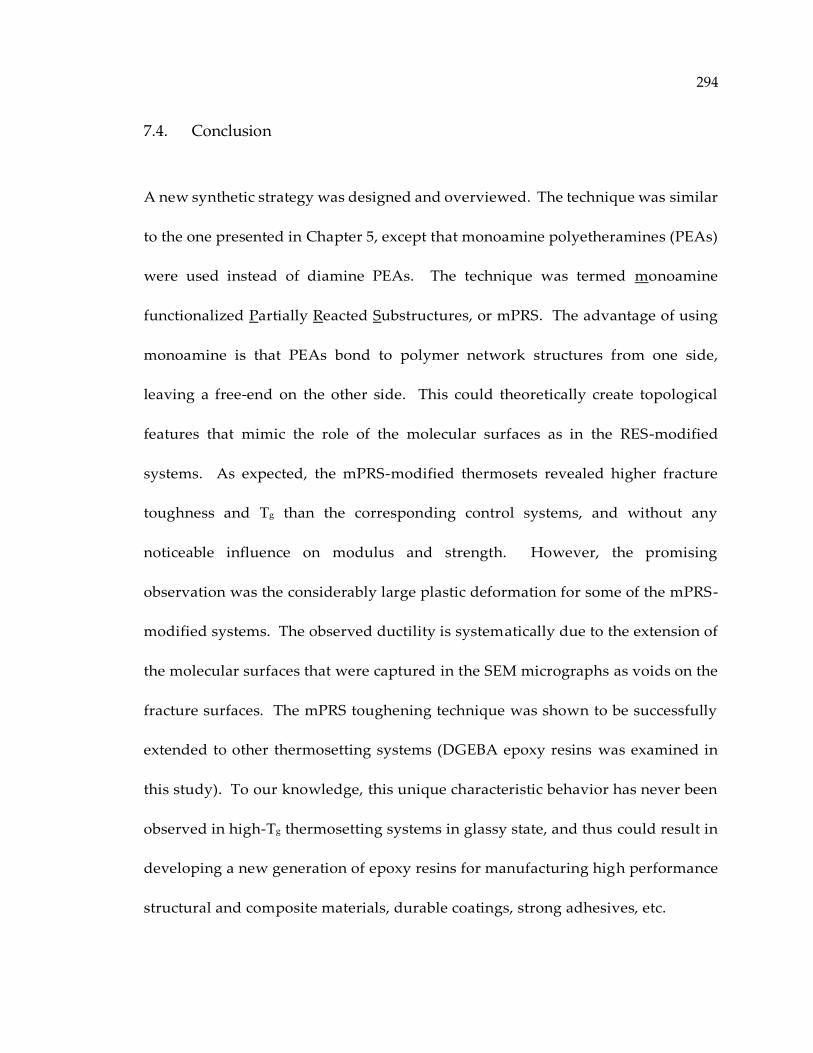
294
7.4. Conclusion
A new synthetic strategy was designed and overviewed. The technique was similar
to the one presented in Chapter 5, except that monoamine polyetheramines (PEAs)
were used instead of diamine PEAs. The technique was termed monoamine
functionalized Partially Reacted Substructures, or mPRS. The advantage of using
monoamine is that PEAs bond to polymer network structures from one side,
leaving a free-end on the other side. This could theoretically create topological
features that mimic the role of the molecular surfaces as in the RES-modified
systems. As expected, the mPRS-modified thermosets revealed higher fracture
toughness and Tg than the corresponding control systems, and without any
noticeable influence on modulus and strength. However, the promising
observation was the considerably large plastic deformation for some of the mPRS-
modified systems. The observed ductility is systematically due to the extension of
the molecular surfaces that were captured in the SEM micrographs as voids on the
fracture surfaces. The mPRS toughening technique was shown to be successfully
extended to other thermosetting systems (DGEBA epoxy resins was examined in
this study). To our knowledge, this unique characteristic behavior has never been
observed in high-Tg thermosetting systems in glassy state, and thus could result in
developing a new generation of epoxy resins for manufacturing high performance
structural and composite materials, durable coatings, strong adhesives, etc.
295
7.5. List of References
1. Kinloch, A.; Maxwell, D.; Young, R. Journal of materials science 1985, 20, (11),
4169-4184.
2. Kinloch, A., Mechanics and mechanisms of fracture of thermosetting epoxy
polymers. In Epoxy Resins and Composites I, Springer: 1985; pp 45-67.
3. Flory, P. J., Principles of polymer chemistry. Cornell University Press: 1953.
4. Flory, P. J. Journal of the American Chemical Society 1941, 63, (11), 3083-3090.
5. Sperling, L. H., Introduction to physical polymer science. John Wiley & Sons:
2005.
6. Shen, M. Macromolecules 1969, 2, (4), 358-364.
296
Chapter 8. Conclusions and Recommendations for Future Work
8.1. Conclusions
The interest in epoxy thermosetting polymers is widespread. Boeing 787
Dreamliner, windmill blades, automobiles, coatings, adhesives, etc. are all
examples of their different applications, and a demand still exists for improving
toughness of these materials while maintaining other advantageous properties
such as strength, Young’s modulus, Tg, etc. This study provides a novel approach
for improving the intrinsic behavioral characteristic of these polymers that can be
potentially extended to all thermosets.
Novel synthetic techniques were developed and adopted, through which polymer
networks with the same overall compositions but varying in network topology are
synthesized. These systems are referred to as “polymer network isomers”. The
synthesis procedure and post-processing characterizations assured that the
network structural variations were in the size range of 5-50 nm.
Accordingly, Chapter 3 introduced a novel processing technique termed reactive
encapsulation of solvent/drying, or RESD. It was found that without altering

297
chemical structure, the network topology of a dense thermoset can be engineered
such that, under deformation, nanometer-sized cavities (15-25 nm) open and
dissipate energy before rupturing covalent bonds, producing a tougher material
without sacrificing ultimate tensile strength, modulus, density, or glass transition
temperature. SEM images from the fracture surfaces showed clear voids on the
modified samples, whereas prior to tension, all modified samples had the same
density, Tg, Young’s modulus of the unmodified epoxy. Using atomistic
simulations, it was shown that during-cure solvent species affect the directionality
of the forming covalent bonds. The presence of distinct topological features in the
modified network is likely the origin of the large improvement in ductility.
In Chapter 4, we examined the use of equilibrium swelling and glass transition
temperature to characterize polymer networks that were cured in the presence of
an inert solvent followed by a supercritical drying of the solvent. Three different
epoxy resins with different molecular sizes were cured with the same curing agent.
We have shown that the traditional swelling model is inadequate to accurately
represent the swelling behavior of epoxy-amine gels when prepared in extremely
dilute environments. The model was adjusted by incorporating a probabilistic
factor based on the probability of finding an elastic chain in the porous structure.
The end results implied that the values of molecular weight between crosslinks are
insensitive to the amount of solvent present during cure, and in fact, the presence
298
of inert solvent species changes the direction of the forming covalent bonds and
thus alters the network topology by creating molecular surfaces.
The synthetic methodology to develop thermosetting systems with altered
topology presented in Chapter 3 was not cost efficient and scalable. Instead, in
Chapter 5, a solvent-free based approach is presented. This technique is termed as
partially reacted substructures, or PRS. Polymer networks with altered topology
were obtained through the addition of a single processing step. A low-Tg thermoset
at different extents of polymerization was embedded into a high-Tg majority-phase
thermoset. It was shown that the PRS-modified samples are tougher than the
corresponding controls, and the toughness is directly proportional to the chemical
conversion of the embedded PRS. The major fracture mechanism responsible for
the increased energy dissipation was found to be nano-cavitation. SAXS studies
revealed that the synthetic method produced controlled heterogeneous structures
with nanodomains ranging from 12-25 nm. These nanodomains were determined
to be responsible for the onset of cavitation that was quantified using SEM image
analysis. Also observed, was that the glass transition temperatures of the modified
systems were higher than those of the control systems. In addition, quasi-static
mechanical extension did not show substantial differences in mechanical strength
and modulus between system isomers.
299
It was shown that network topology can be used to tailor the behavior of
thermosetting materials without the incorporation of toughening agents that often
reduce processing ease and are costly. However, the lack of significant elongation
of the PRS-modified systems remained paramount. This could be due to either: (1)
the large difference between the Tg of the polymer and the testing temperature; or
(2) the absence of the molecular surfaces, which could mimic the role of the
potential voids in the RES-modified systems.
Chapter 6 discussed the effect of a material’s Tg on its behavioral characteristics.
Accordingly, three different epoxy-amine resins with final Tg’s ranging from 60 °C
– 180 °C were investigated. Per each individual resin, three blends were prepared,
blank, with 5% capped PPODAx=6.1, and with 5% capped PPODAx=33. Dynamic
mechanical analysis revealed that, per each thermosetting system, the ones contain
5% capped PPODAx=33 showed the lowest crosslinking density and Tg. Quasi-static
tensile properties revealed that Tg is a major stress-strain shape determining factor.
For the thermosetting systems with Tg’s close to the testing temperature, the
induced molecular surfaces, which was the result of the presence of the inert
capped PPODA species, noticeably improved the plastic deformation beyond
yielding and prior to rupture. SAXS study indicated the deformation (in both size
and shape) of the heterogeneous domains during mechanical extension. However,
the observed ductility was substantially minimized for the high-Tg thermosets.
300
Because the crosslinkers are stiff in this case, the plastic deformation is not likely to
occur, and the void opening mechanism is considerably restricted, even though the
molecular surfaces are present.
In order to be able to make a clear discussion on the effect of the molecular surfaces
on the mechanical properties of high-Tg thermosetting systems, we must compare
materials with the same compositions (polymer isomers). The argument in the
discussion of Chapter 6 is that we were not comparing the polymer network
isomers, and thus the presence of the capped PPODAs could have had
deteriorating effects on the mechanical performance.
Therefore, a new synthetic strategy was designed and introduced in Chapter 7. The
technique was quite similar to the one presented in Chapter 5, except monoamine
polyetheramines (PEAs) were used instead of diamine PEAs. The technique was
termed monoamine functionalized partially reacted substructures, or mPRS. The
benefit of using monoamine is that PEAs bond to polymer network structures from
one side, leaving a free-end on the other side. This could theoretically create
topological features that mimic the role of the molecular surfaces as in the RES-
modified systems. As expected, the mPRS-modified thermosets revealed higher
fracture toughness and Tg than the corresponding control systems without any
noticeable influence on modulus and strength. However, the promising
301
observation was the considerably large plastic deformation for some of the mPRS-
modified systems. The observed ductility is systematically due to the extension of
the molecular surfaces that were captured in the SEM micrographs as voids on the
fracture surfaces. The mPRS toughening technique was shown to be successfully
extended to other thermosetting systems (DGEBA epoxy resins was examined in
this study). To our knowledge, this unique behavior has never been observed in
high-Tg thermosetting systems in glassy state, and it could result in developing a
new generation of epoxy resins for manufacturing high performance structural and
composite materials, durable coatings, strong adhesives, etc.
It was demonstrated that network topology can be used to tailor physical, thermal
and mechanical properties of thermosetting polymers. The experimental
methodologies in this dissertation can directly and economically be applied to
formulate new epoxy-amine systems for various applications. Although topology-
based toughening was investigated on epoxy-amine polymers, the concept can be
extended to most thermoset chemistries and perhaps to other brittle network
forming materials.
302
8.2. Recommendation for Future Directions
Although major advances have been achieved in understanding the effect of
topology on thermal and mechanical properties of thermosets, there is room for
further investigation that could enable one to design materials with tailored
properties for particular applications. Some of the possible routes for future
advancement in this research include:
Tuning and scaling-up the introduced synthetic methodologies.
Investigating the mechanical characteristics of the composite materials when
new resin formulations and methodologies are used.
Studying an in-situ SAXS/SANS to carefully capture the deformation of
molecular surfaces during mechanical tension or compression.
Understanding the structure and probable applications of adducts when
very large monoamine PEAs react with an epoxy.
Investigating the effect of molecular symmetry on the substitution factor.
Comparing diamine PEAs to monoamine PEAs.
303
Understanding the effect of topological variations on transport properties
such as, thermal conductivity and relative mass diffusivity of particular
molecules. The impact of this study would consist of synthesizing selective
polymer membranes and non-permeable to semi-permeable coatings.
Embedding pressure/temperature sensitive domains in polymer network
structures that could be triggered upon mechanical or temperature shocks,
so to change the material properties to withstand the applied stress. One
way is to take advantage of thermo-reversible (e.g. Diels-Alder) reactions.
Under extreme dynamic environments (such as impacts), temperature rises.
If domains have the constituents of DA reactions upon heating, the
“molecular surfaces” form via debonding the DA reactants. This could
allow the material to absorb more energy without failure. Upon cooling, the
bonds will form again, and the material regains it advantageous properties.
It is suggested to use the difunctional curing agents with two secondary
amines (NH) at each end. Jefflink® (Huntsman) and Clearlink 1000® (Dorf
Ketal) are examples of the curing agents that can be used herein. These
curing agents can be furan-functionalized using furfuryl glycidyl ether and
could be used in reversible bonding via DA reactions.
304
Appendix A. Mathematical Derivation of the Adjusted Dusek Equation
According to Flory,1 for a crosslinked polymer gel immersed in a solvent and
allowed to reach equilibrium, the two opposing forces that are determining the
state of equilibrium are: the thermodynamic force of mixing and the retractive force
of polymer chains. State of equilibrium is defined when these two forces
counterbalance each other and the total energy of the system is minimized.
Δ𝐹 = Δ𝐹𝑚 + Δ𝐹𝑒𝑙 (A.1)
The contribution of mixing can be quantified as
Δ𝐹𝑚 = 𝜅𝑇[𝑛1 ln(𝑣1) + 𝜒1𝑛1𝑣2] (A.2)
where 𝜅 is the Boltzmann constant, 𝑇 is absolute temperature, 𝑛1 is the number of
solvent molecules, 𝑣1 and 𝑣2 are the solvent and polymer volume fraction
respectively, and 𝜒1 is the interaction parameter.
The free energy change due to elastic retractive force is as follow:
305
Δ𝐹𝑒𝑙 = 3𝜅𝜐𝑇
2(𝛼𝑠
2 − 1 − ln(𝛼𝑠)) (A.3)
Here, 𝜐 is the number of elastic chains. In addition, the elongation ratio, 𝛼𝑠 , for an
isotropically swollen gel can be calculated from volume fraction of PN in swollen
state, 𝑣2𝑠, via
𝛼𝑠3 =
1
𝑣2𝑠
(A.4)
Incorporating the modifying factor, 𝑃𝜐 , in the elastic term, we have the contribution
to the total free energy change due to elastic retractive force as follows:
Δ𝐹𝑒𝑙 = 3𝜅𝜐(𝑃𝜐)𝑇
2(𝛼𝑠
2 − 1 − ln(𝛼𝑠)) =3𝜅𝜐(𝑣2𝑟)𝑇
2(𝛼𝑠
2 − 1 − ln(𝛼𝑠)) (A.5)
Therefore, the total free energy change due to swelling can be rewritten as
Δ𝐹 = 𝜅𝑇[𝑛1 ln(𝑣1) + 𝜒1𝑛1𝑣2] +3𝜅𝜐(𝑣2𝑟)𝑇
2(𝛼𝑠
2 − 1 − ln(𝛼𝑠)) (A.6)
According to equilibrium swelling theory, the equilibrium criterion is
𝜇1 − 𝜇10 =
𝛿Δ𝐹
𝛿𝑛1= 0
(A.7)
Substituting, rearranging and solving the above equation, using the definition of 𝛼𝑠
and 𝜐 =𝑉
𝑣𝑃𝑀𝑐, the adjusted Dusek model for measuring molecular weight between
306
crosslinks in highly porous polymer networks or gels formed in extremely dilute
environments is as following:2
𝑀𝑐 = −
𝑣2𝑟2 [(
𝑣2𝑠𝑣2𝑟
)
13
−12
(𝑣2𝑠𝑣2𝑟
)]
𝑣𝑝
𝑉1[ln(1 − 𝑣2𝑠) + 𝑣2𝑠 + 𝜒1𝑣2𝑠
2 ] (A.8)
1. Flory, P. J., Principles of Polymer Chemistry. Cornell Univ. Press: 1953; p 672 pp.
2. Raman, V. I. Design of nanoporous polymer networks using a reactive
encapsulation of solvent (RES) technique. Drexel University, Philadelphia, PA, 2005.
307
Appendix B. DSC Thermographs of the Porous Polymers
A small cut from the supercritically dried gels was tested with DSC. For the
samples cured in presence of the inert solvent, an exothermic peak was observed in
the first heating scan. The results are displayed in Figure B.1. It is believed that the
exotherms appear primarily due to the release of interfacial surface energy upon
collapsing the pore walls, as well as relaxation of the polymer chains. The
supercritical extraction of solvent removes the solvent species but creates nano-
scale pore structures in place. Interestingly, exothermic enthalpy increases with
increasing initial solvent content suggesting that thermosets could be tailored by
varying the during-cure inert solvent as discussed comprehensively by Raman et
al. The second temperature scan didn’t show any exothermic peak implying that
all the pore structures have been collapsed in the first heating cycle. Also, the
values of glass transition temperature for the supercritically dried samples, were
measured at the inflection point of the heat flow vs. temperature curves in the third
heating cycle, as shown in Figure B.2.
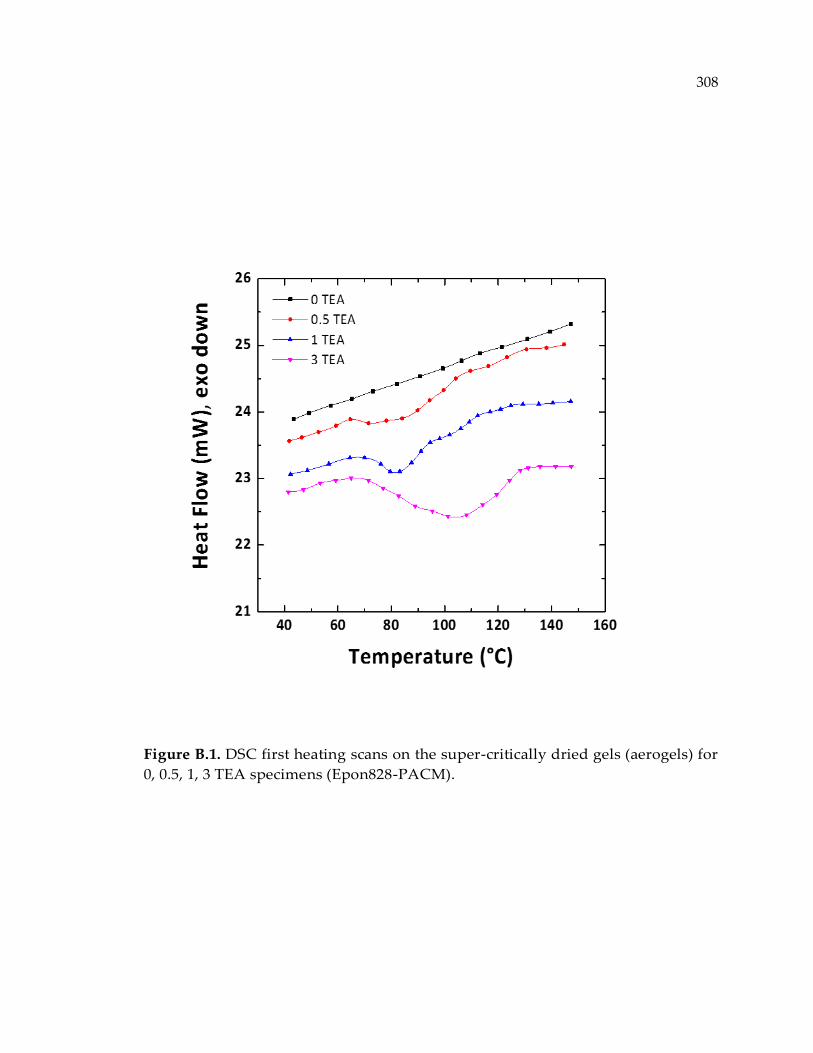
308
Figure B.1. DSC first heating scans on the super-critically dried gels (aerogels) for
0, 0.5, 1, 3 TEA specimens (Epon828-PACM).
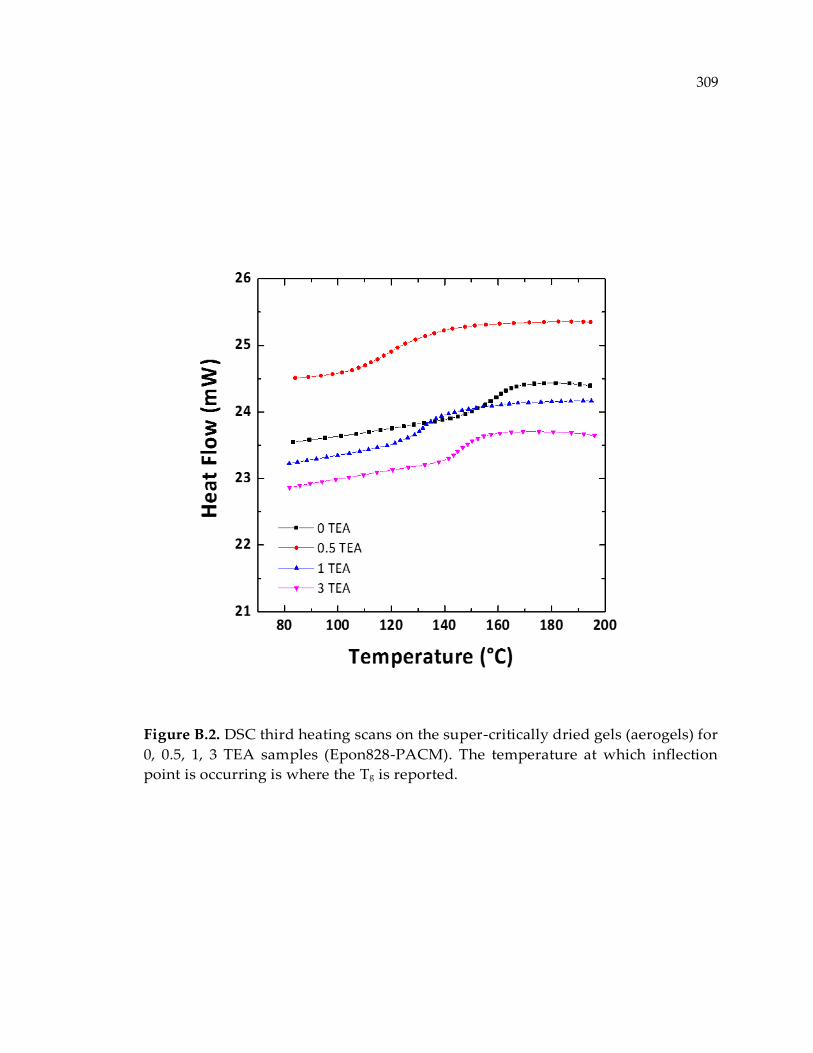
309
Figure B.2. DSC third heating scans on the super-critically dried gels (aerogels) for
0, 0.5, 1, 3 TEA samples (Epon828-PACM). The temperature at which inflection
point is occurring is where the Tg is reported.
310
Appendix C. Comparing the Experimental Mc Values to the Theoretical Values
The experimentally measured 𝑀𝑐 values for the dense polymer networks, 0 TEA, based
on equilibrium swelling technique were compared to the theoretical values. Two separate
approaches were used to calculate the 𝑀𝑐 values based on the molecular weight of the
monomer resins. According to the first model, molecular weight between crosslinks, 𝑀𝑐 ,
was determined by the resin molecular size and reaction stoichiometry at some specific
curing conversions based on the following formula:1
𝑀𝑐 =
𝑀𝑇 −𝑀𝑇 ∗ 4(1 − 𝑋𝑛)[3 − 4(1 − 𝑋𝑛)]
3 − 12(1 − 𝑋𝑛) (C.1)
𝑀𝑇 = 𝑀𝑊𝑎 +𝑏
𝑎𝑀𝑊𝑒 (C.2)
Here, a and b are the initial number of moles of amine and epoxy, respectively; 𝑀𝑊𝑎 and
𝑀𝑊𝑒 are their corresponding mole weights, and 𝑋𝑛 is the epoxy conversion which is
assumed to be 1 in our calculations for dense polymer networks.
In the second approach, 𝑀𝑐 was calculated from stoichiometry by the following
equations:2
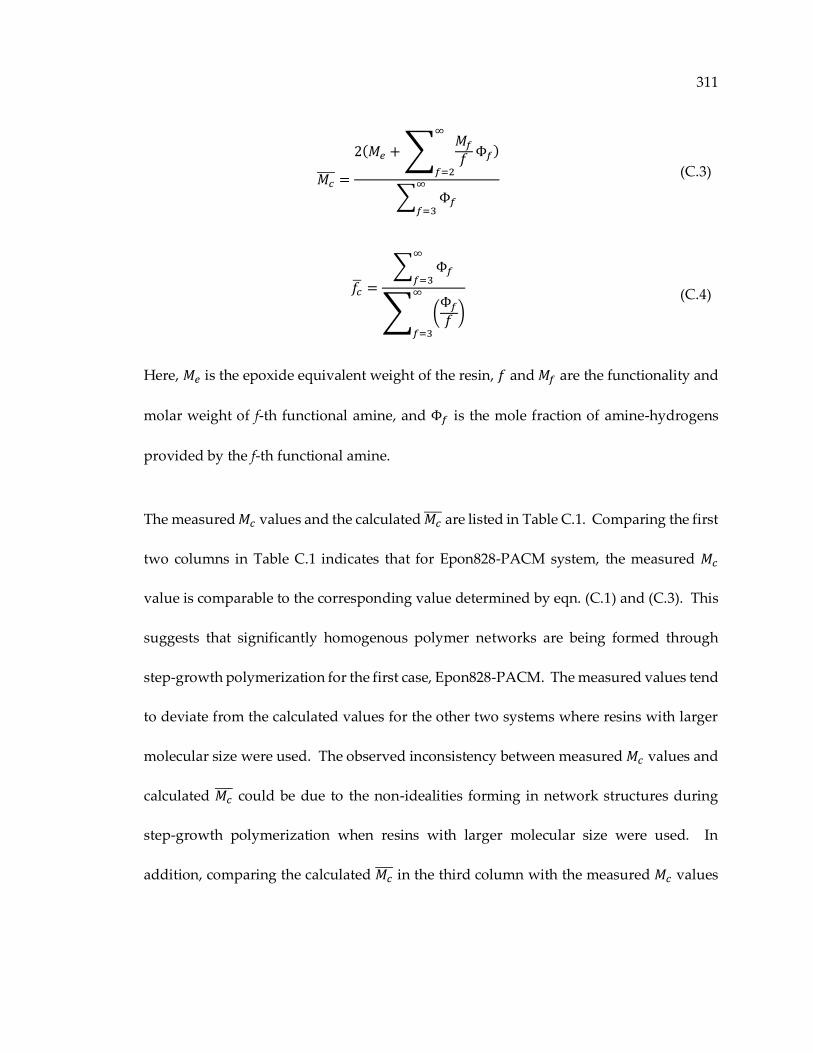
311
𝑀𝑐 =
2(𝑀𝑒 + ∑𝑀𝑓
𝑓
∞
𝑓=2
Φ𝑓)
∑ Φ𝑓
∞
𝑓=3
(C.3)
𝑓�� =
∑ Φ𝑓
∞
𝑓=3
∑ (Φ𝑓
𝑓)
∞
𝑓=3
(C.4)
Here, 𝑀𝑒 is the epoxide equivalent weight of the resin, 𝑓 and 𝑀𝑓 are the functionality and
molar weight of f-th functional amine, and Φ𝑓 is the mole fraction of amine-hydrogens
provided by the f-th functional amine.
The measured 𝑀𝑐 values and the calculated 𝑀𝑐 are listed in Table C.1. Comparing the first
two columns in Table C.1 indicates that for Epon828-PACM system, the measured 𝑀𝑐
value is comparable to the corresponding value determined by eqn. (C.1) and (C.3). This
suggests that significantly homogenous polymer networks are being formed through
step-growth polymerization for the first case, Epon828-PACM. The measured values tend
to deviate from the calculated values for the other two systems where resins with larger
molecular size were used. The observed inconsistency between measured 𝑀𝑐 values and
calculated 𝑀𝑐 could be due to the non-idealities forming in network structures during
step-growth polymerization when resins with larger molecular size were used. In
addition, comparing the calculated 𝑀𝑐 in the third column with the measured 𝑀𝑐 values

312
do not show any consistency, implying that the Crawford model is not adequate for
measuring the theoretical 𝑀𝑐 values for the systems investigated in this study.
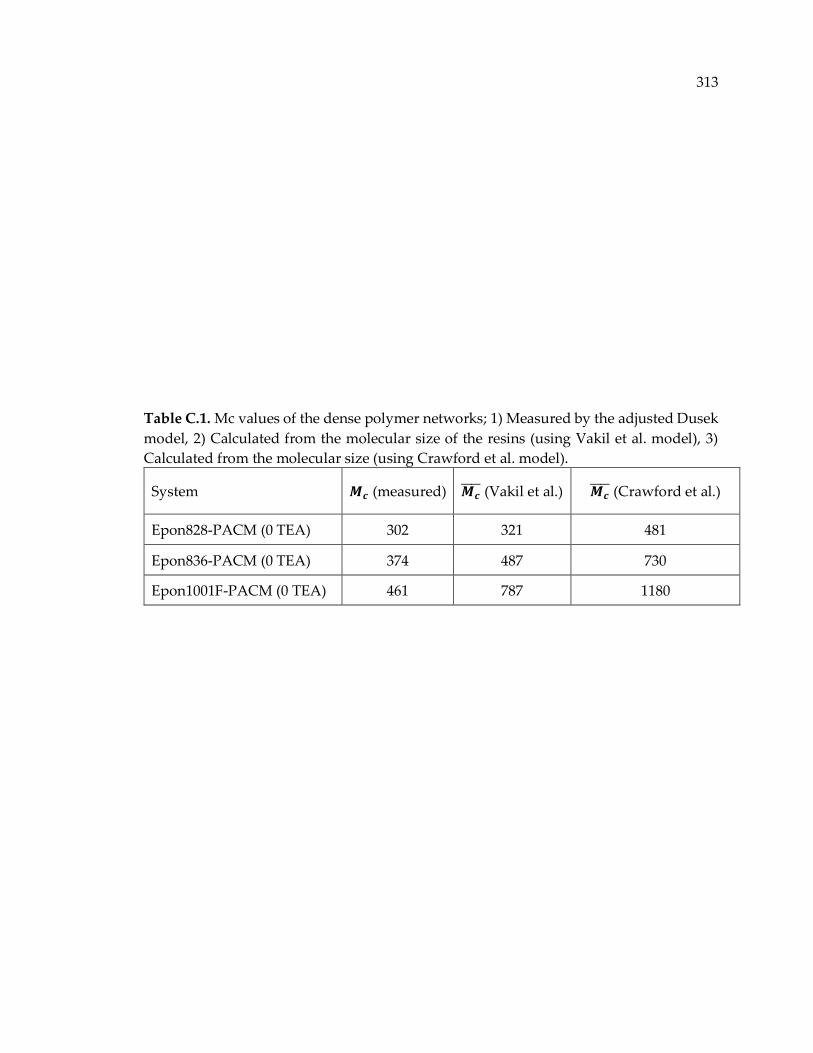
313
Table C.1. Mc values of the dense polymer networks; 1) Measured by the adjusted Dusek
model, 2) Calculated from the molecular size of the resins (using Vakil et al. model), 3)
Calculated from the molecular size (using Crawford et al. model).
System 𝑴𝒄 (measured) 𝑴𝒄 (Vakil et al.) 𝑴𝒄
(Crawford et al.)
Epon828-PACM (0 TEA) 302 321 481
Epon836-PACM (0 TEA) 374 487 730
Epon1001F-PACM (0 TEA) 461 787 1180

314
1. Vakil, U. M.; Martin, G. C. J. Appl. Polym. Sci. 1992, 46, (12), 2089-99.
2. Crawford, E.; Lesser, A. J. J. Polym. Sci., Part B: Polym. Phys. 1998, 36, (8), 1371-
1382.
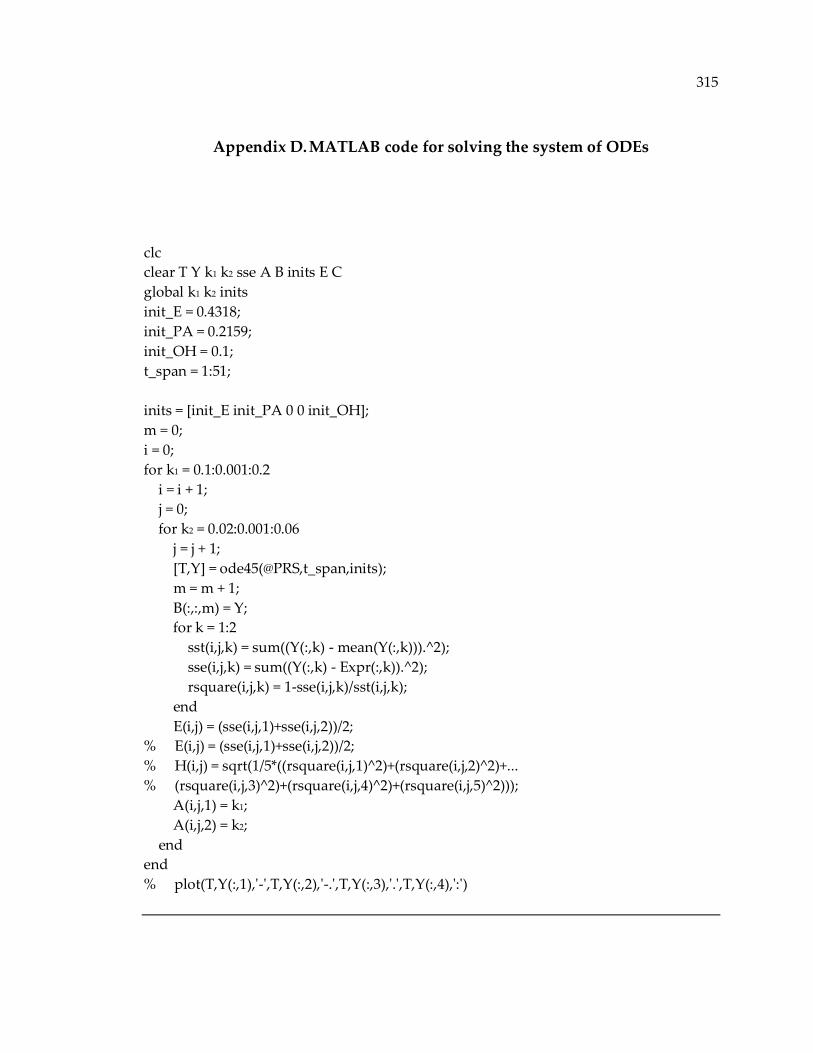
315
Appendix D. MATLAB code for solving the system of ODEs
clc
clear T Y k1 k2 sse A B inits E C
global k1 k2 inits
init_E = 0.4318;
init_PA = 0.2159;
init_OH = 0.1;
t_span = 1:51;
inits = [init_E init_PA 0 0 init_OH];
m = 0;
i = 0;
for k1 = 0.1:0.001:0.2
i = i + 1;
j = 0;
for k2 = 0.02:0.001:0.06
j = j + 1;
[T,Y] = ode45(@PRS,t_span,inits);
m = m + 1;
B(:,:,m) = Y;
for k = 1:2
sst(i,j,k) = sum((Y(:,k) - mean(Y(:,k))).^2);
sse(i,j,k) = sum((Y(:,k) - Expr(:,k)).^2);
rsquare(i,j,k) = 1-sse(i,j,k)/sst(i,j,k);
end
E(i,j) = (sse(i,j,1)+sse(i,j,2))/2;
% E(i,j) = (sse(i,j,1)+sse(i,j,2))/2;
% H(i,j) = sqrt(1/5*((rsquare(i,j,1)^2)+(rsquare(i,j,2)^2)+...
% (rsquare(i,j,3)^2)+(rsquare(i,j,4)^2)+(rsquare(i,j,5)^2)));
A(i,j,1) = k1;
A(i,j,2) = k2;
end
end
% plot(T,Y(:,1),'-',T,Y(:,2),'-.',T,Y(:,3),'.',T,Y(:,4),':')
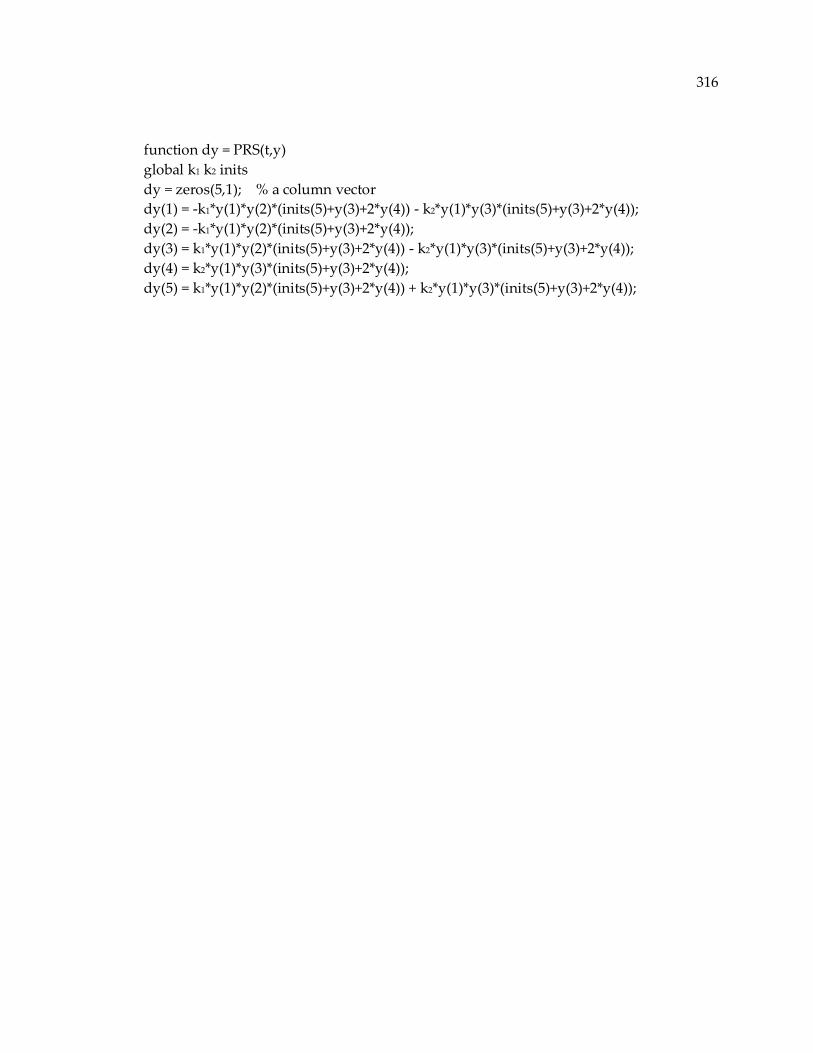
316
function dy = PRS(t,y)
global k1 k2 inits
dy = zeros(5,1); % a column vector
dy(1) = -k1*y(1)*y(2)*(inits(5)+y(3)+2*y(4)) - k2*y(1)*y(3)*(inits(5)+y(3)+2*y(4));
dy(2) = -k1*y(1)*y(2)*(inits(5)+y(3)+2*y(4));
dy(3) = k1*y(1)*y(2)*(inits(5)+y(3)+2*y(4)) - k2*y(1)*y(3)*(inits(5)+y(3)+2*y(4));
dy(4) = k2*y(1)*y(3)*(inits(5)+y(3)+2*y(4));
dy(5) = k1*y(1)*y(2)*(inits(5)+y(3)+2*y(4)) + k2*y(1)*y(3)*(inits(5)+y(3)+2*y(4));
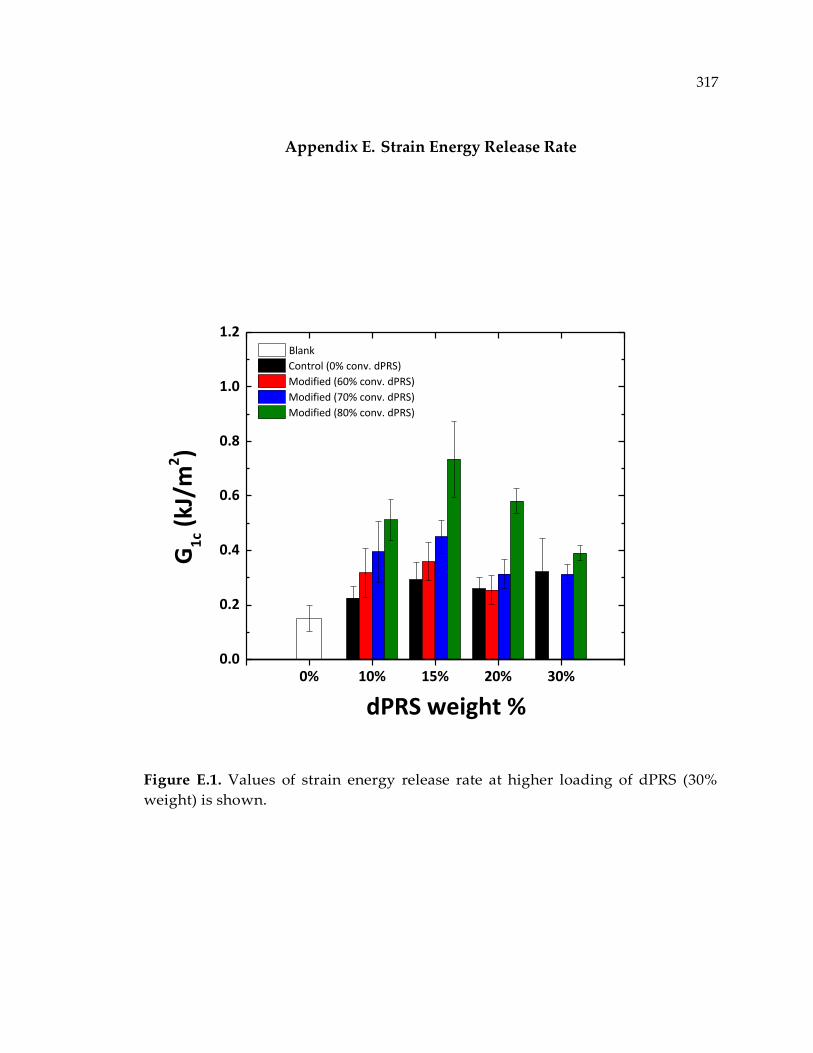
317
Appendix E. Strain Energy Release Rate
Figure E.1. Values of strain energy release rate at higher loading of dPRS (30%
weight) is shown.
0% 10% 15% 20% 30%0.0
0.2
0.4
0.6
0.8
1.0
1.2
Control (0% conv. dPRS)
Modified (60% conv. dPRS)
Modified (70% conv. dPRS)
Modified (80% conv. dPRS)
dPRS weight %
G1
c (kJ
/m2)
Blank
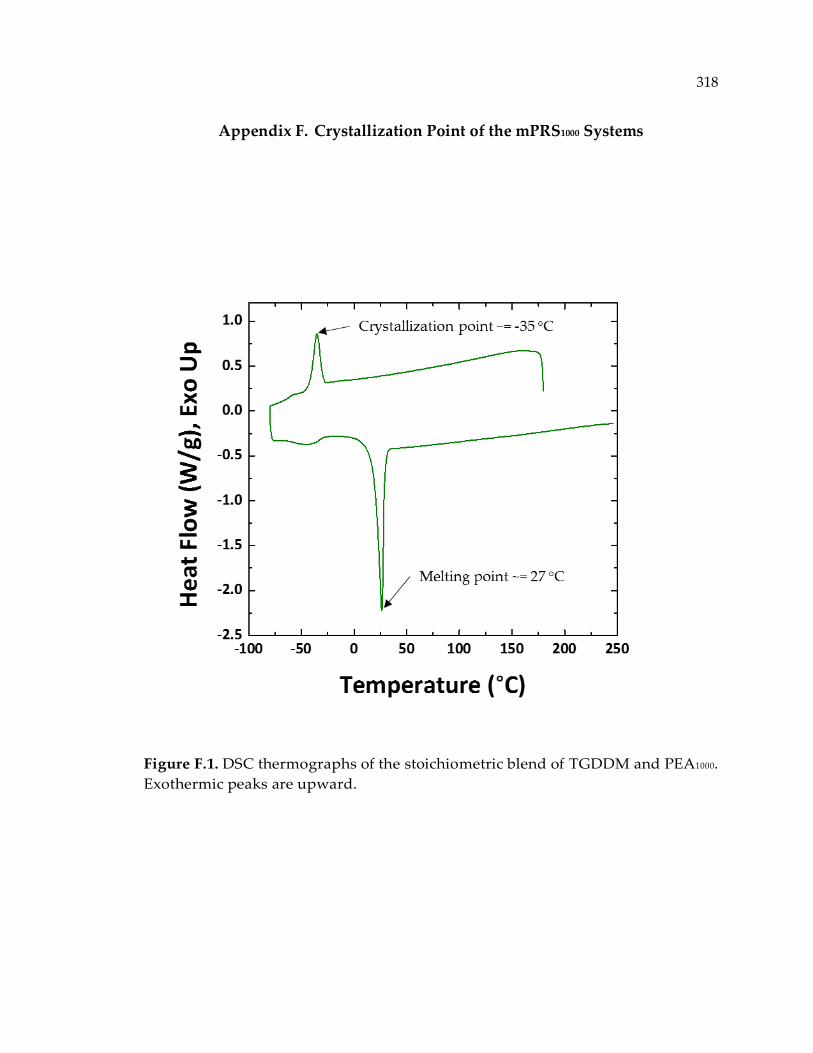
318
Appendix F. Crystallization Point of the mPRS1000 Systems
Figure F.1. DSC thermographs of the stoichiometric blend of TGDDM and PEA1000.
Exothermic peaks are upward.
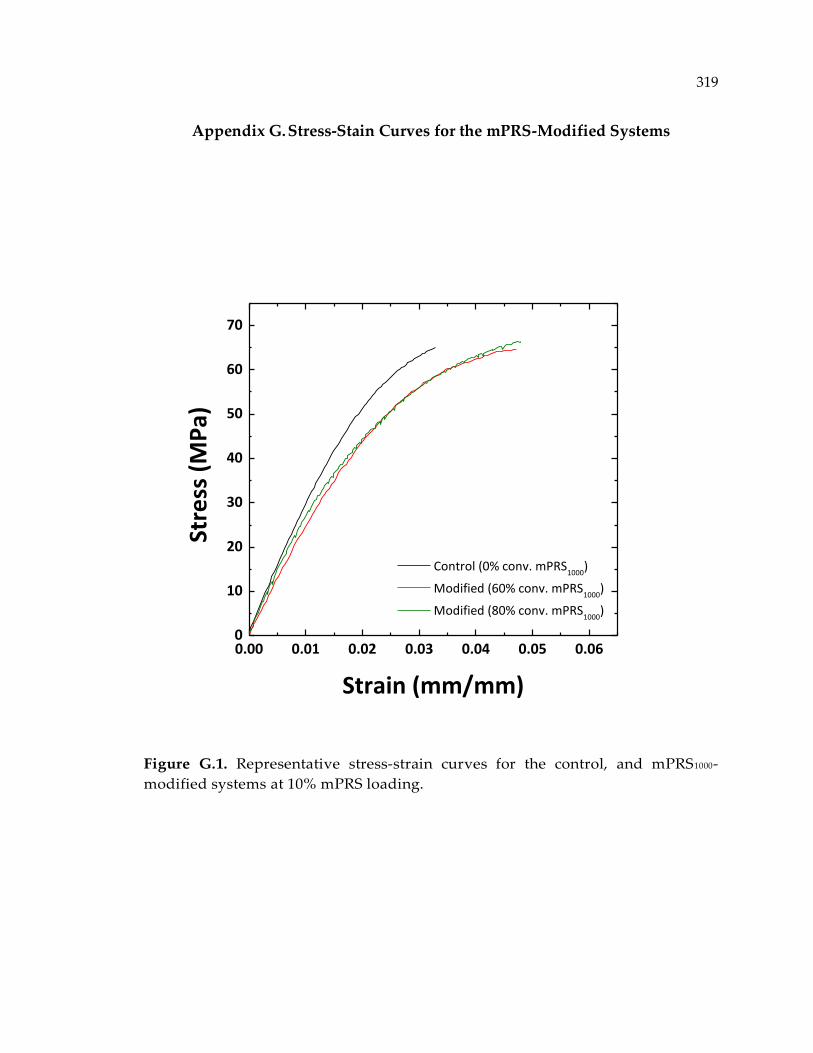
319
Appendix G. Stress-Stain Curves for the mPRS-Modified Systems
Figure G.1. Representative stress-strain curves for the control, and mPRS1000-
modified systems at 10% mPRS loading.
0.00 0.01 0.02 0.03 0.04 0.05 0.060
10
20
30
40
50
60
70
Control (0% conv. mPRS1000
)
Modified (60% conv. mPRS1000
)
Modified (80% conv. mPRS1000
)
Stre
ss (
MP
a)
Strain (mm/mm)
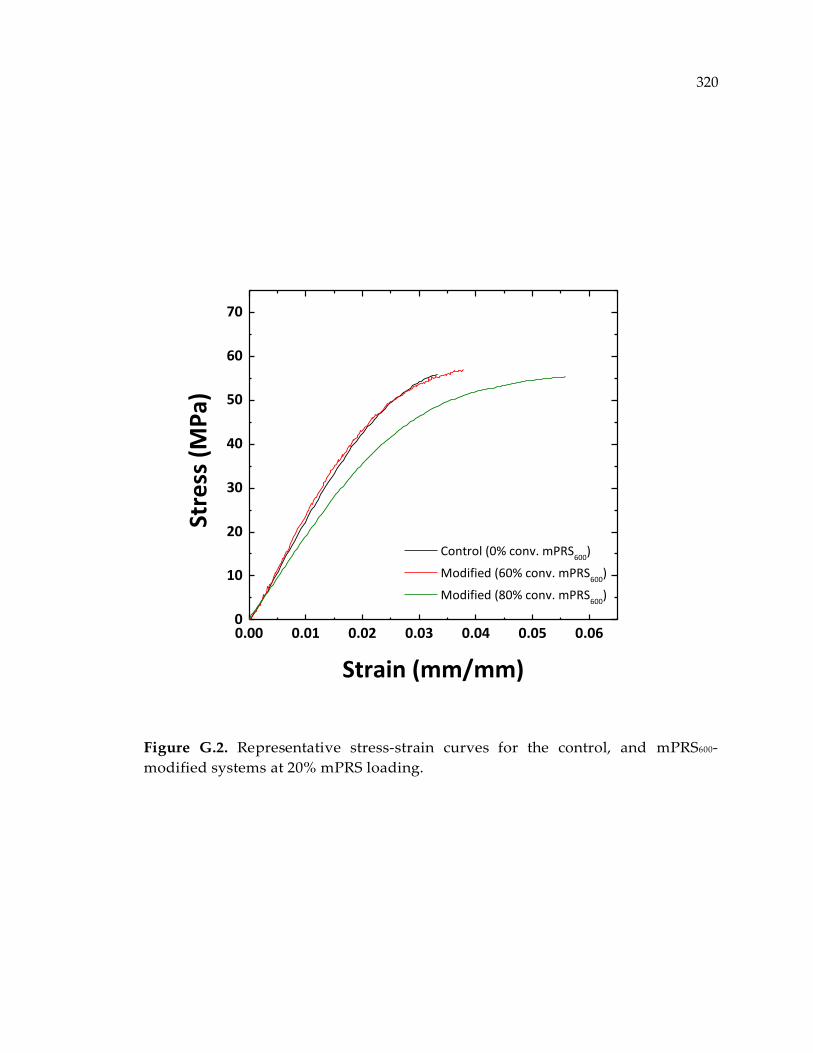
320
Figure G.2. Representative stress-strain curves for the control, and mPRS600-
modified systems at 20% mPRS loading.
0.00 0.01 0.02 0.03 0.04 0.05 0.060
10
20
30
40
50
60
70
Control (0% conv. mPRS600
)
Modified (60% conv. mPRS600
)
Modified (80% conv. mPRS600
)
Stre
ss (
MP
a)
Strain (mm/mm)
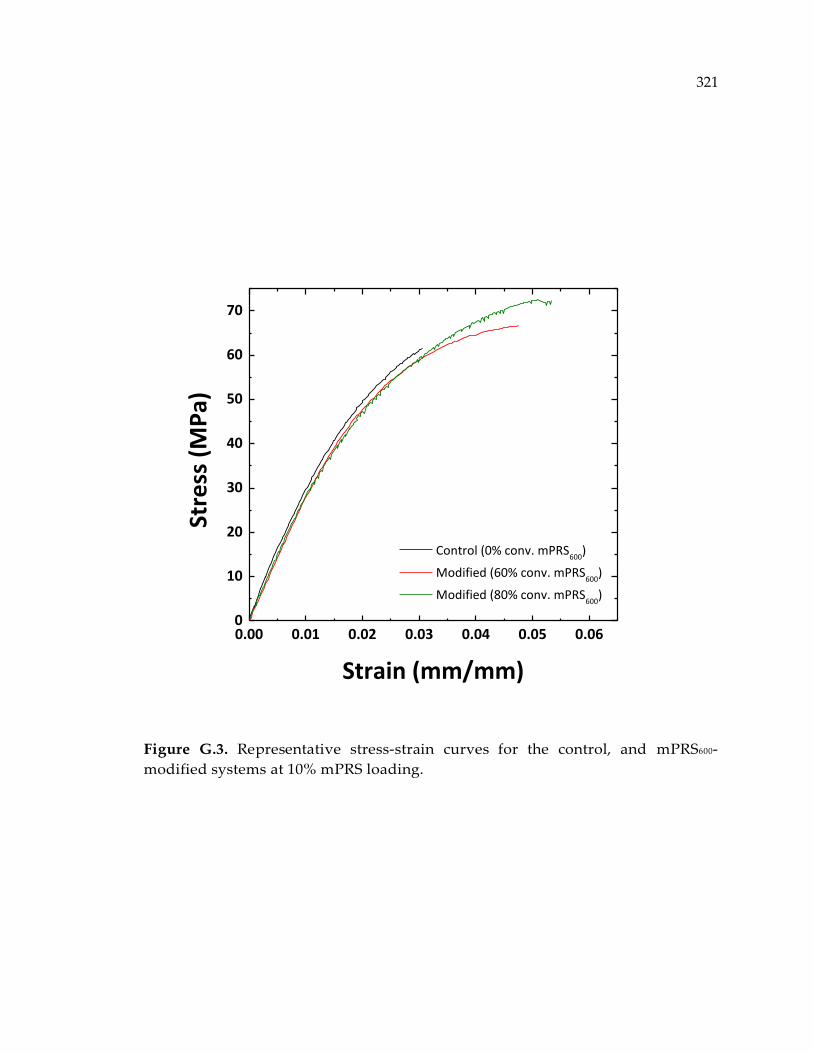
321
Figure G.3. Representative stress-strain curves for the control, and mPRS600-
modified systems at 10% mPRS loading.
0.00 0.01 0.02 0.03 0.04 0.05 0.060
10
20
30
40
50
60
70
Control (0% conv. mPRS600
)
Modified (60% conv. mPRS600
)
Modified (80% conv. mPRS600
)
Stre
ss (
MP
a)
Strain (mm/mm)
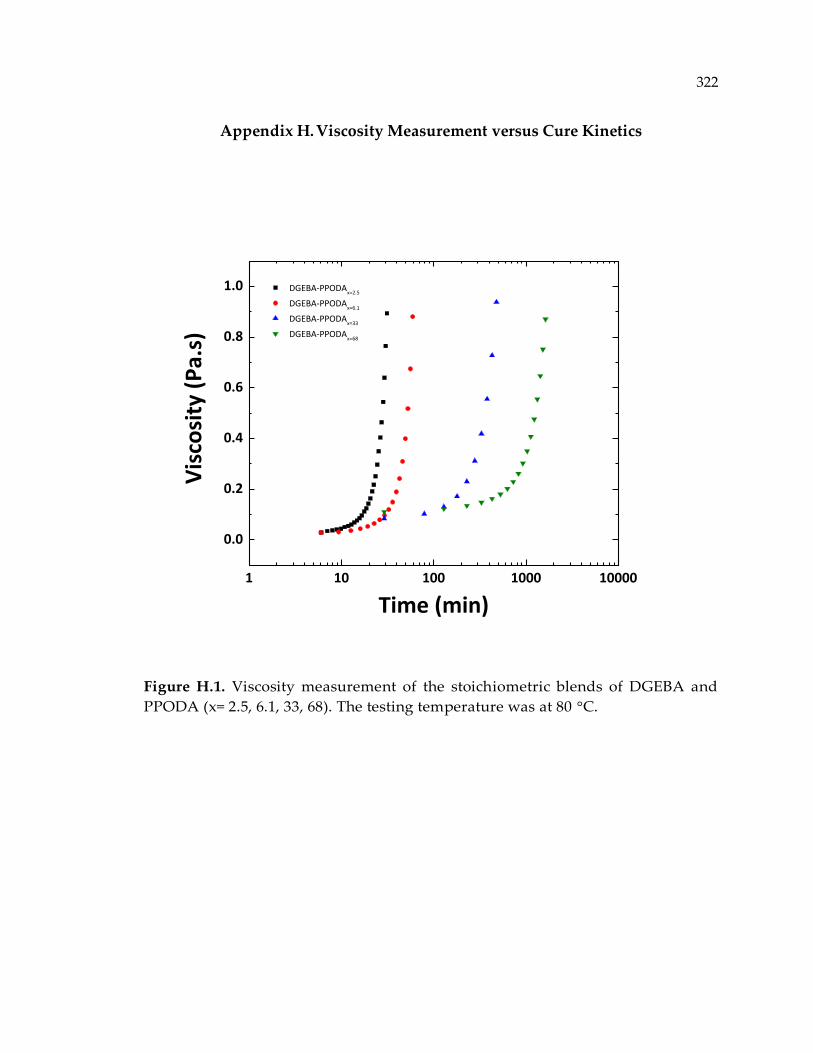
322
Appendix H. Viscosity Measurement versus Cure Kinetics
Figure H.1. Viscosity measurement of the stoichiometric blends of DGEBA and
PPODA (x= 2.5, 6.1, 33, 68). The testing temperature was at 80 °C.
1 10 100 1000 10000
0.0
0.2
0.4
0.6
0.8
1.0
DGEBA-PPODAx=2.5
DGEBA-PPODAx=6.1
DGEBA-PPODAx=33
DGEBA-PPODAx=68
Vis
cosi
ty (
Pa.
s)
Time (min)
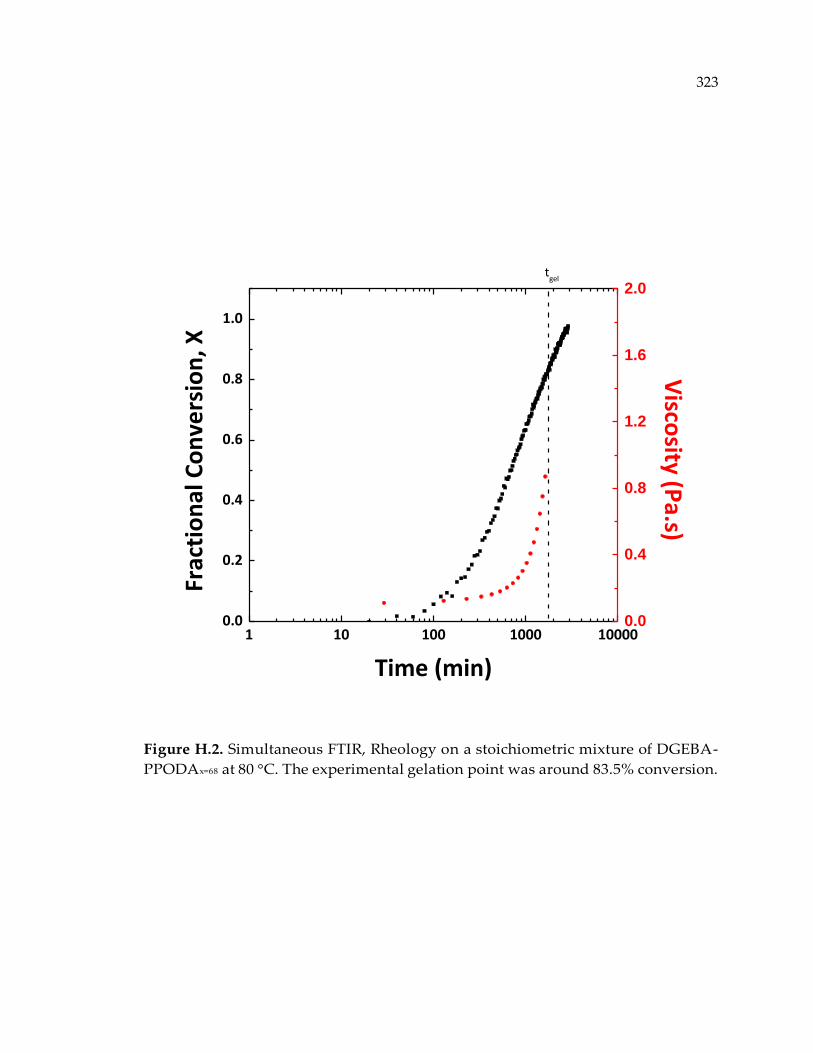
323
Figure H.2. Simultaneous FTIR, Rheology on a stoichiometric mixture of DGEBA-
PPODAx=68 at 80 °C. The experimental gelation point was around 83.5% conversion.
1 10 100 1000 100000.0
0.2
0.4
0.6
0.8
1.0
0.0
0.4
0.8
1.2
1.6
2.0
Frac
tio
nal
Co
nve
rsio
n, X
Time (min)
tgel
Visco
sity (Pa.s)
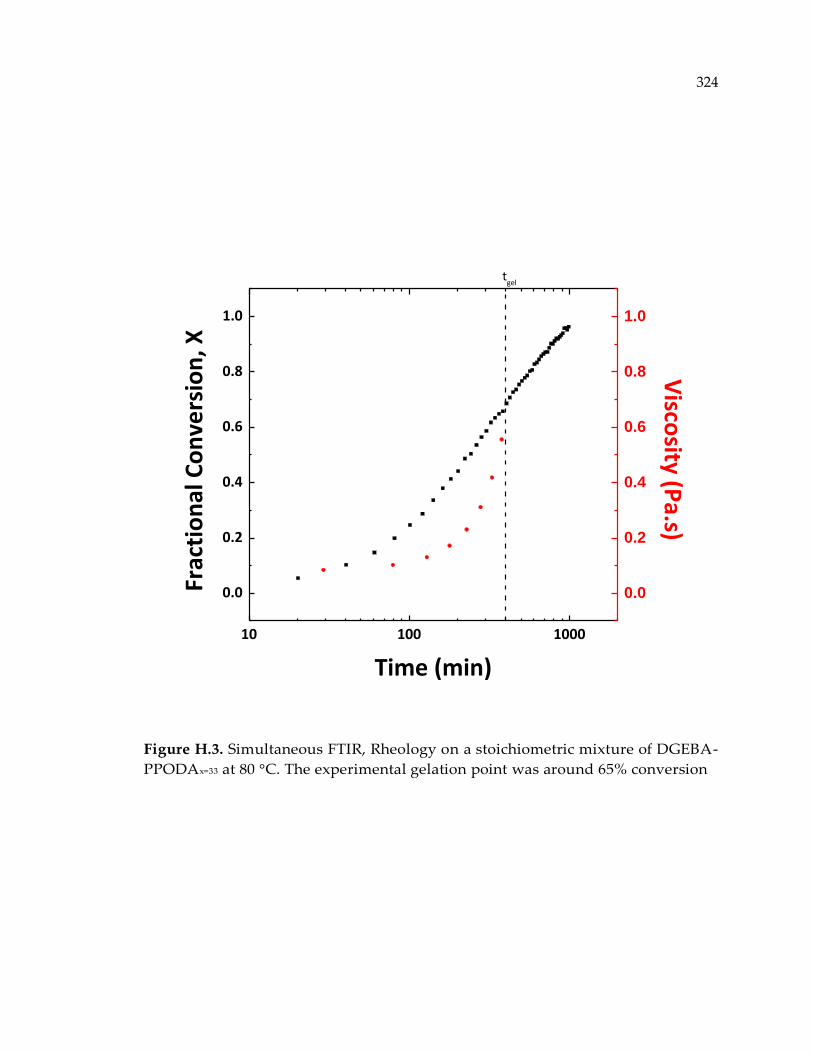
324
Figure H.3. Simultaneous FTIR, Rheology on a stoichiometric mixture of DGEBA-
PPODAx=33 at 80 °C. The experimental gelation point was around 65% conversion
10 100 1000
0.0
0.2
0.4
0.6
0.8
1.0
0.0
0.2
0.4
0.6
0.8
1.0
Frac
tio
nal
Co
nve
rsio
n, X
Time (min)
tgel
Visco
sity (Pa.s)
325
Vita
Majid Sharifi was born in Mashhad, Iran on January 23, 1987. He graduated from
Petroleum University of Technology (former Abadan Institute of Technology) in
Abadan, Iran in 2009 with a B.Sc. degree in Petroleum Engineering – Safety and
Technical Protections. After receiving his B.Sc. degree in Petroleum Engineering,
he worked at Schlumberger, the oil service company, for a couple of months. In
2010, he was admitted into the graduate Chemical Engineering program at Drexel
University where he pursued his doctoral research on designing and synthesizing
high performance thermosetting polymers under the supervision of Prof. Giuseppe
Palmese. Majid’s dissertation on high performance polymers resulted in a number
of outstanding research awards recognized by the professional organizations such
as Adhesion Society, SAMPE, TAFDV, etc., one book Chapter, several peer-
reviewed journal articles and conference proceedings, and at least three additional
publications forthcoming. He has given several talks at professional conferences
and scientific societies. He is currently a member of the American Chemical
Society, American Physics Society, and SAMPE. Majid was selected as outstanding
Ph.D. student of the year of 2014 by the Chemical and Biological Engineering
department. In 2015, he was recognized and awarded the Drexel outstanding
doctoral dissertation in physical and life sciences.

326