Embed Size (px)
Citation preview
Effect of Microwave Treatment Upon Processing Oolitic HighPhosphorus Iron Ore for Phosphorus Removal
HUI-QING TANG, WEI-DI LIU, HUAN-YU ZHANG, and ZHAN-CHENG GUO
Influence of microwave treatment on the previously proposed phosphorus removal process ofoolitic high phosphorus iron ore (gaseous reduction followed by melting separation) has beenstudied. Microwave treatment was carried out using a high-temperature microwave reactor(Model: MS-WH). Untreated ore fines and microwaved ore fines were then characterized byX-ray diffraction (XRD), scanning electron microscopy (SEM), energy dispersive spectroscopy(EDS), and thermogravimetric analysis (TGA). Thereafter, experiments on the proposedphosphorus removal process were conducted to examine the effect of microwave treatment.Results show that microwave treatment could change the microstructure of the ore fines and hasan intensification effect on its gaseous reduction by reducing gas internal resistance, increasingchemical reaction rate and postponing the occurrence of sintering. Results of gaseous reductiontests using tubular furnace indicate both microwave treatment and high reduction temperaturehigh as 1273 K (1000 �C) are needed to totally break down the dense oolite and metallizationrate of the ore fines treated using microwave power of 450 W could reach 90 pct under 1273 K(1000 �C) and for 2 hours. Results of melting separation tests of the reduced ore fines with ametallization rate of 90 pct show that, in addition to the melting conditions in our previousstudies, introducing 3 pct Na2CO3 to the highly reduced ore fines is necessary, and metalrecovery rate and phosphorus content of metal could reach 83 pct and 0.31 mass pct, respec-tively.
DOI: 10.1007/s11663-014-0072-5� The Minerals, Metals & Materials Society and ASM International 2014
I. INTRODUCTION
THERE are multitudes of oolitic high phosphorusiron ore resources in China with a reservation reachingto 2200 million tons at least.[1–3] Oolite in the ores hasan onion-like structure and phosphorus-containing gan-gue layers present in it with thicknesses ranging from 2to 10 lm.[4,5] Conventional beneficiation methods pres-ently face great difficulties in removing phosphorus fromthese resources. The concentrate produced from theseresources contains about 50 mass pct iron (Fe) and from0.8 to 1.2 mass pct phosphorus (P), and so it could notbe supplied on a large scale for BF (Blast Furnace) ironmaking. Therefore, these resources have been ignoredfor>30 years in China. However, as China needs moreand more iron and steel products with the fast devel-opment of its economy, efficient exploitation of theseresources becomes inevitable. Many technical routeshave been proposed across the world to deal with theseore resources or the likes. In summary, they are bio-leaching,[6,7] acid-leaching,[8,9] roasting, or carbothermicreduction followed by magnetic separation,[10–13] andcarbothermic reduction followed by smelting reduc-tion.[2] In addition to these methods, a new method,
which is gaseous reduction followed by melting separa-tion, was proposed by the authors of the current study acouple of years ago.[5] Thermodynamic calculation andlab-scale demonstration indicated that it was feasible.This method has the advantage of using traditionalironmaking and steelmaking equipments such as fluid-ized bed and electric arc furnace, and moreover, lowphosphorus hot metal could be directly produced forsteelmaking. It is, therefore, cost-effective and promis-ing. In the previous studies by the authors of the currentstudy, phosphorus content of the final hot metal rangedfrom about 0.27 to 0.33 mass pct using this phosphorusremoval process; however, it ran into one problem thatthe metallization rate of the reduced ore fines cannotreach 75 pct in the successive lab-scale tests forperfecting this process under either H2 or CO atmo-sphere, at temperatures from 1073 K to 1273 K (800 �Cto 1000 �C) and for a duration from 2 to 5 hours. Thislevel of metallization rate is not acceptable for metalrecovery, and it is necessary to find a way to improve itsreduction degree.Microstructural examination of the reduced ore fines
revealed that low reduction degree of the ore fines couldbe attributed to two factors. One is that the oolite in theore fines is dense as it remains nearly undamaged afterreduction; and the other is that the occurrence ofsintering (formation of a few low melting-point com-pounds) blocks the internal pores. Several studies havestated that gaseous reduction behavior of iron oreparticles depends on many factors, and among themmicrostructure of the ore particles is significant.[14–19]
HUI-QING TANG, Associate Professor, WEI-DI LIU andHUAN-YU ZHANG, Graduate Students, and ZHAN-CHENGGUO, Professor, are with the State Key Laboratory of AdvancedMetallurgy, University of Science and Technology Beijing, Beijing,100083 , P.R. China. Contact e-mail: [email protected]
Manuscript submitted August 26, 2013.
METALLURGICAL AND MATERIALS TRANSACTIONS B

Hence, microstructure of the oolitic high phosphorusore fines needs some positive modification for gaseousreduction intensification.
One method to change the microstructure of the oreparticles is microwave radiation. A variety of applica-tions of microwave treatment in mineral processing andextractive metallurgical industries have been proposed inthe last two decades. They cover a wide area of interest,and now microwave treatment becomes a novel metal-lurgical technology.[20–23] Remarkable successes ofmicrowave treatment were obtained in comminutionfor various ores as coal, iron ore, and nonferrous ores;[24–27]
carbothermic reduction of nickel and copper ores;[28,29]
acid-leaching;[30–33] floatation;[34] roasting;[35] and so on.The main principle of these applications is that mineralshave different microwave absorption characteristics, andthus, selective microwave heating of individual compo-nents in a mixture can be achieved; the subsequentthermal expansion from these temperature increasesresults in significant stresses and strains within the oreparticle, which often exceed the strength of the materialto cause the particles to fracture; this in turn separatespartially different minerals from each other by micro-cracks, or reduce the strength of the particles by fracture.Simulation studies of Jones et al.[36,37] and Whittleset al.[38] about the effect of microwave radiation to oreparticles concluded that fractures occurred around thegrain boundaries between absorbent and transparentspecies. Nevertheless, they pointed out that microwavetreatment might be less efficient at smaller particle sizesfor a fixed applied power density. In the field of iron orereduction, researches are considerably focused on themicrowave application on carbothermic reduction[39–43]
and direct production of pig iron.[44,45] In theseresearches, efficient and speedy microwave heating onboth iron oxides and solid reductants under microwaveradiation is considered to be the key factor for the muchbetter results than those obtained under conventionalheating methods. However, research about microwaveeffect on the gaseous reduction of the ore particles isscarce. The oolitic high phosphorus iron ore fines have aunique microstructure like onion and hematite, quartz,dolomite, clinochlore, and apatite (fluorapatite orhydroxyl fluorapatite) are the main contributors.[5]
Microwave treatment thus is expected to modify themicrostructure of the ore fines and to have a fewbeneficial influences on its gaseous reduction behavior.
In the present study, efforts were made to determineinfluence and mechanism of gaseous reduction behavioron the response of the ore fines to microwave radiationand thereafter to maximize metal recovery rate andminimize phosphorus content in hot metal by applyingmicrowave treatment in the previously proposed phos-phorus removal process.
II. EXPERIMENTAL
A. Material
The natural oolitic high phosphorus iron ore samplefor the current study was from Hubei Province, China.Properties of the ore sample as received could bereferred to Reference 5, and its composition is given inTable I. 500 g of the ore sample was crushed to 100 pctto allow passing through 1.0 mm, and then was dried for2 hours at 573 K (300 �C).
B. Microwave Treatment
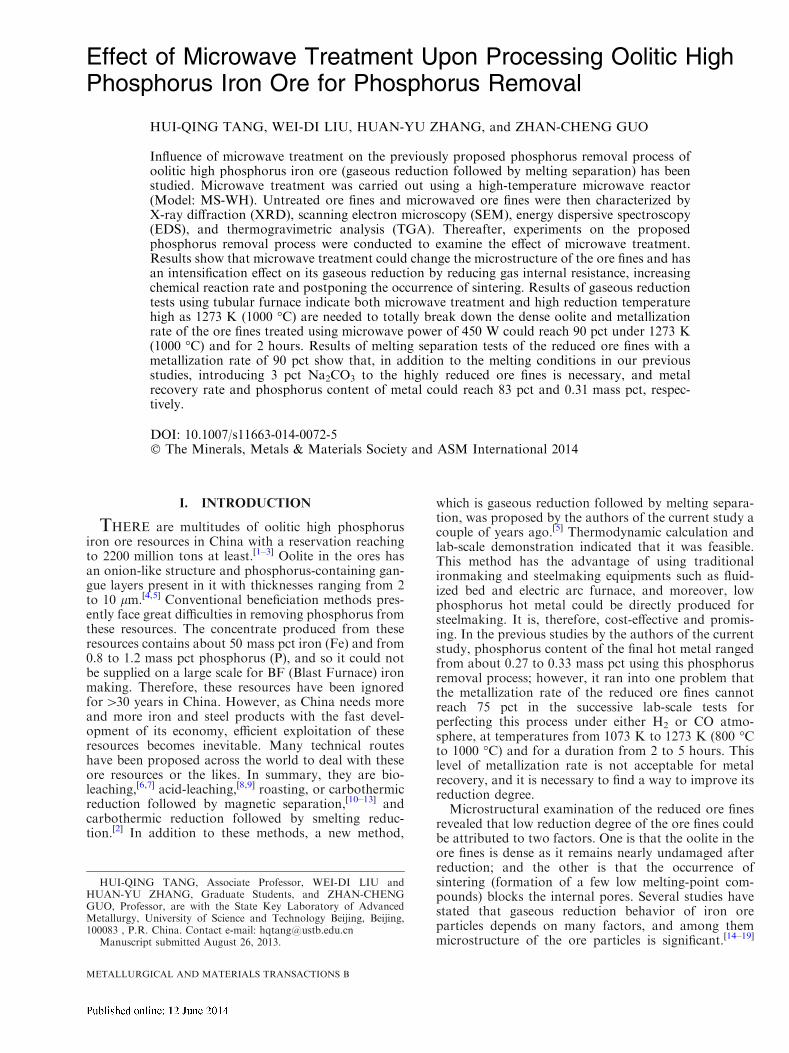
A high-temperature microwave reactor (Model:MS-WH) was utilized for treating the ore fines. Thereactor consists of several parts.Microwaves are generatedusing a variable power generator in the range from 0 to1 kW operating at 2.45 GHz. The generator is connectedby rectangular WR 430 waveguide to an E–H planeautomatic tuner and in turn to a microwave applicator(cavity). The cavity has dimensions of 320 mm (Width),230 mm (Depth), and 300 mm (Height). In the center ofthe cavity, a quartz tube (Diameter: 25 mm) is installed,which serves the purpose of positioning the sample.Schematic diagram of the reactor is shown in Figure 1.In each run, a mass ranging from 20 to 25 g of the ore fineswas used. The sample bed was in the effective zone ofmicrowave radiation. A K-type thermocouple was insertedinto the sample bed. The sample was treated using apredetermined microwave power level and under air atmo-sphere. When temperature of the sample reached 1073 K(800 �C), the treatment was terminated, and the sample wasallowed to cool down naturally to room temperature.
C. Morphological and Phase Identification
X-ray diffraction (XRD), scanning electron micros-copy (SEM), energy dispersive spectroscopy (EDS), andthermogravimetric analysis (TGA) were performed bothon the microwaved and the untreated samples forcharacterization. A brief description of each techniqueis given below:
XRD Phase analysis was carried out using M21X X-raydiffractometer (MAC Science Co. Japan) to revealmajor phases of the sample.SEM/EDS morphology and microstructure of theselected samples were examined using JSM-6480LVscanning electron microscope (JEOL Co. Japan).TGA Tests were conducted using PT 1600 thermalanalysis instrument (LINSEIS Co. Germany). In eachrun, a sample of approximately 100 mg was used. Eachtest lasted for 2 hours under conditions of a predeter-mined temperature, a CO-CO2 mixture atmosphere,(PCO : PCO2
¼ 4 : 1) , and a gas flow rate of 100 mL/min.
Table I. Composition of the Oolitic High Phosphorus Iron Ore Fines (Mass Pct, As Received)
TFe CaO SiO2 MgO MnO Al2O3 P Moisture Others
49.20 1.97 12.40 0.48 0.38 6.20 0.81 4.20 2.30
METALLURGICAL AND MATERIALS TRANSACTIONS B
Pre-TG tests indicated that variation of the samplemass was negligible under N2 atmosphere and at tem-peratures ranging from 1073 K to 1173 K (800 �C to900 �C). Because only iron oxides in all the mainphases of the ore reacted under the reducing atmo-sphere, mass loss of the sample was converted toreduction fraction (f) using Eq. [1].
ft ¼Dmt
mO; ½1�
where Dmt is the mass loss of the sample at time t; andmO is the total oxygen mass in iron oxides of the sampleand was calculated according to Table I.
D. Phosphorus Removal and Iron Recovery Tests
After investigation of the influence of microwaveradiation on microstructure and gaseous reductionbehavior of the ore fines, experiments on the previouslyproposed method for phosphorus removal (gaseousreduction followed by melting separation) using theselected samples were conducted. Procedural details aregiven below.
1. Gaseous reductionGaseous reduction tests were carried out in horizontal
tubular furnace with a quartz tube (Diameter: 40 mm,Length: 800 mm) as reactor. 40 g of the preparedsample was loaded into the tube at the thickness rangefrom 2 to 4 mm and placed in the constant temperaturezone in the furnace. After two ends of the quartz tubewere sealed, the sample was then heated under theprotection of pure N2 at a flow rate of 200 mL/min.When the temperature of the sample reached the desiredtemperature, N2 was replaced by 100 pct CO at a flowrate of 500 mL/min. After holding for a predeterminedperiod, CO was switched back to N2, and the samplewas allowed to be cooled down to room temperature.The reduced samples were subjected to chemical analysisand SEM/EDS analysis. Titrimetric method (iron chlo-ride method) was adopted for the chemical analysis.Metallization rate of the reduced sample (Rm) wascalculated according to Eq. [2]:
Rm ¼MFe
TFe; ½2�
where TFe is mass pct of the total iron in the sample, andMFe mass pct of the metallic iron.
2. Melting separationThe method of the melting separation experiments was
similar to that described in Reference 5. The sample formelting was prepared by mixing chemicals, CaO andNa2CO3, in powder form into the reduced ore fines.Quantity of CaO satisfied the condition that ratio of CaOmass pct to SiO2 mass pct in the melting system was 1.0,and the mixing ratio of Na2CO3 to reduced ore finesvaried. In all individual runs, 20 to 25 g of sample was putin an Al2O3 crucible (diameter: 45 mm, height: 115 mm)which was protected by a graphite crucible. It was thenplaced in the chamber of a Si-Mo furnace. The chamberwas kept inert gas atmosphere by highly pure Ar flow of200 ml/min through the whole process. The sample washeated up to 1823 K (1550 �C). After holding for aprescribed period, it was allowed to cool down to roomtemperature. The obtained metal was weighed and themetal recovery rate (g) was calculated using Eq. [3].
g ¼ mmetal
miron� 100 pct ½3�
where mmetal is the mass of the obtained metal, andmiron is the mass of iron in the reduced sample.Phosphorus content of the obtained metal was mea-
sured by inductively coupled plasma-atomic emissionspectrometry (ICP-AES) using OPTIMA 7000DVatomic emission spectrometer (PE Co. US).
III. RESULTS AND DISCUSSION
A. Characterization of the Ore Fines
1. XRD analysisMicrowave power for the treatment was in the range
from 200 to 700 W. The ore fines exhibited differenttemperature-rising behaviors in response to differentmicrowave powers. It took about 15 minutes to reach1073 K (800 �C) under 200 W; about 4 minutes under450 W; and only about 2 minutes under 700 W. Thoughthe maximum temperature was set to 1073 K (800 �C)for the treatment, it was observed that about 20 pct ofthe sample was sintered under 700 W after treatment.Sintering was mainly due to the design shortage of themicrowave reactor. In the present study, the sample bedin the reactor was fixed but was not rotated, andmicrowave was introduced into the cavity by thewaveguide at a certain angle. Thus, the side of thesample bed facing the waveguide was directly radiated,while its other sides were radiated only by the micro-wave reflected from the metallic sides of the cavity.Microwave energy intensity received by ore particledepends on its location, and this causes an uneventemperature distribution in the bed. Degree of temper-ature difference in the bed increased with the increase ofmicrowave power as was observed in the experiments.Sintering of the sample was negligible when microwavepower was less then 700 W; however, it became obvious
Fig. 1—Schematic diagram of the experimental set-up for microwavetreatment of the ore fines.
METALLURGICAL AND MATERIALS TRANSACTIONS B

when microwave power was >700 W. As microwavepower is >700 W, part of ore bed directly facing thewaveguide could reach a temperature beyond 1073 K(800 �C), and generation of a few low melting-pointcompounds then occurred in this area.
Before XRD analysis tests, sintered part of the samplewas sifted out. Figure 2 shows XRD traces for theuntreated ore fines, the ore fines treated under 450 W, andthe ore fines treated under 700 W in the range from 10 to70 deg for 2h. In Figure 2, The XRD traces show slightchanges, but nothing to definitively state the nature of anynew phases being present after exposure to microwaveradiation. It can be seen that the heights of the peakschangewith treatment. Itmeans significant phase changesdid not happen during microwave treatment.
2. SEM/EDS analysisFigure 3 shows the cross-sectional SEM images of the
microwaved ore fines and untreated ones. It’s apparent
from these observations that progressive damageoccurred in the ore fines with the increase of microwavepower. In the untreated ore fines, dense oolitic structureis clear and ring-like thin gangue layers grow one by onein ore particle (Figure 3(a)). After treatment undermicrowave power of 200 W, a few arc fractures could beobserved in the oolitic (Figure 3(b)). When microwavepower was increased to 450 W, in addition to theincrease of arc fractures in the oolite, many microcracksgrew in various directions near the surface and in thebulk; in the center, porous structure appeared; in edge ofthe oolitic, a few clefts developed toward the center(Figure 3(c)). When microwave power reached 700 W,the ore particle was seriously damaged to be nearbreakage (Figure 3(d)). From these microstructuralevidences, it could be concluded that rapid microwaveheating induces cracking in the ore fines and thatmicrowave radiation results in weakening the strength ofdense oolitic of the ore fines.
Fig. 2—XRD traces in the range from 10 to 70 deg for 2h, for microwaved and untreated ore fines showing effects of microwave power: (a)untreated; (b) 450W; (c) 700 W.
METALLURGICAL AND MATERIALS TRANSACTIONS B

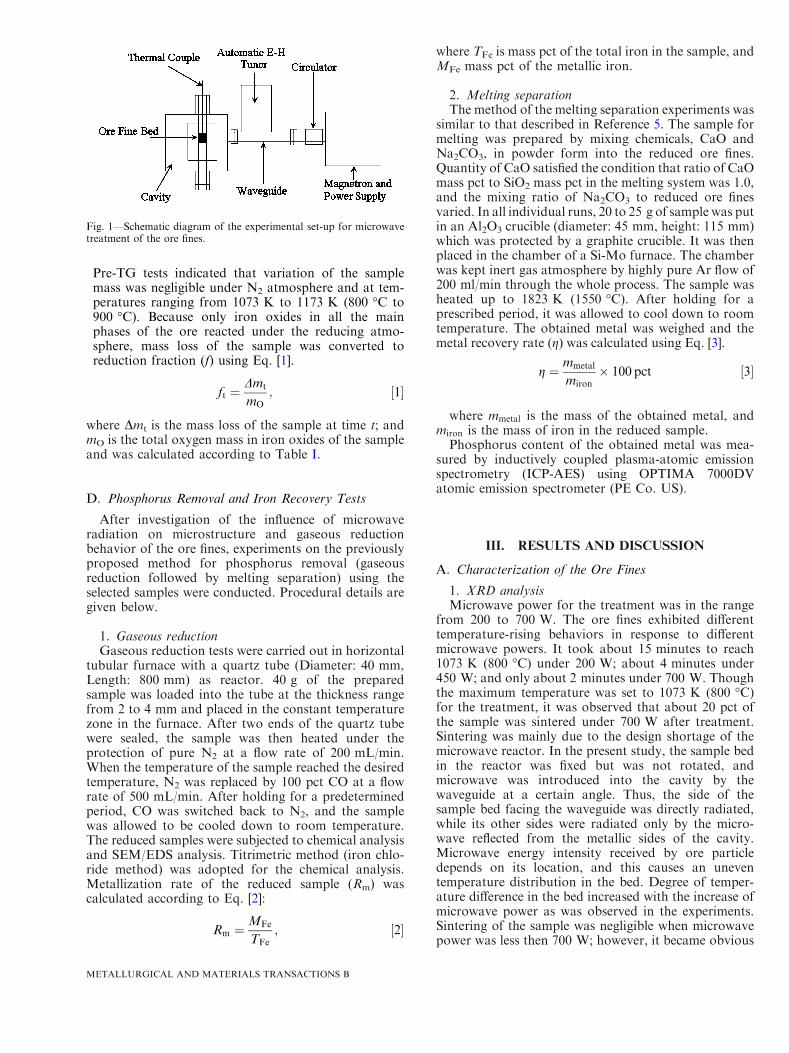
To understand the microstructural characteristics oftypical damage types as arc fractures and microinter-granular cracks, two zones, which are located around arcfracture (Point A in Figure 3(c)) and around intergran-ular fracture (Point B in Figure 3(c)), were then subjectedto a more detailed microstructural examination. Figure 4shows the results. Combined with the XRD patterns inFigure 2, it could be stated that, in Figure 4(a), Point 1represents apatite region. It is then considered that the arcfracture mainly developed along the ring-like ganguelayer. In Figure 4(b), Point 1 is the apatite zone; Point 2 isthe mixture zone of hematite, apatite, and other silicateminerals; and Point 3 is the hematite zone. It could be seenthat extensive microcracks occurred in the area withmulti-minerals (Point 2), and in the areas dominated byone mineral (Point 1 and Point 3), microcracks did notappear under microwave treatment.
As can be seen in Figure 2(a), major minerals presentedin the ore fines are hematite, apatite, dolomite, clinochlore,and quartz. They are different in terms of absorbingmicrowave energy. For example, hematite is a goodabsorption material, while quartz and dolomite are trans-parent ones.[18] Under microwaved radiation, they areheated at different rates, and local temperature differenceappears between phases. Different minerals have differentthermal expansion characteristics. Thermal-induced stres-ses thenoccur on the boundary.Most ofminerals in the ore
fines are brittle under temperature below 1073 K (800 �C),and so as gradients of these thermal stresses reach a certainlevel, fractures and microcracks occur. Moreover, thelayered distributions of hematite and gangues enhanced aquick spreading of fractures throughout the ore particle asshown in Figures 3(c) through (d).
3. TG analysisf–t plots of microwaved and untreated samples are
given in Figure 5. Figure 5 shows that, in the stage after60 minutes, reduction fraction of any microwavedsample is higher than that of the original one, especiallythat of the samples treated under 450 and 700 W. Thismeans gas reduction of the ore fines could be enhancedby microwave treatment. Final reduction fraction of thesample treated using 450 W is almost equal to that ofthe sample treated using 700 W and is about 0.06 morethan that of the untreated one. It still could be seen fromFigure 5 that the increase of reduction fraction is mainlyobtained in the early stage of reduction.Since the ore fines microwaved under 450 W power
exhibit obviously different reduction behaviors fromthose of the untreated ones as shown in Figure 5,reduction kinetics of these two samples were thencompared by analyzing variation of rate controllingsteps during the reduction process. f–t plots of theuntreated ore fines under temperatures from 1073 K to
Fig. 3—Cross-sectional SEM images of samples treated under different microwave powers showing effects of microwave power: (a) untreated; (b)200 W; (c) 450 W; (d) 700 W.
METALLURGICAL AND MATERIALS TRANSACTIONS B
1173 K (800 �C to 900 �C) are given in Figure 6(a), andthose for the microwaved ones given in Figure 6(b). Foreach sample, integration method[46] was adopted toestimate the apparent activation energy at different
reduction fractions. The integration method has theadvantage that kinetics is expressed only as a function ofreduction fraction as shown in Eq. [4] and therefore,complicated reduction mechanisms is skipped.
Fig. 4—Microstructural analysis of two different zones in Fig. 3(c) showing typical damage types induced by different microwave treatments: (a)Point A; (b) Point B.
METALLURGICAL AND MATERIALS TRANSACTIONS B

df
dt¼ k � FðfÞ; ½4�
where t is time (min), f reduction fraction (dimension-less), F(f) reaction model, and k is the temperature-dependent rate constant.k could be expressed as the Arrhenius formula as
follows:
k ¼ A � exp � E
RT
� �; ½5�
where A is the pre-exponential or frequency factor(min�1), T is the reduction temperature, E is theapparent activation energy (J/mol), and R is the gasconstant (8.314 J/mol K).Calculating E and A requires integrating Eq. [4], and
the equation is expressed as
Z t
0
dt ¼ 1
A expð�E=RTÞ
Zft
0
df=FðfÞ ½6�
For a definite f, Eq. [6] yields
tf ¼C expðE=RTÞ
A; ½7�
where tf is the time for reaching f, and C is the constantTaking the logarithm of Eq. [6] yields
ln tf ¼E
104R
� �104
Tþ b ½8�
Plotting the left-hand side of Eq. [8] against 104/T fora given reduction fraction in Figure 6 results in approx-imately straight lines with a slope of E/(104R). Apparentactivation energy for a given reduction fraction couldthen be obtained. The calculated apparent energy valuesunder different reduction fractions for the both samplesare given in Figure 7.Gaseous reduction of the ore fines generally follows
the unreacted shrink core model before sintering occurs.It is stated that the controlling step for ore finesreduction under CO-CO2 atmosphere could be reflectedby the value of the apparent activation energy. Values ofapparent activation energy under internal gas diffusioncontrol, chemical reaction control, and solid-state ironions diffusion control range from 8 to 28, 50 to 75 kJ/mol,and >90 kJ/mol, respectively; and value of apparentactivation energy under mixed control of two steps isbetween the corresponding values of these two steps.[47]
From Figure 7(a), It could be seen that the reductionof the untreated ore fines is under chemical reactioncontrol when f is<0.4, under mixed control of chemicalreaction and gas internal diffusion when f ranges from0.4 to 07; when f is near 0.8, sintering occurs under1173 K (900 �C). From Figure 7(b), it could be seenthat, reduction of the microwaved ore fines is underchemical reaction control when f is <0.5, under mixedcontrol of chemical reaction and gas internal diffusionwhen f ranges from 0.4 to 08; when f is >0.8, sinteringoccurs. These comparisons disclose that microwavetreatment reduces the gas internal diffusion resistanceand postpones the occurrence of sintering.
Fig. 5—Plots of reduction fraction vs time, showing effect of micro-wave power: (temperature: 1073 K (800 �C); atmosphere: PCO : PCO2
¼4 : 1; gas flow rate: 100 mL/min).
Fig. 6—Plots of reduction fraction vs time under temperature of1073 K to 1173 K (800 �C to 900 �C) of different samples (atmo-sphere: PCO : PCO2
¼ 4 : 1; gas flow rate: 100 mL/min): (a) untreatedore fines; (b) ore fines treated using microwave power of 450 W.
METALLURGICAL AND MATERIALS TRANSACTIONS B

Together with the above microstructural observationresults, TG analysis indicates that microwave treatmenthas influence on the gaseous reduction behavior in thefollowing three aspects:
(a) improvement of internal porosity in the ore particleto reduce gas internal resistance;
(b) exposure of inside hematite surface to the reducinggas to increase chemical reaction rate; and
(c) separation of different minerals from each other orisolation of one mineral from the others to postponethe occurrence of sintering.
B. Results of Gaseous Reduction
Final reduction degrees of samples treated undermicrowave power of higher than 450 W are nearly equalas shown in Figure 6. However, microwave power of700 W may easily induce sintering, and this couldweaken fracture and crack effects by microwave irradi-ation on ore particles; therefore, in the gaseous reduc-tion tests with tubular furnace, microwave power of450 W was chosen to treat ore fines for reduction tests.For comparison, reduction of the untreated ore fineswas also conducted. Results are listed in Table II. Ascan be seen from Table II, when reduction period is60 minutes, increase of metallization rate is 25 pct under1073 K (800 �C) and 23 pct under 1273 K (1000 �C)after microwave treatment; when it is 120 minutes, theincrease reaches 8 pct under 1073 K (800 �C) and 18 pctunder 1273 K (1000 �C) after microwave treatment.Obviously the effect of microwave treatment is moresignificant in the initial stage than in the later stage. Thisis in agreement with the above TG results.Cross-sectional SEM images of the reduced particles
under different gaseous reduction conditions are given inFigure 8. InFigure 8, lightareas representmetallic iron, anddark ones gangue. In gaseous reduction, microstructures ofthe ore particles experienced the following variations:
(a) nucleation of fresh metallic iron;(b) agglomeration and growth of tiny metallic iron
particles; and(c) formation of low melting points compounds from
gangue minerals and unreduced iron oxides, andtheir melting under high temperature.
In Figure 8, it could be seen these variations weresignificantly changed by microwave treatment.Figure 8(a) shows the oolitic structure of the untreatedore fines after reduction under 1073 K (800 �C). Theoolite could be observed to be remaining undamaged,and a few clusters of tiny metallic iron grains aredispersed in gangues after reduction. Under mild tem-perature such as 1073 K (800 �C), reduction rate of ironoxide is low, and dense gangue layers hinder gas internaldiffusion into the ore particle, and so microstructuralchange of the oolite is little. This has been discussed inthe previous studies of the author of the current study.[5]
Figure 8(b) shows the microstructures of the micro-waved ore particles after reduction under 1073 K(800 �C). A few microcracks could be observed, whichmainly resulted from the microwave treatment. Metal-lization rate increase in this case is mainly attributed tothe internal porosity increase caused by microwave
Fig. 7—Estimation of apparent activation energy at different reduc-tion fractions for different samples: (a) untreated ore fines; (b) orefines treated using microwave power of 450 W.
Table II. Results of Gaseous Reduction Tests
Reduction Time (min): 60 90 120
1073 K (800 �C)Metallization rate of untreated ore fines/pct 43 63 69Metallization rate of microwaved ore fines/pct 68 74 77
1273 K (1000 �C)Metallization rate of untreated ore fines/pct 46 61 73Metallization rate of microwaved ore fines/pct 68 82 91
METALLURGICAL AND MATERIALS TRANSACTIONS B

treatment. In Figure 8(c), metallic iron grains in the orefines have much larger sizes than those in Figure 8(a).Under reduction temperature of 1273 K (1000 �C), afew gangue minerals became softened or melted, andlocal movement and agglomeration of small iron par-ticle clusters could be realized. However, in this case,oolitic structure could still be clearly identified, and itmeans the oolitic structure cannot be broken down bythe volume expansion and contraction induced by rapidand sequential phase shifts of iron oxides even undertemperature as high as 1273 K (1000 �C). Figure 8(d)shows the cross-sectional morphology of the micro-waved ore fines after reduction under 1273 K (1000 �C).Large metallic iron zones and gangue zones could beeasily observed in it. Strength of the oolite had beensomewhat reduced by microwave treatment; under1273 K (1000 �C), rapid formation of iron phases andgeneration of low melting point compounds still gave acatastrophic damage to the already weakened oolite;hence, embedded hematite grains were then exposed tothe reductant gas in the reduction. The above analysisindicates that microwave treatment could improve thereduction degree to some extent, but to reach areduction degree 90 pct, reduction temperature high as1273 K (1000 �C) is needed.
C. Results of Melting Separation
The most highly reduced sample listed in Table II wasselected for the subsequent melting separation tests. Ahigh metallization rate of ore fines means that FeOcontent decreases in the slag, and, in turn, leads to anincrease of phosphorus content in hot metal.[48,49] Tocompensate for the negative effect induced by micro-wave treatment, the frequently used dephosphorizationagent of Na2CO3 was introduced in the melting sepa-ration runs besides the addition of CaO. As no carbon isin the melting system, and all runs were performedunder Ar atmosphere protection, and the slag/metalseparation is similar to molten steel refinement. Thecoexistence theory of slag structure[50] was then appliedfor the thermodynamics on phosphorus partitionbetween slag and metal. Its details and calculationprocedure could be found in Reference 50. The inves-tigated slag system is considered to be CaO-MgO-MnO-FeO-Al2O3-P2O5-SiO2-Na2O as additive Na2CO3 isdecomposed into Na2O and CO2 under high tempera-ture. Structural units of the slag system are selected byreferring to the steel refining slag system of CaO-MgO-MnO-FeO-Fe2O3-Al2O3-P2O5-SiO2
[50] and a few con-clusions in References 51 through 53, and the selected
Fig. 8—Cross-sectional SEM images of different samples after reduction for 2 h (full CO atmosphere at a flow rate of 500 mL/min) showingeffects of microwave treatment and reduction temperature: (a) untreated ore fines reduced under 1073 K (800 �C); (b) microwaved ore finesreduced under 1073 K (800 �C); (c) untreated ore fines reduced under 1273 K (1000 �C); (d) microwaved ore fines reduced under 1273 K(1000 �C).
METALLURGICAL AND MATERIALS TRANSACTIONS B

structural units are as follows: ions include Fe2+, Mg2+,Ca2+, Mn2+, Na+, O2�; simple oxides include SiO2,P2O5, Al2O3; complicated compounds include 3FeOÆP2O5,4FeOÆP2O5, 2MgOÆP2O5, 3MgOÆP2O5, 2CaOÆP2O5, 3CaOÆP2O5, 4CaOÆP2O5, 3MnOÆP2O5, 3Na2OÆP2O5, MgOÆSiO2,2MgOÆSiO2, CaOÆSiO2, 2CaOÆSiO2, 3CaOÆSiO2, MnOÆSiO2, 2MnOÆSiO2, 2FeOÆSiO2, Na2OÆSiO2, CaOÆMgOÆSiO2,CaOÆMgOÆ2SiO2, 2CaOÆMgOÆ2SiO2, 3CaOÆMgOÆ2SiO2,3CaOÆAl2O3, 12CaOÆ7Al2O3, CaOÆAl2O3, CaOÆ2Al2O3,CaOÆ6Al2O3, MgOÆAl2O3, FeOÆAl2O3, CaOÆAl2O3Æ2SiO2,2CaOÆAl2O3ÆSiO2, 3Al2O3Æ2SiO2.
Phosphorus partition ratio (LP) is calculated fromEq. [9]
LP ¼ðpct P2O5Þ½pct P�2
¼ 141:94N5FeO
�X
nK0ð1þ K3FeO�P2O5N3
FeO þ K4FeO�P2O5N4
FeO
þ K2MgO�P2O5N2
MgO þ K3MgO�P2O5N3
MgO
þ K2CaO�P2O5N2
CaO þ K3CaO�P2O5N3
CaO
þ K4CaO�P2O5N4
CaO þ K3MnO�P2O5N3
MnO
þ K3Na2O�P2O5N3
Na2OÞ; ½9�
where (pct P2O5) is the mass pct of P2O5 in slag, [pct P] Pis the mass pct in metal, Ki is the chemical equilibriumconstant, n denotes moles of total units, and Ni is themass action concentration represented by mole fraction.
Thermodynamic data of complicated compoundsinvolving Na2O are given in Eqs. [10] and [11][51], andthermodynamic data of the others are available inReference 50:
ð2Naþ + O2�Þ + SiO2 = Na2O � SiO2
KNa2O�SiO2= exp[(134055:2þ 40:02TÞ=RT�
½10�
3ð2Naþ + O2�Þ + P2O5 = 3Na2O � P2O5
K3Na2O�P2O5= exp[(1017734� 257:1TÞ=RT�
½11�
The effects of mixing ratio of Na2CO3 on phospho-rus distribution and iron recovery are shown inFigure 9. From Figure 9(a), it could be seen thatNa2CO3 is very necessary to retain phosphorus in slagas phosphorus content in the metal is>0.5 mass pct tothe sample free of Na2CO3, while it decreases to about0.3 mass pct to the sample with Na2CO3 mixing ratioof >3 pct. Thermodynamic calculation indicates thatphosphorus partition ratio increases with an increase ofNa2CO3 mixing ratio, but the experimental resultsindicate that its maximum appears when Na2CO3
mixing ratio is about 3 pct. Agreement betweenthermodynamic calculations and experiments is goodin the scope where Na2CO3 mixing ratio is <3 pct butserious deviation comes when it is >3 pct. Na2O mayevaporate under high temperature >1673 K (1400 �C),and its evaporation becomes severe as Na2CO3 mixingratio increases; thus, the deviation increases.Figure 9(a) also shows that Na2CO3 mixing ratio ofnearly 3 pct to the reduced ore fines is adequate to
obtain qualified hot metal for steel making. FromFigure 9(b), it could be seen that variation of ironrecovery rate is in the range 80 pct through 83 pctwhen Na2CO3 mixing ratio is zero through 5 pct,which indicates that the effect of Na2CO3 additive isnegligible on iron recovery rate.The effects of melting time on phosphorus distribu-
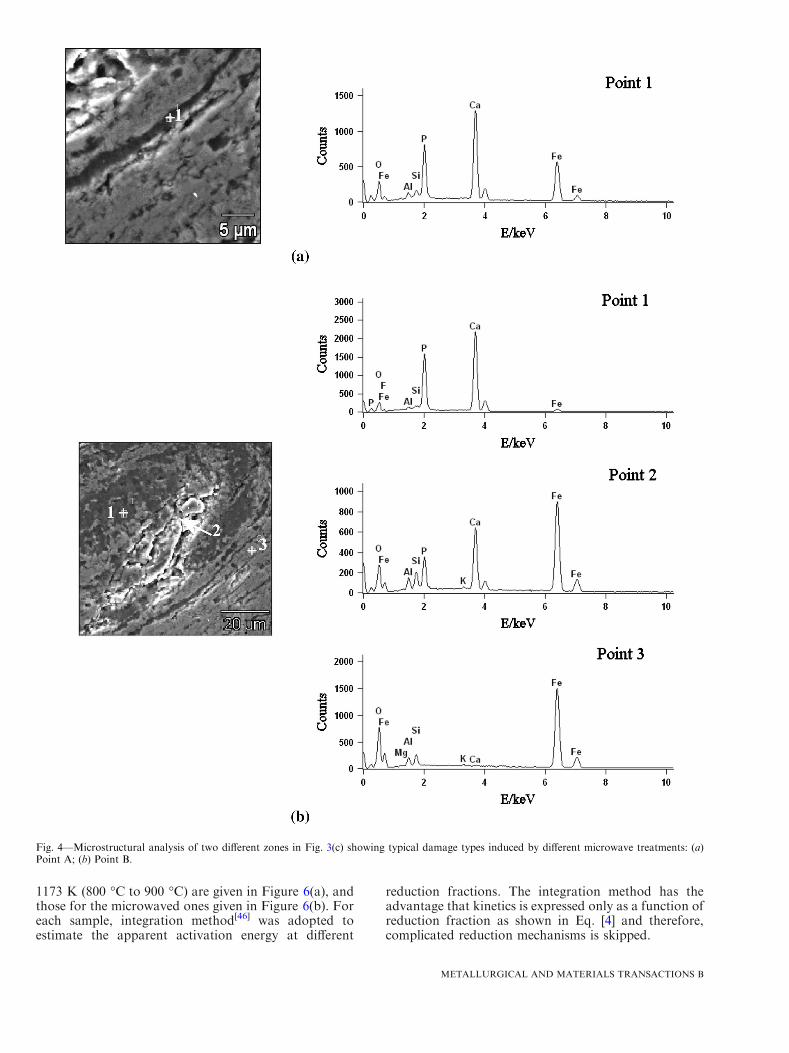
tion and iron recovery are shown in Figure 10. FromFigure 10(a), it could be seen that phosphorus contentin metal increases with the increasing melting time whenmelting time is 0 through 20 minutes; it is nearly stablewhen melting time is >20 minutes, and its variation inmetal is within 0.04 mass pct in the whole melting periodof this test. Thermodynamic calculation showed thatphosphorus partition ratio was 26 in this case, whichagreed with the experimental measurements as theexperimental values were between 22 and 32. Thiscomparison indicates that the melting system is nearthermodynamic equilibrium as the melting time reaches5 minutes. Figure 10(b) gives the effect of melting timeon iron recovery rate and indicates that iron recoveryrate undergoes a successive decrease as melting timeincreases. However, it still could keep>80 pct even whenmelting time is long as 30 minutes.
Fig. 9—Effect of Na2CO3 mixing ratio on phosphorus distributionand iron recovery [melting temperature: 1823 K (1550 �C), meltingtime: 10 min]: (a) phosphorus distribution; (b) iron recovery.
METALLURGICAL AND MATERIALS TRANSACTIONS B
IV. CONCLUSIONS
Microwave treatment on the high phosphorus orefines does not induce significant phase changes but couldchange the microstructure of the ore fines, forming arcfractures and microcracks in the oolite. Dense oolite inthe ore particles could be damaged by microwavetreatment. In this experimental conditions, microwavetreatment for 4 minutes under 450 W could generatesatisfying porous structure in the ore fines.
Microwave treatment has an intensification effect onthe gaseous reduction of ore fines by reducing gasinternal resistance, increasing chemical reaction rate,and postponing the occurrence of sintering. However, toreach a high metallization rate of 90 pct, not onlymicrowave treatment but also the temperature as high as1273 K (1000 �C) is needed.
Microwave treatment has a negative effect on phos-phorus removal efficiency. To compensate for it, inaddition to the melting conditions in the previous studyof the present authors, introducing approximately 3 pctNa2CO3 to the highly reduced ore fines is necessary.Metal recovery rate and phosphorus content in metalcould then reach 83 pct and 0.3 mass pct , respectively,in the melting separation of the reduced ore fines with ametallization of 90 pct.
ACKNOWLEDGMENTS
The authors wish to thank the Chinese Natural Sci-ence Foundation for the support under the ProjectNo. 51144010. Thanks are also given to State KeyLaboratory of Advanced Metallurgy USTB for itsfinancial support.
REFERENCES1. X. Tong, Y. Li, Q. Zhou, F. Rao, and Y. Cui: Eng. Sci. (Chinese),
2005, vol. 7, pp. 323–26.2. J. Liu, G. Li, C. Zhu, and C. Wang: J. Mater. Metall., 2007, vol. 6
(3), pp. 173–79.3. J. Wu, Z. Wen, and M. Cen: Steel Res. Int., 2011, vol. 82 (5),
pp. 494–500.4. S. Song, E.F. Campos-Toro, Y. Zhang, and A. Lopez-valdivieso:
Int. J. Miner. Metall. Mater., 2013, vol. 20 (2), pp. 113–19.5. H. Tang, Z. Guo, and Z. Zhao: J. Iron. Steel Res. Int., 2010,
vol. 17 (9), pp. 1–7.6. T. Jiang and L. Qian: Chin. J. Nonferrous Met., 2007, vol. 17 (10),
pp. 1718–25.7. P. Delvasto, A. Valverde, and A. Ballester:Hydrometallurgy, 2008,
vol. 92 (2), pp. 124–29.8. W. Obot and C.N. Anyakwo: JMA, 2010, vol. 4 (7), pp. 115–22.9. D.Y. Cheng, V.N. Misra, J. Clough, and R. Mun: Miner. Eng.,
1999, vol. 12 (9), pp. 1083–92.10. K. Li, W. Ni, M. Zhu, M. Zheng, and Y. Li: J. Iron Steel Res. Int.,
2011, vol. 18 (8), pp. 9–13.11. G. Li, C. Xie, Y. Zhang, Q. Li, and T. Jiang: 139th Annual meeting
and Exhibition. Supplemental Proceedings, vol. 1: Materials Pro-cessing and Properties, TMS, Seattle, WA, 2010, pp. 505–513.
12. S.B. Kanungo and S.K. Mishra: Miner. Metall. Process., 2000,vol. 17 (1), pp. 37–40.
13. J. Yin, X. Lv, C. Bai, G. Qiu, S. Ma, and B. Xie: ISIJ Int., 2012,vol. 52 (9), pp. 1579–84.
14. S.K. Dutta and A. Ghosh: ISIJ Int., 1993, vol. 33 (11), pp. 1168–73.
15. R. Corbari and R.J. Fruehan: Metall. Mater. Trans. B, 2010,vol. 41B, pp. 318–29.
16. S.P. Matthew and P.C. Hayes: Metall. Trans. B, 1990, vol. 21,pp. 153–72.
17. R.H. Tien and E.T. Turkdogan: Metall. Trans., 1972, vol. 3 (8),pp. 2039–48.
18. E.T. Turkdogan and J.V. Vinters: Metall. Trans., 1972, vol. 3 (6),pp. 1561–74.
19. K. Higuchi and R.H. Heerema: Miner. Eng., 2003, vol. 16 (5),pp. 463–77.
20. K.E. Haque: Int. J. Miner. Process., 1999, vol. 57, pp. 1–24.21. E.T. Thostenson and T.W. Chou: Composites A, 1999, vol. 30,
pp. 1055–71.22. C.A. Pickles: Miner. Eng., 2009, vol. 22, pp. 1112–18.23. S. Bradshaw, W. Louw, C. Merwe, H. Reader, S. Kingman, M.
Celuch, and W. Kijewska: JMPEE, 2006, vol. 40 (4), pp. 228–40.24. T. Uslu and U. Atalay: Fuel Process. Technol., 2003, vol. 85,
pp. 21–29.25. E. Ruisanchez, A. Arenillas, E.J. Juarez-Perez, and J.A. Menendez:
Fuel, 2012, vol. 102, pp. 65–71.26. S. Marland, B. Han, A. Merchant, and N. Rowson: Fuel, 2000,
vol. 79, pp. 1283–88.27. P. Kumar, B.K. Sahoo, S. Dea, D.D. Kar, S. Chakraborty, and
B.C. Meikap: Ind. Eng. Chem. Res., 2010, vol. 16, pp. 805–12.28. M. Samouhos, M. Taxiarchou, R. Hutcheon, and E. Devlin: Mi-
ner. Eng., 2012, vol. 34, pp. 19–29.29. W. Vorster, N.A. Rowson, and S.W. Kingman: Int. J. Miner.
Process., 2001, vol. 63, pp. 29–44.30. R.M. Kelly and N.A. Rowson: Miner. Eng., 1995, vol. 8 (11),
pp. 1427–38.31. P.A. Olubambi: Hydrometallurgy, 2009, vol. 95, pp. 159–65.32. Y. Hua, Z. Lin, and Z. Yan: Miner. Eng., 2002, vol. 15, pp. 451–
56.33. I. Znamenackovaa, M. Lovasa, A. Mockovciakov, S. Jakabskya,
and J. Briancinb: Sep. Purif. Technol., 2005, vol. 43, pp. 169–74.
Fig. 10—Effects of melting time on phosphorus distribution and ironrecovery [melting temperature: 1823 K (1550 �C), Na2CO3 mixingratio: 3 pct]: (a) phosphorus distribution; (b) iron recovery.
METALLURGICAL AND MATERIALS TRANSACTIONS B

34. C. Sahyoun, N.A. Rowson, S.W. Kingman, L. Groves, and S.M.Bradshaw: J. S. Afr. Inst. Min. Metall., 2005, vol. 105, pp. 7–14.
35. B. Nanthakumar, C.A. Pickles, and S. Kelebek:Miner. Eng., 2007,vol. 20, pp. 1109–19.
36. D.A. Jones, S.W. Kingman, D.N. Whittles, and I.S. Lowndes:Miner. Eng., 2005, vol. 18, pp. 659–69.
37. D.A. Jones, S.W. Kingman, D.N. Whittles, and I.S. Lowndes:Chem. Eng. Process., 2007, vol. 46, pp. 291–99.
38. D.N. Whittles, S.W. Kingman, and D.J. Reddish: Int. J. Miner.Process., 2003, vol. 68, pp. 71–91.
39. N. Standish and W. Huang: ISIJ Int., 1991, vol. 31 (3), pp. 241–45.40. K. Ishizaki, K. Nagata, and T. Hayashi: ISIJ Int., 2007, vol. 47
(6), pp. 817–22.41. K. Ishizaki and K. Nagata: ISIJ Int., 2008, vol. 48 (9), pp. 1159–64.42. E.R. Castro, M.B. Mourao, L.A. Jermolovicius, C. Takano, and
J.T. Senise: Steel Res. Int., 2012, vol. 83 (2), pp. 131–38.43. N. Sabelstrom, M. Hayashi, Y. Yokoyama, T. Watanabe, and K.
Nagata: Steel Res. Int., 2013, vol. 84 (10), pp. 975–81.
44. K. Ishizaki, K. Nagata, and T. Hayashi: ISIJ Int., 2006, vol. 46(10), pp. 1403–09.
45. K. Hara, M. Hayashi, M. Sato, and K. Nagata: ISIJ Int., 2012,vol. 52 (12), pp. 2149–57.
46. R. Hu: Thermal Analysis, Science Press, Beijing, 2001.47. J. Liu, J. Zhang, and T. Zhou: J. Iron Steel Res., 2000, vol. 12 (1),
pp. 5–9.48. X. Yang, J. Duan, C. Shi, M. Zhang, Y. Zhang, and J. Wang:
Metall. Mater. Trans. B, 2011, vol. 42B, pp. 738–70.49. X. Yang, C. Shi, M. Zhang, J. Duan, and J. Zhang:Metall. Mater.
Trans. B, 2011, vol. 42B, pp. 951–76.50. J. Zhang: Computational Thermodynamics of Metallurgical Melts
and Solutions, Metallurgical Industry Press, Beijing, 2007.51. D. Wang: Dephosphorization in Ironmaking and Steelmaking,
Metallurgical Industry Press, Beijing, 1983.52. T. Morita and M. Fujii: Trans. ISIJ, 1981, vol. 21 (4), pp. 732–44.53. I. Harashima, M. Matsuo, S. Mizoguchi, and H. Kajioka: Trans.
ISIJ, 1988, vol. 28 (1), pp. 172–78.
METALLURGICAL AND MATERIALS TRANSACTIONS B


![Fertilizer Effect of Phosphorus Recycling Products · 2018-04-17 · Regional distribution of resources and production of phosphate rock ore in 2016 [2]. Country Mine Production 1](https://img.pdfslide.us/doc/110x75/5f4a2262e40dd807e808d3b8/fertilizer-effect-of-phosphorus-recycling-2018-04-17-regional-distribution-of.jpg)