Embed Size (px)
Citation preview

1 EFFECT OF MICROSTRUCTURE OF FERROUS SUBSTRATE ON POROSITY OF ELECTROLESS NICKEL COATING
Leena Das and Der-Tau Chin Department of Chemical Engineering, Clarkson University
Potsdam, New York 13699-5705
2 7 799 __
f 3F
- Robert L. Zeller and Gerald L. Evarts, CEF
Technology Center, Occidental Chemical Corporation 2801 Long Road, Grand Island, New York 14072
ABSTRACT
The corrosion resistance of electroless nickel (EN) coatings on ferrous substrates is affected by coating porosity. Carbon and iron carbide are present in the microstructure of ferrous alloys. If the sites of carbon and iron carbide are not catalytically active to EN deposition as the rest of substrate surface, there is a possibility of pore formation on these sites. In the present study, the rate of EN deposition on carbon, iron carbide and steel surfaces was individually measured. The locations of EN deposit on the microstructure of a ferrous alloy was mapped with the SEM/EDS technique and was compared to the locations of carbon on the original substrate surface. This paper summarizes the results of these investigations.
INTRODUCTION
Electroless nickel (EN) deposition from hypophosphite containing baths has been used for providing corrosion protection to ferrous alloys’. EN coating functions as a barrier against corrosive chemicals. The presence of pits and pores on the coating is detrimental to its corrosion resistance. Many studies have been conducted to examine the effect of bath comp~sition’-~, operating conditions5-’, deposit composition and post treatment procedures? on the corrosion performance of EN. The role of microstructure of a ferrous alloy on the initiation of porosity on EN coatings has been overlooked. A substrate that has passive metallurgical inclusions, adsorbed poisons or is not
homogeneously active to EN deposition reaction on its surface, is likely to generate defects during the EN plating process, including porosity, poor adhesion, and stresses on the deposit’.
Low carbon steel substrates contain 0.1- 0.95% of carbon, some of which is present in the form of iron carbide. The carbon and its compounds may act as an inhibitor to EN deposition process. The present investigation was undertaken to study the effect of substrate microstructure of ferrous alloys on the porosity of EN deposit. The EN plating rate on carbon and iron carbide was measured and compared to that on steel. A specially configured half iron- half graphite substrate was used to examine the spreading of EN deposit from iron to non- catalytic carbon surface. EN coating on a gray cast iron which contains a high percentage of graphite flakes on its microstructure, was analyzed with the SEM/EDS element mapping technique to determine the locations where the EN deposit did or did not form. An electrochemical polarization technique was used to examine the catalytic activity of iron and carbon for EN deposition reaction.
EXPERIMENTAL
EN Deposition on Steel, Carbon, Iron Carbide and Half Iron-Half Carbon Substrates
Electroless nickel deposition was carried out in a bath composed of 44 g/l of nickel sulfate hexahydrate, 10 g/l of sodium hypophosphite, 42 g/l of aminoacetic acid and 10 g/l of acetic acid at 88°C and pH 4.5. Four types
1
49
of substrates were used: i) AIS1 I010 carbon steel coupons; i i ) carbon substrates in form of graphite sheet, carbon disk and glassy carbon rod; iii) iron carbide; and iv) half iron-half carbon substrates.
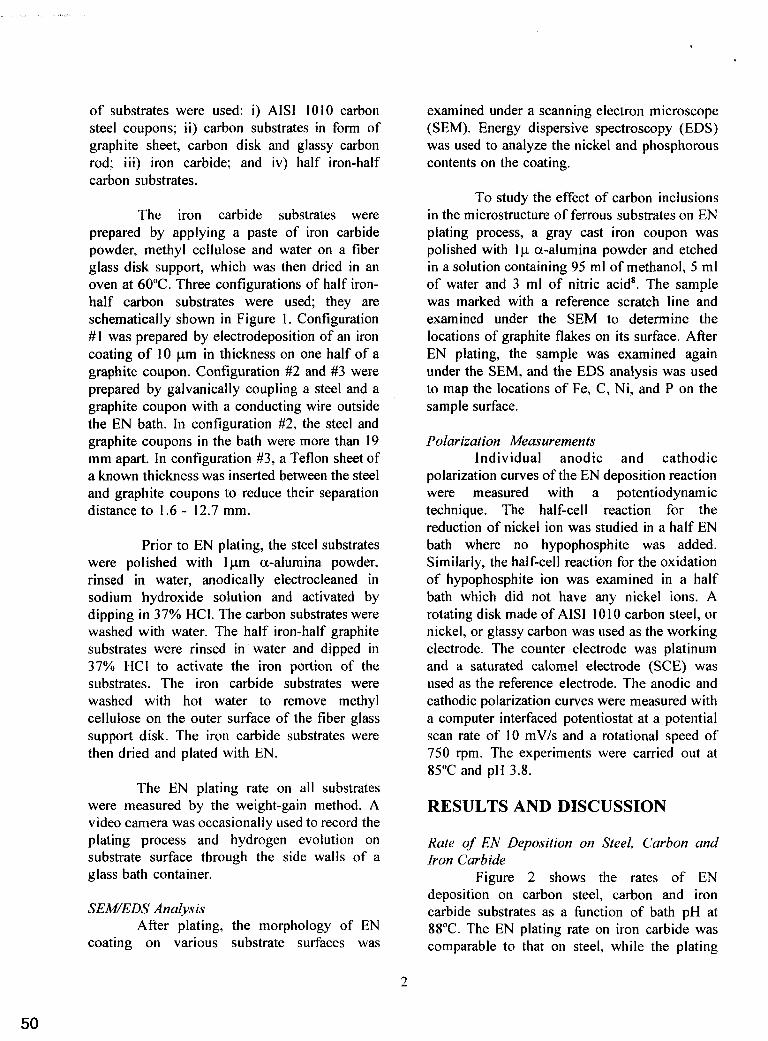
The iron carbide substrates were prepared by applying a paste of iron carbide powder, methyl cellulose and water on a fiber glass disk support, which was then dried in an oven at 60°C. Three configurations of half iron- half carbon substrates were used; they are schematically shown in Figure 1. Configuration # I was prepared by electrodeposition of an iron coating of 10 pm in thickness on one half of a graphite coupon. Configuration #2 and #3 were prepared by galvanically coupling a steel and a graphite coupon with a conducting wire outside the EN bath. In configuration #2, the steel and graphite coupons in the bath were more than 19 mm apart. In configuration #3, a Teflon sheet of a known thickness was inserted between the steel and graphite coupons to reduce their separation distance to 1.6 - 12.7 mm.
Prior to EN plating, the steel substrates were polished with 1pm a-alumina powder, rinsed in water, anodically electrocleaned in sodium hydroxide solution and activated by dipping in 37% HCI. The carbon substrates were washed with water. The half iron-half graphite substrates were rinsed in water and dipped in 37% HCI to activate the iron portion of the substrates. The iron carbide substrates were washed with hot water to remove methyl cellulose on the outer surface of the fiber glass support disk. The iron carbide substrates were then dried and plated with EN.
The EN plating rate on all substrates were measured by the weight-gain method. A video camera was occasionally used to record the
examined under a scanning electron microscope (SEM). Energy dispersive spectroscopy (EDS) was used to analyze the nickel and phosphorous contents on the coating.
To study the effect of carbon inclusions in the microstructure of ferrous substrates on EN plating process, a gray cast iron coupon was polished with 1p a-alumina powder and etched in a solution containing 95 ml of methanol, 5 ml of water and 3 ml of nitric acid'. The sample was marked with a reference scratch line and examined under the SEM to determine the locations of graphite flakes on its surface. After EN plating, the sample was examined again under the SEM, and the EDS analysis was used to map the locations of Fe, C, Ni, and P on the sample surface.
Polarization Measurements Individual anodic and cathodic
polarization curves of the EN deposition reaction were measured with a potentiodynamic technique. The half-cell reaction for the reduction of nickel ion was studied in a half EN bath where no hypophosphite was added. Similarly, the half-cell reaction for the oxidation of hypophosphite ion was examined in a half bath which did not have any nickel ions. A rotating disk made of AIS1 101 0 carbon steel, or nickel, or glassy carbon was used as the working electrode. The counter electrode was platinum and a saturated calomel electrode (SCE) was used as the reference electrode. The anodic and cathodic polarization curves were measured with a computer interfaced potentiostat at a potential scan rate of 10 mV/s and a rotational speed of 750 rpm. The experiments were carried out at 85°C and pH 3.8.
RESULTS AND DISCUSSION -
plating process and hydrogen evolution on Rate of' EN Deposition on Steel, Carbon and substrate surface through the side walls of a Iron Carbide glass bath container. Figure 2 shows the rates of EN -
deposition on carbon steel, carbon and iron SEWEDS Analysis carbide substrates as a function of bath pH at
88°C. The EN plating rate on iron carbide was coating on various substrate surfaces was comparable to that on steel, while the plating
After plating, the morphology of EN
2
50

rate on carbon was zero. It was noticed that EN deposition reaction was always accompanied by a parallel hydrogen evolution reaction on substrate surface. There was instantaneous evolution of hydrogen upon immersion of steel and iron carbide substrates in the EN bath; no hydrogen evolution was observed for all carbon substrates including carbon disks, graphite sheets, glassy carbon rods. The SEM/EDS analysis of the samples after EN plating revealed the presence of nickel-phosphorous deposit on steel and iron carbide and none on carbon surfaces.
EN Deposition on Half Iron-Half Carbon Substrates
Video recording of EN plating process was carried out for the configuration #1 half iron-half carbon substrates which were prepared by electroplating of iron on the top half of a graphite sheet as shown in Figure 1 (a). Since hydrogen bubbles were formed on the surface sites where EN was deposited, tracing the movement of hydrogen bubbles by a video camera would give an idea about the spreading of EN coating on substrate surface.
Figure 3 is a schematic representation of the hydrogen bubble movement process during the EN plating on a half iron-half carbon substrate. At the beginning of the plating process, evolution of hydrogen bubbles occurred only on the iron half of the substrate as shown in Figure 3 (b). After five minute of immersion in the EN bath, hydrogen bubbles started to spread across the iron-graphite boarder line and evolved on the graphite half of the substrate as shown in Figure 3 (c). The number of hydrogen bubbles on the graphite increased with time and ultimately the entire graphite surface was covered with hydrogen bubbles (Figure 3 (d)). These results indicate that on a half iron-half carbon surface, EN deposition was initiated only on the iron portion of the surface. The EN deposition moved to the carbon portion of the surface by a galvanic action between the carbon and iron (or EN which had deposited on the iron) in the bath9. The galvanic activation of carbon first occurred in the immediate neighborhood of the carbon-iron (or carbon-EN)
borderline and then gradually spread across the graphite surface. After 30 minutes of plating, the entire graphite portion of the substrate was covered by an EN coating.
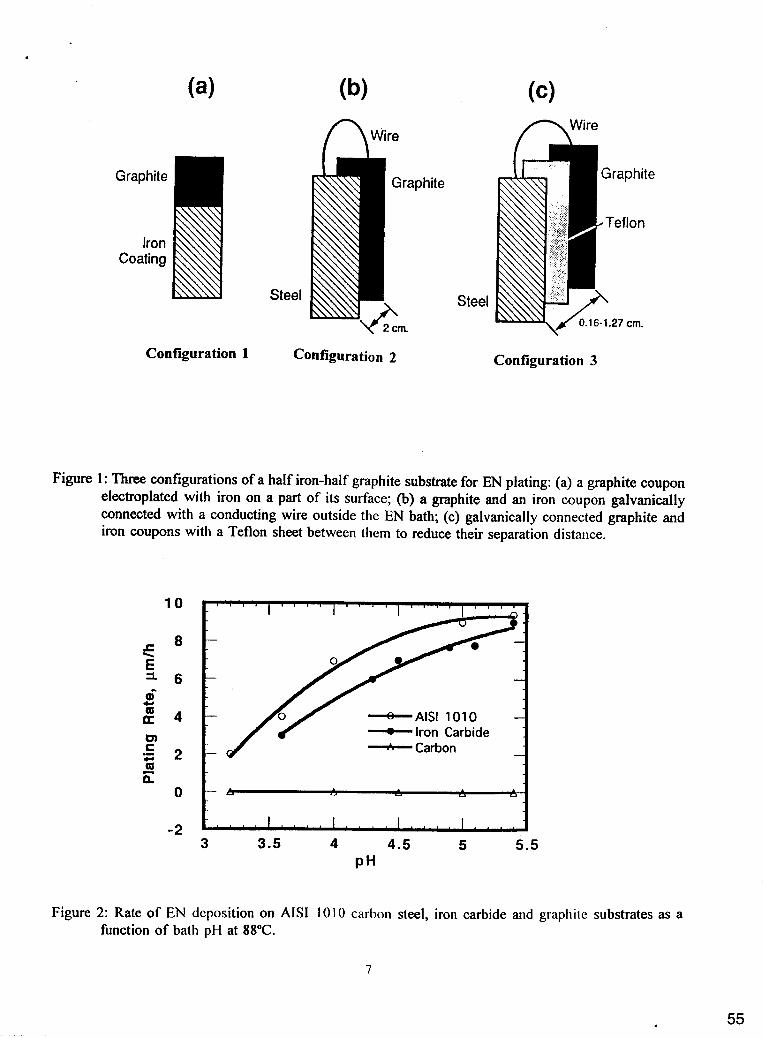
Figure 4 (a) is a SEM photomicrograph of the half iron-half graphite substrate prior to EN plating. The accompanying EDS spectrum indicates that there was only C on the carbon portion and Fe on the iron portion of the surface. Figure 4 (b) is a SEM photomicrograph of the substrate surface after 5 minutes of EN plating; the accompanying X-ray spectrum revealed that there was nickel-phosphorous deposit on the iron portion and very little nickel on the graphite portion of the substrate. Figure 4 (c) is a SEM photomicrograph of the substrate surface after 15 minutes of EN plating; the accompanying EDS spectrum revealed that there was nickel- phosphorous deposit on both iron and graphite portions the substrate. These results were repeatable and were also observed on pelletized carbon disks which were in contact with a steel coupon in the EN bath. Although EN deposition did not occur spontaneously on carbon, the carbon surface could be activated by galvanic contact with an active metal, such as iron, nickel and EN, to permit the EN plating to occur on the carbon surface.
To examine the effect of separation distance on the galvanic initiation of EN deposition on carbon surface, two other configurations (#2 and #3) of half iron-half carbon substrates were used. In configuration #2 (Figure 1 (b)), a steel and a graphite coupon were positioned 19 mm apart in an EN bath. They were galvanically connected with an external conductor and was immersed in the EN bath for one hour. The EDS and weight gain analyses after the plating revealed that there was EN deposit on the steel surface, but none on the graphite surface. In configuration #3, the distance between the steel and the graphite were made smaller by inserting a Teflon sheet (1.6 to 12.7 mm in thickness) between them as shown in Figure 1 (c). EN deposition along with hydrogen evolution was observed on both graphite and steel surfaces. However, the EN deposition rate
3
51

on the graphite surface decreased with an increase in the separation distance as shown on Table 1.
Table 1: Plating rate on graphite and steel as a function of the separation distance between them.
Separation Plating Rate (pmlhr) Distance (") Electrically Electrically
Connected isolated Steel Graphite Steel Graphite
I .6 9.2 8.2 9. I 0 3.2 9.1 5.5 9.2 0 6.4 9.1 3.2 9.2 0 12.7 9.2 I .6 9.1 0
When the external conducting wire in configuration #3 was removed, no EN deposit was observed on the graphite for all the separation distances in Table 1 . This indicates that it was necessary for the graphite to be in galvanic contact with steel in order to be active to EN deposition reaction. The data also suggest that some sort of active soluble species which diffuses from the steel to the graphite, causing EN deposition to occur.
EfSect of Carbon Inclusions in Substrate Microstructure on EN Deposition Process
To study the effect of carbon in ferrous alloys on EN deposition, gray cast iron was chosen as the substrate because it has a high percentage of graphite flakes i n its microstructure. Several gray cast iron coupons were polished, anodically electrocleaned, etched, and marked with a reference scratch line. They were individually examined under the SEM to record the locations of graphite flakes on their surfaces. Afterwards they were cleaned and simultaneously immersed in a common EN bath. The coupons were withdrawn from the EN bath at different plating times to permit the build-up of different thicknesses of EN coating. The coupons after EN plating were re-examined under the SEM. and the locations of individual elements, such as Fe, C, Ni, and P, on the
coupon surface were mapped with the EDS analysis.
Figure 5 (a) shows the SEM photomicrograph of a gray cast iron coupon prior to plating. The light areas represents the iron portion of the surface and the graphite flakes are represented by dark streaks on the figure. This coupon was EN-plated for 2 minutes and had an average EN thickness of 0.4 pm on its surface. Figure 5 (b) is the SEM photomicrograph of the coating on the same area of the substrate. The EN coating was so thin that the dark graphite flakes were still visible under the coating. The x- ray element maps showing the presence of Fe, C, Ni, and P on the same sample area are given in Figures 5 (c), (d), (e), and (f), respectively. The light color in a particular location of the map shows the presence of an identified element in that location. A comparison of Figures 5 (c) - (f) shows that Ni and P were present on the same locations as iron, and there were no Ni and P in the locations where carbon was present.
Figure 6 (a) is the photomicrograph of another gray cast iron coupon prior to EN plating. This coupon was immersed in the EN bath for 5 minutes and was coated with a layer of EN of 1.2 pm in thickness. Figure 6 (b) is the photomicrograph of the coating, which shows that most of the substrate surface had been covered with EN including the locations where graphite was present in the microstructure. Figures 6 (c), (d), (e) and (f) show the distribution of Fe, C, Ni, and P, respectively, on the same coupon surface. These figures revealed the presence of nickel-phosphorous deposit on the iron as well as on the carbon portion of the substrate surface, though some graphite flakes were still visible under the SEM. For the gray cast iron samples with still thicker EN deposit, the graphite and iron microstructure were totally covered with EN, and the EDS analysis revealed only the presence of Ni and P on the sample surface.
-
The above results indicate that at the initial state of EN plating process, EN deposition initiated only on the iron portion of the substrate
4
52

and there was no EN deposition on the graphite portion of the microstructure. With increasing time, EN deposition occurred on the graphite due to the galvanic contact between the iron and graphite in the substrate. However, the coating thickness on the graphite locations was lower than that on the iron portion of the substrate. For a thin EN coating on a ferrous substrate there was a possibility of pore formation on the spots where graphite was present on the surface.
Polarization Curves To examine why spontaneous EN
deposition reaction does not occur on carbon surface, polarization measurements with half EN baths were performed with nickel, steel, and glassy carbon rotating disk electrodes (RDE). Nickel and steel exhibited the similar polarization characteristics in the anodic half- bath which did not contain nickel ions as well as in the cathodic half-bath which did not contain hypophosphite ions. Figure 7 (a) shows the anodic polarization curve on AIS1 1010 carbon steel for the oxidation of hypophosphite in the anodic half-bath and the cathodic polarization curve for the reduction of nickel i n the cathodic half-bath. The two polarization curves intersected at a mixed potential of -0.74 V vs. SCE, and the deposition current at the mixed potential was 2.65 mA/cm2 corresponding to an EN deposition rate of 3.7 pm/hr. This value was in reasonable agreement with an EN deposition rate of 4.1 pm/hr for a carbon steel rotating disk in a full EN bath under the same experimental conditions (750 RPM, pH 3.8, and 85OC).
Figure 7 (b) shows the anodic and cathodic polarization curves obtained with the glassy carbon RDE. The cathodic polarization curve shows that reduction of nickel ions took place on the carbon electrode at a lower rate than on the steel electrode. The anodic polarization curve on the glassy carbon electrode occurred at a more positive potential of -0.1 V vs. SCE. This potential did not correspond to the oxidation of the hypophosphite i n acidic media which should occur at -0.75 V vs. SCE. The anodic and cathodic polarization curves on the glassy carbon electrode did not intersect to
exhibit a mixed potential as shown in Figure 7 (b). Thus the reason for no spontaneous EN deposition on carbon surface was due to the fact that carbon did not catalyze the oxidation reaction of hypophosphite ions.
CONCLUSION
A study has been made of the effect of carbon and iron carbide inclusions in the microstructure of ferrous substrates on the EN deposition process. The present results indicate that spontaneous EN deposition reaction did not occur on carbon surface. This was due to the fact that carbon did not catalyze the oxidation reaction of hypophosphite ions. However, when carbon was in galvanic contact with a catalytically active metal, such as iron, the EN deposition occurred on the carbon surface. Studies with a half iron-half carbon substrate and the EDS element mapping of EN coating on gray cast iron revealed that EN deposition first occurred on the iron surface and then gradually spread to the carbon surface due to a galvanic activation of carbon for the EN deposition process. Given sufficient time, EN deposit ultimately covered the entire carbon area. However, on the carbon surface the induction time for EN deposition was longer and deposit thickness was thinner than those on the iron portion of the substrate surface. The results indicate that carbon inclusions on substrate microstructure could serve as the potential sites for the formation of pores on EN coatings on ferrous alloys.
ACKNOWLEDGEMENT
The work described in this paper was supported by AESF Project 90. The authors wish to thank Ken W. Lemke of UMR Systems Inc., for his assistance and discussion in the course of this study.
REFERENCES
1. Tracy, R.P., Shawhan, G.J., Materials Performance, 19,(No. 7), 65 (1 980).
5
53

2. Mallory, G.O., Plating, 61 (No. 1 I ) , 1005 ( 1 974).
3. Duncan, R.G., Proc. Corrosion Conference, Paper No. 136, National Association of Corrosion Engineers, Houston, (1 982).
Fundamentals and Applications," edited by Mallory, G.O., and Hajdu, J.B., pp. 3 - 55, American Electroplaters and Surface Finishers Society, Orlando, FL, 1990.
(No. 3), 5 (1981).
77 (No. 3), 563 (1986).
Electroless Nickel Conference, Paper No. 12, Products Finishing, Cincinnati, OH (1989).
8. ASTM Annual Book of Standards, Part E, pp. 407-70, ASTM, Philadelphia, PA ( 1989)
9. Stremsdoerfer, G., Queau, E., and Martin, J.R., Electrochim. Acta, 39, 2525
4. Mallory, G.O., i n "Electroless Plating
5 . Duncan, R.N., Finishers Management, 20
6. Linka, G. and Riedel, W., Glavanotechnik,
7. Ruffini, A.J., and Aleksinas, M.J., Proc.
( 1 994).
6
54
Graphite
Iron Coating
Steel
Configuration 1 Configuration 2 Configuration 3
Figure 1 : Three configurations of a half iron-half graphite substrate for EN plating: (a) a graphite coupon electroplated with iron on a part of its surface; (b) a graphite and an iron coupon galvanically connected with a conducting wire outside the EN bath; (c) galvanically connected graphite and iron coupons with a Teflon sheet between them to reduce their separation distance.
10
8 f E
6 4-
d 4
3 3.5 4 4.5 5 5.5 PH
Figure 2: Rate of EN deposition on AIS1 1010 carhoii steel, iron carbide and graphite substrates as a function of bath pH at 88°C.
7
55

Iron
Graphite
Figure 3: Schematic representation of EN deposition process on a half iron-half graphite substrate: a) prior to EN plating; b) at 1 minute of immersion in the EN bath, hydrogen bubbles evolved only on the iron portion of the substrate; c) after 5 minutes of immersion, hydrogen bubble evolution sites spread toward the graphite surface; c) after 40 minutes of immersion in the EN bath; both iron and graphite surfaces were completely covered by hydrogen bubbles.
8

;1
E P 0 U
E 0 L II
57

1 1 1 I
'0 IN N
\
z w rc 0 v1 u 3 E *
.- E
59

i 0
a . - L
60

E l
.

c -0.6 0 v)
v) > .-0.65
Y
> -0.7 m -
Q
E Q,
'S -0.75
2 -0.8 c,
Log (Current Density, A/cm2)
n UI 0 v)
4 > v
Q
C .- c,
Q,
0 c,
n
0.4
0.2
0
-0.2
-
Anodic Polarization - 3
Cathodic Polarization 1 1
-6 -5.5 -5 -4.5 -4 -3.5 -3 -2.5 Log (Current Density, A/cm2)
Figure 7: Anodic and cathodic polarization curves for EN deposition reaction on a rotating disk electrode made of: (a) AIS1 1010 carbon steel; and (b) glassy carbon.
14
62