Embed Size (px)
Citation preview

EFFECT OF MICRO-ENCAPSULATED FERROUS SULFATE ON CHEDDAR
CHEESE COMPOSITION, DIVALENT CATION BALANCE AND ACCEPTABILITY
By
Abraham Arce
A THESIS
Submitted to
Michigan State University
in partial fulfillment of the requirements
for the degree of
Food Science – Master of Science
2016

ABSTRACT
EFFECT OF MICRO-ENCAPSULATED FERROUS SULFATE ON CHEDDAR
CHEESE COMPOSITION, DIVALENT CATION BALANCE AND ACCEPTABILITY
By
Abraham Arce
Cheddar cheese was manufactured using standard Cheddar cheese procedures a total of
three times. Cheddar cheese was fortified with LMFS (Large Micro-Encapsulated Ferrous
sulfate, 700-1000 µm) or Small Micro-Encapsulated ferrous sulfate, 220-422 µm). After 90 d
aging, mineral content was analyzed using Atomic Absorption Spectroscopy (AAS). In order to
provide further information, lipid oxidation assessment, sensory evaluation, and proximate
analysis were performed. All collected data was analyzed using one-way ANOVA and Tukey’s
HSD Test (p = 0.05). Iron content for all treatments were significantly different (p<0.05);
approximately 0.030 mg Fe/ g cheese for the control, 0.134 mg Fe/ g cheese for LMFS, and
0.174 mg Fe/ g cheese for SMFS. Results showed 66.0% iron recovery for LMFS and 91.0%
iron recovery for SMFS. Fat, protein, ash, moisture, magnesium, zinc and calcium content were
not significantly different when comparing fortified cheeses with the control. No lipid oxidation
changes due to fortification were reported in the iron fortified Cheddar cheese. Consumer
acceptance testing demonstrated that iron fortification negatively affected Cheddar cheese
sensory attributes. Micro-encapsulation of ferrous sulfate failed to mask iron distinct taste, color
and odors. Overall, micro-encapsulated ferrous sulfate caused no major changes in composition
and successfully increased iron content in Cheddar. SMFS showed slightly better results for iron
retention and sensory evaluation in Cheddar cheese. This study provides new information on
fortification, size particle and micro-encapsulation research. In the future, it is recommended to
select a lower fortification dose for SMFS to analyze possible sensory evaluation benefits.

iii
I would like to dedicate this work to my parents, Carlos Arce and Lourdes Ruvalcaba, thanks for
all your love and support.
¡GRACIAS PAPÁS!

iv
ACKNOWLEDGEMENTS
My deeply appreciation to my advisor Dr. Zeynep Ustunol, professor in the Food Science
and Human Nutrition (FSHN) at Michigan State University, for her technical support in the
development of this project. She was a key contributor to my growth, both professionally and
personally. Dr. Ustunol’s advice on research, writing, leadership, time management and the food
industry are highly appreciated.
A special thanks to my committee members Dr. Janice B. Harte and Dr. Wei Li for their
guidance during the development of this project. Janice B. Harte was a key contributor for
sensory analysis and Wei Li was an essential piece in the AAS experiments.
This study was only possible through the support of the FSHN department at MSU.
Microbiological testing was done in Dr. Ryser’s lab. Cheddar cheese manufacturing was
manufactured in the MSU Dairy Plant. Jane Link, staff member in the Animal Science
department, provided important information for AAS methodology.
I would like to extend my gratitude to the student community at MSU. Thanks to
Hamoud Alnughymishi, Thaís Mariz, Thais Gomes, and Raphael Andrade for helping with the
starter culture activity and the preliminary experiments. Marielle Kouassi for working with the
TBA assessment. Thanks to Javier Salas, Tabitha Rose and the sensory lab staff for coordinating
the sensory evaluation. Also, thanks to Fabiola Iñiguez and Marco Lopez for their training in
statistical analysis and presentation skills. Last but not least, thanks to Mariane Silva and Rebeca
Gutiérrez-Moreno for their unconditional support.
You were there for me every step of the way, and I wholeheartedly appreciate everything
you’ve done for me.

v
TABLE OF CONTENTS
LIST OF TABLES…….…………………………………………………………………………vii
LIST OF FIGURES……………………………………………………...……………………….ix
KEY TO ABBREVIATIONS……………………………………………………………………..x
1.0 INTRODUCTION…………………………………………………………………………….1
2.0 HYPOTHESIS AND OBJECTIVES………………………………………………………….6
2.1 HYPOTHESIS………………………………………………………………………...6
2.2 OBJECTIVES…………………………………………………………………………6
3.0 LITERATURE REVIEW……………………………………………………………………..7
3.1 Micronutrient deficiencies………………………………..…………………………...7
3.2 Anemia and iron deficiency anemia…………………………………………………..9
3.3 Iron…………………………………………………………………………………...10
3.4 Food fortification…………………………………………………………………….12
3.5 Iron fortificants……………………………………………...………………….……15
3.6 Microencapsulation: A promising technology……………………………………….18
3.7 Milk and cheese composition………………………………………………………...20
3.7.1 Milk………………………………………………………...…………….20
3.7.2 Cheddar cheese……………...………………………..………………….22
3.8 Iron fortification of dairy products…………………...…………………….………..24
3.9 Divalent cation displacement in cheese………………………...…………….……...28
4.0 MATERIALS & METHODS……...……………………………………….………………..31
4.1 Micro-encapsulated ferrous sulfate salts……………………………………………..31
4.2 Starter culture activity………………………………………………………………..32
4.3 Cheddar cheese manufacturing………………………………………………………33
4.4 Proximate analysis………………...…………………………………………………35
4.5 Atomic absorption spectroscopy…..…………………………………………………35
4.5.1 Stock solutions and standard curves…….…...……………………….……..…35
4.5.2 Determination of mineral balance in Cheddar cheese….……………...………36
4.6 Lipid oxidation assessment………………………………………...……….………..37
4.7 Sensory evaluation…………………………………………………………………...38
4.8 Statistical analysis……………………………………………………………………39
5.0 RESULTS & DISCUSSION…………………...……………………………………….…...40
5.1 Starter culture activity…………………………………………………………...…...40
5.2 Proximate & mineral analysis………………………………………………………..45
5.3 Lipid oxidation assessment.……………………..……………………………...……50
5.4 Sensory evaluation…………………………………………………………………...53

vi
6.0 CONCLUSIONS & RECOMMENDATIONS………………………………………………59
APPENDICES………………………………………..…………...……………………………..61
APPENDIX A: Flyer for recruiting panelists for the sensory evaluation of iron
fortified Cheddar cheese………..…………………………………………..62
APPENDIX B: Sensory questionnaire………………………………………..……………..63
APPENDIX C: Consent form for Research Involving Human Subjects……..……………..66
APPENDIX D: Application for the University Committee on Research Involving
Human Subjects……...……...……………………………………………...68
APPENDIX E: IRB exemption for sensory evaluation…………………………………..…70
APPENDIX F: Standard Plate Counts (SPC) for micro-encapsulated ferrous sulfate
salts………...………………………………………………….……………71
APPENDIX G: Reference Material content using AAS…...…………..……….…………...72
APPENDIX H: Certificate of Analysis for protein content…………………….…………...73
APPENDIX I: LMFS description and details provided by the manufacturer….….….........78
APPENDIX J: SMFS description and details provided by the manufacturer..….……....….80
REFERENCES……………………..……………………………………………………………82

vii
LIST OF TABLES
Table 3.3.1. Recommended Daily Allowance for Iron (mg/day). Adapted from U.S.
Institute of Medicine 2001………...……………………...……………………….……………..11
Table 3.5.1. Iron content, relative bioavailability and relative cost of available iron
compounds for food fortification. Guidelines for on food fortification with micronutrients.
World Health Organization. Adapted from Allen and others 2006………….…………...……...17
Table 3.7.1. Average milk composition in the United States. Adjusted from: Jenkins and
McGuire 2006……………………………………………………………………………………21
Table 3.9.1. Mineral composition (mg or µg) of bovine milk.
Adapted from: Flynn and Power 1985……………….......………………………....………....…30
Table 4.1.1. Ferrous sulfate treatments and fortification dosage………..………………………31
Table 5.2.1. Proximate analysis of Cheddar cheese fortified with micro-encapsulated ferrous
sulfate. LMFS = Large Micro-encapsulated, Ferrous sulfate (0.95 g/kg; 700-1000 µm), SMFS=
Small Micro-encapsulated Ferrous Sulfate (1.78 g/kg; 220-420 µm).………………….…..…...46
Table 5.2.2. Iron lost in the whey (mg/ g whey) and Percent Recovery (%) during the
fortification of Cheddar cheese with micro-encapsulated ferrous sulfate. LMFS = Large Micro-
encapsulated, Ferrous sulfate (0.95 g/kg; 700-1000 µm), SMFS= Small Micro-encapsulated
Ferrous Sulfate (1.78 g/kg; 220-420 µm)……………………………….………………..……...47
Table 5.3.1. Effect of micro-encapsulated ferrous sulfate on lipid oxidation of Cheddar cheese
(expressed as TBARS, mg/kg of malondialdehyde). LMFS = Large Micro-encapsulated, Ferrous
sulfate (0.95 g/kg; 700-1000 µm), SMFS= Small Micro-encapsulated Ferrous Sulfate (1.78 g/kg;
220-420 µm)………………………………………………………...………...……......………...51
Table 5.4.1 Sensory evaluation of Cheddar cheese using a consumer acceptance panel (n = 101).
LMFS = Large Micro-encapsulated ferrous sulfate (0.95 g/kg; 700-1000 µm), SMFS= Small
micro-encapsulated ferrous sulfate (1.78 g/kg; 220-420 µm).………………...…………………54
Table 5.4.2. Summary of comments by the consumer acceptance panel (n = 101) during the
evaluation of Cheddar cheese fortified with micro-encapsulated ferrous sulfate. + = Positive
comments, - = Negative comments, N = neither positive nor negative comments,
neutral............................................................................................................................................56
Table 5.4.3. Texture attributes described by consumer acceptance panel (n = 101) during
sensory evaluation of Cheddar cheese fortified with micro-encapsulate ferrous
sulfate…………………………………………………………………….……………………....57

viii
Table 5.4.4. Flavor attributes described by consumer acceptance panel (n=101) during sensory
evaluation of Cheddar cheese fortified with micro-encapsulate ferrous
sulfate.……………………………………………………………………………...……...…..…58
Table 7.6.1. Microbial counts for LMFS (1 g) and SMFS (1g) plated
on Standard Plate Count (SPC) agar …..…………………………………………………….......71
Table 7.7.1. Calculated mineral content (μg/g) for bovine liver using atomic absorption
spectroscopy. Reference Material 1577b, National Institute of Standards and Technology…….72

ix
LIST OF FIGURES
Figure 3.6.1. Microencapsulation process. Adapted from Dubey and others 2009……………..19
Figure 4.3.1. Cheddar cheese manufacturing at Michigan State University
Dairy Plant.....................................................................................................................................33
Figure 5.1.1. Effect of micro-encapsulated ferrous sulfate on Cheddar cheese starter culture on
microbial counts (CFU/mL) incubated at 32 °C for 6 h. LMFS = Large Micro-encapsulated,
Ferrous sulfate (0.95 g/kg; 700-1000 µm), SMFS= Small Micro-encapsulated Ferrous Sulfate
(1.78 g/kg; 220-420 µm)…………………………………………………….……………….......40
Figure 5.1.2. The effect of micro-encapsulated ferrous sulfate on Cheddar cheese starter culture
pH incubated at 32 °C for 6 h. LMFS = Large Micro-encapsulated, Ferrous sulfate (0.95 g/kg;
700-1000 µm), SMFS= Small Micro-encapsulated Ferrous Sulfate (1.78 g/kg; 220-420
µm)……………………………………………………………………………………….………41
Figure 5.1.3. The effect of micro-encapsulated ferrous sulfate on Cheddar cheese starter culture
Titratable Acidity (TA %) incubated at 32 °C for 6 h. LMFS = Large Micro-encapsulated,
Ferrous sulfate (0.95 g/kg; 700-1000 µm), SMFS= Small Micro-encapsulated Ferrous Sulfate
(1.78 g/kg; 220-420 µm)…………………………………….…………………………………...42
Figure 5.2.1. Mineral content of Cheddar cheese fortified with micro-encapsulated ferrous
sulfate. A= iron, B = calcium, C = Zinc, and D = Magnesium. C = Control, LMFS = Large
Micro-encapsulated, Ferrous sulfate (0.95 g/kg; 700-1000 µm), SMFS= Small Micro-
encapsulated Ferrous Sulfate (1.78 g/kg; 220-420 µm). a,b,c = Means within a column with
different subscript are significantly different (p < 0.05); n = 3……….……………...………….46
Figure 7.1.1 Iron fortified Cheddar cheese sensory evaluation flyer............................................62

x
KEY TO ABBREVIATIONS
µm: micrometer
AAS: Atomic Absorption Spectroscopy
AOAC: Association of Official Analytical Chemists
BHT: Butylated hydroxytoluene
CFU: Colony forming unit
DRI: Dietary Recommended Intake
FDA: Food Drug Administration
Fe: Iron
FeSO4: Ferrous sulfate
g: gram
HTST: High Temperature Short Time pasteurization
IDFA: International Dairy Foods Association
IOM: Institute of Medicine
Kg: kilogram
LAB: Lactic acid bacteria
LMFS: Large Micro-Encapsulated Ferrous Sulfate (700-1000 µm)
MDA: Malondialdehyde
mL: milliliter
MRS: de Man Rogosa Sharpe agar
MSU: Michigan State University
NFDM: Non-fat dry fat milk

xi
pH: power of hydrogen
RDA: Recommended Dietary Allowance
SMFS: Small Micro-Encapsulated Ferrous sulfate (220-422 µm)
SNF: Solids-Non-Fat
SPC: Standard Plate Counts
TA: Titrable Acidity
TBA: Thiobarbituric acid assessment
TCA: Trichloroacetic acid
TEP: 1,1,3,3-tetraethhoxypropane
UCRIHS: University Committee on Research Involving Human Subjects at MSU
UNICEF: United Nations International Children’s Emergency Fund
USDA: United States Department of Agriculture
WHO: World Health Organization
Wt.: Weight

1
1.0 INTRODUCTION
Food is vital for living, proper body functioning and overall health. Micronutrients and
macronutrients are obtained from food and utilized by the body for numerous biochemical
reactions and processes. However, micronutrient intake is commonly overlooked because it is
needed in much smaller quantities than macronutrients. Globally, iron, iodine, folate, vitamin A
and zinc are the most deficient micronutrients in the diet (Bailey and others 2015). The most
susceptible populations for these deficiencies are children and pregnant women (Fulgoni and
others 2011; Keast and others; 2013 Malpeli and others 2013). Iron deficiency is constantly
listed as a worldwide problem, including in the United States, regardless of worldwide awareness
and numerous strategies to fight the issue. The World Health Organization (WHO 2016)
reported that one third of the world’s population, 2 billion people, suffers some level of iron
deficiency.
Iron plays very important roles in the functionality of the hemoglobin protein, part of the red
blood cell, which is responsible for carrying oxygen throughout the body. Each red blood cell
contains approximately 280 million hemoglobin molecules, and each hemoglobin molecule
contains four iron atoms with strong affinity to oxygen (Savada and others 2008). Anemia is the
result of poor red blood cell functionality, and it is usually diagnosed based on hemoglobin levels
in the blood rather than red blood cell counts. Iron content generally reflects the ability of red
blood cells to work efficiently. On average, blood contains 13.5-17.5 g hemoglobin/dL in
healthy individuals (Marthur and others 2011).
Iron deficiency and anemia lead to problems that might persist throughout the life of the
affected individual. Premature births, maternal and fetal death, low immunological competency,
and impair psychomotor development are some of the consequences of consistent iron intake and

2
absorption (Cheravil 2011; Georgiff 2011). Bioavailability of iron in foods depends on many
factors. Iron found in red meats is known to be in a heme structure, or porphyrin ring, which is
higher in bioavailability than non-heme iron sources found in plant-based products (Bothwell
1979). Most enzymes and biochemical processes involved in the absorption and utilization of
iron require iron (Fe +2) in a heme structure due to binding/activation site specificity (Palmer
2014). Recommended iron intake is commonly reported as Recommended Dietary Allowance
(RDA), which is the average daily intake sufficient to meet the nutrient requirements of 97-98%
of healthy individuals. Iron RDA values in the United States range between 7-18 mg/day, with
adults and pregnant women having the highest requirements (Gibson and others 2014).
Vegetarians and women are advised to have double the iron intake compared to the rest of the
population through a variety of foods, supplements and fortified foods.
The two most widely approaches to fighting malnutrition are food fortification and
micronutrient supplementation. Supplementation through pills or capsules, provides large
amounts of a specific nutrient and it is the most immediate solution to increase micronutrient
status (Lindsay and others 2006). Food fortification is defined as the practice of adding
micronutrients to a food in order to improve nutritional quality of the food supply and public
health (Lindsay and others 2006). Also, food fortification is relatively cheap compare to other
strategies and has long-lasting benefits for an entire population (Horton 2008). There is many
successful fortification programs (Martorell and others 2015; Tazhibayey and others 2008) but
many others have failed to increased micronutrient status for a target population (Dos Santos and
others 2015). When fortifying a food, it is important to consider current micronutrient status, the
properties of the food, the target population, intake of the food by the target population,
micronutrient stability and bioavailability, distribution, cost, and many other factors. Despite

3
known problems with food fortification, it is currently the most promising and cost-effective
strategy to reduce malnutrition on a global scale (Fiedler and others 2009).
Iron compounds for fortification, or iron fortificant, can be divided into four groups:
group 1, with the highest bioavailability, are compounds soluble in water; group 2 are poorly
water soluble compounds; group 3 are water-insoluble compounds; and group 4 includes
encapsulated compounds (Allen and others 2006). Iron is considered one of the most
challenging micronutrients to add to foods because as fortificant bioavailability increases its
potential to negatively affect organoleptic attributes increases as well (Linsday and others 2006).
Recently encapsulated iron compounds have received special attention because of their potential
to reduce sensory changes in foods. Microencapsulation can help mask iron distinctive color and
taste. It can also can help increase iron stability by providing a barrier against undesirable
reactions (Dubey and others 2009). For example, microencapsulation has promising applications
in reducing the initiation of lipid oxidation in milkfat. Iron, a pro-oxidant, when added to foods
can produced distinctive oxidation reactions with unsaturated fats leading to the development of
rancid flavors (Frankel 2014).
In the United States, majority of milk is consumed as cheese, ice-cream, yogurt, or other
dairy product. In 2013, per capita consumption of natural cheeses was 33.7 pounds (IDFA
2016). Cheddar cheese consumption alone represents 28.50% of the total cheese consumption in
the United States (IDFA 2016). Milk and cheese are naturally very low in iron. A serving of
Cheddar cheese (28 g) provides 113 kcal, 6.40 grams of protein, 9.33 grams of fat, 199 mg of
calcium, 8 mg of magnesium, and very small amounts of zinc (1.02 mg) and iron (0.04 mg)
(USDA National Nutrient Database for Standard Reference 2016). Fortification of staples foods,

4
such as cheeses in the United States, with iron can increase their nutritional status and potentially
reduce iron deficiency and anemia status.
Zhang and Mahoney (1988, 1990) fortified Cheddar cheese with iron but they didn’t
report any formal sensory evaluation results, and most importantly, some of the selected iron
compounds were not suitable for food fortification due to limited information about their
bioavailability (Allen and others 2006). Rice and McMahon (1998) fortified Mozzarella cheese
with whey-iron complex compounds but negative sensory attributes, including metallic taste and
off-odors, were reported. When looking at bioavailability, encapsulated ferrous sulfate showed
better results in terms of bioavailability when compared to non-encapsulated iron compounds but
no information was provided about acceptance of the product or its sensory characteristics
(Boccio and others 1997). Besides bioavailability, it is important to consider particle size when
fortifying foods. Wegmuller and others (2004) found that reducing particle size of micro-
encapsulated ferric pyrophosphate, from 21 µm to 0.5 µm, increased bioavailability by 50%,
leading to questions about the ideal particle size for absorption (Motzok and others 1975). More
research is necessary to assess appropriate particle size standards in food fortification, especially
when working with micro-encapsulated compounds.
Divalent cation minerals can displace one another in many biochemical systems and
reactions, mainly because of their similar charge (+2) (Vasudevan and others 2002). Gonzasles-
Martin and others (2009) found that mineral profile in cheese played a key role in ripening time
and cheese yield. Also, some minerals are known to play important roles in cheese-making,
such as, coagulation process, whey draining, and curd texture (Patiño and others 2005).
Furthermore, in Cheddar cheese successfully fortified with zinc sulfate (Kahraman and Ustunol
2012) authors suggested a possible zinc-calcium displacement at the casein micelle level. The

5
major milk proteins, caseins, have strong affinity to divalent cations. Binding affinity depends on
different factors including pH, ionic strength, temperature and phosphate group content (On-
Nom and others 2010). The goal of fortification is to increase nutritional content in a food and
the addition of iron should not comprise other nutrients. It is expected that fortified foods should
have a similar nutrient content as non-fortified foods (except for the added mineral). If there is
any mineral displacement in cheese, the displaced divalent cation mineral (calcium, magnesium
or zinc; nutritionally important and present in significant amounts in cheese) will be lost during
the whey-draining and cheese-pressing steps. Currently, there is limited literature available on
divalent cation balance disturbances when fortifying cheese.

6
2.0 HYPOTHESIS & OBJECTIVES
2.1 HYPOTHESIS
Ferrous sulfate was selected for the fortification of Cheddar cheese because of its high
iron bioavailability. Furthermore, only micro-encapsulated salts, with two different sizes, were
chosen because of the potential for fewer organoleptic and compositional changes compared to
non-microencapsulated iron salts.
This study hypothesizes that fortification of Cheddar cheese with micro-encapsulated
ferrous sulfate will increase iron content with no major compositional changes after 90-day
aging. The addition of iron (Fe+2) to Cheddar cheese will produce some divalent cation balance
disturbances in the matrix due to iron replacing calcium, or any other divalent cation mineral, in
the casein micelle. Additionally, it is expected that reducing the size of micro-encapsulated
ferrous sulfate will affect iron retention and sensory attributes.
2.2 OBJECTIVES
1. To successfully develop a strategy to fortified Cheddar cheese with micro-
encapsulated ferrous sulfate.
2. To evaluate the effect of micro-encapsulated ferrous sulfate on Cheddar cheese
quality.
3. To assess composition, lipid oxidation and sensory differences when fortifying
Cheddar cheese using iron fortificants with different particle size.
4. To evaluate divalent cation balance disturbances when fortifying Cheddar cheese
with iron.

7
3.0 LITERATURE REVIEW
3.1 Micronutrient deficiencies
Humans obtain macronutrients and micronutrients from a variety of food sources but it is
known that nutritional requirements for each individual depend on many factors including age,
sex, geographical location, ethnicity, weight, height, and environment (Black 2014). The human
body needs large amounts of macronutrients for energy and uses micronutrients (in smaller
quantities) to enable biochemical reactions essential for body functioning (UNICEF 2016). A
diet consisting of a variety of nutrient-dense foods is necessary to maintain a healthy status but
usually micronutrient intake is overlooked because they are needed in much smaller quantities
than macronutrients. Globally, iron, iodine, folate, vitamin A and zinc deficiencies are the most
common problems, which lead to poor growth, intellectual impairment, and an increased risk of
disease and death (Bailey and others 2015).
The populations most vulnerable to malnutrition are pregnant women and their children,
especially in developing countries. Studies assessing micronutrient deficiencies in India (Pathak
and others 2004), Nepal (Jiang and others 2005), Southeast Asia (Seshadri 2001), and Argentina
(Malpeli and others 2013) reported high numbers for iron, iodine, folate, vitamin A and zinc
deficiencies among pregnant women, with zinc and iron deficiencies receiving special attention
due to their high prevalence (40-50% of the pregnant women surveyed). Pregnant women are
vulnerable to malnutrition because their nutritional requirements increase in order to compensate
for fetal growth and other metabolism changes (Tennant 2014). The American Institute of
Medicine (IOM 2002) recommends no energy increase for the first trimester, a daily increase of
340 Kcal/day during the second trimester, and a 450 kcal/day increase during the third trimester.
Nutrient deficiencies during pregnancy can bring short- and long-term consequences to both the

8
mother and fetus. Folic acid deficiency is known to be associated with neural tube defects, iodine
is essential for thyroid hormones, zinc is heavily involved in cellular metabolism and immune
system responses, vitamin A deficiency can affect immunity and vision, and iron is essential for
red blood cell integrity and functionality (Bailey and others 2015).
Globally, the prevalence of micronutrient deficiencies in children is also a serious
concern. Won and others (2014) reported that malnutrition is a current problem in China and that
zinc deficiency is more prevalent in children (< 18 y old) than rest of the population. A survey
done in Bhubaneswar, India, showed that average calcium intake in children (1-3 y old) was 288
mg/d compared to the ideal 1000 mg/d; this deficiency causes bone deformities and diarrhea, and
exacerbates skin infections (Karl and others 2014). According to the WHO (de Benoist and
others 2008), about 2 billion people around the world are iodine deficient, one third of them
being children; Europe, South East Asia and Sub-Saharan countries are the regions with the
highest iodine deficiency prevalence (approximately 50% prevalence). Adequate nutrient intake
is very important for child development. For example, iodine deficiency can impair growth and
cognitive and motor function (Zimmermann 2009). Any micronutrient deficiency can have fatal
consequences for individuals in any stage of life. Recent research had focused on iron and zinc
status.
Micronutrient deficiencies are usually associated with developing countries but
malnutrition is also a concern in developed countries. Iodine deficiencies are common in
England, where there is 52% iodine deficiency prevalence (de Benoist 2008). Fulgoni and others
(2011) conducted a national assessment of the intake of 19 micronutrients in the United States
and reported that vitamin B, folate, zinc, thiamin, riboflavin, niacin, vitamin B12, phosphorus,
copper, iron and selenium deficiencies were present in 6-8% of the population. Also, Fulgoni

9
and others (2011) reported that Americans suffer more severe deficiencies in calcium,
magnesium, and vitamins A, C, D and E regardless of current fortification, supplementation, and
dietary recommendations, probably because their diet is low in whole grains, fruits, vegetables,
lean meats and milk. Keast and others (2013) conducted a national survey assessing food
sources and nutrients in the United States showing that foods consumed by children are energy-
dense but nutrient-poor. Another explanation for the current micronutrient deficiencies in the
United States is poverty, which is associated with low access to food, housing and health care
(Bailey and others 2015). As a matter of fact, malnutrition is part of a vicious cycle in which
malnutrition, poverty and disease co-exist resulting in poor food quality, inadequate food intake
and the spread of disease (WHO 2015).
3.2 Anemia and iron deficiency anemia
Anemia is a condition where there are not enough healthy red blood cells to adequately
carry oxygen to the tissues. On average, the blood of healthy men and women contains 4.7-6.1
cells/µL and 4.2-5.4 cells/µL, respectively (Marthur and others 2011). Anemia can be the result
of vitamin deficiencies, some chronic diseases, sickle cell anemia and other factors, but the
number one cause for anemia is iron deficiency (Camaschella 2015). Therefore, iron deficiency
anemia is defined as the result of consistent inadequate dietary iron consumption causing very
low levels of red blood cells (Brody 2011). According to the World Health Organization, one
third of the world’s population, 2 billion people, suffers some level of iron deficiency (WHO
2015b). Iron deficiency is more prevalent in infants and young children in Southeast Asia and
Africa, but also present in the United States (Fulgoni and others 2011).

10
In Ghana, Ewusie and others (2014) reported that 78.4% of children (< 5 y old) were
anemic and that 7.8% were severely anemic due to iron deficiency. Won and others (2014)
showed that iron deficiency in China is more prevalent in children (< 18 y old) when compared
to the rest of the population, leading to severe negative consequences in cognitive development
that might persist throughout the life of the individual. Other short- and long-term consequences
of iron deficiency include premature births, maternal and fetal death, low immunological
competency, and impair psychomotor development in children and adults (Cheravil 2011;
Georgiff 2011). In addition, the WHO stated that iron deficiency and anemia are contributors to
the poverty cycle in developing countries because both conditions reduce work capacity, which
has serious economic consequences (WHO 2016).
3.3 Iron
Iron is an essential mineral because it plays important roles in many biochemical
processes. Iron is a key component of the hemoglobin protein, part of the red blood cell, which is
responsible for carrying oxygen throughout the body. Each red blood cell contains
approximately 280 million hemoglobin molecules, and each molecule contains four iron atoms,
which have strong affinity to oxygen. Consequently, hemoglobin can transport up to four
oxygen molecules (Savada and others 2008). Anemia is usually diagnosed based on
hemoglobin levels in the blood rather than red blood cell counts. On average, blood contains
13.5-17.5 g hemoglobin/dL in healthy individuals (Marthur and others 2011). Hemoglobin
levels reflect the ability of red blood cells to carry oxygen, while, red blood cell counts do not
indicate the number of red blood cells that can function correctly. Iron is stored in the liver as
hemosiderin and ferritin, and is transported when needed by transferrin (Wang and others 2009);

11
levels of hemoglobin, transferrin saturation, serum ferritin, transferrin receptors, total iron
binding capacity and erythrocyte protoporphyrin are usually used as biomarkers to assess iron
status and anemia (Thompson 2011).
Table 3.3.1. Recommended Daily Allowance for Iron (mg/day). Adapted from U.S. Institute
of Medicine 2001. Age Male Female Pregnancy Lactation
7–12 months 11 11 N/A N/A
1–3 years 7 7 N/A N/A
4–8 years 10 10 N/A N/A
9–13 years 8 8 N/A N/A
14–18 years 11 15 27 10
19–50 years 8 18 27 9
51+ years 8 8 N/A N/A
Iron is naturally found in a variety of foods. Red meats and animal-derived products
contain iron in a heme structure. This iron is more bioavailable to the body than non-heme iron
present in nuts, vegetables, and beans (Bothwell 1979). Most enzymes and biochemical
processes involved in the absorption and utilization of iron have binding/activation sites that
require iron (Fe +2) in a porphyrin ring structure, commonly found in animal tissues (Palmer
2014). Consequently, iron bioavailability depends on the heme structure, food composition, and
physiologic and metabolic necessities of each individual (Whittaker and others 2001). The
Dietary Reference Intake (DRI) for iron is age-, sex-, and population-specific. Recommended
iron intake is commonly reported as Recommended Dietary Allowance (RDA), which is the
average daily intake sufficient to meet the nutrient requirements of 97-98% of healthy
individuals. Iron RDA values are between 7-18 mg/day, with adult and pregnant women having

12
the highest requirement (Table 3.3.1). Vegetarians are another important population to consider
with respect to RDA values because they obtain iron from non-heme sources; children and adults
following a vegetarian diet usually have lower serum ferritin (iron stores) levels compared to
meat eaters (Gibson and others 2014). Vegetarians and women are advised to have double the
iron intake compared to the rest of the population through a variety of foods, supplements and
fortified foods.
3.4 Food fortification
Solutions to micronutrient deficiencies include: monitoring of micronutrient intake of
single individuals, increasing food accessibility, nutrition education programs, diet supplements,
bio-fortification (the process of increasing nutritional status of food crops through agronomic
practices, conventional plant breeding, or modern biotechnology), and food fortification, each of
which has specific advantages and disadvantages. The two most widely used approaches to
fighting malnutrition are food fortification and food supplementation. Food fortification is
defined as the practice of adding micronutrients to a food in order to improve nutritional quality
of the food supply and public health; it provides a strategy for preventing deficiencies by slowly
increasing micronutrient status at population level. On the other hand, food supplementation,
through pills or capsules, provides large amounts of a specific nutrient and it is the most
immediate solution to increase micronutrient status (Allen and others 2006). Food fortification is
considered the most appropriate solution at a large scale because it is relatively cheap and has
long-lasting benefits for a population (Horton 2008). The goal of fortification is to improve food
quality. Consequently, it has the potential to reduce current micronutrient deficiencies and
prevent future problems. In other words, food fortification tries to completely eradicate
micronutrient deficiencies in a population.

13
Developing countries have a long history of using fortification to fight vitamin A, iodine,
iron, and riboflavin deficiencies. Iron has been used to fortify wheat and corn flours in different
countries leading to a decrease in the prevalence of anemia. For example, after the mandatory
fortification of cereal flours in Costa Rica, anemia and iron deficiency prevalence in children
decreased significantly, showing the success of fortification programs (Martorell and others
2015). Also, iodine and iron status of children and pregnant women increased significantly after
the implementation of food fortification programs in Azerbaijan, Kazakhstan, Kyrgyzstan,
Mongolia, Tajikistan, and Uzbekistan (Tazhibayey and others 2008). In the United States, table
salt started to be fortified with iodine during the 1920s, vitamin D was added to fluid milk in the
1930s, vitamin A was added to milk in the 1940s, and cereal flours were fortified with vitamin B
and iron by the 1950s. Table salt was recommended for iodine fortification by Michigan State
Medical Society (1937) in response to the alarming goiter number cases in the Midwest at the
beginning of the twentieth century. Milk was selected for Vitamin D fortification because it was
considered a perfect vehicle to deliver Vitamin D and reduce rickets cases (Hess 1932). The
medical community played important roles in promoting and advertising the fortification of salt
and milk (Weart 1938). Vitamin A was added to milk for other reasons, during milk
standardization some vitamin A, fat soluble, is loss in low-fat dairy products. In order to
compensate the loss of vitamin A during milk processing vitamin A is added (Dairy Practices
Council 1993), iron and vitamin B were added to flours based on the same concept. After the
removal of the bran and germ (milling process) in wheat kernels, a large portion of vitamins B
and iron are lost and in order to compensate the decrease in nutritional value during milling
(Dewettinck and others 2008) the micronutrients are added back as fortificants.

14
Overall, implementation of American food fortification programs resulted in significant
nutrition improvement (Bishai 2002). Recently, a variety of different micronutrients have been
added to a range of different foods in order to meet for the constant demand for more “healthier”
and nutritious foods. The addition of calcium, since the 1980s, to juices has been voluntary
(Allen and others 2006), more for marketing than nutritional purposes. Mandatory fortification
is implemented by the government and specifies the micronutrients and the foods to be fortified.
On the other hand, voluntary fortification is encouraged by government but there is no legal
obligation. Voluntary fortification must provide potential benefits to consumers and must be
approved by the government (Allen and others 2006). Mandatory and voluntary guidelines, and
recommendations for food fortification differ among countries and are based on current
deficiencies and potential benefits (Allen and others 2006). In the U.S., the Food Drug
Administration mandates that flours should be fortified with iron, folic acid, niacin, riboflavin
and thiamin (FDA 2016d). Also, it has specific guidelines for the addition of folic acid and
thiamin to rice, iodine to commercial table salt and Vitamin D and/or Vitamin A to fluid milk
(FDA 2016a). Other products such as iron in infant formula follow mandatory fortification
regulation and are added to foods in order to target a specific group at risk (infants in this
example).
Food fortification is not a suitable solution for all populations and many factors need to
be considered before it is implemented in a given country. Dos Santos and others (2015)
reported that current mandatory iron fortification of wheat and corn flours failed to meet iron
daily recommended iron intake because the amount of flour consumed by the general population
was not enough to provide a significant iron source; consequently, fortification failed to decrease
anemia prevalence in Brazil. In Africa, fortification programs failed because they did not reach

15
the most susceptible populations. Communities with highest micronutrient deficiencies in
Malawi, Senegal, and Tanzania are located in rural areas where foods are obtained from local
farms and people often do not have access to commercially fortified foods (Mildon and others
2015). In addition, the success of any food fortification program depends on economic
development of a country since it requires modern food-processing facilities, distribution
infrastructure, regulatory support, and a monitoring system (Bishai 2002). When fortifying a
food, it is important to consider current micronutrient status, the properties of the food, the target
population, intake of the food by the target population, micronutrient stability and
bioavailability, distribution, cost, and many other factors. Despite known problems with food
fortification, it is currently the most promising and cost-effective strategy to reduce malnutrition
on a global scale (Fiedler and others 2009). In a cost-benefit analysis done by the WHO (Allen
and others 2006), iodine, vitamin A, and iron fortification had significant high benefits based on
the prevalence of micronutrient deficiencies and economic situations of many low-income
countries. In the same report it was concluded that fortification becomes increasingly cost-
effective as increasing number of micronutrient deficient individuals are reached (Allen and
others 2006).
3.5 Iron fortificants
A variety of compounds can be used for iron fortification. Currently, the WHO
recommends at least 20 compounds for fortification. Each iron compound has unique
characteristics; iron content, bioavailability, cost and chemical interactions with a food are
specific for each compound. Iron fortificants can be divided into four groups: group 1, with the
highest bioavailability, are compounds soluble in water such as ferrous sulfate, ferrous

16
gluconate, and ferrous lactate; group 2 are poorly water soluble compounds such as ferrous
fumarate, and ferrous succinate; group 3 are water-insoluble compounds such as ferric
orthophosphate, ferric pyrophosphate, and elemental iron; and group 4 includes encapsulated
compounds such as ferrous sulfate and fumarate (Allen and others 2006). When formulating an
iron fortified-food, the selection of fortificant will depend on bioavailability, food matrix
compatibility, possible sensory changes, and food processing steps. Indeed, iron is considered
one of the most challenging micronutrients to add to foods because as fortificant bioavailability
increases its potential to negatively affect organoleptic attributes increases as well (Linsday and
others 2006). Water soluble iron compounds are the most likely to produce rancid flavors,
degrade other nutrients, and cause color and flavor changes. Water soluble compounds are
commonly used in flours and cereals, ferrous sulfate being the most popular because it is
inexpensive. Group 2 compounds have moderate bioavailability. Group 3 compounds are the
least desired iron forms for fortification but are still used in the food industry because of their
low price and low impact on sensory attributes. Further details on bioavailability, solubility and
cost of iron compounds are shown in Table 3.5.1.
The data collected on the efficacy of iron compounds in decreasing anemia prevalence
around the world are often in disagreement. It is usually assumed that highly bioavailable
compounds are potentially most successful in improving iron status. Dos Santos (2015) reported
that the wheat fortification program in Brazil failed to increase iron status for the general
population because of the use of elemental iron, a water insoluble compound with low
bioavailability. Successful iron fortification initiatives, such as the one in Costa Rica, have
shifted from the use of elemental iron to ferrous bisglycinate, a water soluble compound
(Martorell and others 2015). In Venezuela, ferrous fumarate, a poorly water soluble compound,

17
used in the fortification of wheat and corn flours has successfully decreased anemia prevalence
(Layrisse 2002).
Table 3.5.1. Iron content, relative bioavailability and relative cost of available iron compounds
for food fortification. Guidelines for on food fortification with micronutrients. World Health
Organization. Adapted from Allen and others 2006.
Compound
Iron content
(weight %) Relative
bioavailability a
Relative cost b (per gm)
Water Soluble
Ferrous Sulfate 33 100 1.0
Ferrous gluconate 12 89 6.7
Ferrous lactate 19 67 7.5
Ferrous bisglycinate 20 100 17.6
Ferric ammonium citrate 17 51 4.4
Sodium iron EDTA 13 100 16.7
Poorly water soluble
Ferrous fumarate 33 100 2.2
Ferrous succinate 33 92 9.7
Ferric saccharate 10 74 8.1
Water insoluble
Ferric orthophosphate 29 25-32 4.0
Ferric pyrophosphate 25 21-74 4.7
Elemental iron, Hydrogen reduced 96 13-148 0.5
Elemental iron, carbon monoxide reduced 97 12-24 1.0
Elemental iron, electrolytic 97 75 0.8
Encapsulated forms
Ferrous sulfate 16 100 10.8
Ferrous fumarate 16 100 17.4 a Relative to ferrous sulfate, in either human or rat studies. b Relative to ferrous sulfate.

18
3.6 Microencapsulation: A promising technology
Almost all available iron fortificants have distinct colors and taste that might make food
unacceptable. In South Asian countries, numerous attempts to fortify rice failed because of
consumer rejection due to intense yellow color formation, off-flavors and unusual chewiness
when adding iron (Prom-u-thai and others 2009). Negative organoleptic changes in iron fortified
products are caused by redox potential of iron, which can promote lipid oxidation reactions.
Transition metals, such as iron, have the ability to be oxidized or reduced when in contact with
oxygen, resulting in the formation of a free radical; free radical compounds are highly unstable
and are known to cause the degradation of lipids, vitamins, flavors, and pigments. Usually, the
degradation of food components results in the formation of epoxides, ketones, aldehydes, and
alcohol groups, which are associated with rancid and off-flavors in oxidized foods. Foods high
in unsaturated fats are susceptible to lipid oxidation because they contain electron-rich double
bonds that will easily react with electron-poor free radicals (Frankel 2014).
Recently encapsulated iron compounds have received special attention because of their
potential to reduce sensory changes in foods. Encapsulation is the process of coating a target
particle with a membrane for specific purposes. Microencapsulation refers to encapsulates
ranging in size from 1 µm to 2 µm diameter. The most widely used coating materials are
polymers such as ethyl cellulose, polyvinyl, gelatin, and sodium alginate. Freeze- and spray-
drying technologies are commonly used to produce microencapsulates at a commercial level;
spray-drying consists in the conversion of a liquid into a powder using a stream of heated air,
while, freeze-drying consists in the conversion of liquid to a powder by sublimation using a
vacuum system. In both methods, the active compound is suspended or dissolved in a polymer
solution, and when “drying” techniques are applied active compounds will become trapped
(Figure 3.6.1) (Dubey and others 2009).

19
In foods, microencapsulation is done to increase stability and to protect the active
material from undesirable reactions with environmental conditions or food components. Usually
aroma and flavor compounds, probiotics or micronutrients are isolated from their surroundings
during microencapsulation in order to reduce chemical degradation (Dubey and others 2009).
Microencapsulation of fish oils and spice extracts with maltodextrin and gum Arabic using spray
drying significantly improved aroma and lipid stability (Edris and others 2016). Micro-
encapsulation of crude palm oil with cassava starch improved oxidative parameters and color,
also, total carotenoids and peroxide values significantly improved with micro-encapsulation
(Ferreirra and others 2016). Also, soy protein has been used to micro-encapsulate Vitamin A
and Vitamin E, which are susceptible to lipid oxidation. The soy capsule significantly reduced
oxygen interactions and reactivity (Nesterenko and others 2013). Microencapsulated probiotic
bacteria showed increased cell viability in a simulated gastrointestinal system (Dolly and others
2011). In Spain, orange juice fortified with iron pyrosphosphate coated with lecithin improved
iron status in menstruating women showing the potential usefulness of this technology for
fighting anemia (Blanco-Rojo and others 2011). This technology could be used for fortifying
many “healthy” products such as polyunsaturated fats, micronutrients and probiotics.
Spray-drying
Figure 3.6.1. Microencapsulation process. Adapted from Dubey and others 2009.
Coating (Shell)
Active material

20
3.7 Milk and cheese composition
3.7.1 Milk
Milk is an important source of calories, micronutrients and macronutrients. Fluid milk in
the United States is defined as the lacteal secretion obtained from cows. By law, commercial
milk should be pasteurized or ultra-pasteurized and shall contain no less than 8.25% Milk-Solids-
Non-Fat (MSNF) and no less than 3.25% milkfat. Vitamin A and Vitamin D addition is
optional, and other ingredients such as carriers for vitamins, emulsifiers, flavoring compounds,
and stabilizers can be added as well (FDA 2016a). Other countries may include goat, camel,
sheep and buffalo milk. The composition of milk varies depending on species, breed, nutrition,
environmental factors, and stage of lactation. The most common breeds used in milk farming in
the U.S. are Holstein and Jersey. On average, the composition of milk in the United States is
88.32% water, 4.52% carbohydrates, 3.25% fat, 3.3% protein and 0.69% ash (Table 3.7.1)
(Jenkins and McGuire 2006). The main carbohydrate in dairy products is lactose. Casein, 80%,
(α-s1, α-s2-, ß-, and k-caseins) and whey, 20%, (ß-lactoglobulin, α-lactalbumin, bovine serum
albumin and immunoglobins) proteins are the most abundant proteins in milk (Farkye and
Nagendra 2015). Ash is composed of calcium, magnesium and other trace minerals. Milkfat is
composed mostly of saturated fats (64.9%) and small amounts of monosaturated (28.3%) and
polyunsaturated fats (6.8%) (Jenkins and McGuire 2006).
The standard of identity for milk mainly addresses adulteration, pasteurization, milkfat
and MSNF requirements (FDA 2016a). Standardization is commonly used in milk to achieve
uniformity nationally and to meet the legal requirements. Milk standardization is commonly
used to meet the standard of identity, in this process, milk is fractionated into skim milk (0.5%
milkfat) and cream using centrifugal separation. Then, the fractions are mixed together again,

21
adjusting milkfat to 3.25% (or any other milkfat target) and MSNF to 8.25% (Walstra and others
1999).
Table 3.7.1. Average milk composition in the United States. Adjusted from: Jenkins and
McGuire 2006.
Component Weight Percent, %
Water 88.32
Protein 3.22
Ash 0.69
Carbohydrate 4.52
Fat 3.25
Extensive research has been done in milk proteins for many years. Casein micelles,
spherically shaped structures, are the consequence of strong association of casein molecues with
itself and with each other. Casein micelles range from 50 to 500 nm in diameter (Fox and
Brodkorb 2008). Models have been described trying to explain the properties and structure of
casein micelles but as of today there is no full understanding of their structure. Farkye and
Nagendra (2015) reviewed numerous accepted models such as submicelle, dual bonding, and
interlocked lattice models. Each model has unique properties but in all proposed models the
interior of the molecule is very hydrophobic with calcium-sensitive caseins located in the interior
as well. The surface of the casein structure is more polar than the interior and has the potential to
form colloidal calcium phosphates and hydrogen bonds with other casein subunits (Horne and
Banks 2004). Interactions between calcium, casein, and colloidal calcium phosphate bridges are
crucial for the structure of casein micelles. Whey proteins are defined as the proteins remaining
in solution after the precipitation of casein when milk is subjected to pH 4.6 and 30oC. By

22
nature, whey proteins contain higher levels of leucine and cysteine compared to casein, and are
considered very important for skeletal and muscle development (Farkye and Nagendra 2015).
Calcium is naturally present in milk (314 mg/cup) and is very important for casein
micelle structure. According to the National Nutrient Database for Standard Reference (USDA
2016), other minerals present in milk are iron (0.12 mg/cup), magnesium (34 mg/cup),
phosphorus (245 mg/cup), potassium (397 mg/cup), sodium (127 mg/cup), and zinc (0.98
mg/cup). Milk is a nutrient-rich food but naturally low in important nutrients such as iron and
zinc that are important for children, women and immune compromised individuals. In the United
States the average daily intake of fluid milk is close to ¾ cup, but children 2-11 years old
consume twice (1 ¼ cups) as much milk as adults (Sebastian and others 2010). The estimated
U.S. per capita consumption of fluid milk in 2014 was 159 pounds (USDA Economic Research
Service 2016). The USDA, other nutritional organizations, and even the National Lunch School
Program in the U.S. strongly encourage the consumption of dairy products due to many scientific
studies proving numerous health benefits related to milk consumption. A total of 3 cups/ day of
dairy products is recommended. It is known that dairy consumers intake is as much as 180%
Vitamin D, 58% Vitamin A, 49% calcium, and 5% more protein than to non-dairy consumers
(Sebastian and others 2010). In conclusion, dairy products are considered an important staple in
the American diet and are necessary to meet current dietary recommendations (U.S. Department
of Health and Human Services 2010).
3.7.2 Cheddar cheese
In the United States, and around the world, most of the milk is not consumed as fluid
milk but as cheese, ice-cream, yogurt, or other dairy product. The estimated U.S. per capita

23
consumption of all dairy products in 2014 was 614 pounds (USDA Economic Research Service
2016). Globally, the United States is the number 1 cheese producer; in 2013, the U.S. produced
11.1 billion pounds of cheese (IDFA 2016). Mozzarella (3.7 billion lbs. annual production) and
Cheddar cheese (3.19 billion lbs. annual production) are produced and consumed in the greatest
quantity in the United States. In 2013, per capita consumption of natural cheeses was 33.7
pounds (IDFA 2016). In the U.S., Cheddar cheese consumption alone represented 28.50% of the
total cheese consumption. Italian cheeses, including Mozzarella, accounted for 41.80% of the
total cheese consumption (IDFA 2016).
Mozzarella is a popular cheese around the world and is commonly used for the
preparation of different Italian dishes, including pizza. Mozzarella is traditionally manufactured
using Italian buffalo milk. In the U.S., Mozzarella is a white, high-moisture, and mild-flavored
cheese produced from cow milk (FDA 2016b). The cheese has good stretching properties after
melting, which make it perfect for pizzas and related products. Cheddar cheese is an American
style cheese, generally yellow or orange in appearance with mild to strong flavor profile and
semi-solid texture. For many years it was considered the most popular cheese in the U.S., but
was recently defeated by Mozzarella (IDFA 2016). The main ingredients in Cheddar are milk,
culture, rennet, annatto, and salt. The most commonly bacterial strains used in Cheddar cheese
are mesophilic and lactic acid producing bacteria, typically Lactococcus lactis subsp. lactis and
Lactococcus lactis subsp. cremoris (FDA 2016c). Starter culture, processing steps, and aging are
the main contributors in cheese flavor.
Cheddar cheese manufacturing follows similar processing steps as any other cheese
(pasteurization, addition of culture, rennet addition, cutting and curd cooking, whey draining,
milling, salting, hooping, pressing, and aging), but with the addition of a “Cheddaring step”. The

24
Cheddaring step is typically added after whey draining and before milling. During this step the
curd is cut into blocks and flipped every 15 minutes until the target acidity is reached (0.62%
Titrable Acidity) (Walstra and others 1999). Starter culture, processing steps and aging are key
for the development of texture and flavors in Cheddar cheese. A serving of Cheddar cheese (28
g) provides 113 kcal, 6.40 grams of protein, 9.33 grams of fat, 199 mg of calcium, 8 mg of
magnesium, and very small amounts of zinc (1.02 mg) and iron (0.04 mg) (USDA National
Nutrient Database for Standard Reference 2016). Milk is very low in zinc and iron,
consequently, cheeses are also very low in these two important minerals. Fortification of cheeses
with important nutrients, like iron and zinc, can increase their nutritional status and potentially
reduce some micronutrient deficiencies since dairy products are considered an important staple
food in the United States.
3.8 Iron fortification of dairy products
Approaches for fortifying dairy products in the past had been unsuccessful for a variety
reasons; currently, there is limited information regarding this topic in the scientific community.
Zhang and Mahoney are considered two of the pioneers in iron fortification of dairy products.
Zhang and Mahoney (1989) fortified Cheddar cheese with iron; iron salts were added to the
cheese-milk during the early steps of the manufacturing process. In their study, ferric citrate,
ferric chloride, casein-ferric chloride protein complex, and whey-ferripyrophosphate protein
complex were selected as the iron fortificants. Overall, ferric chloride and iron-protein complex
sources had better percent recoveries but negative reported to enhance lipid oxidation reactions.
An acceptance sensory panel, seven scientists familiar with the study, described the samples as
having strong oxidized- and off-flavors. The same problem was reported by an acceptance

25
sensory panel, ten scientists familiar with the study, in the fortification of milk with ferric
chloride and ferric citrate (Kurts 1973; Edmondon 1971). The iron-protein complex sources
were designed to provide high bioavailability and a fortification vehicle compatible with the
cheese matrix (Carmichael and others 1975; Zhang and Mahoney 1989). The process of making
iron-protein complex salts were developed by Zhang and Mahoney (1988) and Jones and others
(1972).
Zhang and Mahoney (1990) repeated their previous fortification approach in Cheddar
cheese but added whey-ferric chloride salt to their list of tested iron salts. The authors performed
a sensory evaluation using consumer acceptance testing (n=10) for the fortified products using a
trained panel (food scientists and nutritionists) and Quantitative Descriptive Analysis (QDA).
Oxidized- and off-flavors were induced by fortifying Cheddar cheese with ferrous sulfate (5 mo.
aged). Iron-whey complexes had the most acceptable results for sensory perception and lipid
oxidation assessment showing the potential success of these compounds in cheese fortification.
In addition, Reddy and Mahoney (1992) investigated the effect protein-iron complex salts on
coagulation enzymes during cheese-making, but found no inhibition or negative effects on
cheese clotting time or textural properties. It is important to note that adding ferric chloride is
not an approved method for fortifying foods. In addition, previously investigated iron salts are
considered very low in bioavailability (Allen and others 2006). Cheddar cheese research
contributed to a better understanding of cheese and iron fortification, but the results offered no
real solution to iron deficiency.
Rice and McMahon (1998) fortified Mozzarella cheese using ferric chloride, and whey-
iron and casein-iron salts; this was the first time that iron-protein complex salts were called
“Protein-chelated iron”. Chelating agents are commonly used to protect molecules by forming

26
stable complexes, which will prevent interactions between the target molecule and the
surroundings. Fortification of Mozarella (50 mg Fe/kg of cheese) did not affect viscosity, color,
and lipid oxidation values. Cheeses were evaluated by trained panelists for the presence of
metallic flavors, oxidized flavors, and other undesirable flavors, all samples had strong metallic
and off-flavors resulting in low consumer acceptability (Rice and McMahon 1998). In summary,
ferric chloride and iron-protein compounds showed some positive results in Cheddar cheese but
not in Mozzarella, demonstrating that iron fortification research cannot be transfer to all types of
cheeses.
Micro-encapsulation technology has been introduced as an alternative tool to traditional
fortification methods for dairy foods. Ferrous sulfate coated with lecithin, showed similar
bioavailability as non-encapsulated ferrous sulfate (highest bioavailable iron compound) but
great potential in reducing sensory and lipid oxidation changes. In terms of bioavailability,
micro-encapsulated ferrous sulfate was observed to follow similar absorption mechanisms as
non-encapsulated ferrous sulfate (Boccio and others 1997). The proposed microencapsulate was
added to fluid milk and administered to children suffering some level of iron deficiency. After
120 days, encapsulated ferrous sulfate significantly increased hemoglobin, plasma iron and
ferritin levels in the children (Boccio and others 1997). No information was provided about
acceptance of the product or its sensory characteristics.
Other dairy products, such as yogurt, have been fortified with ferrous bisglycinate,
ferrous lactate, and micro-encapsulated ferrous sulfate (Nkhata 2013). Non-encapsulated iron
salts produced noticeable and undesirable color changes in natural yogurt. Micro-encapsulated
ferrous sulfate did not cause major color changes and had similar sensory scores as unfortified
yogurt. Askary and Bolandi (2013) fortified yogurt with ferric chloride, and ferric chloride-

27
protein complexes and showed that the three salts were suitable for fortification based on their
sensory evaluation.
As previously stated, Zhang and Mahoney (1988, 1989) demonstrated that ferric chloride
and their protein-chelated had some potential in not producing major sensory changes in Cheddar
cheese but the use of ferric chloride in foods was not approved by any nutritional organization.
Also, iron fortified Cheddar cheese lacked a more complete sensory evaluation analysis since
Zhang and Mahoney only assessed acceptability differences using a small sensory panel (<10)
composed of either food scientists or nutritionists. There is limited information about the
bioavailability and absorption of ferric chloride compounds, other more suitable compounds for
fortification are recommended by nutritional experts. Ferrous sulfate and other water soluble
iron compounds are recommended in food fortification but avoided because their negative
impact on sensory attributes. Fortification using iron water soluble compounds is possible
through micro-encapsulation but there is limited information on this emerging technology. For
example, Wegmuller and others (2004) found that reducing particle size of micro-encapsulated
ferricpyrophosphate, from 21 µm to 0.5 µm, increased bioavailability and absorption, leading to
questions about the ideal particle size for fighting iron deficiency. Similar results were observed
in non-encapsulated iron salts, and iron absorption of compounds with low bioavailability were
similar that of ferrous sulfate when particle size was decreased by 50% (Motzok and others
1975). More research is necessary to assess appropriate particle size standards in food
fortification, especially when working with micro-encapsulated salts. Micro-encapsulation is the
new approach to fortified foods, but this technology is opening the door to many questions and
variables that need to be addressed before implementing it in any food fortification program.

28
3.9 Divalent cation displacement in cheese
The average ash content of fluid milk is 0.70% (Jenkins and McGuire 2006). Ash is
referred as the total mineral content in a food product. The mineral composition of milk (Table
3.9.1) is composed of different salts: phosphates, citrates, chlorides, sulfates, carbonates, and
bicarbonates of sodium, potassium, calcium, and magnesium; and trace element such as, iron,
zinc, copper, silicon and iodine (Fox and McSweeney 1998). In general, all minerals play
important roles in the stability of milk and most importantly in milk proteins. Mineral salts are
important for maintaining electrical neutrality, isotonic balance between blood and milk, and the
formation of casein micelles (Holt 1985). Calcium (+2) is very important for the formation of
casein micelles units (calcium-casein complex systems). As mentioned previously, multiple
models have been proposed describing the interactions between calcium, casein, and colloidal
calcium phosphate in the stabilization of the casein micelle molecule (Farkye and Nagendra
2015). Overall, the interior of the casein micelle is very hydrophobic with strong affinity towards
calcium. On the other hand, the surface of the casein is more polar than the interior and has the
potential to form colloidal calcium phosphates and hydrogen bonds with other casein subunits
(Horne and Banks 2004).
Milk is a system composed of a water and a fat phase (emulsion). Casein proteins are
associated with the fat phase, calcium and most minerals can exist in both phases (Fox and
McSweeney 1998). Colloidal minerals are very important for casein micelle structure,
consequently, very important for cheese production and quality. Gonzasles-Martin and others
(2009) found that mineral profile in cheese played a key role in ripening time and cheese yield;
potassium and phosphorous were found to have a positive correlation with cheese yield.
Furthermore, mineral content influences cheese production in many more ways since it is known

29
that some minerals participate in the coagulation process, whey draining, and curd texture
(Patiño and others 2005).
One important problem that has never been addressed in iron fortification is the
possibility of mineral displacement within the food matrix. Divalent cation minerals are well-
known for displacing one another in many biochemical systems and reactions. For example,
calcium (+2) and magnesium (+2) share common biochemical pathways because of their
identical charge. In the body, both minerals are transported by Ca/Mg-ATPase (Fox and
McSweeney 1998). Also, the concentration of both minerals are strongly related to citrate and
phosphate concentrations in milk (Fox and McSweeney 1998, Vasudevan and others 2002). In
Cheddar cheese successfully fortified with zinc sulfate (Kahraman and Ustunol 2012), protein
content was unexpectedly higher than in unfortified Cheddar cheese. The authors suggested that
the zinc contributed to bridging and crosslinking between casein micelles, similar to calcium ion
naturally present and responsible for curd formation in cheese making. Kahraman and Ustunol
(2012) suggested a possible zinc-calcium displacement mechanism, supported by the lower
amount of calcium in zinc-fortified Cheddar cheese. When fortifying Turkish white cheese with
zinc (Gulbas 2005), a similar divalent displacement theory was suggested explaining the
successful retention of zinc (+2) in the matrix.
A portion of Cheddar cheese (100 g) contains the following divalent cations amounts:
3.43 mg of zinc, 0.16 mg of iron, 27 mg of magnesium and 675 mg of calcium (USDA 2014).
The addition of iron, or any other mineral, should not comprised other nutrients when fortifying
Cheddar cheese. It is expected that fortified foods should have a similar nutrient content as non-
fortified foods (except for the added nutrient). If there is any mineral displacement in cheese, the
displaced mineral will be lost during the whey-draining and cheese-pressing steps. Calcium,

30
iron, zinc and magnesium content in iron fortified Cheddar cheese is very relevant due to their
importance in nutrition and health. But also, any possible mineral changes caused by the
fortification process can potentially affect cheese quality. Currently, there is limited literature
available on divalent cation balance disturbances in cheese.
Table 3.9.1. Mineral composition (mg or µg) of bovine milk.
Adapted from: Flynn and Power 1985.
Mineral Average content in milk (µg or mg/ L)
Potassium (mg) 1500
Sodium (mg) 1200
Chloride (mg) 950
Phosphorous (mg) 950
Sodium (mg) 500
Magnesium (mg) 120
Zinc (µg) 3500
Silicon (µg) 2600
Iron (µg) 500
Iodine (µg) 260
Copper (µg) 200
Molybdenum (µg) 73
Manganese (µg) 30
Nickel (µg) 25

31
4.0 MATERIALS & METHODS
4.1 Micro-encapsulated ferrous sulfate salts
Micro-encapsulated ferrous sulfate with an approximate diameter of 700-1000 µm per
particle, and micro-ionized/encapsulated ferrous sulfate with a 220-422 µm diameter per particle
were obtained from Dr. Paul Lohmann Inc. (Emmerthal, Germany); both iron salts are coated
with hydrogenated palm oil. Iron salts were assumed to be sterilize based on the current GMPs,
pharmacopoeia and international food regulations followed by the manufacturer. Standard
microbial plate counts (SPC) were performed in triplicates to collaborate the presence of no
microbial agents in the iron salts.
For the fortification dosage, 30% (4.5 mg) of the Iron Daily Recommended Allowance
(RDA) per serving was selected. Assuming an average RDA of 15 mg/day Fe in the United
States. Table 4.1.1 shows the amount of iron salt added to Cheddar cheese based on the iron
content of each fortificant.
Table 4.1.1. Ferrous sulfate treatments and fortification dosage.
Treatment Fe+2 Source
Diameter
(µm)
Fe+2
Content*
(%)
Fortification
dosage**
Control N/A N/A N/A N/A
LMFS
Large Micro-encapsulated
ferrous sulfate
700-1000
16.8
0.95
SMFS
Small Micro-encapsulated
ferrous sulfate
220-422
9.0
1.78
*wt/wt percentage
**g micro-encapsulated ferrous sulfate/kg Cheddar cheese

32
4.2 Starter culture activity
In order to assess the potential effect of iron salts on Cheddar cheese starter culture a
preliminary study was conducted to monitor bacterial growth, pH and Titratable Acidity (TA).
Non-fat milk powder (NFDM) (Amresco, Ohio, USA) was rehydrated with distilled water to a
final concentration of 12% wt /v (660 mL water and 90 g NFDM). Reconstituted milk was
pasteurized using a batch pasteurization process (30 min, 163°C), then divided into three batches
(SMFS, LMFS, and Control). Flasks were fortified with ferrous sulfate as shown in Table
4.1.1. Commercial Cheddar cheese starter culture consisting of Lactococcus lactis subsp. lactis
and Lactococcus lactis subsp. cremoris (F-DVS 980 CHR Hansen, Hoersholm, Denmark) was
added to each flask at a final concentration of 1% wt /wt. Treatments were mixed for 10 min and
incubated at approximately 32°C for 6 h. Samples were collected at 0, 30, 60, 120, 180, 240,
300, and 360 min. At each time point 15-mL aliquots were taken for each treatment to measure
starter culture activity: 10 mL for TA and pH, 100 µL for microbial plating on Man Rogosa and
Sharpe (MRS) agar (BD, Difco Brand, New Jersey, USA). MRS plates were incubated for 48 h
at 32°C and bacterial counts were expressed as CFU/mL milk. For TA analysis, phenolphthalein
indicator was added to each sample and titrated against 0.1 N NaOH (Sigma-Aldrich, St. Louis,
MO, USA). Volume of titrant used was recorded and Equation 4.2.1 was used to calculate TA.
%TA (wt / vol) = (N * V1 * Eq. wt.) / (V2 * 10) Equation 4.2.1
Where N = NaOH Normality, V1= NaOH volume used, Eq. wt. = equivalent weight of
the predominant acid (lactic acid 90.08 mg/mEq), V2 = volume of sample, milk. The starter
culture activity experiments were performed a total of three times.

33
4.3 Cheddar cheese manufacturing
Figure 4.3.1. Cheddar cheese manufacturing at Michigan State University Dairy Plant.
Raw Milk
Pasteurization
1% starter culture (wt/wt)
& Incubation
Annatto coloring
Rennet Addition
Healing & Cooking @
38oC
Whey Draining
Salting +
Control
Treatment 1
Treatment 2
Cutting the curd
Cheddaring Process
TA = 0.62%
Pressing
Vacuum-sealing & 90 d Aging

34
Cheddar cheese was manufactured at the Michigan State University Dairy Plant. Whole
milk (Michigan Milk Producers Association, Michigan, USA) with a 3.41% fat, 3.02% protein,
and 8.83% Solids-Non-Fat (SNF) composition was HTST pasteurized (72°C for 15 s). Whole
milk (190 L) was equally distributed to three cheese vats to which 1% wt/wt Cheddar cheese
starter culture (DVS 98, CHR Hansen, Hoersholm, Denmark) was added with constant stirring.
Milk was incubated for 30 min at 32 °C followed by addition of 6 mL annatto and 13 rennet mL
(diluted 40x in distilled water; Chy-Max, Chr. Hansen) per vat. Milk was allowed to coagulate
for 30 min at 32°C. Using wire knives, milk curd was cut when adequate firmness was reached.
After cutting, curd was allowed to heal for 30 min at 35 °C. Then, curd was cooked for 1 h at 38
°C. Whey was drained after the cooking process, the resulting cheese curds were matted and cut
into rectangular blocks to then be flipped every 15 min at 35°C (Cheddaring process). The
process was stopped when TA reached 0.62 % and curd blocks were milled by hand. The cheese
was weighted and equally divided among three containers for the salting step.
The selected iron treatments are not soluble in water or milk, and cannot be exposed to
temperatures above 65°C according to the manufacturer. Due to their hydrophobicity and heat
sensitivity, micro-encapsulated iron salts need to be incorporated during the salting step of
Cheddar cheese manufacturing. Commercial table salt (0.25% wt/wt) and micro-encapsulated
iron salts were mixed for 10 min in plastic bags before incorporation into cheese curds. Cheddar
cheese curds were transferred to cheese hoops and pressed for 12 h at 276 kPa. Pressed Cheddar
cheese was vacuum-sealed in plastic bags and stored at 8°C for 90 d. The entire process was
repeated two more times using the same milk source (3.41% fat, 3.02% protein, and 8.83% SNF,
processing conditions and ingredients). A flow diagram describing the Cheddar manufacturing
can be found in Figure 4.3.1.

35
4.4 Proximate analysis
Fortified cheeses and control samples were analyzed for protein, fat, moisture and ash
content. Moisture and ash were analyzed using AOAC standards methods (AOAC 2000). For
moisture content, shredded cheese samples (2 g) were weighed in pre-dried aluminum dishes and
then dried in an oven (2 h, 100°C). For ash determination, shredded cheese samples (5 g) were
ashed in a in a muffle furnace (525°C, 10 h) using pre-treated (3 HCl: 1 HNO3) crucibles. Fat
content was determined according to the Babcock method (Marshall 1992), and protein content
was determined by Certified Laboratories Inc. (Plainview, New Jersey, USA) using the Kjeldahl
method.
4.5 Atomic absorption spectroscopy
At 60-day cheese aging, divalent cations in Cheddar were measured using a 55B AA
Atomic Absorption Spectrophotometer (Agilent Technologies Co., Santa Clara, CA, USA). In
addition, iron, calcium, magnesium and zinc hollow-cathode lamps were purchased from Agilent
Technologies Co. The AAS (Atomic Absorption Spectrophotometer) system was calibrated
using standard solutions and by plotting a standard curve. Results were reported as the average of
duplicate analysis from each cheese replicate.
4.5.1 Stock solutions and standard curves
Iron:
A stock solution (1000 µg/mL Fe) was used to prepare 0, 3, 5, 8, 10 and 12 µg/mL Fe
standard solutions. The stock solution was made using iron chips (Sigma-Aldrich) according to
the AAS manual. The conditions for the equipment were: 5 mA lamp current, acetylene gas for
flame fuel, air for support, 248.3 nm wavelength and 0.2 nm slit.

36
Calcium:
A stock solution (1000 µg/mL Ca) was used to prepare 0, 1, 2, 2.5, 3 and 4 µg/ml Ca
standard solutions. The stock solution was made using calcium carbonate (Sigma-Aldrich)
according to the AAS manual. The conditions for the equipment were: 10 mA lamp current,
acetylene gas for flame fuel, air for support, 422.7 nm wavelength and 0.5 nm slit. Additionally,
0.5 mL of 1000 µg /mL lanthanum (Sigma-Aldrich) was added to all standard solutions in order
to eliminate any chemical interference.
Zinc:
A stock solution (1000 µg/mL Zn) was used to prepare 0, 1, 5, 10, 15 and 20 µg /mL Zn
standard solutions. The stock solution was made using zinc chips (Sigma-Aldrich) according to
the AAS manual. The conditions for the equipment were: 5 mA lamp current, acetylene gas for
flame fuel, air for support, 213.9 nm wavelength and 1.0 nm slit.
Magnesium:
A stock solution (1000 µg/mL Mg) was used to prepare 0, 1, 2, 2.5, 3 and 4 µg/mL Mg
standard solutions. The stock solution was made using magnesium strips (Sigma-Aldrich)
according to the AAS manual. The conditions for the equipment were: 4 mA lamp current,
acetylene gas for flame fuel, air for support, 202.6 nm wavelength and 1.0 nm slit. Additionally,
1.0 mL of 1000 µg /mL lanthanum (Sigma-Aldrich) was added to all standard solutions in order
to eliminate any chemical interference.
4.5.2 Determination of mineral balance in Cheddar cheese
Cheddar cheese (1.0 g) was dissolved in concentrated nitric acid (8 mL) for 2 h in
pressure tubes (pre-digestion treatment). Samples were transferred to a Multiwave 3000

37
Modular microwave system (Anton Paar, Graz, Austria) and digested using the following
conditions: 600 W, 160°C, 13 bar, 30 min ramp time, and 10 min holding time. After
microwave digestion, 2 mL 30% hydrogen peroxide (General Industrial Chemicals, East
Hanover, NJ) was added to each sample and final volume was adjusted to 25 mL using distilled
water. Approximately, 5 mL aliquots were separated for calcium content. The remaining 20 mL
solution was analyzed for iron, magnesium and zinc.
For calcium analysis, 3 mL of the digested cheese was diluted to 25-mL by adding 3 mL
Lanthanum solution (1000 µg /mL) and distilled water. The resulting solution was further
diluted by taking a 0.702 mL aliquot and adjusting its final volume to 20 mL using distilled
water. The final solution was used for AAS measurements.
In order to assess the accuracy and precision of the Atomic Absorption
Spectrophotometer, a standard material (0.5g bovine liver; Standard Reference Material 1577b)
from the National Institute of Standards & Technology was analyzed along with Cheddar cheese.
Whey:
Whey from each replicate (n=3) was collected during Cheddar cheese manufacturing and
analyzed for iron content. Cheddar cheese whey (5.0 g) dissolved in concentrated nitric acid (10
mL) was predigested, digested and diluted the same way as Cheddar cheese for iron AAS
analysis.
4.6 Lipid oxidation assessment
The Thiobarbituric acid (TBA) assessment was selected to measure lipid oxidation in
Cheddar cheese. TBA relies on the formation of malondialdehyde (MDA), a secondary product
of lipid oxidation. According to this method, one mole of MDA reacts with 2 moles of TBA

38
giving a pink product in solution that can be quantified using a spectrophotometer. Due to
MDA’s instability, 1,1,3,3-tetraethhoxypropane (TEP), a MDA pre-cursor, is measured instead
in TBA analysis (Frankel 2005).
Cheddar cheese samples (5.0 + 0.01 g) were placed on a beaker and 1.0 mL (0.2 mg/mL)
butylated hydroxytoluene (BHT; Sigma-Aldrich) was added to stop oxidation. For every cheese
sample measured, a spiked sample (12 mL of 10 μM TEP; Sigma-Aldrich) was prepared to
correct for any variation that may occur during the lipid extraction.
Cheese samples were blended with either 33.5 mL (unspiked) or 45.5 mL (spiked) 10%
TCA (Sigma-Aldrich) in 0.2 M H3PO4 (wt/vol; Sigma-Aldrich). The mixture was filtered
through Whatman No. 1 filter paper, and 5 mL of the filtrate was added to 5 mL 0.02 M TBA
(Sigma-Aldrich) to reach a final volume of 10 mL. Filtrate-TBA solutions were incubated in
boiling water for 30 min and absorbance readings were recorded at 530 nm using a
Spectrophotometer (Genesys 20 Spectrophotometer, Thermo Scientific, Waltham, MA, USA).
TBA Reactive Species (TBARS) were calculated using cheese absorbances and a standard curve
was prepared with 0, 1.25, 2.50, 3.75, 5.00 and 10.00 nmol/mL TEP.
4.7 Sensory evaluation
After 90-day aging, iron-fortified Cheddar cheeses were analyzed for acceptability. A consumer
acceptance panel (n=101) familiar with Cheddar cheese was recruited at Michigan State
University (MSU, East Lansing, Michigan, USA). The sensory evaluation was performed in the
Food Science Sensory Laboratory (Michigan State University, East Lansing, USA). The lab had
eight individual computer booths with control lighting and temperature. Participants received a
brief explanation of the study and signed a consent form for the University Committee on

39
Research Involving Human Subjects at Michigan State University (UCRIHS). Samples (20 g,
5°C) were placed in clear plastic cups labeled with a random 3-digit code and the order of the
presentation was randomized. Water and unsalted crackers were provided to the panelists for
palate cleansing. Panelists were asked to rate appearance, texture, flavor and overall
acceptability using 9-point Hedonic scale, where 1 = dislike extremely to 9 = like extremely, and
5 = neither like nor dislike. Following numerical scoring, participants were asked to select the
best texture attributes for the samples from a given list (firm, soft, very hard, grainy, rubbery,
crumbly, runny, dry, and chewy or none). Following flavor rating, participants were asked to
select the best flavor attributes for the samples from a given list (sour-acidic, vinegary, greasy,
sweet, metallic, buttery, salty, moldy, spicy, other, or none). Texture and flavor attribute list were
selected based on common Cheddar cheese attributes and the purpose of this study.
4.8 Statistical analysis
Cheese manufacturing was done three times (n=3) in a randomized design. Starter culture
activity, TBA assessment, compositional and divalent cation content results were performed in
duplicates and analyzed using S.A.S. software version 9.4 (S.A.S. Institute Inc., Carry, NC,
USA). One-way ANOVA (p = 0.05) and Tukey’s Honestly Significant Difference (HSD) test
were performed to determine statistical difference between the treatments and the control. Data
from the consumer acceptance panel was collected using SIMS software (SIMS, Berkley
Heights, NJ, USA) and analyzed using S.A.S. software version 6.0 (S.A.S. Institute Inc., Carry,
NC, USA) by One-way ANOVA and Tukey’s HSD test.

40
5.0 RESULTS & DISCUSSION
5.1 Starter culture activity
Figure 5.1.1. Effect of micro-encapsulated ferrous sulfate on Cheddar cheese starter culture on
microbial counts (CFU/mL) incubated at 32 °C for 6 h. LMFS = Large Micro-encapsulated,
Ferrous sulfate (0.95 g/kg; 700-1000 µm), SMFS= Small Micro-encapsulated Ferrous Sulfate
(1.78 g/kg; 220-420 µm).
Lactic acid bacteria is very important for flavor, acidity and texture profile in Cheddar
cheese. Commercial Cheddar cheese starter culture (Lactococcus lactis subsp. lactis and
Lactococcus lactis subsp. cremoris) in NFDM (12% w/v, 32 °C) and fortified with micro-
encapsulated ferrous sulfate was incubated for 6 h. LAB microbial counts, pH and TA were
monitored in order to observe the effect of the iron treatments on starter culture activity. At each
time point, LAB counts for LMFS, SMFS and the control were not significantly different
7
7.5
8
8.5
9
9.5
0 1 2 3 4 5 6
Log (
CF
U/m
L)
Time (h)
Control
LMFS
SMFS

41
(Figure 5.1.1). Regardless of the treatment, LAB was able to grow successfully for 4 h reaching
~8.80 log CFU/mL milk. After 4 h, LAB counts decreased drastically but remained constant
(~7.40 log CFU/mL) after 5 h. In order to complement the information provided by LAB counts,
pH and TA were also monitored during the 6 h fermentation (Figure 5.1.2 and Figure 5.1.3).
TA is commonly utilized to measure the amount of lactic acid in dairy products and possible
buffer capacity, on the other hand, pH measures the concentration of free H+ ions in solution;
both provide important information about acid properties in foods (Zhang and Metzger 2009).
The pH for LMFS, SMFS and the control were significantly different at 0, 2 and 3 h (p < 0.05).
At these points, pH for SMFS was lower than the control indicating enhanced lactic acid
production. pH for LMFS was not significantly different from the control at any time. After 6
h, all treatments reached a pH of ~ 5.4. TA values for the control, LMFS and SMFS were
significantly different at 0 h (p < 0.05) only. At 6 h, all treatments reached a TA close ~0.50%.
Figure 5.1.2. The effect of micro-encapsulated ferrous sulfate on Cheddar cheese starter culture
pH incubated at 32 °C for 6 h. LMFS = Large Micro-encapsulated, Ferrous sulfate (0.95 g/kg;
700-1000 µm), SMFS= Small Micro-encapsulated Ferrous Sulfate (1.78 g/kg; 220-420 µm).
5
5.5
6
6.5
7
0 1 2 3 4 5 6
pH
Time (h)
Control
LMFS
SMFS

42
Figure 5.1.3. The effect of micro-encapsulated ferrous sulfate on Cheddar cheese starter culture
Titratable Acidity (TA %) incubated at 32 °C for 6 h. LMFS = Large Micro-encapsulated,
Ferrous sulfate (0.95 g/kg; 700-1000 µm), SMFS= Small Micro-encapsulated Ferrous Sulfate
(1.78 g/kg; 220-420 µm).
Differences in pH for SMFS at the beginning of the fermentation can be attributed to the
hydrogenated palm oil present in the micro-encapsulated salts. Lactococcus lactis species
growth relies on the availability of vital nutrients like glucose, glutamine and asparagine (Aller
and others 2014). It is possible that palm oil, present at a higher concentration in SMFS,
contributed to LAB metabolic pathways. It is known that LAB is able to metabolize fatty acids.
In Cheddar cheese starter culture are the primary agents of lipolysis in Cheddar cheese (Hickey
and others 2006), important process during Cheddar ripening. Lipolysis is possible by the
esterase enzyme present in various LAB strains, including Lactococcus lactis (Chich and others
1997). Even though palm oil has not been studied particularly with LAB, it has been shown that
LAB have different responses to free fatty acids; sometimes growth is inhibited but other times it
0
0.1
0.2
0.3
0.4
0.5
0.6
0 1 2 3 4 5 6
TA
(%
)
Time (h)
Control
LMFS
SMFS
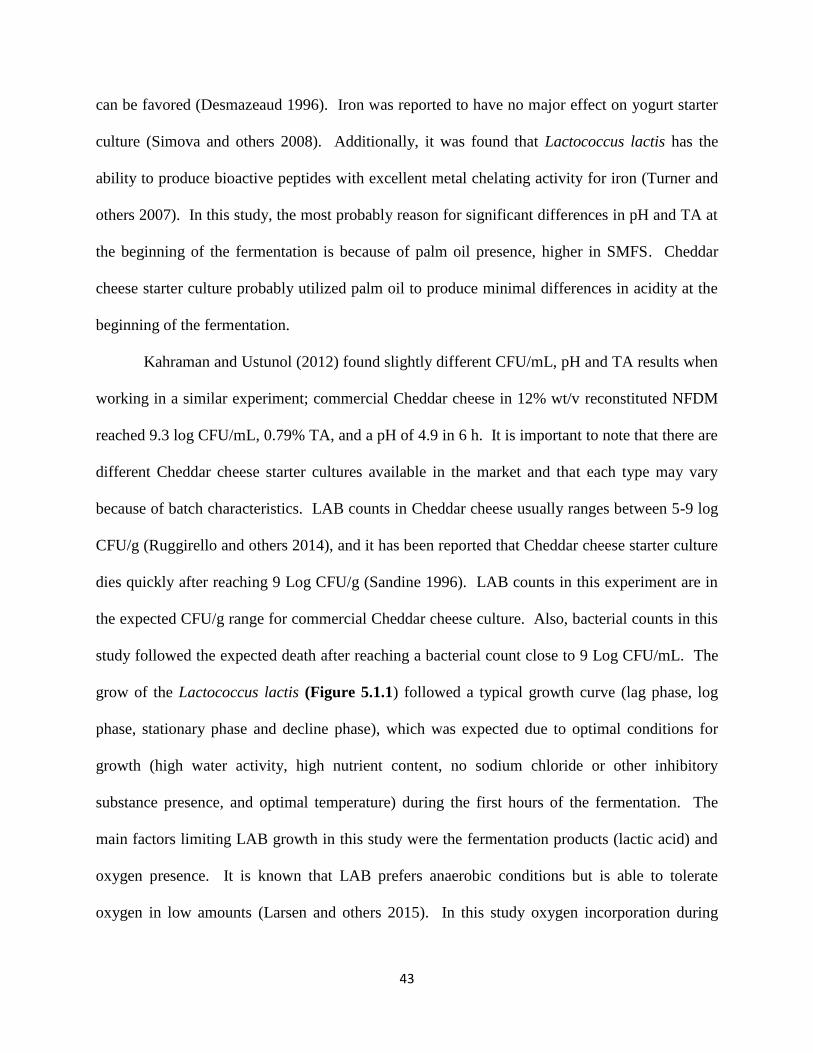
43
can be favored (Desmazeaud 1996). Iron was reported to have no major effect on yogurt starter
culture (Simova and others 2008). Additionally, it was found that Lactococcus lactis has the
ability to produce bioactive peptides with excellent metal chelating activity for iron (Turner and
others 2007). In this study, the most probably reason for significant differences in pH and TA at
the beginning of the fermentation is because of palm oil presence, higher in SMFS. Cheddar
cheese starter culture probably utilized palm oil to produce minimal differences in acidity at the
beginning of the fermentation.
Kahraman and Ustunol (2012) found slightly different CFU/mL, pH and TA results when
working in a similar experiment; commercial Cheddar cheese in 12% wt/v reconstituted NFDM
reached 9.3 log CFU/mL, 0.79% TA, and a pH of 4.9 in 6 h. It is important to note that there are
different Cheddar cheese starter cultures available in the market and that each type may vary
because of batch characteristics. LAB counts in Cheddar cheese usually ranges between 5-9 log
CFU/g (Ruggirello and others 2014), and it has been reported that Cheddar cheese starter culture
dies quickly after reaching 9 Log CFU/g (Sandine 1996). LAB counts in this experiment are in
the expected CFU/g range for commercial Cheddar cheese culture. Also, bacterial counts in this
study followed the expected death after reaching a bacterial count close to 9 Log CFU/mL. The
grow of the Lactococcus lactis (Figure 5.1.1) followed a typical growth curve (lag phase, log
phase, stationary phase and decline phase), which was expected due to optimal conditions for
growth (high water activity, high nutrient content, no sodium chloride or other inhibitory
substance presence, and optimal temperature) during the first hours of the fermentation. The
main factors limiting LAB growth in this study were the fermentation products (lactic acid) and
oxygen presence. It is known that LAB prefers anaerobic conditions but is able to tolerate
oxygen in low amounts (Larsen and others 2015). In this study oxygen incorporation during

44
fermentation possibly contributed to microbial death after 5 h. Additionally, after 5 h pH was
close to 5.0, which is known to be the pH where LAB starts to decrease rapidly (Beresford and
others 2001). According to the manufacturer, after a 6-h fermentation the starter culture is
expected to reach a pH close to 5.7 (9.5% NFDM, 30°C) (F-DVS (980 CHR Hansen,
Hoersholm, Denmark). Figure 5.1.2 shows that all treatments reached the expected pH in 6 h.
TA represents the amount lactic acid produced during the fermentation. It was observed that TA
increased during the 6 h fermentation process. Lactic acid is a known inhibitor for Lactococcus
lactis (Even and others 2002) explaining the death of the bacteria after reaching a high TA. TA
continue to increase and pH continue to drop after 4 h since it is known that during the decline
phase of the starter culture it is possible to still observed acid development (Sandine 1996).
Another important element to consider when explaining LAB activity is possible
bacterial competition in the starter culture. The selected Cheddar cheese culture contains
Lactococcus lactis subsp. lactis and Lactococcus lactis subsp. Cremoris. Because of
confidentiality reasons, no information about the specific concentration of Lactococcus lactis
subsp. lactis or Lactococcus lactis subsp. cremoris was provided by the manufacturer (F-DVS
(980 CHR Hansen, Hoersholm, Denmark). Lactococcus lactis subsp. cremoris has the ability to
produce diplococcin, a bacteriocin capable of destroying Lactococcus lactis subsp. lactis. It is
also known that Lactococcus lactis subsp. cremoris predominates in multiple-strain starter
culture (Ryan and others 1996). LAB activity during the first 4 h shows that Lactococcus lactis
subsp. lactis (assuming is at a higher concentration in starter culture) begins to grow succesfully
until diploccin, produced by Lactococcus lactis subsp. cremoris, starts to affect LAB counts (5
h).

45
The purpose of tracking any changes in starter culture activity in this study was to
address any possible detrimental effects in commercial Cheddar cheese culture due to micro-
encapsulated ferrous sulfate. Overall, micro-encapsulated ferrous sulfate produced no negative
effect on Cheddar cheese starter culture. There were no major LAB counts, pH and TA changes
during a 6-h fermentation. The proposed iron salts have the potential to be used successfully in
the fortification of Cheddar cheese.
5.2 Proximate & mineral analysis
The effect of micro-encapsulated ferrous sulfate on Cheddar cheese composition was
analyzed. Fat, protein, ash and moisture content were not statistically different for all treatments
(Table 5.2.1). Although not statistically significant, it was noted that protein and ash content for
SMFS had some differences when compared with the other samples. In the SMFS sample,
protein was lower and ash content higher. Kahraman and Ustunol (2012) found similar results
when fortifying Cheddar cheese with another divalent cation (zinc); zinc had little effect on
Cheddar cheese fat, moisture, ash and moisture content. Kahraman and Ustunol (2012)
suggested that zinc fortification, similarly to calcium fortification (Ustunol and Hicks 1990), can
increase protein and fat content in Cheddar cheese due to stronger casein bridging that allowed
better fat entrapment. In the present study, there were no significant differences in protein and fat
content between iron treatments and the control showing that fortification caused no effect on
casein interactions, and consequently there were no fat changes.

46
Table 5.2.1. Proximate analysis of Cheddar cheese fortified with micro-encapsulated ferrous
sulfate. LMFS = Large Micro-encapsulated, Ferrous sulfate (0.95 g/kg; 700-1000 µm), SMFS=
Small Micro-encapsulated Ferrous Sulfate (1.78 g/kg; 220-420 µm).
Treatment Fat Protein Ash Moisture
Control 32.42 + 0.52 a 24.08 + 0.15 a 3.77 + 0.19 a 36.86 + 1.45 a
LMFS 32.38 + 0.18 a 24.66 + 0.68 a 3.81 + 0.06 a 36.89 + 0.56 a
SMFS 32.58 + 0.14 a 23.63 + 0.17 a 3.99 + 0.18 a 36.52 + 0.16 a
Figure 5.2.1. Mineral content of Cheddar cheese fortified with micro-encapsulated ferrous
sulfate. A= iron, B = calcium, C = Zinc, and D = Magnesium. C = Control, LMFS = Large
Micro-encapsulated, Ferrous sulfate (0.95 g/kg; 700-1000 µm), SMFS= Small Micro-
encapsulated Ferrous Sulfate (1.78 g/kg; 220-420 µm). a,b,c = Means within a column with
different subscript are significantly different (p < 0.05); n = 3.
a, b, c
= Means within a column with different subscripts are significantly different.
(P < 0.05); n =3.

47
Table 5.2.2. Iron lost in the whey (mg/ g whey) and Percent Recovery (%) during the
fortification of Cheddar cheese with micro-encapsulated ferrous sulfate. LMFS = Large Micro-
encapsulated, Ferrous sulfate (0.95 g/kg; 700-1000 µm), SMFS= Small Micro-encapsulated
Ferrous Sulfate (1.78 g/kg; 220-420 µm).
Treatment Iron lost (in whey) % Recovery (in Cheddar)
Control 4.49x10⁻⁴ + 4.0 x10⁻⁴ a N/A
LMFS 8.83x10⁻⁴ + 2.9 x10⁻⁴ a 66.0 a
SMFS 2.31x10⁻³ + 2.0 x10⁻³ a 91.0 b
Calcium, zinc, and magnesium (relevant divalent cations in Cheddar cheese) were not
affected by the addition of micro-encapsulated ferrous sulfate. On the other hand, iron content
(Figure 5.2.1) was significantly higher in both iron treatments (p < 0.05); SMFS > LMFS >
Control. The successful incorporation of iron in Cheddar cheese is due to casein-iron
interactions. Casein proteins have strong affinity to iron, this is because phosphate groups in
casein easily reacts with divalent cations via electrostatic forces or complex formation (Peres and
others 1999). Phosphate groups are part of phosphoserine residues in the casein molecule and
abundantly present in casein proteins (West 1986). The order divalent cations can bind to casein
proteins is: αs1-casein>β-casein> κ-casein (Dickson and Perkins 1971). It was reported there are
14 iron-binding sites on casein molecules (Sugiarto and others 2009). Additionally, there are
free phosphate sources (colloidal phosphate groups) available in milk and cheese that can easily
react with iron (Ellis and others 2016). Both, phosphoserine and colloidal phosphate helped in
the incorporation of iron to the Cheddar cheese curd.
a,b,c
= Means within a column with different subscripts are significantly different. (P < 0.05);
n =3.

48
Another contributing factor in the incorporation of iron (+2) to Cheddar cheese was the
nature of micro-encapsulation. Micro-encapsulated iron salts, SMFS and LFFS, were coated
with hydrogenated palm oil. Palm oil is rich in saturated fats, such as palmitic acid, commonly
found in dairy products (Jenkins and McGuire 2006). Due to hydrogenation, it can be assumed
that all fatty acids present in hydrogenated palm oil are saturated. During the whey draining step
in cheese-making, the iron compounds particles probably were associated with the cheese curd
(high in fat) rather than the whey because iron salts behaved as fats due to their coating material.
During cheese-making, milkfat (and some water) is trapped by the hydrophobic casein-micelle
network forming a curd. Micro-encapsulated ferrous sulfate salts were successfully incorporated
just as the rest of the fats in milk are incorporated into Cheddar cheese.
Iron percent recovery and iron content in whey (Table 5.2.2) proved the successful
incorporation of micro-encapsulated ferrous sulfate to Cheddar cheese. As stated previously, the
iron micro-encapsulated salts have a strong association with the cheese curds (high in fat and
casein content). Additionally, when comparing whey proteins and casein proteins, casein had
stronger affinity for divalent cations than whey proteins (Sugiarto and others 2009). In this study,
minimal iron content was lost with the whey during the manufacturing of iron fortified Cheddar
cheese. Percent recoveries showed that both LMFS and SMFS had good iron recovery.
Micro-encapsulated ferrous sulfate particle size showed no changes in composition and
mineral content except for iron. Iron content for LMFS and SMFS was significantly different (p
<0.05). SMFS was better retained in Cheddar cheese based on higher iron content, percent
recovery and the amount lost with the whey. The most logic reason for particle size differences
is because smaller iron (Fe+2) particles can react easily with phosphate groups in casein proteins
compare to bigger particles, or because smaller fat particles can be entrapped better into cheese

49
curds easily. It is easier for smaller micro-encapsulate ferrous sulfate particles to mimic fat when
palm oil content for coating is higher (16.8% Fe2+ in LMFS vs. 9.0% Fe2+ in SMFS). Literature
supporting the results in this study is limited. Wegmuller and others (2004) found that reducing
particle size of micro-encapsulated ferric pyrophosphate, from 21 µm to 0.5 µm, increased
bioavailability and absorption proving that iron particle size is very important for reactivity and
affinity purposes in many biochemical processes.
Several authors (Gulbas 2005, Kahraman and Ustunol 2012) had suggested some mineral
displacement mechanisms when fortifying cheese with a divalent cation but in this study iron
fortification of Cheddar cheese caused no disturbances in divalent cation balance (Figure 5.2.1).
Magnesium, zinc and calcium content for all treatments were not significantly different (p >
0.05). Divalent cations, such as Mn2+, Zn2+, Fe2+, Fe3+, Mg2+, and Cu2+, can bind to caseins; this
binding affinity is dependent on pH, ionic strength, temperature and phosphate group content
(On-Nom and others 2010). Individual cation affinity with casein is: Fe3+ > Zn2+ > Ca2+ > Cu2+
> Mg2+ (Philippe and others 2005). Because of this affinity order, during iron fortification iron
can easily displace any other cation mineral naturally present in Cheddar cheese. In this study, it
was observed that the addition of micro-encapsulated ferrous sulfate did not affect calcium,
magnesium, and zinc content (Figure 5.2.1). Iron probably attached to colloidal phosphate or
available phosphate groups not occupied by another divalent mineral in the casein molecule.
Similar results were obtained when incorporating iron compounds (Fe2+ and Fe3+) to casein, iron
addition did not produced major changes in hydration, protein distribution, curd formation, and
temperature stability (Raouche and others 2009).
In this study magnesium, zinc, and calcium (major divalent cations present in milk) were
successfully incorporated to Cheddar cheese without affecting divalent cation balance.

50
Maintaining mineral balance is not only important for nutritional aspects but also for quality
reasons. Gonzasles-Martin and others (2009) found that mineral profile in cheese played
important roles in ripening time and cheese yield. It is also known that some minerals have
important contributions to coagulation of milk proteins, whey draining during cheese-making,
and in defining cheese texture (Patiño and others 2005). In summary, iron was successfully
incorporated to Cheddar cheese without causing major changes in calcium, zinc, magnesium,
protein, fat, ash and moisture content. The proposed iron fortified Cheddar cheese is an excellent
source of iron since it provides at least 20% of the iron RDA in the United States (20% of the
iron RDA for LMFS and 32% of the RDA for SMFS).
5.3 Lipid oxidation assessment
The TBA method is commonly used for the assessment of lipid oxidation in many foods,
including dairy products (Asha and others2015; Semeniuc and others 2016). The TBA relies on
the production of malondialdehyde (MDA), a secondary product of lipid oxidation. The test is
commonly used for determining freshness of foods (Shamberger and others 1979). Sensory
evaluation is considered the gold standard in product acceptability when talking about perceiving
undesirable flavors and odors caused by lipid oxidation. There is some correlation between TBA
values and sensory scores (Mehta and others 2015) making this method very useful for
predicting consumer’s acceptance.
Iron, a pro-oxidant, is known to produce negative organoleptic changes when added to
foods. Iron has the ability to be oxidized or reduced in the presence of oxygen, light, and
radiation. Redox changes are associated with the formation of aldehydes, epoxides, ketone,
peroxides and alcohol groups associated with rancid and off-flavors in oils (Frankel 2014).
Foods high in fats, such as Cheddar cheese, are susceptible to lipid oxidation (Kahraman and

51
Ustunol 2012). Zhang and Mahoney (1991) reported that iron catalyzed lipid oxidation reactions
in Cheddar cheese fortified with iron. Fortification of Cheddar cheese with iron compounds can
deteriorate quality and sensory characteristics, because of this, it is important to monitor lipid
oxidation for micro-encapsulated ferrous sulfate fortified Cheddar cheese.
Table 5.3.1. Effect of micro-encapsulated ferrous sulfate on lipid oxidation of Cheddar cheese
(expressed as TBARS, mg/kg of malondialdehyde). LMFS = Large Micro-encapsulated, Ferrous
sulfate (0.95 g/kg; 700-1000 µm), SMFS= Small Micro-encapsulated Ferrous Sulfate (1.78 g/kg;
220-420 µm).
Ripening Time (d) Control LMFS SMFS
0 0.50 + 0.05 a 0.54 + 0.12 a 0.58 + 0.19 a
10 0.43 + 0.29 a 0.58 + 0.40 a 0.69 + 0.26 a
20 0.38 + 0.33 a 0.53+ 0.33 a 0.42+ 0.11 a
30 0.30 + 0.29 a 0.35+ 0.21 a 0.40 + 0.17 a
60 1.77 + 2.71 a 0.62 + 0.47 a 0.54 + 0.14 a
90
0.47+ 0.43 a
0.64 + 0.46 a
0.62 + 0.14 a
a, b, c
= Means within a row with different subscripts are significantly different.
(P < 0.05); n =3.

52
Table 5.3.1 shows TBA values (TBARS) for LMFS and SMFS fortified Cheddar cheese
during 90 d aging. In summary, TBARS were not significantly different throughout the aging
period. At 60 d, the control is reported to have a higher TBA value (not significantly different)
when compared to the rest of the treatments but went back to 0.40-0.50 mg/kg of MDA. The
TBARS for the control at 60 d was concluded to be not accurate based on a standard deviation
bigger than the actual TBARS average. In the TBA assay, error sources can come from
inconsistent heat treatment exposure, extracting acid concentration, and fat extraction steps
(Barriuso and others 2013). Also, this method is highly criticized because of the poor selectivity
(Salih and others 1987) producing interfere with the test and considerable overestimation and
variability in the results (Barruso and others 2013). Despite current limitations and criticisms,
TBA analysis remains the most widely accepted and commonly utilized method for quantifying
lipid oxidation products in the scientific community (Nuchi and others 2009).
Overall, it was observed that TBARS did not increased and remained steady over a
period of 90 d (Table 5.3.1). Micro-encapsulated ferrous sulfate did not initiate any lipid
oxidation reactions in Cheddar cheese. The purpose of using a micro-encapsulated iron salt was
to avoid undesirable reactions, such as lipid oxidation. In the iron treatments, micro-
encapsulation provided protection against lipid oxidation. Another important factor to consider
when assessing lipid oxidation in Cheddar cheese is the low unsaturated fatty acid content.
Malondialdehyde is mainly formed from the oxidation of linolenic acid and decreases with fatty
acid saturation (Barriuso and others 2013). Dairy products are low in unsaturated fats; milkfat is
composed mostly of saturated fats (64.9%) and small amounts of monosaturated (28.3%) and
polyunsaturated fats (6.8%) (Jenkins and McGuire 2006). Because of the nature of the milkfat,
there is no much room for the formation of MDA during lipid oxidation explaining the low

53
TBARS values in Cheddar cheese fortified with micro-encapsulated ferrous sulfate. Based on
the results in this study, it can be concluded that there are no major lipid oxidation changes in
Cheddar cheese. In order to have a more conclusive lipid oxidation assessment it is
recommended to utilize more than one lipid oxidation test. UV-Vis spectroscopy,
chromatography, nuclear magnetic resonance, IR spectroscopy and titration methods are
commonly used for quantifying different and maybe more appropriate lipid oxidation products in
foods (Barriuso and others 2013).
Hydrogenated palm oil is part of the coating agent for the selected micro-encapsulated
iron salts. Palm oil is another source for lipid oxidation in the present iron fortified Cheddar
cheese. Palm oil contains a mix of different fatty acids but high in saturated fatty acids (palmitic
acid, 43.5%) and monosaturated fatty acids (oleic acid, 36.6%) (USDA 2016); both with low
probability of participating in lipid oxidation reactions or the formation of MDA. Palm oil has
low/no contribution in the oxidation of fats in Cheddar cheese. Also, due to the use of
hydrogenated palm oil for the coating material it is assumed that there were no unsaturated fatty
acids present. In terms of fortificant particle size, ferrous micro-encapsulated diameter had no
effect on lipid oxidation. Overall, results on lipid oxidation assessment during 90 d showed that
lipid oxidation was not enhance in iron fortified Cheddar cheese.
5.4 Sensory evaluation
It has been reported that iron negatively alters sensory attributes in Cheddar cheese and
other food products (Zhang and Mahoney 1988; Zhang and Mahoney 1990; Prom-u-thai and
others 2009; Kiskini 2012). One of the main reasons for negative organoleptic changes in iron
fortified foods is the potential of iron to caused lipid oxidation reactions. Lipid oxidation
reactions are associated with rancidity and off-flavors caused by the formation of aldehydes,

54
epoxides, ketone, peroxides and alcohol groups (Frankel 2014). According to the TBA assay
performed on micro-encapsulated ferrous sulfate fortified Cheddar cheese (Table 5.3.1), there
was minimal lipid oxidation changes in Cheddar cheese and sensory changes associated with fat
rancidity were not expected in this study.
Table 5.4.1. Sensory evaluation of Cheddar cheese using a consumer acceptance panel (n = 101).
LMFS = Large Micro-encapsulated ferrous sulfate (0.95 g/kg; 700-1000 µm), SMFS= Small
micro-encapsulated ferrous sulfate (1.78 g/kg; 220-420 µm).
Attribute Control LMFS SMFS
Appearance 7.23 a 6.59 b 6.59 b
Texture 7.26 a 6.20 b 6.17 b
Flavor 7.30 a 3.68 c 4.47 b
Overall acceptability 7.32 a 3.94 c 4.58 b
When using sensory evaluation, the gold standard in lipid oxidation and product
acceptability, panelists scored the control significantly higher (p < 0.05) in appearance, texture,
flavor and overall acceptability; both iron treatments were scored significantly lower (p < 0.05)
than the control. (Table 5.4.1). For sensory evaluation, panelists (n=101) were asked to score
appearance, texture, flavor and overall acceptability using a 9-point hedonic scale, where 9= Like
very much, 5 = neither like nor dislike, and 1 = dislike extremely. Lipid oxidation products
enhanced by iron are usually blamed for the negative sensory attributes in iron fortified dairy
a, b, c
= Means within a row with different subscripts are significantly different.
(P < 0.05); n =101.
Evaluated on a scale 1-9: 9= Like very much, 5 = neither like nor dislike, 1 = dislike
extremely.

55
products (Zhang and Mahoney 1990; Kahraman and Ustunol 2012) but because there were no
major changes in lipid oxidation in LMFS and SMFS samples, it was correct to assume that
sensory differences between the control and iron treatments were not caused by lipid oxidation
propagation but by iron distinct taste, color and smell.
Appearance and texture scores were significantly higher (p < 0.05) for the control when
compared to LMFS and SMFS. For flavor and overall acceptability, all treatments were
significantly different (p < 0.05); the control had the highest score and LMFS the lowest score.
The main reason for selecting micro-encapsulated ferrous sulfate as the fortificant in this study
was because of the low potential to affect Cheddar cheese quality. According to the
manufacturer, the main advantages of using micro-encapsulated salts are to prevent lipid
oxidation reactions and to mask iron’s distinct flavor and odors (Dr. Paul Lohmann Inc.,
Emmerthal, Germany 2016). Although, lipid oxidation was not a problem in the treatments,
panelists constantly rated LMFS and SMFS samples lower than the control. Consumer
acceptance results showed that micro-encapsulation failed to mask iron taste and color in the
samples, a common problem when fortifying foods with iron. Zhang and Mahoney (1988),
Zhang and Mahoney (1990), Prom-u-thai and others (2009), and Kiskini (2012) reported metallic
flavors and color changes when fortifying foods with non-microencapsulated iron compounds.
Also, when utilizing micro-encapsulated ferrous sulfate to fortify pasteurized milk, significant
negative sensory changes were attributed to iron color and flavor (Nkhata 2012). The success of
fortification depends heavily on fortificant-food matrix interactions and possible sensory
changes. Micro-encapsulated iron salts are a promising technology in dairy products but it is
hard to predict if micro-encapsulated compounds will work on a specific product. Cheddar

56
cheese fortified with micro-encapsulated ferrous sulfate (at the selected dose) produced
significant sensory differences affecting product acceptability.
Table 5.4.2. Summary of comments by the consumer acceptance panel (n = 101) during the
evaluation of Cheddar cheese fortified with micro-encapsulated ferrous sulfate. + = Positive
comments, - = Negative comments, N = neither positive nor negative comments, neutral.
Comments Control LMFS SMFS
+ 25 5 14
- 4 30 19
N 11 7 13
Total 40 42 46
It is important to note that when comparing iron treatments, LMFS and SMFS were
scored differently for flavor and overall acceptability; SMFS was scored significantly higher than
LMFS. During sensory evaluation, panelists were asked to make comments about the samples
(Table 5.4.2). The control received many positive and neutral comments, and LMFS received a
large number of negative comments, such as “very metallic flavors” or “bad taste”. SMFS
received a mixed of different comments; some panelists dislike this sample but others really
enjoyed it. Some panelists commented on SMFS being their favorite sample. Decreasing
particle size for micro-encapsulated ferrous sulfate, from 700-1000 µm to 220-422 µm, produced
better results for flavor and overall acceptability in Cheddar cheese. Even though there is limited
information about fortificant size impact on food fortification and sensory changes, it was
observed that iron distinct color and flavor were better masked when using a smaller micro-
encapsulated iron particle size.

57
Also, in order to have a more complete sensory understanding of the iron fortified
Cheddar cheese, during sensory evaluation panelists were asked to describe texture and flavor
attributes from a given list (Table 5.4.3 and Table 5.4.4). For texture, half of the panelists
(~50%) agreed that all samples were considered to have firm texture. For flavor, the control was
described as buttery and salty by ~50% of the panelists. For LMFS and SMFS samples, metallic
flavors were perceived by more than 30% of the panelists. Moldy flavor was selected by ~20%
of the panelists for the iron treatments. Metallic and moldy flavors were very low for the control
(< 5%). Vinegary flavor doubled for the iron treatments, from 7.9% in the control to 19.8% for
LMFS treatment and 16.8% for SMFS treatment. It is noticeable that untrained panelists were
not familiar with iron sensory attributes since vinegary and moldy attributes were selected
instead of more appropriate words like “metallic” or “rancid”. In summary, texture and flavor
attribute description is in agreement with the idea that iron treatments were scored significantly
lower than the control because of iron unique flavor, color and odors. Both iron treatments,
LMFS and SMFS were scored significantly lower than the control in the present study.
Table 5.4.3. Texture attributes described by consumer acceptance panel (n = 101) during
sensory evaluation of Cheddar cheese fortified with micro-encapsulate ferrous sulfate.
Attribute Control (%) LMFS (%) SMFS (%)
Firm 68.3 47.5 53.5
Soft 34.7 40.6 28.7
Very hard 5 5 5
Grainy 6.9 6.9 5.9
Rubbery 31.7 25.7 34.7
Crumbly 25.7 25.7 24.8
Runny 1 2 1
Dry 12.9 17.8 25.7
Chewy 34.7 26.7 24.8
None 0 1 1

58
Table 5.4.4. Flavor attributes described by consumer acceptance panel (n=101) during sensory
evaluation of Cheddar cheese fortified with micro-encapsulate ferrous sulfate.
Attribute Control (%) LMFS (%) SMFS (%)
Sour-acidic 21.8 29.7 25.7
Vinegary 7.9 19.8 16.8
Greasy 15.8 15.8 14.9
Sweet 13.9 5 10.9
Metallic 3 38.6 34.7
Buttery 64.4 21.8 33.7
Salty 47.5 31.7 27.7
Moldy 4 23.8 19.8
Spicy 0 1 0
Other 7.9 12.9 14.9
None 5.9 3 1

59
6.0 CONCLUSIONS AND RECOMMENDATIONS
During a 6 h fermentation, micro-encapsulated ferrous sulfate did not affect LAB growth
in Cheddar cheese starter culture. Some TA and pH values were different during the first 3 hours
of the fermentation. It was concluded starter culture activity was not affected by the addition of
micro-encapsulated ferrous sulfate since there were no differences in TA and pH recorded by the
end of the fermentation (6 h).
Fortification of Cheddar cheese with micro-encapsulated ferrous sulfate produced no
changes in fat, protein, ash, moisture, calcium, magnesium and zinc content. Micro-encapsulated
ferrous sulfate (LMFS and SMFS) were successfully retained in Cheddar cheese. Based on iron
content and percent recoveries, SMFS was better incorporated in Cheddar cheese. It was
concluded that smaller iron particles can easily attach to caseins and colloidal phosphate groups
during Cheddar cheese fortification. Regardless of the strong casein-iron affinity, it was found
that micro-encapsulated iron (Fe 2+ ) addition caused no divalent cation balance disturbances.
Iron fortification did not initiate any in lipid oxidation reactions. TBARS were very low
and did not change over a 90-day aging period. Micro-encapsulation of iron (Fe 2+) with palm
oil as the coating material, successfully prevented lipid oxidation reactions in Cheddar cheese.
In order to draw accurate conclusions about the effect of micro-encapsulated ferrous salts on
milkfat oxidation it is recommended to perform additional testing, such as the Peroxide Value
assay, GC chromatography or Nuclear-Magnetic resonance.
Consumer acceptance demonstrated that iron fortification negatively affected Cheddar
cheese sensory attributes. Iron treatments were constantly scored lower in appearance, texture,
flavor and overall acceptability. Micro-encapsulation of ferrous sulfate failed to mask iron
distinct taste, color and odors. SMFS and LMFS flavor and overall acceptability scores were

60
significantly different showing the potential of reducing particle size for decreasing sensory
changes caused by iron.
Micro-encapsulated ferrous sulfate caused no major chemical changes in Cheddar cheese
but the selected fortification dose (30% Fe RDA, 4.5 mg Fe/ 28 g) failed to produce acceptable
sensory results. Results in this study can be very useful in future fortification, size particle and
micro-encapsulation research. In this study, small micro-encapsulated ferrous sulfate salts
(SMFS; 220-422 µm diameter) showed some potential to reduce negative sensory changes in
Cheddar cheese. Future research can include utilizing SMFS at a different iron fortification dose
(lower than 4.5 mg Fe/ 28 g) in order to observe any potential benefit. Also, to analyze the
possible effect of reducing particle size diameter further than 220-422 µm, decreasing particle
according to the results in this study can enhance product acceptability in iron fortified foods. A
consumer panel like the one selected in this study is recommended to test acceptability of new
products but also a descriptive analysis using a trained panelists is recommended in order to fully
understand the perceptions and attributes perceived in the iron fortified foods.
It is important to continue working with ferrous sulfate, such as micro-encapsulated
ferrous sulfate, since it is considered the standard in iron fortification because high
bioavailability and absorption. The alarming numbers in anemia and iron deficiency cases
around the world is desperately calling for a solution, according to the WHO, iron fortification is
the most effective and cost-efficient solution.

61
APPENDICES

62
APPENDIX A: Flyer for recruiting panelists for the sensory evaluation of iron fortified
Cheddar cheese.
Figure 7.1.1 Iron fortified Cheddar cheese sensory evaluation flyer.

63
APPENDIX B: Sensory questionnaire
Product: Cheddar Cheese (Consumer Panel ~ 100).
General: You will be provided with 3 cheese samples labeled with 3-digit codes, please rate each individual sample using the scale provided. Remember to rinse your mouth with water and saltine crackers between samples.
Instruction 1: Before tasting any sample look at all samples and rate the intensity of the color and overall appearance.
1. Do you like the Overall Appearance in sample #?
#522 _______
#169 _______
#672 ______
Comments: If you notice any color differences, what sample do you think differs the most and how?
2. Do you like the Texture in sample #? (Please, rinse your mouth with water and saltine crackers between samples).
#522 _______
#169 _______
#672 ______
9- Like it very much 8- 7- 6- 5- neither like or dislike 4- 3- 2- 1-Extremely dislike
9- Like it very much 8- 7- 6- 5-Neither like or dislike 4- 3- 2- 1-Extremely dislike

64
3. In terms of Texture, mark all attributes that apply to sample #: (Please, rinse your mouth with water and saltine crackers between samples).
#522 _______
#169 _______
#672 ______
4. Do you like the Flavor for sample #? Please, rinse your mouth with water and saltine crackers between samples).
#522 _______
#169 _______
#672 ______
o Firm o Soft o Very Hard o Grainy o Rubbery o Crumbly o Runny o Dry o Chewy
9- Like it very much 8- 7- 6- 5- neither like or dislike 4- 3- 2- 1-extremely dislike

65
5. In terms of Flavor, mark all attributes that apply to sample #: (Please, rinse your mouth with water and saltine crackers between samples).
#522 _______
#169 _______
#672 ______
Comments:
6. When comparing the three samples, how you will rate your Overall Preference for sample #? Please, rinse your mouth with water and
saltine crackers between samples
#522 _______
#169 _______
#672 ______
Demographics Questions:
1) How often do you eat Cheddar cheese? 2) What’s your genre? M/F 3) What’s your age? <18, 19-25, 26-40, 41< 4) Would you buy Cheddar cheese labeled as “An excellent source of Iron” over regular Cheddar
cheese? 5) Any other comments?
9- Like it very much 8- 7- 6- 5- neither like or dislike 4- 3- 2- 1-extremely dislike
o Sour-acidic o Vinegary o Greasy o Sweet o Metallic o Buttery o Salty o Moldy o Spicy o Other

66
APPENDIX C: Consent form for Research Involving Human Subjects
SENSORY EVALUATION OF CHEDDAR CHEESE
TITLE OF THE RESEARCH
Effect of iron fortification on textural and sensory properties of cheese
INVITATION TO PARTICIPATE
You are invited to participate in this study, which compares the properties of cheese fortified
with food grade iron and cheese without iron.
PURPOSE OF THE STUDY
This study will evaluate sensory attributes and overall acceptability of iron fortified cheese.
BASIS FOR SUBJECT SELECTION
Subjects are selected based on their ability to detect differences in sensory attributes of cheese
without iron and cheese fortified with iron. Individuals with cold, sinus conditions or allergies to
a specific ingredient will not be asked to participate. The general adult population is used for
testing. Participants must be at least 18 years old.
POTENTIAL RISKS
The cheese samples to be evaluated contain the following ingredients: milk, cultures, annatto,
iron sulfate, rennet. All of these ingredients are USDA and/or FDA approved for use in foods
intended for human consumption and are being used at USDA/FDA approved levels. Each
product produced in a safe and wholesome manner according to USDA and/or FDA regulations.
These products samples pose no adverse health risk upon digestion, provided the subject has not
been identified as being susceptible to an allergic reaction to the previous listed product
ingredients. If you believe there is a potential of an allergic reaction upon ingesting the test
products, or you believe that participating will violate religious or cultural beliefs, notify the on-
site sensory evaluation coordinator and/or principal investigator immediately. You will be
released from participating in the study.
POTENTIAL BENEFITS
There are no direct benefits gained from participation in this study. However, your participation
provides valuable data for the development of iron fortified cheese. Information obtained from
this study will be published in appropriate scientific journals to expand our current knowledge in
enhancing the health values of cheese.
EXPLANATION OF PROCEDURES
You will be asked to sit at a booth and taste a number of numerically coded cheese samples. You
will be provided with water for rinsing your mouth between samples. The tasting exercise will
take a maximum of 25 minutes of your time, depending upon your speed of tasting. You will use
a sensory evaluation questionnaire form to record responses concerning specific product
attributes. Tasting will occur in Sensory Evaluation/Human Studies Laboratory located in Room
102 of the G. Malcom Trout (Food Science) Building.

67
ASSURANCE OF CONFIDENTIALITY
Any information obtained in connection with this study that could be identified with you will be
kept confidential by ensuring that all consent forms are securely stored and your privacy will be
protected to the minimum extent allowable by law. All data analyzed will be reported in an
aggregate format that will not permit associating subjects with specific responses or findings.
WITHDRAWAL FROM THIS STUDY
Participation in this study is voluntary. Your decision to refuse participation or discontinue
participation during this study will not affect your present or future relationship with the
principal investigator or Michigan State University.
COMPENSATION FOR PARTICIPATION
After you have completed your sensory testing session and turned in your sensory ballot, you
will be offered a choice of treats (i.e., candy or ice cream coupon) for your time and effort.
OFFER TO ANSWER QUESTION
If you have any question, please do not hesitate to contact the on-site sensory evaluation leader
and/or the principal investigator. You are voluntarily making a decision to participate in this
study today. Your signature certificates that you have decided to participate after having read the
information provided above and that you had an adequate opportunity to discuss this study with
the principal investigator and have had all your questions answered to your satisfaction. You will
be given a copy of this consent form for to keep upon request.
SIGNATURE OF INVESTIGATOR DATE
Abraham Arce
2115 S. Antony Hall
Food Science and Human Nutrition
Michigan State University, E. Lansing, MI 48824
E-mail: [email protected]
SIGNATURE OF SUBJECT DATE
In my judgment the subject is voluntarily and knowingly giving informed consent and possesses
the legal capacity to give informed consent to participate in this research study.

68
APPENDIX D: Application for the University Committee on Research Involving Human
Subjects
APPLICATION FOR INITIAL REVIEW
APPROVAL OF A PROJECT INVOLVING HUMAN SUBJECTS
Biomedical, Health Sciences Institutional Review Board (BIRB) Social Science, Behavioral, Education Institutional Review Board (SIRB)
207 Olds Hall, Michigan State University East Lansing, MI 48824-1047
Phone: (517) 355-2180 Fax: (517) 432-4503 E-mail: [email protected]
Office Hours: M-F (8:00 A.M.-5:00 P.M.)
IRB#: x15-818e APPLICATION ID#: i049058
Title of Project: Effect of iron fortification on textural and sensory properties of Cheddar cheese.
Responsible Project Investigator:
Zeynep Ustunol Mailing Address:
2105 S. Anthony Hall MSU
Identification Number:
XXX-XX-1560 Phone: 353-3411
Department: FOOD SCIENCE & HUMAN NUTRITION
Fax: 517-353-1676
College: AGRICULTURE & NATURAL RESOURCES
Email: [email protected]
Academic Rank: Professor

69
The Human Research Protection Program (HRPP) has deemed this project as exempt, in accord with federal regulations for projects exempt from Institutional Review Board (IRB) review. As an exempt protocol, the appropriate IRB will not be further involved with the review or continued review of the project, as long as the project maintains the properties that make it exempt.
Since the HRPP is no longer involved in the review and continued review of this project, it is the Principal Investigator who assumes the responsibilities for protection of human subjects in this project and ensures that the project is performed with integrity and within accepted ethical standards, particularly as outlined by the Belmont Report (see exempt educational materials).
The Principal Investigator assumes responsibility for ensuring that the research subjects be informed of the research through a documented or undocumented consent process, if appropriate.
The Principal Investigator assumes the responsibility to maintain confidentiality of the subjects and the data, and maintain the privacy of the subjects and protection of the data through appropriate means. If data is anonymous, the investigators will make no attempt to identify any individuals.
The Principal Investigator assumes the responsibility that co-investigators and other members of the research team adhere to the appropriate policies to protect human subjects, maintain confidentiality and privacy, and adhere to accepted ethical standards.
If the Principal Investigator adds additional investigators to an exempt protocol, he/she may inform the HRPP of the additions. This may be of particular importance to graduate students if the Graduate School requires proof of IRB approval.
Any complaints from participants regarding the risk and benefits of the project must be reported to the HRPP.
Since the Principal Investigator and co-investigators are charged with human subject protection and adhering to ethical principles in exempt research, it is appropriate that investigators be trained in human subject principles. The Principal Investigator and all members of the research team are required to complete MSU IRB educational requirements or equivalent.
Any change in the protocol which may raise the project from exempt to an expedited or full review category must be presented to the HRPP. If there is any question about a change in protocol the Principal Investigator should consult the Director of the HRPP. Failure to submit changes which raise the protocol out of the exempt category will be considered non-compliance and will be subject to investigation and action by the HRPP.
I accept responsibility for conducting the proposed research in accordance with the protections of human subjects as specified by the IRB, including the supervision of faculty and student co-investigators. There will be adequate resources and facilities to carry out the research.
By signing below, the Principal Investigator assures that he/she will abide by the terms of this assurance and the HRPP exempt policy.
SIGN HERE:
____________________________________________________________
Date:
____________________________________________________________
Thank you for submitting your IRB application online. You can access your full application and view its status from the main IRB application page (http://35.8.104.116:591/ucrihs/ucrihs_main/pi_search.htm). Please remember that you cannot begin your research until you have received an approval letter from the IRB.

70
APPENDIX E: IRB exemption for sensory evaluation

71
APPENDIX F: Standard Plate Counts (SPC) for micro-encapsulated ferrous sulfate salts.
Table 7.6.1. Microbial counts for LMFS (1 g) and SMFS (1g) plated
on Standard Plate Count (SPC) agar.
Treatment CFU/g
Control < 10
LMFS < 10
SMFS < 10

72
APPENDIX G: Reference Material content using AAS
Table 7.7.1. Calculated mineral content (μg/g) for bovine liver using atomic absorption
spectroscopy. Reference Material 1577b, National Institute of Standards and Technology.
Iron Calcium Magnesium Zinc
Reference content 184 + 15 116 + 4 601 + 28 127 + 16
Experimental content 185.7 124.4 539.4 137.4

73
APPENDIX H: Certificate of Analysis for protein content

74

75

76

77

78
APPENDIX I: LMFS description and details provided by the manufacturer

79

80
APPENDIX J: SMFS description and details provided by the manufacturer

81

82
REFERENCES

83
REFERENCES
Advisory Committee of the Pediatric Section of the Michigan State Medical Society. 1937. A
Study of the Effect of the Use of Iodized Salt on the Incidence of Goiter. Journal of the Michigan
State Medical Society. 36:647–55
Allen L, de Benoist B, Dary O and Hurrell R. 2006. Guidelines on food fortification with
micronutrients. WHO Press. World Health Organization. Geneva, Switzerland.
Aller K, Adamberg K, Timarova V, Seiman A, Feštšenko D, and Vilu R. 2014. Nutritional
requirements and media development for lactococcus lactis IL1403.Applied Microbiology and
Biotechnology. 98.13: 5871-5881. doi:10.1007/s00253-014-5641-7
Asha A, Manjunatha M, Rekha RM, Surendranath B, Heartwin P, Rao J, and Sinha C. 2015.
Antioxidant activities of orange peel extract in ghee (butter oil) stored at different storage
temperatures. Journal of Food Science and Technology. 52.12: 8220-8227. doi:10.1007/s13197-
015-1911-3
Bailey RL, West J, Keith P and Black RE. 2015. The epidemiology of global micronutrient
deficiencies. Annals of Nutrition & Metabolism. 66 Suppl 2: 22-33. doi:10.1159/00037161
Barriuso B, Astiasarán I and Ansorena D. 2013. A review of analytical methods measuring lipid
oxidation status in foods: A challenging task. European Food Research and Technology. 236.1:
1-15. doi:10.1007/s00217-012-1866-9
Beresford Tom, Fitzsimons NA, Brennan NL and Cogan TM. 2001. Recent advances in cheese
microbiology. International Dairy Journal. 11: 259-274.
Bishai David. 2002. The history of food fortification in the United States: Its relevance for
current for current fortification in developing countries. Economic Development and Cultural
Change. Vol 51.1. The University Chicago Press.
Black RE. 2014. Global distribution and disease burden related to micronutrient
deficiencies. International Nutrition: Achieving Millennium Goals and Beyond. 78.
doi:10.1159/000354932
Blanco-Rojo R, Pérez-Granados AM, Toxqui L, González-Vizcayno C, Delgado MA and
Vaquero M. 2011. Efficacy of a microencapsulated iron pyrophosphate-fortified fruit juice: A
randomised, double-blind, placebo-controlled study in spanish iron-deficient women. British
Journal of Nutrition. 105.11: 1652-1659.
Bothwell TH, Charlton RW, Cook J and Finch C. 1979. Iron Metabolism in Man. Quaterly
Journal of experimental physiology and cognate medical sciences. 65.3: 255-256.

84
Brody T. 2011. Iron deficiency anemia. The Gale Encyclopedia of Medicine. Gale Group.
Farmington, MI. USA. 2411-2414.
Camaschella C. 2015. Iron-deficiency anemia. The New England Journal of Medicine. 372.19:
1832-1843. doi:10.1056/NEJMra1401038
Cherayil BJ. 2010. Iron and immunity: Immunological consequences of iron deficiency and
overload. Archivum Immunologiae Et Therapiae Experimentalis. 58.6: 407-415.
doi:10.1007/s00005-010-0095-9
Chich JF, Marchesseau K and Gripon JC. 1997. Intracellular esterases from Lactococcus lactis
subsp. lactis NCDO 763: Purification and characterisation. Int. Dairy Journal. 7: 169-174.
Dairy Practices Council. 1993. Guideline 53—Vitamin Fortification of Fluid Milk Products.
Dairy Practices Council, Keyport, NJ.
de Benoist B, McLean E, Andersson M and Rogers L. 2008 Iodine deficiency in 2007: global
progress since 2003. Food Nutr Bull 29: 195–202. Available
on: http://press.endocrine.org.proxy2.cl.msu.edu/doi/full/10.1210/er.2009-
0011#sthash.Dqw6FaBv.dpuf. Accessed on: 2016 February 23.
Desmazeaud M. 1996. Growth Inhibitors of Lactic Acid Bacteria. In Dairy Starter Cultures.
VCH Publishers, Inc. New York, New York. United States. 5: 131-153
Dewettinck K, Van Bockstaele, F, Kühne B, Van de Walle D, Courtens TM and Gellynck X.
2008. Nutritional value of bread: Influence of processing, food interaction and consumer
perception. Journal of Cereal Science. 48.2: 243-257. doi:10.1016/j.jcs.2008.01.003
Dickson IR and Perkins DJ. 1971. Studies on the Interactions between Purified Bovine Caseins
and Alkaline-Earth-Metal Ions.The Biochemical journal. 124.1: 235-40.
Dolly P, Anishaparvin A, Joseph GS and Anandharamakrishnan C. 2011. Microencapsulation of
lactobacillus plantarum (mtcc 5422) by spray-freeze-drying method and evaluation of survival in
simulated gastrointestinal conditions. Journal of Microencapsulation. 28.6: 568-574.
dos Santos Q, Nilson EAF, Verly Junior E and Sichieri R. 2015. An evaluation of the
effectiveness of the flour iron fortification programme in brazil. Public Health Nutrition. 18.9:
1670-1674.
Dubey R, Shami T and Rao K. 2009. Microencapsulation technology and applications. Defence
Science Journal. 59.1: 82-95. doi:10.14429/dsj.59.1489
Edris AE, Kalemba D, Adamiec J and Piątkowski M. 2016. Microencapsulation of nigella sativa
oleoresin by spray drying for food and nutraceutical applications. Food Chemistry. 204: 326-
333.

85
Even S, Lindley ND, Loubiere P and Cocaign-Bousquet M. 2002. Dynamic response of catabolic
pathways to autoacidification in Lactococcus lactis: transcript profiling and stability in relation to
metabolic and energetic constraints. Molecular Microbiology. 45:1143–1152
Ewusie JE, Ahiadeke C, Beyene, J and Hamid JS. 2014. Prevalence of anemia among under-5
children in the ghanaian population: Estimates from the ghana demographic and health
survey. BMC Public Health. 14.1: 626-626. doi:10.1186/1471-2458-14-626
Farkye N and Nagendra S. 2015. Milk proteins. In: Zeynep Ustunol, editor. Applied Food
Protein Chemistry. John Wiley & Sons, Ltd. West Sussex, UK. p 427-458.
FDA. 2016a. Milk. United States Code of Federal Regulations Title 21. 131.110. U.S. Food Drug
Administration. Available on: https://www.gpo.gov/fdsys/pkg/CFR-2006-title21-vol2/pdf/CFR-
2006-title21-vol2-sec131-110.pdf. Accessed on: 2016 January 02.
FDA. 2016b. Mozzarella. United States Code of Federal Regulations Title 21. 133.155. U.S.
Food Drug Administration. Available on: https://www.gpo.gov/fdsys/pkg/CFR-2006-title21-
vol2/pdf/CFR-2006-title21-vol2-sec133-155.pdf. Accessed on: 2016 January 02.
FDA. 2016c. Cheddar cheese. United States Code of Federal Regulations Title 21. 133.113. U.S.
Food Drug Administration. Available on: https://www.gpo.gov/fdsys/pkg/CFR-2006-title21-
vol2/pdf/CFR-2006-title21-vol2-sec133-113.pdf. Accessed on: 2016 January 02.
FDA. 2016d. Enriched Flour. United States Code of Federal Regulations Title 21. 131.110. U.S.
Food Drug Administration. Available on: https://www.gpo.gov/fdsys/pkg/CFR-2006-title21-
vol2/pdf/CFR-2006-title21-vol2-sec131-110.pdf. Accessed on: 2016 January 02. Available on:
http://www.accessdata.fda.gov/scripts/cdrh/cfdocs/cfcfr/CFRSearch.cfm?fr=137.165. Accessed
on 2016 February 2.
Ferreira CD, da Conceição E, Linhares J, Machado BAS, Hermes VS, de Oliveira Rios A,
Druzian JI and Nunes IL. 2016. Physicochemical characterization and oxidative stability of
microencapsulated crude palm oil by spray drying. Food and Bioprocess Technology. 9.1:124-
136
Fiedler John L and Barbara Macdonald. 2009. A strategic approach to the unfinished fortification
agenda: Feasibility, costs, and cost-effectiveness analysis of fortification programs in 48
countries. Food and Nutrition Bulletin. 30.4: 283.
Flynn A and Power P. 1985. Nutritional aspects of minerals in bovine and human milks. In: Fox
PF, editor. Developments in Dairy Chemistry. Vol 3. Lactose and minor constituents. Elsevier
Applied Science. London, UK. 183-215.
Fox PF and McSweeney PLH. 1998. Salts of milk. In: Fox PF, Uniacke-Lowe T, O’Mahony JA,
editors. Dairy Chemistry and Biochemistry. Thomson Science. New York, NY, USA. 239-264.

86
Frankel Edwin. 2014. Photooxidation of unsaturated fats. In: Lipid Oxidation, Frankel Edwin,
editor. 2e. Woodland Publishing. Cambridge, UK. p 51-66.
Fulgoni 3, Victor L, Keast, DR., Bailey, RL and Dwyer J. 2011. Foods, fortificants, and
supplements: Where do americans get their nutrients? The Journal of Nutrition. 141.10: 1847-
1854. doi:10.3945/jn.111.142257
Georgieff MK. 2011. Long‐term brain and behavioral consequences of early iron
deficiency. Nutrition Reviews. 69.11: 43-48. doi:10.1111/j.1753-4887.2011.00432.x
Gibson RS, Heath AM and Szymlek-Gay EA. 2014. Is iron and zinc nutrition a concern for
vegetarian infants and young children in industrialized countries? The American Journal of
Clinical Nutrition. 100 Suppl 1.1: 459S-468S. doi:10.3945/ajcn.113.071241
Gonzalez-Martin I, Hernandez-Hierro JM, Revilla I, Vivar-Quintana A, Lobos-Ortega I and
Gonzalez-Perez C. 2009. Changes in the Mineral Content in Cheeses of Different Compositions
during 6 months of Ripening. Czech J. Food Science. 27: 114-118.
Hess A. 1932. The Role of Activated Milk in the Anti-rickets Campaign. American Journal of
Public Health. 22: 1215–19.
Hickey D, Kilcawley K, Beresford T and Wilkinson M. 2006. Starter bacteria are the prime
agents of lipolysis in cheddar cheese. Journal of Agricultural and Food Chemistry. 54.21: 8229-
8235. doi:10.1021/jf060819h
Horton S, Alderman H and Rivera J. 2008. Hunger and malnutrition. Copenhagen consensus:
Malnutrition and Hunger. In: Lomborg B. Global crises, global solutions. Cambridge, United
Kingdom. Cambridge University Press; 2009. p 305–33.
IDFA. 2015. Cheese production. International Dairy Foods Association. Available on:
http://www.idfa.org/news-views/media-kits/cheese/cheese-production. Accessed on: 2016 May
02.
Institute of Medicine. 2002. DRI dietary reference intakes for energy, carbohydrates, fiber, fat,
protein and amino acids (Macronutrients). Washington, DC. National Academy Press.
Jenkins TC and McGuire MA. 2006. Major advances in nutrition: Impact on milk composition. J
of Dairy Science. 89.4: 1302-1310. doi:10.3168/jds.S0022-0302(06)72198-1
Jiang T, Christian P, Khatry S, Wu L and West K. 2005. Micronutrient deficiencies in early
pregnancy are common, concurrent, and vary by season among rural nepali pregnant
women. Journal of Nutrition. 135.5: 1106-1112.

87
Kahraman O and Zeynep U. 2012. Effect of zinc fortification on Cheddar cheese quality.
American Dairy Science Association. 95:2840-2847.
Kar S, Ray S, Pharvee I and Sarkar A. 2014. Calcium intake and calcium deficiency in toddlers
in a slum population of bhubaneswar. Indian Journal of Community Health. 26.6: 156-159.
Keast DR, Fulgoni 3, Victor Nicklas TA and O'Neil CE. 2013. Food sources of energy and
nutrients among children in the united states: National health and nutrition examination survey
2003–2006. Nutrients. 5.1: 283-301. doi:10.3390/nu5010283
Kiskini A, Kapsokefalou M, Yanniotis S and Mandala I. 2012. Effect of iron fortification on
physical and sensory quality of gluten-free bread. Food and Bioprocess Technology. 5.1: 385-
390. doi:10.1007/s11947-011-0651-2
Kurtz FE, Tamsma A and Pallansch MJ. 1973. Effect of fortification with iron on susceptibility
of skim milk and nonfat dry milk to oxidation. Journal of Dairy Science. 56.9: 1139-1143.
doi:10.3168/jds.S0022-0302(73)85323-8
Larsen N, Werner B, Vogensen F and Jespersen L. 2015. Effect of dissolved oxygen on redox
potential and milk acidification by lactic acid bacteria isolated from a DL-starter culture. Journal
of Dairy Science. 98.3: 1640-1651. doi:10.3168/jds.2014-8971
Layrisse M. 1996. Early response to the effect of iron fortification in the Venezuelan population.
American Journal of Clinical Nutrition. 64: 903–907.
Layrisse, M, García-Casal MN, Méndez-Castellano H, Jiménez M, Henry O, Chávez JE and
González E. 2002. Impact of fortification of flours with iron to reduce the prevalence of anemia
and iron deficiency among schoolchildren in Caracas, Venezuela: A follow-up. Food and
Nutrition Bulletin. 23.4: 384.
Malpeli A, Ferrari M G, Varea A, Falivene M, Etchegoyen G, Vojkovic M and Gonzalez HF.
2013. Short-term evaluation of the impact of a fortified food aid program on the micronutrient
nutritional status of argentinian pregnant women. Biological Trace Element Research. 155.2:
176-183. doi: 10.1007/s12011-013-9780-y
Martorell R, Ascencio M, Tacsan L, Alfaro T, Young M,Yaw Addo O, Dary O and Flores-Ayala
R. 2015. Effectiveness evaluation of the food fortification program of Costa Rica: Impact on
anemia prevalence and hemoglobin concentrations in women and children. The American
Journal of Clinical Nutrition 101.1: 210-7
Mathur SC, Schexneider KI and Hutchison RE. Hematopoiesis. In: McPherson RA, Pincus MR.
2011. Henry's Clinical Diagnosis and Management by Laboratory Methods. 22nd. Philadelphia,
Pa: Elsevier Saunders.

88
Mehta BM, Aparnathi KD and Darji VB. 2015. Comparison of different methods of monitoring
the secondary stage of oxidation of ghee. International Journal of Dairy Technology. 68.4: 589-
594. doi:10.1111/1471-0307.12232
Mildon A, Klaas N, O’Leary M and Yiannakis M. 2015. Can fortification be implemented in
rural african communities where micronutrient deficiencies are greatest? Lessons from projects
in malawi, tanzania, and senegal. Food and Nutrition Bulletin 36.1: 3.
Mittal VA, Ellis A, Ye A, Edwards PJB, Das S and Singh H. 2016. Iron binding to caseins in the
presence of orthophosphate. Food Chemistry. 190: 128-134.
doi:10.1016/j.foodchem.2015.05.066
Motzok I, Pennell, MD, Davies, MI and Ross HU. 1975. Effect of particle size on the
bioavailability of reduced iron. J. Assoc. Off. Anal. Chem. 58:99-103.
Nesterenko A, Alric I, Silvestre F and Durrieu V. 2014. Comparative study of encapsulation of
vitamins with native and modified soy protein. Food Hydrocolloids. 38: 172-179.
doi:10.1016/j.foodhyd.2013.12.011
Nuchi C, Guardiola F, Bou R, Bondioli P, Della Bella L and Codony R. 2009. Assessment of the
levels of degradation in fat co-and byproducts for feed uses and their relationships with some
lipid composition parameters. Journal of Agricultural and Food Chemistry. 57.5: 1952–1959
On-Nom N, Grandison AS and Lewis MJ. 2010. Measurement of ionic calcium, pH, and soluble
divalent cations in milk at high temperature. Journal of Dairy Science. 93.2: 515-523.
doi:10.3168/jds.2009-2634
Palmer M. 2014. CH 17: Iron and heme metabolism. Human Metabolism. Department of
Chemistry, University of Waterloo. Available on:
http://watcut.uwaterloo.ca/webnotes/PDF/MetabolismNotes.pdf. Accessed on 2016 March 12.
Pathak P, Kapil U, Kapoor SK, Saxena R, KumarA, Gupta N and Singh P. 2004. Prevalence of
multiple micronutrient deficiencies amongst pregnant women in a rural area of haryana. The
Indian Journal of Pediatrics. 71.11: 1007-1014. doi:10.1007/BF02828117
Patiño E, Faisal E, Cedres J, Mendez F and Guanziroli-Stefani C. 2005. Contenido mineral de
leche de búfalas (Bubalus bubalis) en Corrientes, Argentina. Revista Veterinaria. 16: 40–42.
Pérès J, Bouhallab S, Bureau F, Maubois J, Arhan P and Bouglé D. 1999. Reduction of iron/zinc
interactions using metal bound to the caseinophosphopeptide 1–25 of β-casein. Nutrition
Research. 19.11: 1655-1663. doi:10.1016/S0271-5317(99)00121-9
Philippe M, Le Graët, Y and Gaucheron F. 2005. The effects of different cations on the
physicochemical characteristics of casein micelles. Food Chemistry. 90.4: 673-683.
doi:10.1016/j.foodchem.2004.06.001

89
Prom-u-thai C, Rerkasem B, Fukai S and Huang L. 2009. Iron fortification and parboiled rice
quality: Appearance, cooking quality and sensory attributes. Journal of the Science of Food and
Agriculture.89.15: 2565-2571. doi:10.1002/jsfa.3753
Raouche S, Dobenesque M, Bot A, Lagaude A and Marchesseau S. 2009. Casein micelles as a
vehicle for iron fortification of foods. European Food Research and Technology. 229.6: 929-935.
doi:10.1007/s00217-009-1130-0
Rice WH and McMahon DJ .1998. Chemical, physical, and sensory characteristics of mozzarella
cheese fortified using protein-chelated iron or ferric chloride. Journal of Dairy Science. 81.2:
318-326.
Ruggirello M, Paola D and Luca C. 2014. Detection and Viability of Lactococcus Lactis
Throughout Cheese Ripening: E114280. PLoS One 9.12.
Ryan M, Rea M, Hill C and Ross R. 1996. An Application in cheddar cheese manufacture for a
strain Lactococcus lactis producing a novel broad-spectrum bacteriocin, lacticin 3147. Apply
Environtal Microbiology. 62: 612.
Sadava D, Heller CH, Orians GH, Purves WK and Hillis DM. Life: The Science of Biology 8th
Edition. Massachusetts and Virginia: Sinauer Associates Inc. and W.H. Freeman and Company,
2008. Print.
Salih A, Smith D, Price J and Dawson L. 1987. Modified extraction 2-thiobarbituric acid method
for measuring lipid oxidation in poultry. Poultry Science. 66.9: 1483-1488.
Sandine WE. 1996. Commercial Production of Dairy Starter Cultures. CH 7. In Dairy Starter
Cultures. Cogan TM and Accolas JP. 191-204. National Dairy Products Research Centre.
Country of Cork, Ireland.
Sebastian R, Goldman J, Wilkinson C and LaComb R. 2010. Fluid Milk Consumption in the
United States. Food Surveys Research Group. Dietary Data Brief No. 3. Available on:
https://www.ars.usda.gov/SP2UserFiles/Place/80400530/pdf/DBrief/3_milk_consumption_0506.
pdf. Accessed on: 2016 April 23.
Semeniuc CA, Mandrioli M, Rodriguez-Estrada MT, Muste S and Lercker G. 2016.
Thiobarbituric acid reactive substances in flavored phytosterol-enriched drinking yogurts during
storage: Formation and matrix interferences.European Food Research and Technology. 242.3:
431-439. doi: 10.1007/s00217-015-2554-3
Seshadri S. 2001. Prevalence of micronutrient deficiency particularly of iron, zinc and folic acid
in pregnant women in south East Asia. British Journal of Nutrition. 85. S2:8 7-92.
doi:10.1049/BJN2000299

90
Shamberger RJ and Shamberger BA,Willis CE. 1977. Malonaldehydecontent of food. Journal of
Nutrition. 107:1404–1409.
Simova E, Ivanov G and Simov Z. 2008. Growth and activity of bulgarian yogurt starter culture
in iron-fortified milk. Journal of Industrial Microbiology & Biotechnology. 35.10: 1109-1115.
doi:10.1007/s10295-008-0389-7
Smith Nkhata. 2013. Iron fortification of yogurt and pasteurized milk. Unpublished Master’s
Thesis. College of Agriculture and Natural Resources, Department of Food Science and Human
Nutrition. Michigan State University.
Sugiarto M, Ye A,Taylor MW and Singh H. 2010. Milk protein–iron complexes: Inhibition of
lipid oxidation in an emulsion. Dairy Science and Technology. 90: 87–98.
Tazhibayev S, Oksana D, Galina G, Khotambek K, Feruza O, Dalkhjav O, Dilorom S and Nevin
S. 2008. Evaluation of the potential effectiveness of wheat flour and salt fortification programs in
five central asian countries and mongolia, 2002-2007. Food and Nutrition Bulletin. 29.4: 255.
Tennant GA. 2014. Nutrition and pregnancy: Folate and folic acid. International Journal of
Childbirth Education. 29.3: 25.
Turner MS, Tan YP and Giffard PM. 2007. Inactivation of an iron transporter in lactococcus
lactis results in resistance to tellurite and oxidative stress.Applied and Environmental
Microbiology. 73.19: 6144-6149. doi:10.1128/AEM.00413-07
U.S. Department of Health and Human Services. Healthy People 2010: Understanding and
improving health. 2nd ed. Washington, DC: U.S. Government Printing Office, November 2000.
Available from: www.healthypeople.gov/document/. Accessed 2016 April 21, 2010.
U.S. National Institute of Health. 2016. Nutrient Recommendations: Dietary Reference Intakes
(DRI). U.S. Department of Health & Human Services. Available on:
https://ods.od.nih.gov/Health_Information/Dietary_Reference_Intakes.aspx. Accessed on: 2016
February 27.
UNICEF. 2016. Micronutrients. Nutrition. Available on:
http://www.unicef.org/nutrition/index_iodine.html. Accessed on: 2016 January 7.
USDA Economic Research Service. 2016. U.S. Milk production and related data. Available on:
http://www.ers.usda.gov/data-products/dairy-data.aspx. Accessed on: 2016 April 01.
USDA National Nutrient Database for Standard Reference. 2016. Milk, cheddar cheese and
Mozzarella. Palm oil. Available on: https://ndb.nal.usda.gov/. Accessed: on 2016 April 25.

91
Ustunol Z and Hicks CL. 1990. Effect of calcium addition on yield of cheese manufactured with
endothia parasitica protease. Journal of Dairy Science. 73.1: 17-25.
Vasudevan P, Padmavathy V and Dhingra SC. 2002. Biosorption of monovalent and divalent
ions on baker's yeast. Bioresource Technology. 82.3: 285-289. doi:10.1016/S0960-
8524(01)00181-X
Walstra P and NetLibrary I. 1999. Dairy technology: Principles of milk properties and processes.
New York: Marcel Dekker. CH 6. 27-86, p 181.
Wang D, Kim BY, Kim DH, Lee KS, Yoon HJ, Cui Z and Jin BR. 2009. Molecular
characterization of iron binding proteins, transferrin and ferritin heavy chain subunit, from the
bumblebee bombus ignitus. Comparative Biochemistry and Physiology, Part B. 152.1: 20-27.
doi:10.1016/j.cbpb.2008.09.082
Weart EL. 1938. Milk: A Food or a Medicine. New Republic 93: 359–61.
Wegmuller R, Zimmermann M, Moretti D, Arnold M, Langhans W and Hurrell R. 2004. Particle
size reduction and encapsulation affect the bioavailability of ferric pyrophosphate in rats. Journal
of Nutrition 134:3301-3304.
West DW. 1986. Structure and diction of the phosphorylated residues of casein. Journal of Dairy
Research. 53: 333-352.
WHO. 2015. Global Database on Child Growth and Malnutrition. World Health Organization.
Department of Nutrition for Health and Development. CH 1211. Geneva 27. Available on:
http://www.who.int/nutgrowthdb/about/introduction/en/
WHO. 2016. Iron deficiency anemia. Micronutrient deficiencies. World Health Organization.
Available on: http://www.who.int/nutrition/topics/ida/en/. Accessed on: 2016 March 02.
Wong AYS, Chan EW, Chui CSL, Sutcliffe AG and Wong ICK. 2014. The phenomenon of
micronutrient deficiency among children in china: A systematic review of the literature. Public
Health Nutrition. 17.11: 2605-2618. doi:10.1017/S1368980013002978
Zhang and Metzger 2009. Organic acids. In: Handbook of dairy foods analysis. Nollet LML,
editor. Toldra F, Boca Raton FL: CRC Press.
Zhang D, and Mahoney AW. 1988. Effect of iron fortification on quality of cheddar
cheese. Journal of Dairy Science. 72.2. 322-332. doi:10.3168/jds.S0022-0302(89)79113-X
Zhang D and Mahoney AW. 1990. Effect of iron fortification on quality of cheddar cheese. 2.
effects of aging and fluorescent light on pilot scale cheeses. Journal of Dairy Science. 73.9.
2252-2258. doi: 10.3168/jds.S0022-0302(90)78905-9

92
Zhang D and Mahoney AW. 1991. Iron fortification of process cheddar cheese. Journal of Dairy
Science. 74.2: 353-358.
Zimmermann MB. 2009. Iodine deficiency. Endocrine Reviews 30.4: 376-408.


![1 INTRODUCTION IJSER · K2Cr2O7 ) and Ferrous sulfate (FeSO4.7H2O) which were ap- plied separately [8].Bacteria were inoculated on different solid media to attain biodegradability](https://img.pdfslide.us/doc/110x75/5d577ef588c993c1498bc106/1-introduction-ijser-k2cr2o7-and-ferrous-sulfate-feso47h2o-which-were-ap-.jpg)