Embed Size (px)
Citation preview
* Corresponding author: +234 – 802 – 358 – 3817
EFFECT OF LOCALLY SOURCED NIGERIAN GYPSUM ON THE
STRENGTH AND MICROSTRUCTURE OF PORTLAND
CEMENT MORTAR
A. D. Muhammad1, Y. D. Amartey2, J. M. Kaura3,*, T. S. Ijimdiya4 and A. Lawan5 1, 2, 3, 4, 5, DEPARTMENT OF CIVIL ENGINEERING, AHMADU BELLO UNIVERSITY, ZARIA, KADUNA STATE, NIGERIA
Email addresses: 1 [email protected], 2 [email protected], 3 [email protected], [email protected], 5 [email protected]
ABSTRACT
The objective of this study was to investigate the suitability of Nigerian, sourced Gypsum for the
manufacture of Portland cement. Gypsum samples were obtained from eighteen deposits across
Nigeria. These were classified into five purity groups based on their calcium sulphate content.
Foreign Gypsum, imported from Morocco, was used as control. Six cement samples where
produced for each of the five Gypsum purity groups by grounding and blending cement clinker
with 3%, 4%, 5%, 6% and 7% Gypsum content. The group 1 cement mix (having not more than
65% calcium sulphate content) has displayed flash set and could not be moulded and therefore
not used for further analysis. Cement mortar prisms were produced for the groups 2, 3, 4 and 5
cement mixes, and subjected to flexural and compressive strength tests at 7, 14, 21 and 28 day
curing periods. The cement mortar prisms were also subjected microstructure analysis at 7 and
28 days curing period. The spongy, gel and whitish colouration observed from the microstructure
of the specimens indicated silicates enriched regions which have proven the strength increase
from 7 to 28 day curing period. The optimum gypsum content of 5.5% was recommended. The
results show that all but the class one gypsum with less than 65% purity content are suitable
for cement manufacture.
Keywords: Gypsum, clinker, mortar, microstructure, compressive strength, flexural strength
1. INTRODUCTION
Systematic studies of the influence of gypsum
content on portland cement have shown that there
is an optimum content which produces the highest
strength and the lowest drying shrinkage [1]. In the
construction industry, strength is a primary criterion
in selecting a concrete for a particular application.
The hydration and hardening of cement is a process
that occurs over a long period. With the increase of
the hydrating degree of various clinker minerals in
cement particles, gels will grow and capillary
porosities will decrease, which enables the strength
to rise with the increase in age. It was proved that
cement develops rapidly within 28 days and slowly
thereafter [2]. Concrete has a heterogeneous
microstructure, which consists of three components,
namely: cement paste, pore structure, and interfacial
transition zone between the cement paste and
aggregates with the distribution of each affecting the
properties and performance of the material [3].
Improving these three components leads to
enhanced mechanical strength and durability of
concrete [4]. Data on crystal size, shape and
distribution in the microstructure of mortar provides
information on the strength development [5].
Microstructure is obtained using Scanning Electron
Microscopy (SEM). It is one of the most popular
imaging techniques. It has been extensively used for
material characterization, especially in combination
with energy dispersive X-ray microanalysis [3]. This
paper presents the results of the evaluation of the
influence of varying localy sourced Nigerian gypsum
Nigerian Journal of Technology (NIJOTECH)
Vol. 39, No. 4, October 2020, pp. 1001 – 1010 Copyright© Faculty of Engineering, University of Nigeria, Nsukka,
Print ISSN: 0331-8443, Electronic ISSN: 2467-8821
www.nijotech.com
http://dx.doi.org/10.4314/njt.v39i4.5
EFFECT OF LOCALLY SOURCED NIGERIAN GYPSUM ON THE STRENGTH AND MICROSTRUCTURE OF PORTLAND … A. D. Muhammad, et al
Nigerian Journal of Technology, Vol. 39, No. 4, October 2020 1002
addition on the strength and microstructure of
cement. This was achieved through flexural and
compressive strength tests as well as results
interpretation in conjunction with micrographs
obtained from scanning electron microscopy test.
The primary objective was the determination of the
optimum gypsum content required for the production
of good quality cement in terms of strength and
durability.
1.1 Background of the Study
Two of the main parameters that determines cement
quality are the setting time and the compressive
strength. Gypsum acts in parallel as a regulator of
both parameters. Thus, its impact on cement quality
of cement is dual and crucial. Gypsum addition
retards the fast-exothermic reaction of tricalcium
aluminate (3CaO.Al2O3/C3A) by forming ettringite.
Generally, C3A reacts with the calcium sulphate
phases basanite- CaSO4.0.5H2O, gypsum -
CaSO4.2H2O and anhydrite- CaSO4. [6].
However excessive amount of gypsum leads to
abnormal and detrimental expansion and
consequent disruption of the set cement paste.
Optimum gypsum content leads to a desirable rate
of early reaction and prevents local high
concentration of products of hydration. Hence
maximum limit needs to be clearly defined [7].
1.2 Literature Review
Mortars are porous materials with a heterogeneous
and complex structure, making difficult their
characterization. Today, the technological
development of cement-based materials is intimately
connected to the study of the microstructure and
porosity of those materials [8, 9].
The main source of strength in concrete is the
adhesion between the solid products of hydrated
cement paste. This adhesion can be attributed to the
van-der-waals forces of attraction with degree of
adhesion that depend on the nature of the solid
surfaces involved. Some of hydrated products, such
as calcium silicate hydrates (C-S-H) crystals, calcium
sulphoaluminate hydrates, and hexagonal calcium
aluminate hydrates, possess vast surface areas and
adhesive capability. Therefore, they tend to adhere
strongly to each other and at the same time to solids
with low surface areas such as lime, anhydrous
cement particles, and aggregate particles [10].
SEM image analysis has become an important tool
for microscopic studies of bio-aggregates based
materials [9, 11]. Walker and Pavia [11] studied the
microstructure and pore size of hemp lime concrete
using Field Emission SEM. The results showed that
the morphology of hemp interface changed over
time, from predominantly needle-shape at early ages
to sponge and gel types at later ages. In
consequence, the size of pores in hydrated cement
paste is reduced and strength is increased.
1.3 Role of Gypsum in Cement Production
When cement is mixed with water, it becomes hard
over a period of time. This is called setting of
cement. Gypsum is often added to portland cement
to prevent early hardening or “flash setting”,
allowing a longer working time. Gypsum slows down
the setting times so that cement is adequately
hardened.
The retardation mechanism of gypsum is: when
cement is hydrated, gypsum reacts with tri calcium
aluminate (C3A) quickly to generate calcium
sulphoaluminate hydrate which deposits and forms a
protection film on the cement particles to hinder the
hydration of C3A and delay the setting time of
cement. If the content of gypsum is too little, the
retardation effect will not be significant. Too much
gypsum will accelerate the setting of cement
because gypsum can generate a clotting agent itself.
The appropriate amount of gypsum depends on the
content of C3A in the cement and that of SO3 in
gypsum, and it is also related to the fineness of
cement and the content of SO3 in clinker. If the
content of gypsum exceeds the limit, it will lower the
strength of cement and it can even lead to poor
dimensional stability, which will cause expansion and
destruction of cement paste [4, 15]. The amount of
gypsum added to cement clinker is limited by
European Standard BS EN 197-1: 2000 [12].
2. MATERIALS AND METHODS
2.1 Materials
2.1.1 Gypsum
The local Gypsum samples were sourced from
Goronyo, Shagari, Wurno, Gada local government
areas of the North West geo-political zone, Fika,
Gulani, Fune, Yola South, Bajoga, Nafada, Alkaleri,
Karin-lamido, Kwaya-kusar, Bayo of the North East
zone, Egbado South of the South West Zone, Etsako
West and Obubra of the South south zone and
Ishielu local government area of the South East
Zone. The samples were screened and classified into
the three groups (group 2, 3 and 4) presented in
EFFECT OF LOCALLY SOURCED NIGERIAN GYPSUM ON THE STRENGTH AND MICROSTRUCTURE OF PORTLAND … A. D. Muhammad, et al
Nigerian Journal of Technology, Vol. 39, No. 4, October 2020 1003
Table 1. One imported Gypsum sample originated
from Morocco, was also sourced from the Obajana
plant of Dangote cement industries and coded as
group 5.
2.1.2 Sand
The Sand used for the tests was natural siliceous
sand consisting of rounded particles as prescribed in
the BS EN 196-1, 2000 [14], obtained from the
quality control laboratory of the cement company of
northern Nigeria, Sokoto.
2.1.3 Water
Ordinary tap water which is fit for drinking has been
used in preparing all mortar mixes and curing.
2.2 Methods
2.2.1 The Gypsum Purity
The purity of gypsum was obtained by the estimate
of its composition of CaO and SO3 content. The
composition of the CaO+SO3 for each of the nineteen
considered gypsum are presented in Table 1.0. The
elemental composition was established using X-Ray
Fluorescence Spectrometry (XRF).The eighteen
locally sourced Nigerian gypsum were classified into
three grades based on the calcium sulphate
(CaSO4.2H2O) contents, while the fourth grade was
for the imported gypsum, selected to enable us have
a comparative study with the locally sourced
product. The frequency distribution table was
formed based on the gypsum purity, presented in
Table 2.0
2.2.2 Production of the cement
In this study, thirty (30) cement samples were
produced by blending the cement clinker with the
locally sourced gypsum at various percentages at the
quality control laboratory of the Cement Company of
Northern Nigeria (CCNN) Sokoto using ball mixer.
The mix composition for the cement clinker/gypsum
blend is presented in Table 3.0.
All the cement mixes were subjected to specific
gravity, consistency and setting time tests. The
values obtained for the group 1 cement mixes with
respect to the specific gravity, fineness, consistency,
initial setting time, final setting time and soundness
ranged between (3.17 – m3.34), (4,057cm2/g –
4,275cm2/g), (50% - 61%), (4min – 8min0, (6min –
15min) and (9mm – 13mm) respectively. It is
therefore clear from this result that the consistency,
initial setting time, final setting time and soundness
could not meet the minimum requirement provided
by BS EN 197-1 [12]. Likewise due to very small
quantity of SO3 in the group 1 mix, resulting from the
low quality gypsum (lowest gypsum purity), flash
setting was obtained upon mixing with water. As
such, the cement group 1 mix could not be moulded.
Therefore, only cement groups 2, 3, 4 and 5 mixes
are considered for the production of the test
specimens.
Therefore, three Hundred and Fifteen (315)
prismatic cement mortar test specimens, 400 mm ×
400 mm × 16 mm in size were produced. These
specimens were cast from a batch of mortar
containing one part by mass of cement, 3 parts by
mass of CEN standard sand and one-half part of
water (water/cement ratio 0.50). The mortar was
prepared by mechanical mixing and was compacted
in a mould using a jolting apparatus. The specimens
were then stored in the mould in a moist atmosphere
for 24 hours and, after demoulding, specimens were
kept under water until the commencement of the
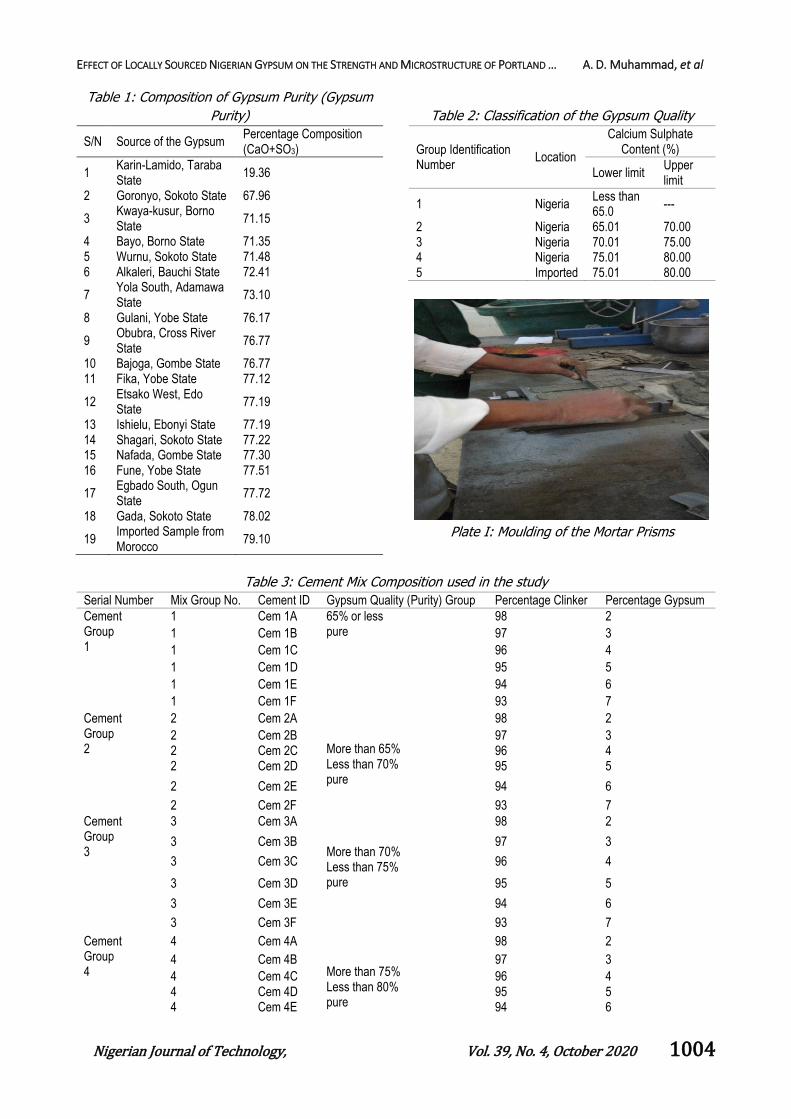
strength testing. At the ages of 7 and 28 days. Plate
I show the moulding process of the specimen. The
specimens were then subjected to flexural and
compressive strength tests in accordance with BS EN
196 part 1- 2000 [14], and NIS 446, 2003 [16]
specification.
Three-point bending test was used for the flexural
strength tests. The testing machine induce flexure
on specimen by means of two steel supporting rollers
approximately 100mm apart and the third steel
loading roller of the same diameter placed centrally
above between the other two. The reading is taken
when the specimen breaks into two halves. For the
determination of compressive strength, test halves
obtained from flexural tests were centered suitably
to the machine platens and loaded until the
specimen fractures. Also, microscopic analysis was
performed on the cement mortar with results
obtained using Scanning Electron Microscope (SEM).
4. RESULTS AND DISCUSSION
4.1 Flexural Strength of the Cement Mortar
Figures 1, 2, 3 and 4 show the variation of the
flexural strength of the cement mortar with gypsum
content for cement mix group 2, 3, 4 and 5
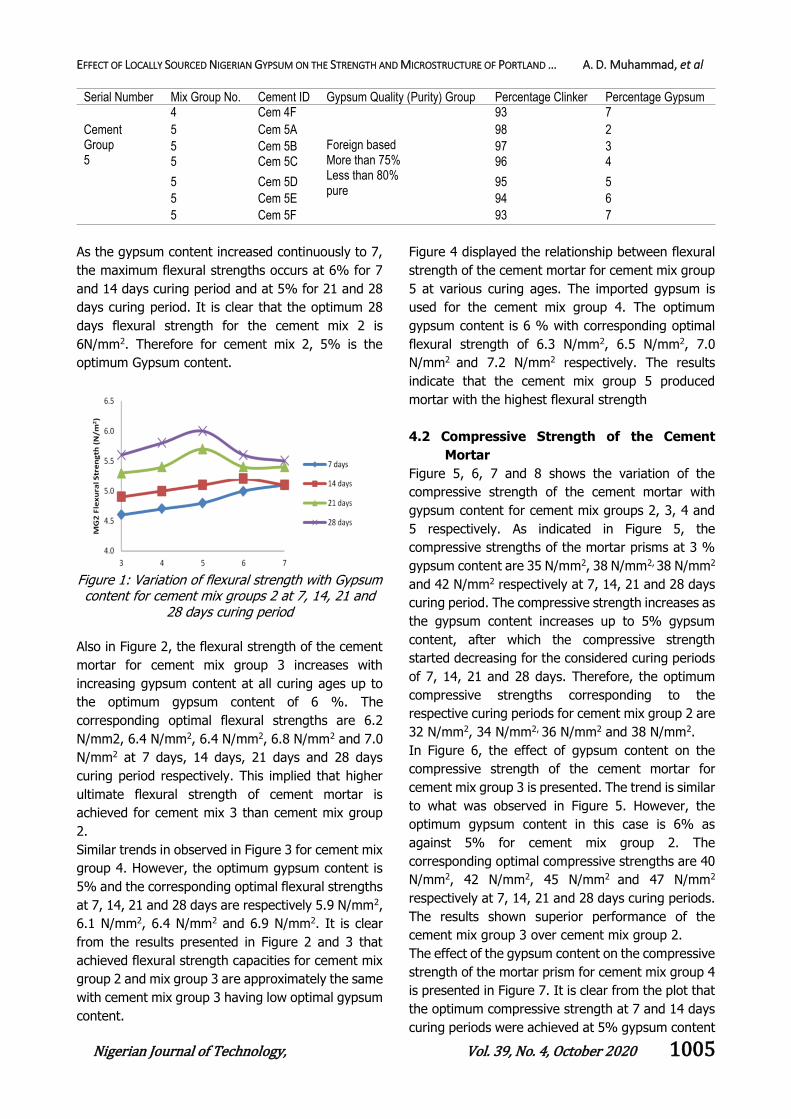
respectively. In Figure 1, the flexural strength of the
mortar with 3% gypsum content increased from
4.5N/mm2 at 7 days curing period to 4.9N/mm2,
5.3N/mm2 and 5.6N/mm2 respectively at 14 days, 21
days and 28 days curing period.
EFFECT OF LOCALLY SOURCED NIGERIAN GYPSUM ON THE STRENGTH AND MICROSTRUCTURE OF PORTLAND … A. D. Muhammad, et al
Nigerian Journal of Technology, Vol. 39, No. 4, October 2020 1004
Table 1: Composition of Gypsum Purity (Gypsum
Purity)
S/N Source of the Gypsum Percentage Composition (CaO+SO3)
1 Karin-Lamido, Taraba State
19.36
2 Goronyo, Sokoto State 67.96
3 Kwaya-kusur, Borno State
71.15
4 Bayo, Borno State 71.35 5 Wurnu, Sokoto State 71.48 6 Alkaleri, Bauchi State 72.41
7 Yola South, Adamawa State
73.10
8 Gulani, Yobe State 76.17
9 Obubra, Cross River State
76.77
10 Bajoga, Gombe State 76.77 11 Fika, Yobe State 77.12
12 Etsako West, Edo State
77.19
13 Ishielu, Ebonyi State 77.19 14 Shagari, Sokoto State 77.22 15 Nafada, Gombe State 77.30 16 Fune, Yobe State 77.51
17 Egbado South, Ogun State
77.72
18 Gada, Sokoto State 78.02
19 Imported Sample from Morocco
79.10
Table 2: Classification of the Gypsum Quality
Group Identification Number
Location
Calcium Sulphate Content (%)
Lower limit Upper limit
1 Nigeria Less than 65.0
---
2 Nigeria 65.01 70.00 3 Nigeria 70.01 75.00 4 Nigeria 75.01 80.00 5 Imported 75.01 80.00
Plate I: Moulding of the Mortar Prisms
Table 3: Cement Mix Composition used in the study
Serial Number Mix Group No. Cement ID Gypsum Quality (Purity) Group Percentage Clinker Percentage Gypsum
Cement Group 1
1 Cem 1A 65% or less pure
98 2
1 Cem 1B 97 3
1 Cem 1C 96 4
1 Cem 1D 95 5
1 Cem 1E 94 6
1 Cem 1F 93 7
Cement Group 2
2 Cem 2A More than 65% Less than 70% pure
98 2
2 Cem 2B 97 3 2 Cem 2C 96 4 2 Cem 2D 95 5
2 Cem 2E 94 6
2 Cem 2F 93 7
Cement Group 3
3 Cem 3A More than 70% Less than 75% pure
98 2
3 Cem 3B 97 3
3 Cem 3C 96 4
3 Cem 3D 95 5
3 Cem 3E 94 6
3 Cem 3F 93 7
Cement Group 4
4 Cem 4A More than 75% Less than 80% pure
98 2
4 Cem 4B 97 3
4 Cem 4C 96 4 4 Cem 4D 95 5 4 Cem 4E 94 6
EFFECT OF LOCALLY SOURCED NIGERIAN GYPSUM ON THE STRENGTH AND MICROSTRUCTURE OF PORTLAND … A. D. Muhammad, et al
Nigerian Journal of Technology, Vol. 39, No. 4, October 2020 1005
Serial Number Mix Group No. Cement ID Gypsum Quality (Purity) Group Percentage Clinker Percentage Gypsum 4 Cem 4F 93 7
Cement Group 5
5 Cem 5A Foreign based More than 75% Less than 80% pure
98 2
5 Cem 5B 97 3 5 Cem 5C 96 4
5 Cem 5D 95 5
5 Cem 5E 94 6
5 Cem 5F 93 7
As the gypsum content increased continuously to 7,
the maximum flexural strengths occurs at 6% for 7
and 14 days curing period and at 5% for 21 and 28
days curing period. It is clear that the optimum 28
days flexural strength for the cement mix 2 is
6N/mm2. Therefore for cement mix 2, 5% is the
optimum Gypsum content.
Figure 1: Variation of flexural strength with Gypsum content for cement mix groups 2 at 7, 14, 21 and
28 days curing period
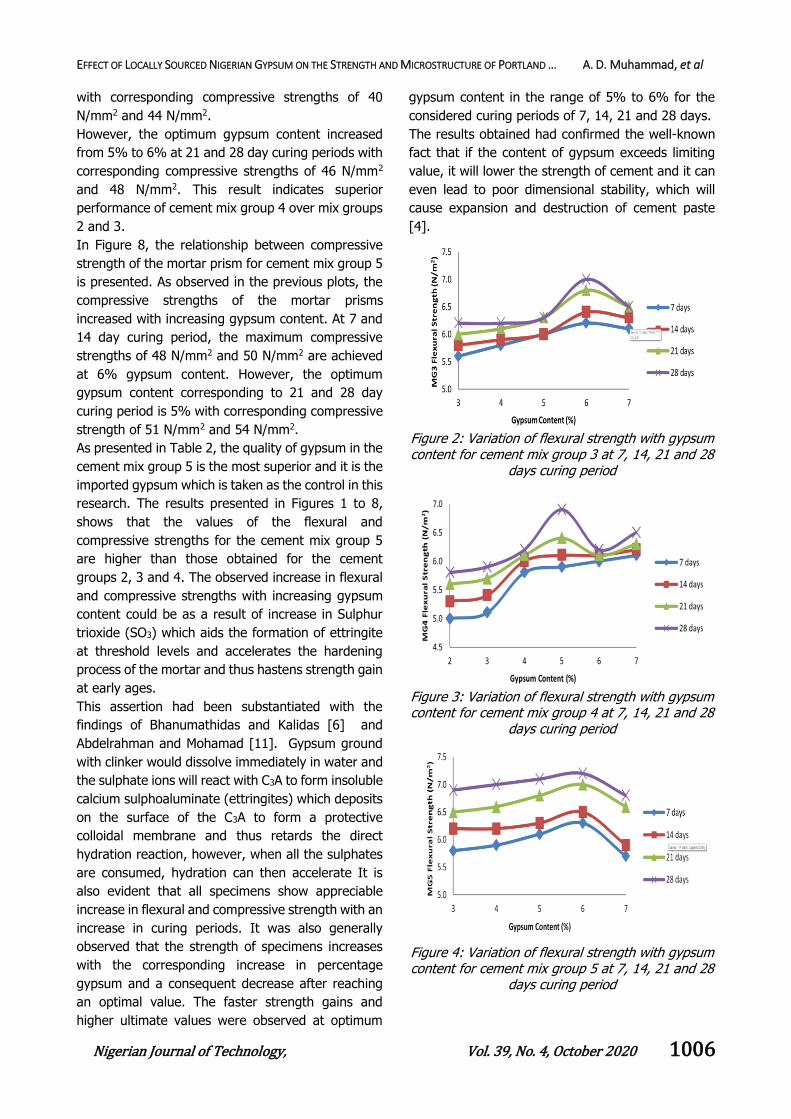
Also in Figure 2, the flexural strength of the cement
mortar for cement mix group 3 increases with
increasing gypsum content at all curing ages up to
the optimum gypsum content of 6 %. The
corresponding optimal flexural strengths are 6.2
N/mm2, 6.4 N/mm2, 6.4 N/mm2, 6.8 N/mm2 and 7.0
N/mm2 at 7 days, 14 days, 21 days and 28 days
curing period respectively. This implied that higher
ultimate flexural strength of cement mortar is
achieved for cement mix 3 than cement mix group
2.
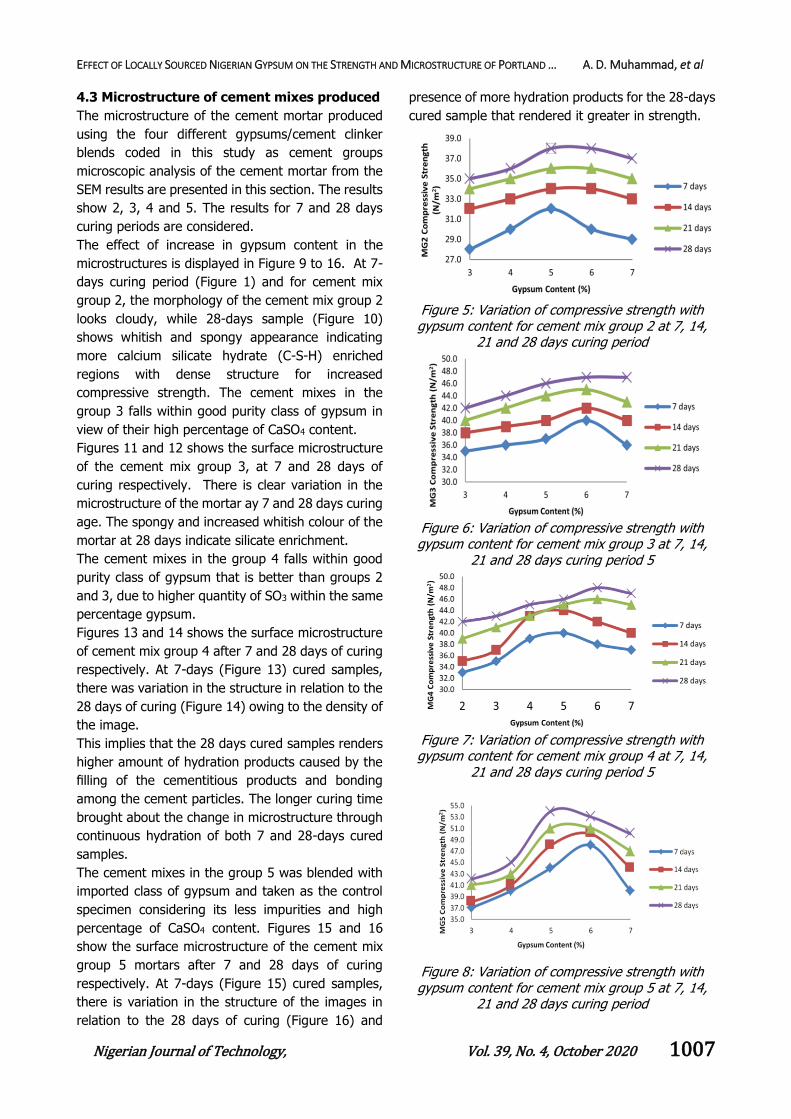
Similar trends in observed in Figure 3 for cement mix
group 4. However, the optimum gypsum content is
5% and the corresponding optimal flexural strengths
at 7, 14, 21 and 28 days are respectively 5.9 N/mm2,
6.1 N/mm2, 6.4 N/mm2 and 6.9 N/mm2. It is clear
from the results presented in Figure 2 and 3 that
achieved flexural strength capacities for cement mix
group 2 and mix group 3 are approximately the same
with cement mix group 3 having low optimal gypsum
content.
Figure 4 displayed the relationship between flexural
strength of the cement mortar for cement mix group
5 at various curing ages. The imported gypsum is
used for the cement mix group 4. The optimum
gypsum content is 6 % with corresponding optimal
flexural strength of 6.3 N/mm2, 6.5 N/mm2, 7.0
N/mm2 and 7.2 N/mm2 respectively. The results
indicate that the cement mix group 5 produced
mortar with the highest flexural strength
4.2 Compressive Strength of the Cement
Mortar
Figure 5, 6, 7 and 8 shows the variation of the
compressive strength of the cement mortar with
gypsum content for cement mix groups 2, 3, 4 and
5 respectively. As indicated in Figure 5, the
compressive strengths of the mortar prisms at 3 %
gypsum content are 35 N/mm2, 38 N/mm2, 38 N/mm2
and 42 N/mm2 respectively at 7, 14, 21 and 28 days
curing period. The compressive strength increases as
the gypsum content increases up to 5% gypsum
content, after which the compressive strength
started decreasing for the considered curing periods
of 7, 14, 21 and 28 days. Therefore, the optimum
compressive strengths corresponding to the
respective curing periods for cement mix group 2 are
32 N/mm2, 34 N/mm2, 36 N/mm2 and 38 N/mm2.
In Figure 6, the effect of gypsum content on the
compressive strength of the cement mortar for
cement mix group 3 is presented. The trend is similar
to what was observed in Figure 5. However, the
optimum gypsum content in this case is 6% as
against 5% for cement mix group 2. The
corresponding optimal compressive strengths are 40
N/mm2, 42 N/mm2, 45 N/mm2 and 47 N/mm2
respectively at 7, 14, 21 and 28 days curing periods.
The results shown superior performance of the
cement mix group 3 over cement mix group 2.
The effect of the gypsum content on the compressive
strength of the mortar prism for cement mix group 4
is presented in Figure 7. It is clear from the plot that
the optimum compressive strength at 7 and 14 days
curing periods were achieved at 5% gypsum content
EFFECT OF LOCALLY SOURCED NIGERIAN GYPSUM ON THE STRENGTH AND MICROSTRUCTURE OF PORTLAND … A. D. Muhammad, et al
Nigerian Journal of Technology, Vol. 39, No. 4, October 2020 1006
with corresponding compressive strengths of 40
N/mm2 and 44 N/mm2.
However, the optimum gypsum content increased
from 5% to 6% at 21 and 28 day curing periods with
corresponding compressive strengths of 46 N/mm2
and 48 N/mm2. This result indicates superior
performance of cement mix group 4 over mix groups
2 and 3.
In Figure 8, the relationship between compressive
strength of the mortar prism for cement mix group 5
is presented. As observed in the previous plots, the
compressive strengths of the mortar prisms
increased with increasing gypsum content. At 7 and
14 day curing period, the maximum compressive
strengths of 48 N/mm2 and 50 N/mm2 are achieved
at 6% gypsum content. However, the optimum
gypsum content corresponding to 21 and 28 day
curing period is 5% with corresponding compressive
strength of 51 N/mm2 and 54 N/mm2.
As presented in Table 2, the quality of gypsum in the
cement mix group 5 is the most superior and it is the
imported gypsum which is taken as the control in this
research. The results presented in Figures 1 to 8,
shows that the values of the flexural and
compressive strengths for the cement mix group 5
are higher than those obtained for the cement
groups 2, 3 and 4. The observed increase in flexural
and compressive strengths with increasing gypsum
content could be as a result of increase in Sulphur
trioxide (SO3) which aids the formation of ettringite
at threshold levels and accelerates the hardening
process of the mortar and thus hastens strength gain
at early ages.
This assertion had been substantiated with the
findings of Bhanumathidas and Kalidas [6] and
Abdelrahman and Mohamad [11]. Gypsum ground
with clinker would dissolve immediately in water and
the sulphate ions will react with C3A to form insoluble
calcium sulphoaluminate (ettringites) which deposits
on the surface of the C3A to form a protective
colloidal membrane and thus retards the direct
hydration reaction, however, when all the sulphates
are consumed, hydration can then accelerate It is
also evident that all specimens show appreciable
increase in flexural and compressive strength with an
increase in curing periods. It was also generally
observed that the strength of specimens increases
with the corresponding increase in percentage
gypsum and a consequent decrease after reaching
an optimal value. The faster strength gains and
higher ultimate values were observed at optimum
gypsum content in the range of 5% to 6% for the
considered curing periods of 7, 14, 21 and 28 days.
The results obtained had confirmed the well-known
fact that if the content of gypsum exceeds limiting
value, it will lower the strength of cement and it can
even lead to poor dimensional stability, which will
cause expansion and destruction of cement paste
[4].
Figure 2: Variation of flexural strength with gypsum content for cement mix group 3 at 7, 14, 21 and 28
days curing period
Figure 3: Variation of flexural strength with gypsum content for cement mix group 4 at 7, 14, 21 and 28
days curing period
Figure 4: Variation of flexural strength with gypsum content for cement mix group 5 at 7, 14, 21 and 28
days curing period
EFFECT OF LOCALLY SOURCED NIGERIAN GYPSUM ON THE STRENGTH AND MICROSTRUCTURE OF PORTLAND … A. D. Muhammad, et al
Nigerian Journal of Technology, Vol. 39, No. 4, October 2020 1007
4.3 Microstructure of cement mixes produced
The microstructure of the cement mortar produced
using the four different gypsums/cement clinker
blends coded in this study as cement groups
microscopic analysis of the cement mortar from the
SEM results are presented in this section. The results
show 2, 3, 4 and 5. The results for 7 and 28 days
curing periods are considered.
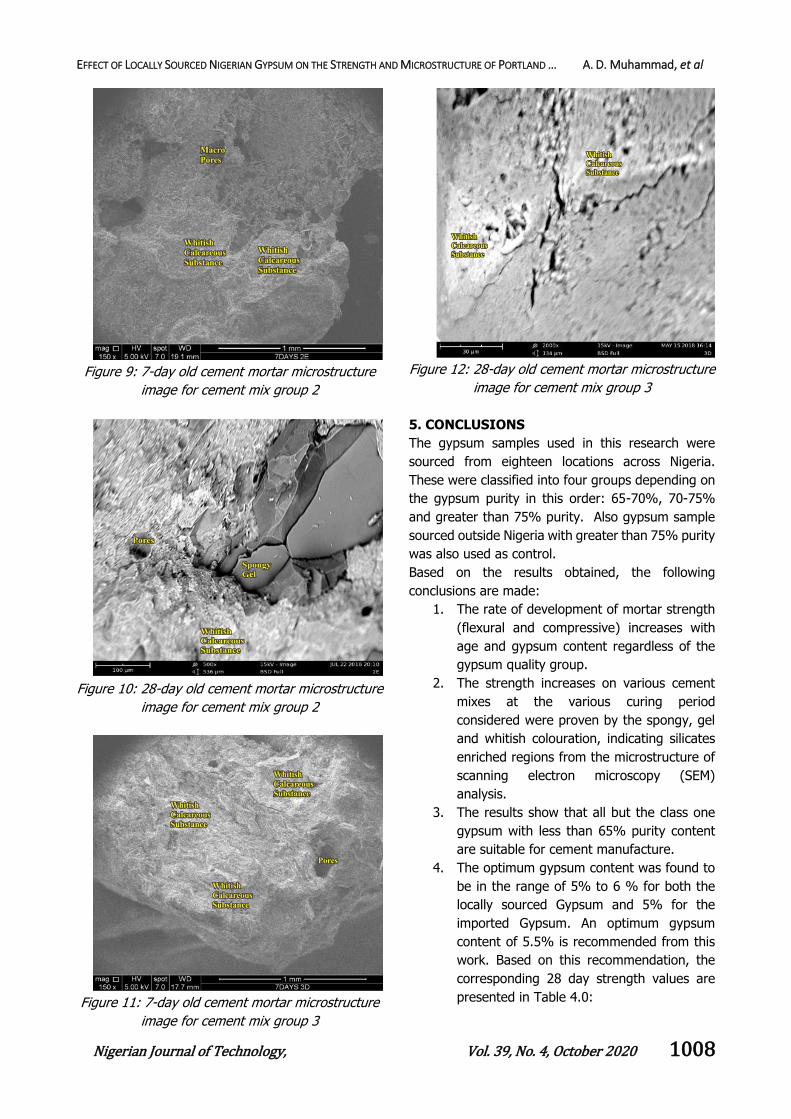
The effect of increase in gypsum content in the
microstructures is displayed in Figure 9 to 16. At 7-
days curing period (Figure 1) and for cement mix
group 2, the morphology of the cement mix group 2
looks cloudy, while 28-days sample (Figure 10)
shows whitish and spongy appearance indicating
more calcium silicate hydrate (C-S-H) enriched
regions with dense structure for increased
compressive strength. The cement mixes in the
group 3 falls within good purity class of gypsum in
view of their high percentage of CaSO4 content.
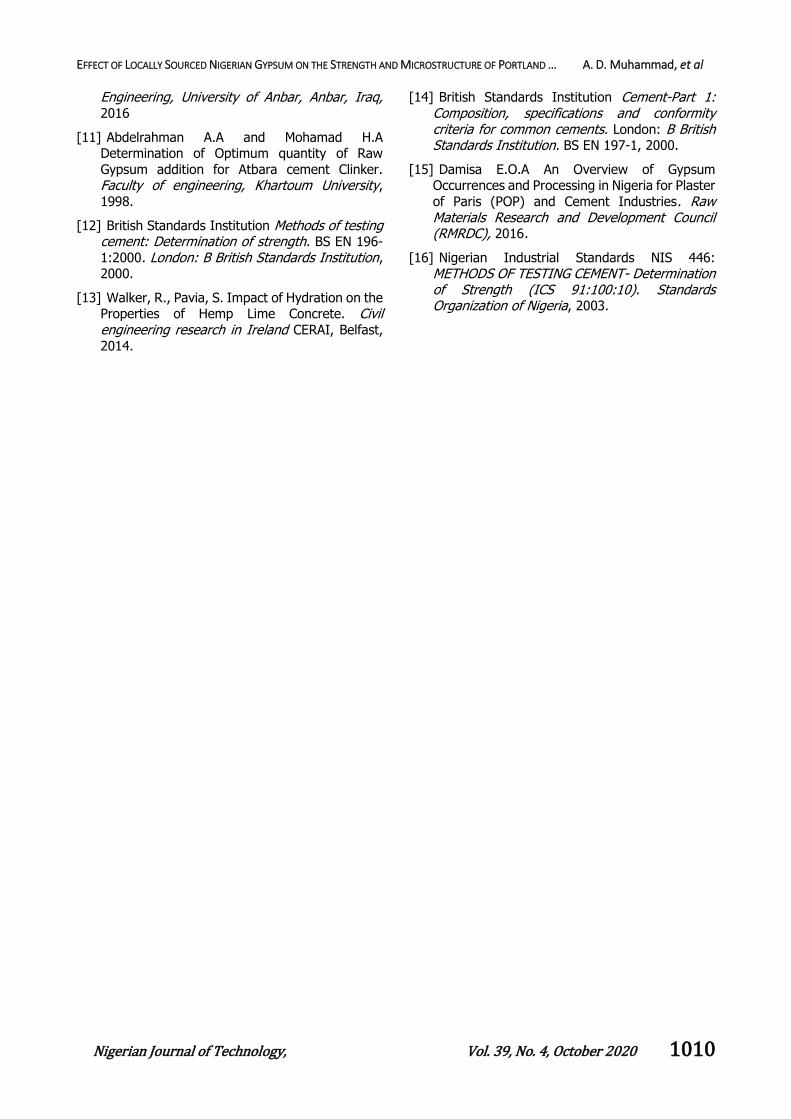
Figures 11 and 12 shows the surface microstructure
of the cement mix group 3, at 7 and 28 days of
curing respectively. There is clear variation in the
microstructure of the mortar ay 7 and 28 days curing
age. The spongy and increased whitish colour of the
mortar at 28 days indicate silicate enrichment.
The cement mixes in the group 4 falls within good
purity class of gypsum that is better than groups 2
and 3, due to higher quantity of SO3 within the same
percentage gypsum.
Figures 13 and 14 shows the surface microstructure
of cement mix group 4 after 7 and 28 days of curing
respectively. At 7-days (Figure 13) cured samples,
there was variation in the structure in relation to the
28 days of curing (Figure 14) owing to the density of
the image.
This implies that the 28 days cured samples renders
higher amount of hydration products caused by the
filling of the cementitious products and bonding
among the cement particles. The longer curing time
brought about the change in microstructure through
continuous hydration of both 7 and 28-days cured
samples.
The cement mixes in the group 5 was blended with
imported class of gypsum and taken as the control
specimen considering its less impurities and high
percentage of CaSO4 content. Figures 15 and 16
show the surface microstructure of the cement mix
group 5 mortars after 7 and 28 days of curing
respectively. At 7-days (Figure 15) cured samples,
there is variation in the structure of the images in
relation to the 28 days of curing (Figure 16) and
presence of more hydration products for the 28-days
cured sample that rendered it greater in strength.
Figure 5: Variation of compressive strength with gypsum content for cement mix group 2 at 7, 14,
21 and 28 days curing period
Figure 6: Variation of compressive strength with gypsum content for cement mix group 3 at 7, 14,
21 and 28 days curing period 5
Figure 7: Variation of compressive strength with gypsum content for cement mix group 4 at 7, 14,
21 and 28 days curing period 5
Figure 8: Variation of compressive strength with gypsum content for cement mix group 5 at 7, 14,
21 and 28 days curing period
EFFECT OF LOCALLY SOURCED NIGERIAN GYPSUM ON THE STRENGTH AND MICROSTRUCTURE OF PORTLAND … A. D. Muhammad, et al
Nigerian Journal of Technology, Vol. 39, No. 4, October 2020 1008
Figure 9: 7-day old cement mortar microstructure
image for cement mix group 2
Figure 10: 28-day old cement mortar microstructure
image for cement mix group 2
Figure 11: 7-day old cement mortar microstructure
image for cement mix group 3
Figure 12: 28-day old cement mortar microstructure
image for cement mix group 3
5. CONCLUSIONS
The gypsum samples used in this research were
sourced from eighteen locations across Nigeria.
These were classified into four groups depending on
the gypsum purity in this order: 65-70%, 70-75%
and greater than 75% purity. Also gypsum sample
sourced outside Nigeria with greater than 75% purity
was also used as control.
Based on the results obtained, the following
conclusions are made:
1. The rate of development of mortar strength
(flexural and compressive) increases with
age and gypsum content regardless of the
gypsum quality group.
2. The strength increases on various cement
mixes at the various curing period
considered were proven by the spongy, gel
and whitish colouration, indicating silicates
enriched regions from the microstructure of
scanning electron microscopy (SEM)
analysis.
3. The results show that all but the class one
gypsum with less than 65% purity content
are suitable for cement manufacture.
4. The optimum gypsum content was found to
be in the range of 5% to 6 % for both the
locally sourced Gypsum and 5% for the
imported Gypsum. An optimum gypsum
content of 5.5% is recommended from this
work. Based on this recommendation, the
corresponding 28 day strength values are
presented in Table 4.0:

EFFECT OF LOCALLY SOURCED NIGERIAN GYPSUM ON THE STRENGTH AND MICROSTRUCTURE OF PORTLAND … A. D. Muhammad, et al
Nigerian Journal of Technology, Vol. 39, No. 4, October 2020 1009
Table 4: 28 Day Flexural and Compressive Strengths Corresponding to 5.5% Gypsum Content
Cement
Mix Group
Flexural Strength
(N/mm2)
Compressive
Strength (N/mm2)
2 5.5 38 3 6.7 45
4 6.5 46 5 7.1 52
Figure 13: 7-day old cement mortar microstructure
image for cement mix group 4
Figure 14: 28-day old cement mortar microstructure
image for cement mix group 4
Figure 15: 7-day old cement mortar microstructure
image for cement mix group 5
Figure 16: 28-day old cement mortar microstructure
image for cement mix group 5
6. REFERENCES
[1] Hassaan MY, Effect of Gypsum on the strength development of Portland cement by Mossbauer
spectrometry. Hyperfine Interactions, Volume 42, Issue 1–4, pp 1199–1202, 1988.
[2] Taylor, H.F.W The Chemistry of Cements, vol.1,
Academic Press, London, pp.1-48, 1990
[3] Laura Dodds Microstructure Characterisation of Ordinary Portland Cement Composites for the Immobilisation of Nuclear Waste. A thesis
submitted to the University of Manchester for the degree of Master of Philosophy in the faculty of
Engineering and Physical Sciences, 2012
[4] Neville, A. M , Properties of Concrete, Pearson Education Limited, Edinburgh Gate Harlow Essex
CM20 2JE England, 5th edition (2011).
[5] Mike L, and Yunhong J, Porosity, Pore Size Distribution, Micro-structure Centre for
Innovative Construction Materials, University of Bath, Bath BA2 7AY, UK, 2017.
[6] Bhanumathidas N and Kalidas N Dual role of gypsum: Set retarder and strength accelerator,
The Indian Concrete Journal, 2004.
[7] Tsamatsoulis D and Nikolakakos N, Optimizing the Sulphates Content of Cement Using
Multivariable Modelling and Uncertainty Analysis. Halyps Building Materials S.A, Italcementi Group,
2013.
[8] Kumar P, Mehta P, Monteiro J, CONCRETE Microstructure, Properties and Materials, 2001.
[9] Taher M. A., Amine, A. M. and Dammarany Effect of Partial Substitution of Raw Gypsum with
Thermally Treated Phosphogypsum on the Properties of Portland Pozzolanic Cement.
Advanced Journal of Chemistry, Section A. Vol.
2, No. Pp. 296-315.
[10] Ameer A. Hilal Microstructure of Concrete, Department of Civil Engineering, Faculty of
EFFECT OF LOCALLY SOURCED NIGERIAN GYPSUM ON THE STRENGTH AND MICROSTRUCTURE OF PORTLAND … A. D. Muhammad, et al
Nigerian Journal of Technology, Vol. 39, No. 4, October 2020 1010
Engineering, University of Anbar, Anbar, Iraq, 2016
[11] Abdelrahman A.A and Mohamad H.A Determination of Optimum quantity of Raw
Gypsum addition for Atbara cement Clinker. Faculty of engineering, Khartoum University,
1998.
[12] British Standards Institution Methods of testing cement: Determination of strength. BS EN 196-
1:2000. London: B British Standards Institution, 2000.
[13] Walker, R., Pavia, S. Impact of Hydration on the Properties of Hemp Lime Concrete. Civil engineering research in Ireland CERAI, Belfast,
2014.
[14] British Standards Institution Cement-Part 1: Composition, specifications and conformity criteria for common cements. London: B British Standards Institution. BS EN 197-1, 2000.
[15] Damisa E.O.A An Overview of Gypsum Occurrences and Processing in Nigeria for Plaster
of Paris (POP) and Cement Industries. Raw Materials Research and Development Council (RMRDC), 2016.
[16] Nigerian Industrial Standards NIS 446: METHODS OF TESTING CEMENT- Determination of Strength (ICS 91:100:10). Standards Organization of Nigeria, 2003.