Embed Size (px)
Citation preview

Journal of Tropical Forest Science 20(3): 218–234 (2008)218
EFFECT OF LIGHT INTENSITY ON GROWTH, LEAF PRODUCTION, LEAF LIFESPAN AND LEAF NUTRIENT BUDGETS OF ACACIA MANGIUM, CINNAMOMUM INERS, DYERA COSTULATA, EUSIDEROXYLON ZWAGERI AND SHOREA ROXBURGHII
P. S. Tong & F. S. P. Ng*
Forest Research Institute Malaysia, 52109 Kepong, Selangor Darul Ehsan, Malaysia
Received September 2007
TONG, P. S. & NG, F. S. P. 2008. Effect of light intensity on growth, leaf production, leaf lifespan and leaf nutrient budgets of Acacia mangium, Cinnamomum iners, Dyera costulata, Eusideroxylon zwageri and Shorea roxburghii. Saplings of Acacia mangium, Cinnamomum iners, Dyera costulata, Eusideroxylon zwageri and Shorea roxburghii were grown side by side at 4, 7, 25, 50 and 100% relative light intensities (RLIs) to facilitate comparison under identical soil and climate conditions. The comparisons cover height increment, diameter increment, rate of production of new leaves, leaf lifespan and leaf nutrient content. The study was carried out in just under two years and the best plants grew from 30 cm to over 300 cm tall. Acacia mangium and S. roxburghii grew fastest at 100% RLI. The other three species grew fastest at 25% RLI. In height, A. mangium at 100% RLI grew four times faster than the second best species, S. roxburghii, and 21 times faster than the slowest species, E. zwageri. Leaf lifespan, found to be maximum at 4% RLI, was shortened by a constant amount by each doubling of light intensity. For example, each doubling of light intensity shortened the leaf lifespan of S. roxburghii by 70 days, and that of A. mangium by 40 days. Photo-senescence of leaves is proposed as a mechanism driving phenological events in the non-seasonal humid tropics. Old leaves at the point of shedding had lower NPK contents than newly expanded leaves. The difference is a measure of internal nutrient recycling of NPK. Mg was sometimes internally recycled, sometimes not, while Ca was usually accumulated. In the two fastest-growing species, A. mangium and S. roxburghii, the NPK content in new leaves tended to peak at about 25% RLI while the growth rate reached its maximum at 100%. Leaf nutrient content did not mirror the rate of growth. Acacia mangium had the highest rate of nutrient uptake per growing shoot—10 to 16 times that of S. roxburghii. At 100% RLI it grew fastest, had the shortest leaf lifespan and the highest leaf turnover rate.
Keywords: Nutrient cycling, nutrient uptake, senescence, phenology, growth modelling
TONG, P. S. & NG, F. S. P. 2008. Kesan keamatan cahaya terhadap pertumbuhan, penghasilan daun, usia daun dan bajet nutrien daun Acacia mangium, Cinnamomum iners, Dyera costulalta, Eisodexylon zwageri dan Shorea roxburghii. Anak pokok Acacia mangium, Cinnamomum iners, Dyera costulata, Eusidexylon zwageri dan Shorea roxburghii ditanam sebelah-menyebelah pada keamatan cahaya relatif (RLI) 4%, 7%, 25%, 50% dan 100% untuk memudahkan perbandingan di bawah keadaan tanah dan cuaca yang serupa. Perbandingan meliputi pertambahan ketinggian, pertambahan diameter, kadar pertumbuhan daun baru, usia daun dan kandungan nutrien daun. Kajian dijalankan selama hampir dua tahun. Anak pokok terbaik tumbuh dari 30 cm hingga lebih daripada 300 cm. Acacia mangium dan S. roxburghii tumbuh paling cepat pada 100% RLI. Ketiga-tiga spesies yang lain tumbuh paling cepat pada 25% RLI. Acacia mangium pada 100% RLI tumbuh empat kali lebih tinggi daripada S. roxburghii, iaitu spesies kedua tinggi dan 21 kali lebih tinggi daripada E. zwageri, iaitu spesies yang paling lambat pertumbuhannya. Usia daun adalah maksimum pada 4% RLI. Usia daun dipendekkan pada kadar yang tetap dengan setiap penggandaan keamatan cahaya. Misalnya, dengan setiap penggandaan keamatan cahaya, usia daun dipendekkan 70 hari bagi S. roxburghii dan 40 hari untuk A. mangium. Foto-senesen daun dicadangkan sebagai mekanisme yang mengawal kejadian fenologi di kawasan tropika yang tidak bermusim dan lembap. Daun tua pada masa gugur mempunyai kandungan NPK yang lebih rendah daripada daun baru yang matang. Perbezaannya ialah sukatan kitar semula dalaman untuk NPK. Mg kadang-kadang dikitar semula secara dalaman. Ca biasanya dikumpulkan. Untuk A. mangium dan S. roxburghii yang mempunyai pertumbuhan paling cepat, kandungan NPK dalam daun baru adalah maksimum pada 25% RLI sementara kadar pertumbuhan menjadi maksimum pada 100% RLI. Kandungan nutrien daun tidak mencerminkan kadar pertumbuhan. Acacia mangium mempunyai kadar pengambilan nutrien bagi setiap pucuk yang paling tinggi, iaitu 10 hingga 16 kali berbanding dengan S. roxburghii. Pada 100% RLI, A. mangium tumbuh paling cepat, mempunyai usia daun yang paling pendek dan kadar pertumbuhan daun baru yang paling tinggi.
*Author for correspondence. E-mail: fng.pc.jaring.my

Journal of Tropical Forest Science 20(3): 218–234 (2008) 219
INTRODUCTION
In the humid tropics close to the equator, where there is no winter or periodic dry season to limit growth, it is possible for trees to produce new leaves and shed old ones continuously, throughout the year. However, in his pioneering studies on tropical tree phenology, Holttum (1931, 1940) found that most trees in the humid tropics undergo periodic leaf renewal—shedding all old leaves at one go and producing new ones at the same time. However, the periods are not uniform, and the degree of synchronization is normally very low. For example, the period for a tree may vary between five and seven months and if monitored over many years, it will be found that its leaf renewal event can occur in any calendar month. Another tree of the same species, even growing close by, may have a slightly different periodicity, perhaps six to eight months, and its leaf renewal event will also not be tied to any calendar month. In any forest in the humid tropics, one can find some trees in leaf renewal activity at any time of the year, However, now and then, the individuality of trees appears to be over-ridden, so that a higher proportion of trees than normal are observed renewing their leaves in synchrony. Flowering is associated with leaf renewal, and when the degree of synchrony is exceptionally high, covering a large geographical area and involving different families, genera and species, we have what is commonly called a gregarious flowering event (Ng 1977). After that, the trees become unsynchronized again. It is during their seedling and sapling stages that trees of the humid tropics take advantage of the favourable climate to grow continuously
through the year (Ng 1979). Some produce new leaves one at a time at an even rate. Others produce leaves in flushes of several leaves at a time, but the flushes themselves occur at an even rate and at frequent intervals of time. The shedding of leaves in juveniles is also continuous, but lags behind the production of new leaves, as a result of which shoots of juvenile trees accumulate leaves. In the case of trees that produce leaves in flushes, two to nine consecutive flush generations of leaves may accumulate on a juvenile shoot before the oldest leaves are shed. Ng’s (1992) study on leaf production and leaf lifespan in seedlings of Dryobalanops aromatica under 4, 38 and 100% relative light intensities (RLIs) was the first attempt in Malaysia to quantify leaf production rate and leaf lifespan of juvenile trees. He found that D. aromatica had the highest leaf production rate at 38% RLI and longest leaf lifespan at 4% RLI. This study investigates growth, leaf production, leaf life span and leaf nutrient contents of saplings of Acacia mangium, Cinnamomum iners, Dyera costulata, Eusideroxylon zwageri and Shorea roxburghii, under relative light intensities of 4, 7, 25, 50 and 100%. The study began with plants 30–60 cm tall and ended with the tallest plants exceeding 300 cm tall. The study was carried out in slightly under two years. The species were selected to represent a wide range of examples or models in taxonomy, growth, architecture, timber, ecology and utilization (Table 1). The definitions of tree architectural models follow the system of Hallé, et al. (1978). Four of the species are important in the timber trade, while the fifth is a popular tree for roadside planting.
Table 1 Characteristics of the five studied species
Species and family Timber class Tree model Utilization
Acacia mangium (Leguminosae)
Light hardwood (mangium) Roux Plantation pulpwood
Cinnamomum iners (Lauraceae)
Light hardwood (medang) Massart Ornamental roadside planting
Dyera costulata (Apocynaceae)
Light hardwood (jelutong) Petit White wood for light uses (toys, pencils, etc.)
Eusideroxylon zwageri (Lauraceae)
Heavy hardwood (Bornean ironwood)
Roux Heavy construction timber
Shorea roxburghii (Dipterocarpaceae)
Light to medium hardwood (white meranti)
Roux General construction timber

Journal of Tropical Forest Science 20(3): 218–234 (2008)220
MATERIALS AND METHOD
The research facility (Figure 1) was situated in an open field at Bandar Utama, just outside Kuala Lumpur, at 3° 08' 48" N, 101° 36' 21" E; at elevation 89 m above sea level. A rectangular metal frame 3 m tall, 6 m wide and 23 m long was erected, with its long axis running in NS direction. The structure was divided along its long axis into sections. Each section was roofed over with commercially available shade netting. The nets were fixed so as to cover the top, and to drape over the upper portions of the eastern and the western sides. In Kuala Lumpur, where the angle of the sun varies only slightly through the year, this design effectively shielded the plants from unfiltered sunlight throughout the day. The north and south sides were left open to ensure adequate air circulation. An adjacent area outside the plant house served as the full-sun (100% RLI) plot. The air temperature, as measured on the roof of a building nearby, varied between 35 °C at about midday and 22 °C just before dawn, without seasonal variation. The mean annual rainfall in Kuala Lumpur is about 93 inches (237 cm), distributed so that no month is without at least several days of rain. The study site itself was never under water stress because the ground slopes gently from east to west, and on the eastern side is a large lake. On the western side is a stream. Water seeps continuously from the lake to the stream. There
was no need to water the plants at all except for a few days after establishing the plot. The shade nets were rated by the percentage of light they allowed to pass through. The percentage of light passing through, as a proportion of the full light, was calculated by comparing simultaneous measurements made under the shade net and under open sky. This measure is the relative light intensity or RLI (Sasaki 1983). It is relatively independent of time of day and cloud condition. To ensure homogeneity in soil conditions, the soil used in the study was an artificial mixture of subsoil loam, cocopeat and charcoal particles, in equal proportions. Cocopeat is what remains of coconut husks after the long fibres have been extracted for industrial use. It is totally organic. The charcoal particles are a by-product of the briquette industry in which briquettes are made from compressed sawdust fired in kilns. The briquettes are broken into small pieces for horticultural use. The upper layer of soil in the experimental area was stripped away to a depth of 0.5 m by machine and replaced with this prepared mixture. Each species in the study was represented by 30 seedlings of the same age and approximately equal height (30–60 cm tall depending on species) selected from the nursery of the Forest Research Institute Malaysia. At the study site the seedlings were transferred individually to large perforated polybags of 30 × 30 cm size, containing the prepared soil mixture. The filled polybags
Figure 1 The experimental plot

Journal of Tropical Forest Science 20(3): 218–234 (2008) 221
were then arranged in rows, 50 cm apart, and planted three-quarters into the ground. Soil moisture was able to seep into the bags through the perforations, and roots growing out would encounter the same prepared soil as what was inside the polybags. It was intended that the rims of the bags would help keep fertilizers in place for each plant, but fertilization was found to be unnecessary. Under each RLI, each species was represented by six seedlings in a row, and the rows were aligned in east–west direction in order of D. costulata, A. mangium, C. iners, S. roxburghii and E. zwageri, so each species always had the same neighbouring species. Each plant had a single dominant leader shoot. Height and diameter measurements of the leader shoot were taken at the start and end of the study for each plant. Height was measured from ground level to the tip of the leader shoot. Diameter was measured at 14 cm above the ground. The rate of leaf production and leaf lifespan were monitored on the leader shoot and one selected branch shoot of each plant. The selected branches began as the uppermost branches at the start of the study but became the lower branches as new branches were produced above them. The plants were monitored every two or three days. This involved monitoring 150 plants and their leaves, for which a tagging system using coloured wires was established. As plants grow, they change in shape and size, and the observer can get easily disorientated. A systematic arrangement provides good visual orientation whereas a randomized arrangement for 150 plants would have made the monitoring of such parameters very difficult if not impossible. Leaf nutrient contents were determined for each species under each RLI at two stages: (a) new leaves as soon as they were fully expanded, and old leaves at the point of shedding. The leaves were dried at room temperature using silica gel. Leaves were accumulated to make up at least 20 g of dry matter for laboratory analysis. The analyses were carried out by a local laboratory providing this service for the plantation industries. The samples were analyzed for N, P, K, Mg and Ca. The planned study period for growth was 65 weeks, from June 2004 till September 2007, but the study of growth for a species was effectively ended when the tallest plants of that species reached the height (3 m) of the overhead shade net and had no more room for upward
extension. In the case of the fastest growing species, A. mangium, this happened in 16 weeks. For species with long leaf lifespans (such species fortunately did not reach the roof during the period of study), the study was extended to 92 weeks, which was the maximum time available for the study. The compact area of this experiment, the fixed arrangement of neighbouring plants and the homogenization of the soil ensured that except for the light regime, all plants would experience comparable environmental conditions throughout the study. The leaf nutrient data were provided as percentages of leaf dry matter (dry weight). We converted them to mg per leaf by the formula A /100 × B / C where A is the nutrient content as a percentage of leaf dry weight, B is the dry weight of the leaf sample and C is the number of leaves making up the sample. The difference in nutrient content between the old and new leaves gives a measure of nutrient withdrawal or accumulation. The nutrient content in mg per leaf multiplied by the rate of leaf production gives a measure of the rate of nutrient uptake per growing shoot. Nutrient content as percentage of dry matter cannot be used directly for tracking nutrient movements in leaves. Take for example, a species in which the dry matter content of old leaves is twice that of new leaves. If the percentage of nutrient Z as a percentage of dry matter is the same in new and old leaves, the percentage figures would show no change, but the actual amount of nutrient Z would have doubled. The sample sizes of leaves used in nutrient determination were 25–37 for C. iners, 22–50 for A. mangium, 14–50 for S. roxburghii, 11–35 for E. zwageri and 7–18 for D. costulata. The sample sizes could not be standardized because the availability of leaves at the required stages was dependent on the rate of production and ageing of leaves, which varied greatly between species.
RESULTS
The means and standard errors of the mean, for height increment, diameter increment, and number of leaves produced are based on six plants per species per RLI, reduced to five, four or rarely three plants where there were mortalities. For leaf life span, the means and standard errors of the mean are based on the

Journal of Tropical Forest Science 20(3): 218–234 (2008)222
number of tagged leaves that were shed during the study period. ‘New’ leaves are always new leaves that have just fully expanded. ‘Old’ leaves are senescent leaves at the point of shedding. The results are tabulated in Tables 2 to 11 and graphed in Figures 2 to 10.
Acacia mangium
In A. mangium, the leaves are in alternate arrangement, i.e. one leaf per node. Throughout the study period of 16 weeks, the shoots produced new leaves continuously and evenly, with no sign of seasonality. Old leaves were shed continuously. The rate of growth as indicated by height increment (Figure 2), diameter increment (Figure 3) and rate of leaf production (Figure 4) increased with increasing light intensity and reached its maximum under open sky (100% RLI). Leaf lifespan declined with increasing light intensity (Figure 5). The rate of leaf production was lower on branches than on leaders at 50–100% RLI, but about the same at lower light intensities (Table 2). There was no consistent difference in leaf lifespans between leaders and branches.
Cinnamomum iners
The leaves are in opposite arrangement, i.e. two per node, and produced in flushes. A flush begins from a rested terminal bud and consists
of usually two pairs of scale leaves followed by two pairs of foliage leaves. The axillary buds of the first pair of scale leaves concurrently expand and bear a pair of scale leaves followed by a pair of foliage leaves. Each flush of growth therefore results in eight leaves. The flushes occurred regularly, with no trace of seasonality. Height increment (Figure 2) and leaf production rate (Figure 4) peaked at about 25% RLI but diameter increment (Figure 3) continued to improve up to 100% RLI. Leaf lifespans could not be determined because none of the labelled leaves were shed even when the study was extended to 92 weeks. Successive generations of leaf flushes were accumulated, making a densely-leafed crown. On branches, growth was also in flushes but at a distinctly lower rate (Table 4). The leaf lifespans of the labelled leaves all exceeded the extended study period of 92 weeks, at all RLIs.
Dyera costulata
In D. costulata, leaves are produced in whorls of six to eight leaves per node, each whorl being equivalent to a flush with an average of seven leaves. The shoots grow one node (one flush) at a time, with a distinct bud-resting period between flushes. The rate of flushing was regular at all RLIs. Height and diameter increment, and leaf production (Figures 2–4) all peaked at about 25% RLI. Although the leaves belonging to the
Figure 3 Diameter growth in relation to relative light intensity
Log RLI
(Am)
Dia
met
er in
crem
ent (
cm p
er w
eek)
(Sr)
(Ci)(Dc)
(Ez)
A. mangium C.iners D. costulata E. zwageri S. roxburghii
(Am)
Figure 2 Height growth in relation to relative light intensity
A. mangium
Log RLI
C.iners D. costulata E. zwageri S. roxburghii
(Ci)(Dc)
(Ez)
Hei
ght i
ncre
men
t (cm
per
wee
k)
(Sr)
(Am)
Log RLI

Journal of Tropical Forest Science 20(3): 218–234 (2008) 223
Shoot RLI
4% 7% 25% 50% 100%
Leader
No. of leader shoots monitored 5 6 6 6 6
Ht. increment (cm) in 16 weeks 1.1 ± 0.78 14.8 ± 5.35 127.0 ± 25.45 158.2 ± 10.10 258.3 ± 10.09
Ht. increment per week 0.07 0.93 7.94 9.89 16.15
Diam. increment in 16 weeks 0.9 ± 0.26 1.4 ± 0.32 4.4 ± 0.41 7.2 ± 1.49 12.3 ± 0.44
Diam. increment per week 0.06 0.08 0.28 0.45 0.77
No. of leaves in 16 weeks 5.0 ± 0.10 10.3 ± 0.11 20.7 ± 0.10 20.0 ± 0.14 27.5 ± 0.12
No. of leaves per week 0.31 0.65 1.29 1.25 1.72
Lifespan of leaves (days) 371 ± 22.54 223 ± 10.52 131 ± 2.24 127 ± 2.78 131 ± 1.85
No. of leaves shed in 16 weeks 7 50 86 86 86
Branch
No. of branches monitored 5 6 6 6 6
No. of leaves in 16 weeks 4.83 ± 0.05 10.5 ± 0.08 20.4 ± 0.10 18.8 ± 0.10 25.3 ± 0.09
No. of leaves per week 0.30 0.66 1.28 1.18 1.58
Lifespan of leaves (days) 229 ± 11.81 214 ± 6.91 136 ± 3.86 134 ± 3.74 127 ± 3.07
No. of leaves shed in 16 weeks 16 47 52 44 50
Table 2 Growth of leader and branch shoots of Acacia mangium under various RLIs
same whorl were all of the same age, they were not all shed on the same day. To determine the average leaf lifespan, the average lifespan of each whorl was calculated first; then the overall average was calculated from all the whorls produced under each RLI. The lifespan of
leaves (Figure 5) declined with increase in RLI. The study was extended to the 92nd week in the hope of obtaining a larger sample size of leaves reaching the end of their lives. Nevertheless at 4% only one whorl was shed, giving an unreliable estimate of the leaf lifespan at 4%.
Figure 5 Leaf lifespan in relation to relative light intensity
Figure 4 Leaf production in relation to relative light intensity
(Am)
A. mangium C.iners D. costulata E. zwageri S. roxburghii
(Sr)
(Ci)
(Ez)
(Dc)
(Am )
Life
span
(day
)
A. mangium D. costulata E. zwageri S. roxburghii
(Ez)
(Dc)
(Am)
(Sr)
Log RLI
No.
of l
eave
s pe
r w
eek
Log RLI

Journal of Tropical Forest Science 20(3): 218–234 (2008)224
NutrientRLI
4% 7% 25% 50% 100%
N New leaves % dry wt 2.97 3.24 3.13 3.00 2.89
mg per leaf 7.2 14.6 52.0 53.4 31.5
Old leaves % dry wt 2.74 2.57 2.15 2.20 2.05mg per leaf 4.0 7.9 27.9 36.7 15.9
% N withdrawn 7.7 20.7 31.3 26.7 29.1
P New leaves % dry wt 0.14 0.13 0.16 0.15 0.19mg per leaf 0.3 0.6 2.6 2.7 2.1
Old leaves % dry wt 0.13 0.11 0.1 0.11 0.16mg per leaf 0.2 0.3 1.3 1.8 1.3
% P withdrawn 33.3 50.0 50.0 33.3 38.1
K New leaves % dry wt 2.19 2.03 1.96 1.83 1.50mg per leaf 5.3 9.2 32.4 30.4 16.3
Old leaves % dry wt 1.62 1.83 1.5 1.46 1.01
mg per leaf 2.4 5.6 19.4 24.4 7.8
% K withdrawn 54.7 39.1 40.1 19.7 52.1
Mg New leaves % dry wt 0.19 0.18 0.18 0.18 (0.6)
mg per leaf 0.5 0.8 2.9 3.1
Old leaves % dry wt 0.2 0.18 0.14 0.16 (1.47)
mg per leaf 0.3 0.6 1.8 2.7
% Mg withdrawn 40 25 37.9 12.9
Ca New leaves % dry wt 0.77 0.81 0.77 0.74 (0.14)mg per leaf 1.9 3.7 12.8 13.2
Old leaves % dry wt 1.03 1.04 0.95 0.92 (0.16)mg per leaf 1.6 3.2 12.3 15.4
Ca change - - - +
New leaf dry matter content as % fresh wt 17.95 20.10 51.80 45.13 25.13
Old leaf dry matter content as % fresh wt 16.22 19.16 56.76 47.40 27.33
Shoot RLI
4% 7% 25% 50% 100%Leader No. of leader shoots monitored 5 6 6 6 6
Ht. increment (cm) in 61 weeks 96.7 ± 17.36 106.1 ± 13.32 124.6 ± 21.61 151.6 ± 19.89 87.8 ± 15.26 Ht. increment per week 1.59 1.74 2.04 2.49 1.44 Diam. increment in 61 weeks 0.7 ± 0.19 1.5 ± 0.38 2.8 ± 0.38 2.6 ± 0.44 3.4 ± 0.45 Diam. increment per week 0.01 0.02 0.05 0.04 0.06 No. of flushes in 61 weeks 6.6 ± 0.02 7.8 ± 0.02 8.7 ± 0.02 8.7 ± 0.02 7.7 ± 0.02 No. of flushes per week 0.11 0.13 0.14 0.14 0.13 No. of leaves per week (8 per flush) 0.88 1.04 1.12 1.12 1.04
Branch
No. of branches monitored 5 6 6 6 6 No. of flushes in 64 weeks 3.0 ± 0.02 3.0 ± 0.02 4.0 ± 0.02 4.5 ± 0.02 7.2 ± 0.17 No. of flushes per week 0.05 0.05 0.06 0.07 0.11 No. of leaves per week (8 per flush) 0.4 0.4 0.48 0.56 0.88
Table 4 Growth of leader and branch shoots of Cinnamomum iners under various RLIs
Outliers (data within parentheses) are assumed erroneous and ignored in analysis.
Table 3 Nutrient flux in leaves of Acacia mangium

Journal of Tropical Forest Science 20(3): 218–234 (2008) 225
Dyera costulata is usually unbranched until the leader shoot is 1–3 m tall. In this study, plants at 4 and 7% RLIs produced no branches during the period of study (Table 6). Branching occurred in five plants at 25%, two at 50% and four at 100% RLI. The rate of whorl production was slower on branches than on leaders.
Eusideroxylon zwageri
Leaves are produced one per node, i.e. in alternate arrangement, and there is usually a sylleptic branch developed at each node. Growth was slow compared to the other species, with height and diameter increment (Figures 2 and 3) peaking at 25% RLI. Unexpectedly, the leaf production rate reached its maximum at 100% RLI (Figure 4). The study on leaf lifespan was carried
forward to the 92nd week, but even so, only 13 leaves were shed at 100% RLI (Table 8) and this was the maximum. At 4 and 7% RLI, only two and four leaves were shed respectively. Leaf lifespan dropped with increase in RLI (Figure 5). The rate of leaf production was distinctly higher on branches than on leaders (Table 8).
Shorea roxburghii
The leaves are produced in alternate arrangement, i.e. one leaf per node, and there is usually a sylleptic branch at each node. From the trend lines in Figures 2, 3 and 4, the rates of height and diameter increment and rate of leaf production all reached their maximum at 100% RLI. The leaf lifespan declined with increase in light intensity (Figure 5).
NutrientRLI
4% 7% 25% 50% 100%
N New leaves % dry wt 1.74 1.62 1.64 1.47 1.48
mg per leaf 12.7 9.7 11.8 8.7 7.9
Old leaves % dry wt 1.44 1.30 1.23 1.08 1.36
mg per leaf 6.6 7.0 9.9 6.5 7.2
% withdrawn 48 27.8 16.1 25.3 8.9
P New leaves % dry wt 0.14 0.13 0.16 0.14 0.12
mg per leaf 1.0 0.7 1.1 0.8 0.6
Old leaves % dry wt 0.10 0.10 0.11 0.10 0.08
mg per leaf 0.5 0.6 0.9 0.6 0.4
% withdrawn 50.0 14.3 18.2 25 33.3
K New leaves % dry wt 1.55 1.35 1.14 1.12 0.90
mg per leaf 11.3 8.1 8.2 6.6 4.8
Old leaves % dry wt 0.74 0.51 0.45 0.41 0.43
mg per leaf 3.4 2.7 3.6 2.5 2.3
% withdrawn 69.9 66.7 56.1 62.1 52.1
Mg New leaves % dry wt 0.13 0.11 0.11 0.10 0.10
mg per leaf 0.9 0.7 0.8 0.6 0.5
Old leaves % dry wt 0.11 0.12 0.11 0.07 0.07
mg per leaf 0.5 0.6 0.9 0.4 0.4
% Mg withdrawn 44.4 14.3 ? 33.3 20
Ca New leaves % dry wt 0.35 0.35 0.40 0.33 0.39
mg per leaf 2.5 2.1 2.9 2 2.1
Old leaves % dry wt 1.14 1.36 1.18 1.39 1.10
mg per leaf 5.2 7.3 9.5 8.3 5.8
Ca change + + + + +
New leaf dry matter content as % fresh wt 36.98 34.97 34.21 39.75 40.76
Old leaf dry matter content as % fresh wt 45.87 48.88 58.99 48.00 53.36
Table 5 Nutrient flux in leaves of Cinnamomum iners
? indicates outlier
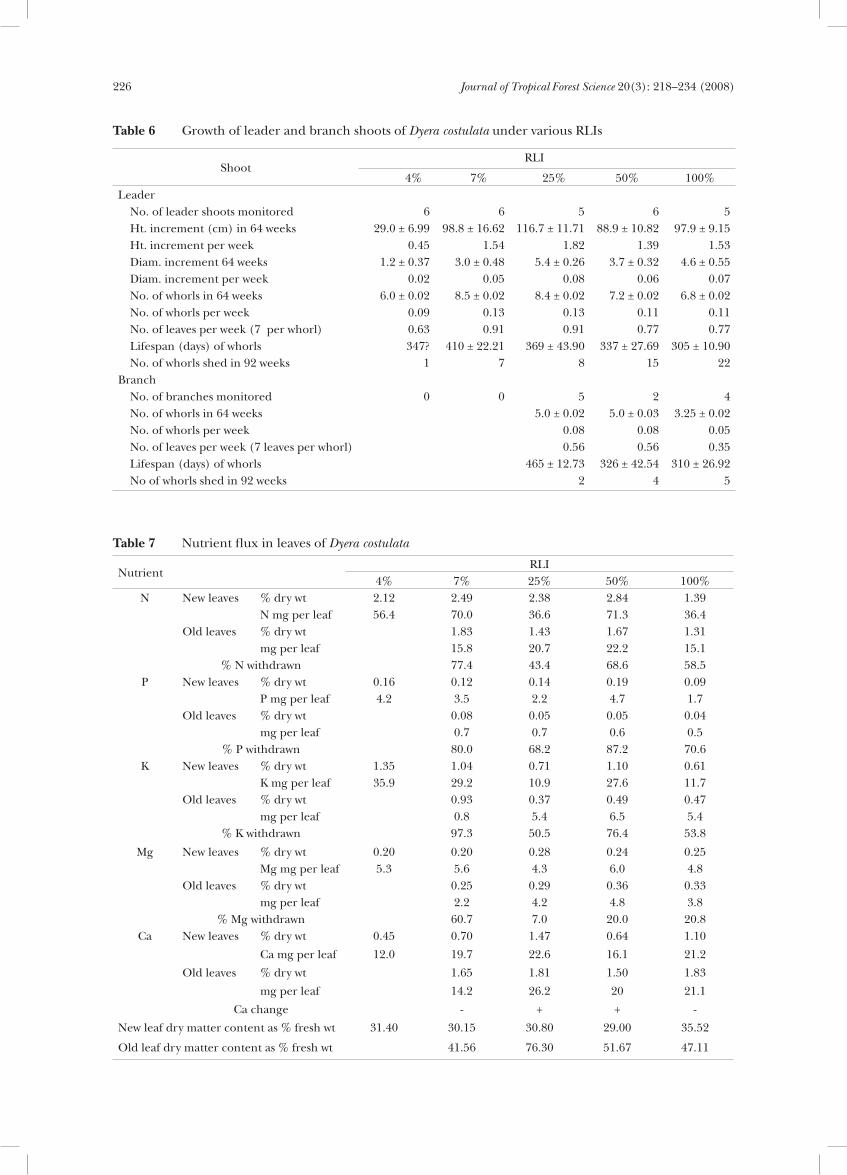
Journal of Tropical Forest Science 20(3): 218–234 (2008)226
NutrientRLI
4% 7% 25% 50% 100%N New leaves % dry wt 2.12 2.49 2.38 2.84 1.39
N mg per leaf 56.4 70.0 36.6 71.3 36.4Old leaves % dry wt 1.83 1.43 1.67 1.31
mg per leaf 15.8 20.7 22.2 15.1% N withdrawn 77.4 43.4 68.6 58.5
P New leaves % dry wt 0.16 0.12 0.14 0.19 0.09P mg per leaf 4.2 3.5 2.2 4.7 1.7
Old leaves % dry wt 0.08 0.05 0.05 0.04mg per leaf 0.7 0.7 0.6 0.5
% P withdrawn 80.0 68.2 87.2 70.6K New leaves % dry wt 1.35 1.04 0.71 1.10 0.61
K mg per leaf 35.9 29.2 10.9 27.6 11.7Old leaves % dry wt 0.93 0.37 0.49 0.47
mg per leaf 0.8 5.4 6.5 5.4% K withdrawn 97.3 50.5 76.4 53.8
Mg New leaves % dry wt 0.20 0.20 0.28 0.24 0.25Mg mg per leaf 5.3 5.6 4.3 6.0 4.8
Old leaves % dry wt 0.25 0.29 0.36 0.33mg per leaf 2.2 4.2 4.8 3.8
% Mg withdrawn 60.7 7.0 20.0 20.8Ca New leaves % dry wt 0.45 0.70 1.47 0.64 1.10
Ca mg per leaf 12.0 19.7 22.6 16.1 21.2
Old leaves % dry wt 1.65 1.81 1.50 1.83
mg per leaf 14.2 26.2 20 21.1
Ca change - + + -
New leaf dry matter content as % fresh wt 31.40 30.15 30.80 29.00 35.52
Old leaf dry matter content as % fresh wt 41.56 76.30 51.67 47.11
Table 7 Nutrient flux in leaves of Dyera costulata
Table 6 Growth of leader and branch shoots of Dyera costulata under various RLIs
Shoot RLI
4% 7% 25% 50% 100%Leader No. of leader shoots monitored 6 6 5 6 5 Ht. increment (cm) in 64 weeks 29.0 ± 6.99 98.8 ± 16.62 116.7 ± 11.71 88.9 ± 10.82 97.9 ± 9.15 Ht. increment per week 0.45 1.54 1.82 1.39 1.53 Diam. increment 64 weeks 1.2 ± 0.37 3.0 ± 0.48 5.4 ± 0.26 3.7 ± 0.32 4.6 ± 0.55 Diam. increment per week 0.02 0.05 0.08 0.06 0.07 No. of whorls in 64 weeks 6.0 ± 0.02 8.5 ± 0.02 8.4 ± 0.02 7.2 ± 0.02 6.8 ± 0.02 No. of whorls per week 0.09 0.13 0.13 0.11 0.11 No. of leaves per week (7 per whorl) 0.63 0.91 0.91 0.77 0.77 Lifespan (days) of whorls 347? 410 ± 22.21 369 ± 43.90 337 ± 27.69 305 ± 10.90 No. of whorls shed in 92 weeks 1 7 8 15 22Branch No. of branches monitored 0 0 5 2 4 No. of whorls in 64 weeks 5.0 ± 0.02 5.0 ± 0.03 3.25 ± 0.02 No. of whorls per week 0.08 0.08 0.05 No. of leaves per week (7 leaves per whorl) 0.56 0.56 0.35 Lifespan (days) of whorls 465 ± 12.73 326 ± 42.54 310 ± 26.92 No of whorls shed in 92 weeks 2 4 5

Journal of Tropical Forest Science 20(3): 218–234 (2008) 227
At 4% RLI, one plant did not produce branches (Table 10). The leaf production rate was distinctly lower on branches than on leaders at all RLIs. The leaves on the branches had longer lifespans than the leaves on leader shoots at comparable RLIs.
DISCUSSION
Rates of height and diameter increment
In the comparison of rates of height and diameter increment in Figures 2 and 3, it can be seen that the rate of growth for all species is closely correlated with the RLI. The rate of growth was close to zero at 4%, but improved noticeably at 7%. The rates peaked at about 25% for D. costulata and E. zwageri, but continued to improve up to 100% for A. mangium and S. roxburghii. In C. iners, height increment peaked at 25% but diameter increment reached maximum at 100%. Acacia mangium outgrew all the other species at 25–100% RLI. At 100%, it grew at about four times the maximum rate of the second best performer, S.roxburghii. Trees are often reputed to be ‘fast-growing’, ‘light-demanding’, slow-growing’ or ‘shade-tolerant’ (Swaine & Whitmore 1988). Acacia
mangium is a typical ‘fast-growing’ and ‘light-demanding’ species but the present experiment shows that even for A. mangium, there can be a zero state, at about 4% RLI, at which the plants merely stay alive with no growth. Presumably, a zero state occurs whenever any vital factor in a site becomes limiting. At 7% A. mangium grew a little. At 25%, it already outgrew all the other species, registering 8 cm height increment per week (Table 2). At 100% RLI, its growth rate doubles to 16 cm per week. Hence no species can be said to be ‘fast-growing’ or ‘slow-growing’ without reference to site conditions. The minimum is always zero, and the maximum is the best observed and recorded. In between, any rate is possible. The great virtue of A. mangium is that it is fast-growing over such a wide range of conditions that the label ‘fast-growing’ can be applied to it almost anywhere in the humid tropics. Of the site factors that affect growth rate, the one that has received most attention is light. For example, Nicholson (1960) found five dipterocarp species, Parashorea malaanonan, Shorea leptoclados, Shorea leprosula, Dryobalanops aromatica and Dipterocarpus stellatus to grow optimally at 87.5% RLI. Mori (1980) found Calamus manan (a liana) to grow optimally at 50% RLI; Sasaki and Mori (1981) found Vatica
Table 8 Growth of leader and branch shoots of Eusideroxylon zwageri under various RLIs
Shoot RLI
4% 7% 25% 50% 100%
Leader
No. of leader shoots monitored 4 5 5 3 3
Ht. increment (cm) in 65 weeks 15.1 ± 2.1 18.0 ± 4.89 50.7 ± 14.66 40.3 ± 6.2 28.8 ± 10.08
Ht. increment per week 0.23 0.28 0.78 0.62 0.44
Diam. increment in 65 weeks 0.6 ± 0.16 0.6 ± 0.26 1.5 ± 0.36 1.3 ± 0.38 0.8 ± 0.35
Diam. increment per week 0.01 0.01 0.02 0.02 0.01
No. of leaves in 65 weeks 3.5 ± 0.02 5.0 ± 0.02 6.8 ± 0.02 7.7 ± 0.03 8.0 ± 0.04
No. of leaves per week 0.05 0.08 0.10 0.12 0.12
Lifespan of leaves(days) 533 ± 53.00 511 ± 24.50 260 ± 24.64 304 ± 13.47 279 ± 31.78
No. of leaves shed 2 4 9 11 13
Branch
No. of branches monitored 4 5 4 3 3
No. of leaves in 64 weeks 5.0 ± 0.02 10.2 ± 0.02 13.5 ± 0.04 14.0 ± 0.04 14.0 ± 0.04
No. of leaves per week 0.08 0.16 0.21 0.22 0.22
Lifespan of leaves (days) 440 ± 30.95 336 ± 39.66 356 ± 18.91 244 ± 12.65 250 ± 21.01
No. of leaves shed 13 11 21 32 30

Journal of Tropical Forest Science 20(3): 218–234 (2008)228
NutrientRLI
4% 7% 25% 50% 100%N New leaves % dry wt 1.94 1.86 1.92 1.83 1.6
N mg per leaf 8.1 6.4 12.7 12.1 7.4Old leaves % dry wt 1.08 1.01 0.93 1.1
mg per leaf 4.7 7.6 5.9 5.5% withdrawn 42.0 40.2 51.2 25.7
P New leaves % dry wt 0.14 0.14 0.17 0.17 0.13P mg per leaf 0.6 0.5 1.1 1.1 0.6
Old leaves % dry wt 0.05 0.12 0.08 0.05mg per leaf 0.2 0.9 0.5 0.3
% withdrawn 66.7 18.2 54.5 50.0K New leaves % dry wt 1.92 1.67 1.59 1.04 1.25
K mg per leaf 8.0 5.8 10.5 6.9 5.8Old leaves % dry wt 1.02 0.43 0.39 0.55
mg per leaf 4.4 3.2 2.5 2.8% withdrawn 45.0 69.5 63.8 51.7
Mg New leaves % dry wt 0.25 0.26 0.22 0.18 0.17Mg mg per leaf 1.0 0.9 1.5 1.2 0.8
Old leaves % dry wt 0.36 0.33 0.26 0.23mg per leaf 1.6 2.5 1.6 1.2
Mg change + + + +Ca New leaves % dry wt 0.77 0.81 0.69 0.69 0.68
Ca mg per leaf 3.2 2.8 4.6 4.6 3.1Old leaves % dry wt 1.29 1.21 1.06 0.89
mg per leaf 5.6 9.1 6.7 4.5Ca change + + + +
New leaf dry matter content as % fresh wt 26.14 27.03 29.82 32.32 31.67Old leaf dry matter content as % fresh wt 48.90 40.82 37.11 39.33
Table 9 Nutrient flux in leaves of Eusideroxylon zwageri
Table 10 Growth of leader and branch shoots of Shorea roxburghii under various RLIs
ShootRLI
4% 7% 25% 50% 100%Leader No. of leader shoots monitored 5 6 5 4 4 Ht. increment (cm) in 38 weeks 15.8 ± 9.12 20.2 ± 10.63 81.3 ± 18.02 167.8 ± 17.68 117.9 ± 8.71 Ht. increment per week 0.42 0.53 2.14 4.42 3.10 Diam. increment in 38 weeks 0.9 ± 0.24 0.9 ± 0.12 3.0 ± 0.33 6.4 ± 0.86 5.3 ± 0.40 Diam. increment per week 0.02 0.02 0.08 0.17 0.14 No. of leaves in 38 weeks 4.8 ± 0.03 4.8 ± 0.04 15.6 ± 0.05 21.8 ± 0.06 22.3 ± 0.08 No. of leaves per week 0.13 0.13 0.41 0.57 0.59 Lifespan of leaves (days) 555 ± 36.97 462 ± 81.16 397 ± 13.74 224 ± 13.01 231 ± 7.57 No. of leaves shed 4 6 26 31 33Branch No. of branches monitored 4 6 5 4 4 No. of leaves in 58 weeks 2.4 ± 0.01 6.0 ± 0.03 8.3 ± 0.03 15.5 ± 0.06 26.8 ± 0.08 No. of leaves per week 0.04 0.10 0.14 0.27 0.46 Lifespan of leaves (days) > 663 537 ± 27.03 448 ± 41.84 453 ± 13.39 333 ± 18.88 No. of leaves shed 0 9 8 26 30
Due to an oversight, old leaves at 7% RLI were not analyzed.
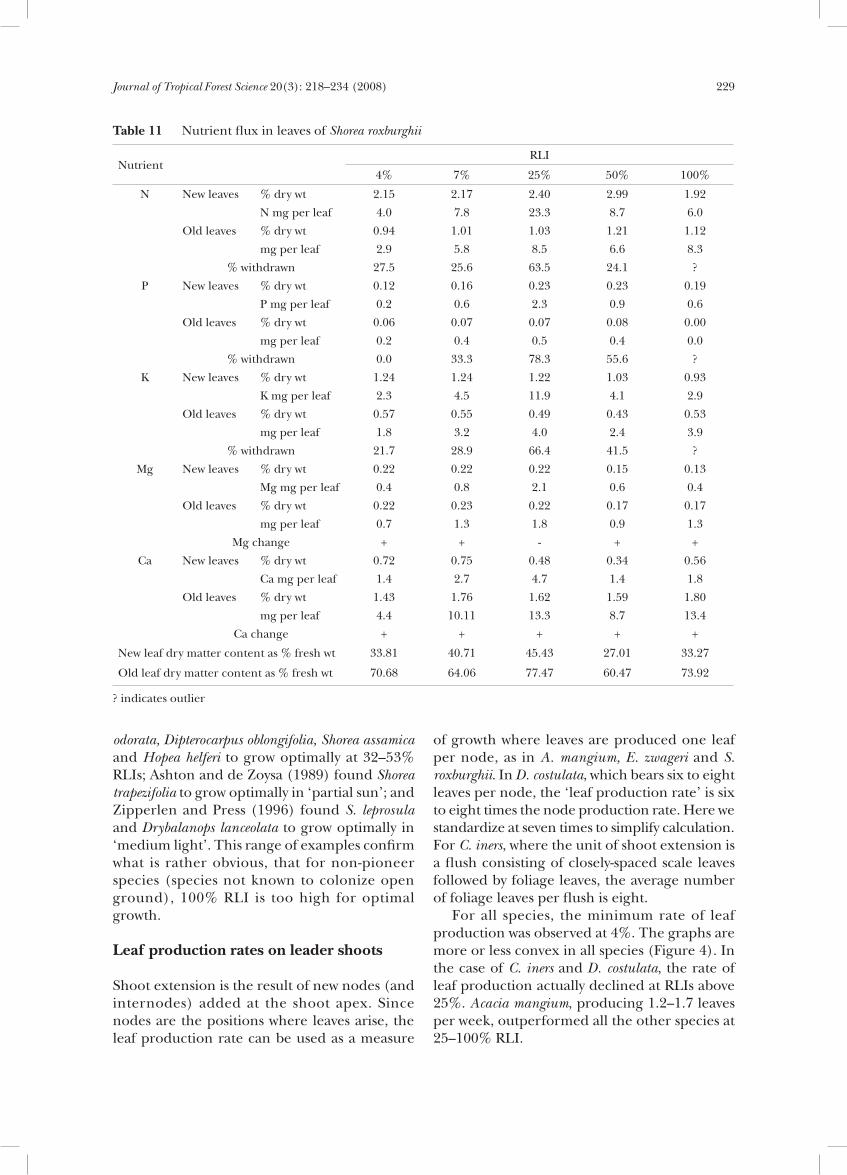
Journal of Tropical Forest Science 20(3): 218–234 (2008) 229
Nutrient RLI
4% 7% 25% 50% 100%
N New leaves % dry wt 2.15 2.17 2.40 2.99 1.92
N mg per leaf 4.0 7.8 23.3 8.7 6.0
Old leaves % dry wt 0.94 1.01 1.03 1.21 1.12
mg per leaf 2.9 5.8 8.5 6.6 8.3
% withdrawn 27.5 25.6 63.5 24.1 ?
P New leaves % dry wt 0.12 0.16 0.23 0.23 0.19
P mg per leaf 0.2 0.6 2.3 0.9 0.6
Old leaves % dry wt 0.06 0.07 0.07 0.08 0.00
mg per leaf 0.2 0.4 0.5 0.4 0.0
% withdrawn 0.0 33.3 78.3 55.6 ?
K New leaves % dry wt 1.24 1.24 1.22 1.03 0.93
K mg per leaf 2.3 4.5 11.9 4.1 2.9
Old leaves % dry wt 0.57 0.55 0.49 0.43 0.53
mg per leaf 1.8 3.2 4.0 2.4 3.9
% withdrawn 21.7 28.9 66.4 41.5 ?
Mg New leaves % dry wt 0.22 0.22 0.22 0.15 0.13
Mg mg per leaf 0.4 0.8 2.1 0.6 0.4
Old leaves % dry wt 0.22 0.23 0.22 0.17 0.17
mg per leaf 0.7 1.3 1.8 0.9 1.3
Mg change + + - + +
Ca New leaves % dry wt 0.72 0.75 0.48 0.34 0.56
Ca mg per leaf 1.4 2.7 4.7 1.4 1.8
Old leaves % dry wt 1.43 1.76 1.62 1.59 1.80
mg per leaf 4.4 10.11 13.3 8.7 13.4
Ca change + + + + +
New leaf dry matter content as % fresh wt 33.81 40.71 45.43 27.01 33.27
Old leaf dry matter content as % fresh wt 70.68 64.06 77.47 60.47 73.92
Table 11 Nutrient flux in leaves of Shorea roxburghii
odorata, Dipterocarpus oblongifolia, Shorea assamica and Hopea helferi to grow optimally at 32–53% RLIs; Ashton and de Zoysa (1989) found Shorea trapezifolia to grow optimally in ‘partial sun’; and Zipperlen and Press (1996) found S. leprosula and Drybalanops lanceolata to grow optimally in ‘medium light’. This range of examples confirm what is rather obvious, that for non-pioneer species (species not known to colonize open ground), 100% RLI is too high for optimal growth.
Leaf production rates on leader shoots
Shoot extension is the result of new nodes (and internodes) added at the shoot apex. Since nodes are the positions where leaves arise, the leaf production rate can be used as a measure
of growth where leaves are produced one leaf per node, as in A. mangium, E. zwageri and S. roxburghii. In D. costulata, which bears six to eight leaves per node, the ‘leaf production rate’ is six to eight times the node production rate. Here we standardize at seven times to simplify calculation. For C. iners, where the unit of shoot extension is a flush consisting of closely-spaced scale leaves followed by foliage leaves, the average number of foliage leaves per flush is eight. For all species, the minimum rate of leaf production was observed at 4%. The graphs are more or less convex in all species (Figure 4). In the case of C. iners and D. costulata, the rate of leaf production actually declined at RLIs above 25%. Acacia mangium, producing 1.2–1.7 leaves per week, outperformed all the other species at 25–100% RLI.
? indicates outlier

Journal of Tropical Forest Science 20(3): 218–234 (2008)230
Other studies on tropical saplings that may be cited for comparison include that of Ng (1979) who monitored the rates of node (leaf) development in leader shoots in open situations for 11 tropical juvenile trees. For species that develop one leaf per node, he found the rates to be constant through time. He called this ‘continuous’ growth. The rates he obtained were 3.43–3.88 leaves per week in Carica papaya (‘Solo’ variety); 1.85–2.00 leaves per week in Macaranga tanarius; 0.58–0.78 leaves per week in Dillenia grandifolia; 0.45 leaves per week in Dipterocarpus chartaceus, 0.43 leaves per week in Oroxylum indicum; 0.25–0.35 leaves per week in Shorea platyclados and Shorea ovalis; 0.18 leaves per week in Symingtonia populnea. The highest rate of leaf production, at 3.43–3.88 per week in C. papaya, is possibly the highest leaf production rate ever recorded, and is remarkable considering the relatively large size of the papaya leaf and that each leaf axil is the site of an inflorescence and a fruit. For A. mangium, there is a record by Lim (1993) of about 0.5–1 leaves per week on an active growing shoot. For two species with flushing growth, Ng found the rates of flushing to be constant through the year, at 0.10 flushes per week in Harpullia confusa and 0.11 flushes per week in Dacryodes rostrata. For the oil palm Elaeis guineensis, there has been much attention because each leaf axil is the site of an inflorescence and potentially a fruit bunch. Oil palm has been found to produce 0.81 leaves per week from germination until 21 months (Wormer 1958), while a 10-year-old oil palm had a leaf production rate of 0.42 leaves per week (Hartley 1967). Considering the huge size and biomass of the oil palm leaf, its habit of flowering at every axil, and its massive fruit bunch, this is a remarkably high rate of production.
Leaf production on branches relative to leaders
In A. mangium, the leaf production rate in branches was found to be slightly lower than in the leaders. In S. roxburghii, C. iners and D. costulata, the leaf production rates in branches were distinctly lower. The most obvious result of a lower leaf production rate in branches compared with leaders is to produce juvenile crowns that are taller than broad and this explains why juvenile
trees of these species have vertically elongated crowns. In E. zwageri, the branches produced leaves at a faster rate than the leaders, resulting in juvenile trees with short broad crowns.
Leaf lifespans
For all the species, leaf lifespan was longest at 4% RLI. We opted for straight lines as lines of best fit for the scatter diagram in Figure 5 and found that the R2 values of all the lines exceeded 0.7, indicating good fits, and providing support for a simple model of photo-senescence. The model is that leaf life span is reduced by equal amounts for each doubling of light intensity. The steepest drop was in S. roxburghii, from about 550 days at 4% RLI to about 200 days at 100% RLI, each doubling of light intensity cutting about 70 days from its leaf lifespan. Dyera costulata was the most resistant, losing about 30 days for each doubling of light intensity. The fastest-growing species, A. mangium, had the shortest leaf lifespan of all, at 124–371 days, giving it the highest leaf turnover rate. It lost about 40 days of leaf lifespan for each doubling of light intensity. The leaf lifespan was longest for C. iners, which shed none of the monitored leaves in 644 days of observation, even under full sunlight. Elsewhere, leaf lifespans have been found to vary from a few weeks in ephemerals, to as much as 25 years in Araucaria, a tropical conifer (Chabot & Hicks 1982). Coley (1983) and Williams et al. (1989) have found that in evergreen tropical forests, the leaf lifespan of pioneer species in high light environments is generally less than a year, and often as low as two months, while the leaf lifespan of understorey plants may be five years or more. In general, shade species have been found to have long leaf lifespans (King 1994, Lusk & Contretras 1999, Valladares et al. 2000). Short leaf lifespans have been associated with fast rates of growth (Reich et al. 1992, Ackerly & Bazzaz 1995, Ryser & Urbas 2000, Navas et al. 2003). Ng (1992) found that short leaf lifespan was compensated by higher leaf production until 38% RLI but not beyond 38% RLI in D. aromatica. Ackerly and Bazzaz (1995) found self-shading to be an important factor in extending leaf lifespan.
Journal of Tropical Forest Science 20(3): 218–234 (2008) 231
Significance of photo-senescence in tropical phenology
Holttum (1931) had the idea that leaves have a fixed life span according to their species, and this would explain the occurrence of the periodic cycles of leaf renewal observed in a climate that has no seasons. However, Holttum could not explain why, when he monitored the same trees year after year, that successive cycles were never exactly of the same length of time. Although the present study is on juvenile trees, and juveniles do not undergo leaf renewal in a total periodic manner, it proves that leaves do indeed have a lifespan—but it is not a calendar lifespan. It is a service lifespan, affected by the intensity and duration of light experienced by the leaves. This provides a possible explanation for Holttum’s observations. Cloudy days would have a weaker ageing effect and sunny days a stronger effect. No two calendar periods would ever experience exactly the same weather pattern; hence and no two leaf cycles will take exactly the same length of time. The service lifespan model also provides a model to explain synchronization, including the exceptionally high synchronization event known as gregarious flowering. A period of cloudy weather would slow down senescence for all trees. If this is followed by a sequence of sunny days, such trees would be pushed over their limits all within a short period of time. The percentage of trees brought into synchrony in this way would depend on the particular combination of cloudy and sunny days triggering the event. A weak combination would trigger a weak degree of synchronization. A strong combination would trigger a strong degree of synchronization. A model of synchronization based on photo-senescence would match the observed behaviour better than other models for the humid tropics where daylength and water availability vary little from month to month. Since leaf ageing is linked to new leaf production, and new leaf production is linked with flowering, it may be possible to test this model using artificial light to see if leaf renewal and flowering can be induced by forced photo-senescence of leaves.. This could be a possibility in seed orchards, where trees are kept small.
Leaf dry matter content and internal recycling of nutrients
In A. mangium the leaf dry matter content was more or less the same in old and new leaves, but
this is exceptional (Table 3). In all the other species, the dry matter content in old leaves was 1.1 to 2.5 times that in new leaves (Tables 5, 7, 9, 11). The leaf dry matter content was relatively unaffected by light in C. iners and E. zwageri. However, it was much affected by light in A. mangium and S. roxburghii, peaking at 25% RLI in both new and old leaves. In D. costulata, new leaves were relatively unaffected but old leaves peaked at 25% RLI. In all species, the amount of NPK in old leaves was less than in new leaves, indicating that these nutrients are always withdrawn to some extent before leaf fall. Taking all five species together, the amount withdrawn was 7.7–77.4% of N, 14.3–80% of P and 19.7–97.3% of K. The fate of Mg was variable. It was withdrawn in A. mangium, C. iners and D. costulata to the extent of 7–60.7%, but it was accumulated in E. zwageri. In S. roxburghii, the evidence was unclear, ranging from slight accumulation to slight withdrawal. Ca was accumulated as the leaf aged in C. iners, E. zwageri and S. roxburghii. It fluctuated between slight accumulation and slight withdrawal in A. mangium and D. costulata.
Nutrient content in new leaves
In every species the leaf nutrient content varied with RLI. In A. mangium, peak NPK content occured at about 25% RLI (Figure 6) but the growth rate reached its maximum at 100% RLI. A similar pattern was obtained in S. roxburghii (Figure 7) and to some extent in E. zwageri. In all cases the trends in nutrient content were independent of trends in growth rate. The conclusion of this study is that the leaf nutrient content does not reflect the rate of growth, and cannot be used to predict growth.
Rate of nutrient uptake
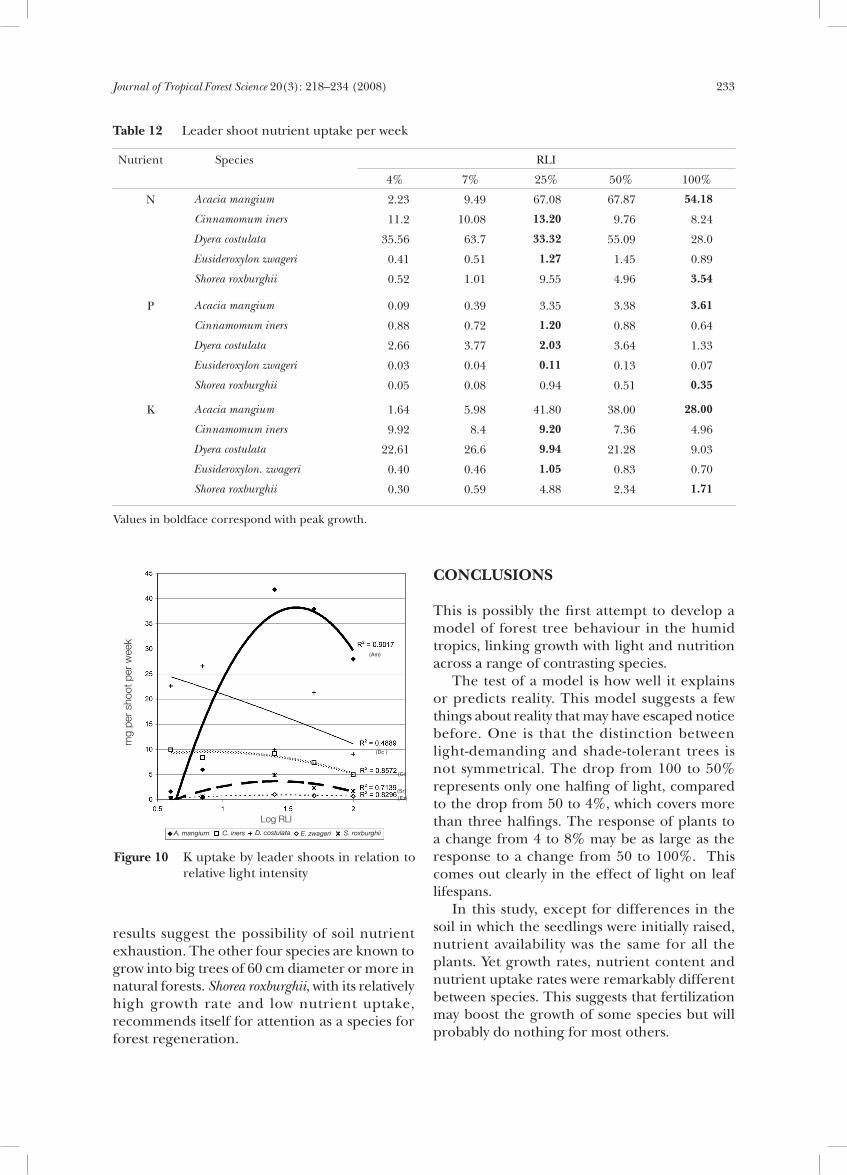
The nutrient content per leaf multiplied by the number of leaves produced on a shoot per week gives the rate of nutrient uptake in mg per shoot per week. For leader shoots the comparative data for N, P and K are given in Table 12 and illustrated in Figures 8 to 10. The values corresponding to peak growth rate (at 100% RLI for A. mangium and S. roxburghii and 25% RLI for the other three species) are indicated

Journal of Tropical Forest Science 20(3): 218–234 (2008)232
in bold in Table 12. From this comparison the rate of nutrient uptake under conditions of peak growth was highest in A. mangium followed by D. costulata, C. iners, S. roxburghii and E. zwageri in descending order. The most interesting comparison is between the two fastest growing species, A. mangium and S. roxburghii. Acacia mangium, growing four times faster than S. roxburghii at 100%RLI, took up 15 times as much N, 10 times as much P and 16 times as much K (Table 12). Dyera costulata and
C. iners both exceeded S. roxburghii in nutrient uptake but gave much poorer growth rates. Eusideroxylon zwageri was most nutrient-thrifty but also most slow-growing. Acacia mangium was planted on a large scale in Peninsula Malaysia from about 1985 till 1995 for timber production, on the expectation that it would grow to 45 cm diameter in 15 years (Ng 1996). Growth was impressive for 8–10 years, after which it declined and the trees never reached the expected diameter. Our present
Figure 8 N uptake by leader shoots in relation to relative light intensity
Figure 9 P uptake by leader shoots in relation to relative light intensity
(Sr)
A. mangium D. costulata E. zwageri S. roxburghiiC. iners
(Am)
(Dc)
(Ci)
(Ez)
Figure 6 Nutrient content of new leaves of Acacia mangium in relation to relative light intensity
Figure 7 Nutrient content of new leaves of Shorea roxburghii in relation to relative light intensity
(N)
(K)
(Ca)
(Mg)
(P)
(Mg)
(N)
(K)(Ca)(P)
mg
per
leaf
Log RLI
mg
per
leaf
Log RLI
A. mangium C. iners D. costulata E. zwageri S. roxburghii
(Dc )
(Ci)
(Sr)(Ez)
(Am)
mg
per
shoo
t per
wee
k
Log RLI
Log RLI
mg
per
shoo
t per
wee
k
Journal of Tropical Forest Science 20(3): 218–234 (2008) 233
results suggest the possibility of soil nutrient exhaustion. The other four species are known to grow into big trees of 60 cm diameter or more in natural forests. Shorea roxburghii, with its relatively high growth rate and low nutrient uptake, recommends itself for attention as a species for forest regeneration.
CONCLUSIONS
This is possibly the first attempt to develop a model of forest tree behaviour in the humid tropics, linking growth with light and nutrition across a range of contrasting species. The test of a model is how well it explains or predicts reality. This model suggests a few things about reality that may have escaped notice before. One is that the distinction between light-demanding and shade-tolerant trees is not symmetrical. The drop from 100 to 50% represents only one halfing of light, compared to the drop from 50 to 4%, which covers more than three halfings. The response of plants to a change from 4 to 8% may be as large as the response to a change from 50 to 100%. This comes out clearly in the effect of light on leaf lifespans. In this study, except for differences in the soil in which the seedlings were initially raised, nutrient availability was the same for all the plants. Yet growth rates, nutrient content and nutrient uptake rates were remarkably different between species. This suggests that fertilization may boost the growth of some species but will probably do nothing for most others.
Figure 10 K uptake by leader shoots in relation to relative light intensity
A. mangium C. iners D. costulata E. zwageri S. roxburghii
mg
per
shoo
t per
wee
k
Log RLI
(Dc )
(Ci)
(Sr)(Ez)
(Am)
Nutrient Species RLI
4% 7% 25% 50% 100%
N Acacia mangium 2.23 9.49 67.08 67.87 54.18
Cinnamomum iners 11.2 10.08 13.20 9.76 8.24
Dyera costulata 35.56 63.7 33.32 55.09 28.0
Eusideroxylon zwageri 0.41 0.51 1.27 1.45 0.89
Shorea roxburghii 0.52 1.01 9.55 4.96 3.54
P Acacia mangium 0.09 0.39 3.35 3.38 3.61
Cinnamomum iners 0.88 0.72 1.20 0.88 0.64
Dyera costulata 2.66 3.77 2.03 3.64 1.33
Eusideroxylon zwageri 0.03 0.04 0.11 0.13 0.07
Shorea roxburghii 0.05 0.08 0.94 0.51 0.35
K Acacia mangium 1.64 5.98 41.80 38.00 28.00
Cinnamomum iners 9.92 8.4 9.20 7.36 4.96
Dyera costulata 22.61 26.6 9.94 21.28 9.03
Eusideroxylon. zwageri 0.40 0.46 1.05 0.83 0.70
Shorea roxburghii 0.30 0.59 4.88 2.34 1.71
Table 12 Leader shoot nutrient uptake per week
Values in boldface correspond with peak growth.

Journal of Tropical Forest Science 20(3): 218–234 (2008)234
ACKNOWLEDGEMENTS
The site, shade house, machinery and labour for establishing the experiment was provided by Bandar Utama City Corp. The first author was supported by a cash award from Rotary Club (Kajang) and a partial scholarship from the Forest Research Institute Malaysia. This paper is based on her thesis submitted to Universiti Putra Malaysia for the degree of Master of Science.
REFERENCES
Ackerly, D. D. & Bazzaz, F. A. 1995. Leaf dynamics, self-shading and carbon gain in seedlings of a tropical pioneer tree. Oecologia 101: 289–298.
Ashton, P. M. S. & De Zoysa, N. D. 1989. Performance of Shorea trapezifolia (Thwaites) Ashton seedlings growing in different light regimes. Journal of Tropical Forest Science 1: 356–364.
Chabot, B. F. & Hicks, D. J. 1982. The ecology of leaf life span. Annual Review Ecology and Systematics 13: 229–259.
Coley, P. D. 1983. Herbivory and defensive characteristics of tree species in a lowland tropical rain forest. Ecological Monographs 62: 315–344.
Hallé, F., Oldeman R. A. A. & Tomlinson, P. B. 1978. Tropical Trees and Forests: An Architectural Analysis. Springer-Verlag, Berlin.
Hartley, C. W. S. 1967. The Oil Palm. 2nd edition. Longman, London.
Holttum, R. E. 1931. On periodic leaf changes and flowering of trees in Singapore. Gardens’ Bulletin Straits Settlements 5: 173–206.
Holttum, R. E. 1940. On periodic leaf changes and flowering of trees in Singapore II. Gardens’ Bulletin Straits Settlements 11: 119–175.
King, D. A. 1994. Influence of light level on the growth and morphology of saplings in a Panamanian forest. American Journal of Botany 81: 948–957.
Lim, M. T. 1993. Growth and Yield in Acacia mangium: Growing and Utilization. In Awang, K. & Taylor, D. (Eds.) MPTS Monograph Series No. 3. Winrock International and Food and Agriculture Organization of the United Nations, Bangkok.
Lusk, C. H. & Contretras, O. 1999. Foliage area and crown nitrogen turnover in temperate rain forest juvenile trees of differing shade tolerance. Journal of Ecology 87: 973–983.
Mori, T. 1980. Growth of rotan manau (Calamus manan) seedlings under various light conditions. Malayan Forester 43: 187–192.
Navas, M. L., Ducout, B., Roumet, C., Richare, J., Garnier, J. & Garnier, E. 2003. Leaf life span, dynamics and construction cost of species from Mediterranean old-fields differing in successional status. New Phytologist 159: 213–228.
Ng, F. S. P. 1977. Gregarious flowering of dipterocarps in Kepong 1976. Malaysian Forester 40: 126–137.
Ng, F.S.P. 1979. Growth rhythms in tropical juvenile trees. Bulletin de la Societe Botanique de France 126: Actualites Botaniques No. 3: 139–149.
Ng, F. S. P. 1992. Leaf senescence in kapur (Dryobalanops aromatica, Dipterocarpaceae) under different canopy conditions. Journal of Tropical Forest Science 4: 275–280.
Ng, F. S. P. 1996. High Guality Planting Stocks—Has Research Made a Difference? CIFOR Occasional Paper No. 8. Center for International Forestry Research, Bogor.
Nicholson, D. I. 1960. Light requirements of seedlings of 5 species of Dipterocarpaceae. Malayan Forester 23: 344–356.
Reich, P. B., Walters, M. B. & Ellsworth, D. S. 1992. Leaf life-span in relation to leaf, plant and stand characteristics among diverse ecosystems. Ecological Monographs 62: 365–392.
Ryser, P. & Urbas, P. 2000. Ecological significance of leaf life span among Central European grass species. Oikos 91: 41–50.
Sasaki, S. 1983. Physiological Studies on Seedlings of Dipterocarps With Particular Reference to Shorea ovalis and Shorea talura. FRI Research Pamplet no. 92. Forest Research Institute Malaysia, Kuala Lumpur.
Sasaki, S. & Mori, T. 1981. Growth responses of Dipterocarp seedlings to light. Malayan Forester 44: 319–345.
Swaine, M. D. & Whitmore, T.C. 1988. On the definition of ecological species groups in tropical rain forests. Vegetatio 75: 751–763.
Valladares, F., Wright, S. J., Lasso, E., Kitajiwa, K. & Pearcy, R. W. 2000. Plastic phenotypic response to light of 16 congeneric shrubs from a Panamanian rainforest. Ecology 81: 1925–1936.
Williams, K., Field, C. B. & Mooney, H. A. 1989. Relationships among leaf construction cost, leaf longevity and light environment of in rain-forest plants of the genus Piper. American Naturalist 133: 198–211.
Wormer, T. H. 1958. Croissance et developpement du palmier a huile. Oleagineaux 13: 385.
Zipperlen, S. W. & Press, M. C. 1996. Photosynthesis in relation to growth and seedling ecology of two dipterocarp rain forest tree species. Journal of Ecology 84: 863–876.