Embed Size (px)
Citation preview
Effect of Latency on Presence in Stressful Virtual Environments
Michael Meehan Stanford University [email protected]
Sharif Razzaque UNC-Chapel Hill [email protected]
Mary C. Whitton UNC-Chapel Hill
Frederick P. Brooks, Jr.
UNC-Chapel Hill [email protected]
Abstract
Previous research has shown that even low end-to-end latency can have adverse effects on performance in virtual environments (VE). This paper reports on an experiment investigating the effect of latency on other metrics of VE effectiveness: physiological response, simulator sickness, and self-reported sense of presence. The VE used in the study includes two rooms: the first is normal and non-threatening; the second is designed to evoke a fear/stress response. Participants were assigned to either a low latency (~50 ms) or high latency (~90 ms) group. Participants in the low latency condition had a higher self-reported sense of presence and a statistically higher change in heart rate between the two rooms than did those in the high latency condition. There were no significant relationships between latency and simulator sickness Keywords: virtual environments, latency, frame rate, presence, simulator sickness, physiological measures. 1. Introduction
Virtual Environment (VE) effectiveness is often
measured in terms of application success, e.g. task performance or training transfer, or is measured by the degree to which the VE creates a subjective illusion of presence – a sense of “being there” in the virtual world. VE effectiveness can also be evaluated by the extent to which the system minimizes or eliminates factors that hinder user performance and/or break the user’s sense of presence, e.g. simulator sickness or latency.
This paper reports the results of an experiment studying one of the factors known to detract from VE effectiveness: end-to-end latency.
In contrast to previous studies of latency, we did not measure the effect of latency on performance, but, instead, measured its effect on users’ internal state – the visceral, physiological responses to the strongly stress-inducing environment in which we placed them. Specifically, we investigated how heart rate and skin conductance, simulator sickness, and self-reported sense of presence and fear differed in low and high end-to-end latency conditions. The low latency condition was
~50ms; the high condition ~90ms. Other data (demographics, head-tracker logs, and critical-event annotations in physiological data logs) were collected in this between-group study, but a full analysis and report is beyond the scope of this paper. Our data analysis showed a significantly higher (p=0.05) heart rate change for participants in the low latency condition. None of the measures of post-experience simulator sickness, self-reported presence, or self-reported fear showed statistically significant differences or strong trends between high and low latency conditions.
We believe this study to be the first to examine the
relationship of latency and presence and the first to study a system with a visually rich virtual world and relatively low latency (~50 ms). We have carefully measured and controlled latency in our system. Although these latency measurement techniques are not novel, we nevertheless hope that this work will encourage other researchers to both measure and report end-to-end latency as part of their VE system descriptions.
The experiment presented here was conducted during the demonstration of the VE system at SIGGRAPH 2002. This venue had an impact on the experiment, and this is discussed with the experimental protocol.
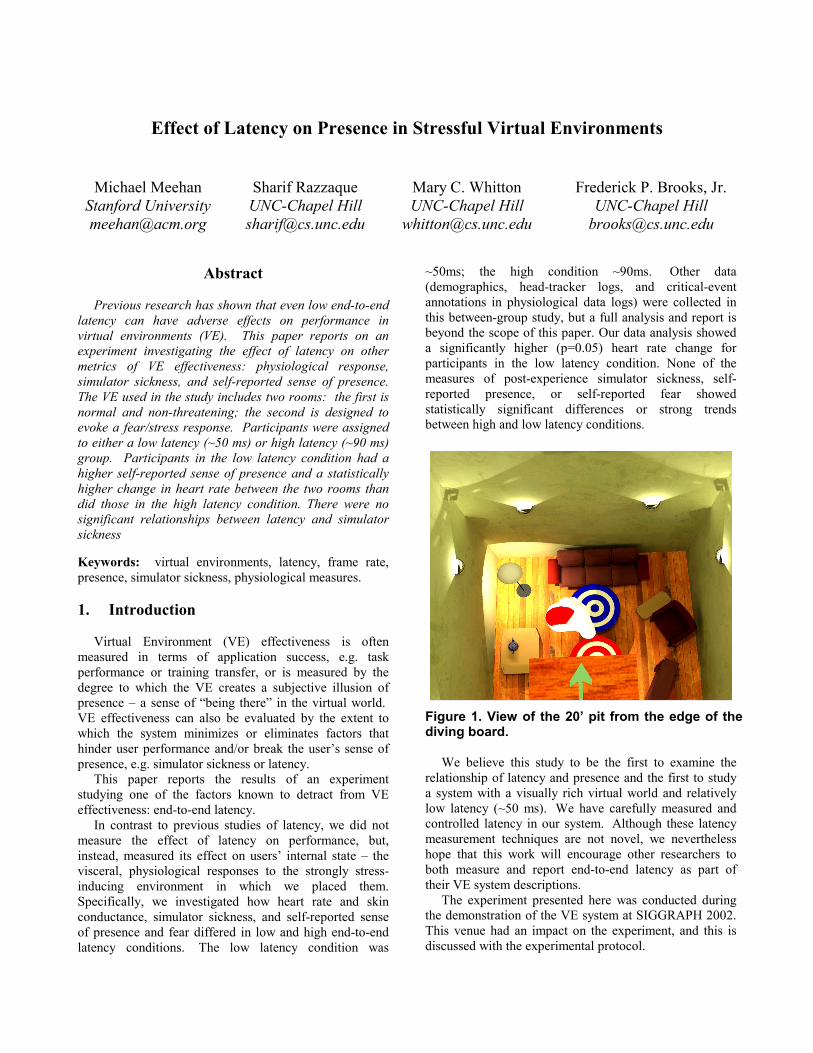
Figure 1. View of the 20’ pit from the edge of the diving board.
2. Background
2.1 Latency
The VE research community does not have a precise and commonly agreed upon definition of latency. The entry for latency in the glossary of VE terms in [Blade 2002] includes three definitions. Latency is sometimes erroneously associated with frame update rate, a misconception that is particularly unfortunate now that frame update rates over 100 fps are common when using fast graphics accelerators. In this paper we use the term latency to refer to end-to-end latency – the delay between a user’s action/motion and when that action is visible in the display.
Techniques used to measure end-to-end latency share the requirement of capturing both a signal generated by a change in the tracker position and a signal generated by the change of the image on the display device. [Ware 1994], [Liang 1991], and [Miné 1993] describe techniques for making these measurements. Latency is known to have an adverse effect on both user performance and comfort in VEs. Recent work by Ellis, et al., [Ellis 1999] is representative of the group’s work – investigating the impact of latency and variations in latency on user performance. Web sites devoted to gaming recommend turning off latency increasing features such a v-sync and limiting special effects rendering to increased system responsiveness. Three of the seven items that Stanney suggests controlling to minimize the adverse effects of VE on users are latency and update related. [Stanney 2002]
Previous work has shown that latency effects task performance. We endeavored to determine its effect on users’ internal states.
2.2 Measuring VE Effectiveness
The VE research community does not yet have common, consistent, and precise ways to think about and measure VE effectiveness. This study used a set of reasonably well-established metrics to assess the effectiveness of our VE system. Our goal was to understand the impact of two latency conditions on what might be called the state of the user, as opposed to the impact of the latency conditions on some measurable outcome resulting from the VE experience
Our premise with respect to VE effectiveness is that the more one behaves and feels in the VE as one would in a comparable real-world environment, the better the VE effectiveness. We applied this premise to users’ sense of presence, to their physiological responses to a stressful environment, and to their levels of simulator sickness. We chose to use measures of the participant’s state that have been established in the literature and could be
collected without the continual involvement of skilled experimenters.
Since presence is a subjective condition, researchers have developed various operational definitions of presence to allow it to be measured. Presence has most commonly been measured by self-reporting (questionnaires). There has been vigorous debate in the community as to how to best do this and [Sadowski 2002] contains a useful summary and extensive bibliography.
[Guyton 1986; Andreassi 1995] document typical physiological responses to stress: rising heart rate and rising skin conductance. Physiological responses such as these have been used to evaluate VE systems designed to induce both stress and relaxation responses in users. [Meehan 2001] showed that physiological responses are positively related to increasing frame rate and inclusion of passive haptics, system characteristics known to contribute to VE effectiveness.
We also include the Kennedy Simulator Sickness Questionnaire in our battery of measures. [Stanney 2002] provides an excellent overview of adverse effects of VEs’ simulator sickness and their frequency and severity of occurrence.
3. The Study
The acceptance of our paper, [Meehan 2002], for SIGGRAPH 2002 prompted Scott Senften, SIGGRAPH 2002 Emerging Technologies Chair, to invite us to demonstrate our system in that venue. We saw this as an opportunity not only to show our system, but also to carry out a study with a potentially large number of participants. With the approval of both SIGGRAPH and the UNC-Chapel Hill Institutional Review Board, we executed the combined demo/study over five days in July 2002.
3.1 Hypotheses
Our hypotheses were that 1) a better VE, in this experiment the one with
lower latency, should elicit more presence, and therefore, should elicit more of a change in heart rate and skin conductance than the less realistic VE (higher latency), and
2) the severity of simulator sickness should be lower in the lower latency VE.
3.2 Participants
Our primary goals were to provide a good VE experience to everyone who visited our SIGGRAPH exhibit and to accommodate as many study participants and guests as possible. We invited each guest at our demo to become a participant in our study. Most accepted; the others experienced the same VE scenario, but their data were not recorded.
We limited our study to participants who were ambulatory, had no self-reported history of epilepsy, were in a reasonable state of good physical fitness at the time of the experiment, were at least 18 years old, and could understand the instructions in spoken English. We relaxed our usual practice of excluding individuals who had consumed alcohol or medications in the past 24 hours or were suffering from emotional stress or sleep deprivation because this was a less realistic restriction at SIGGRAPH.
A total of 195 SIGGRAPH attendees participated in the full demo experience. 164 individuals (average age 35; σ = 10.9; 32 female) passed the inclusion criteria and yielded full or partial data. All 164 had usable questionnaire data. 61 participants had usable heart-rate data and 67 had usable skin-conductance data. These low yields were a consequence of our decisions not to interrupt any VE session to correct failures of the physiological monitoring equipment and of a higher rate of equipment failure than we have seen in our university lab. The later is likely attributable to less experienced experimenters attaching the sensors.
3.3 Latency: The controlled variable
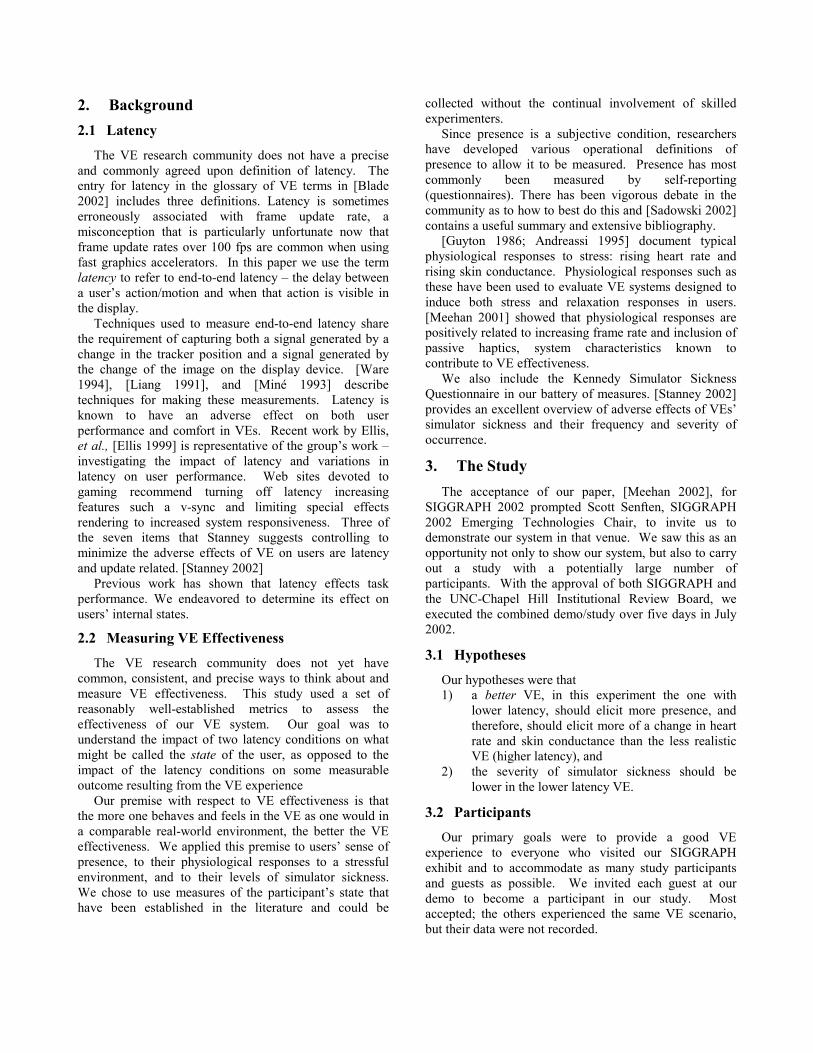
We measured latency using a variation of Miné’s technique that employs a photodiode to detect when a tracked pendulum passes the bottom of its arc. The signal from the pendulum’s photodiode triggers the drawing of full-screen, alternating black and white rectangles in the HMD (after we draw the virtual scene). A photodiode placed next to the optics in one eye of the V8 HMD detects when the screen changes color. An oscilloscope measures the time between changes in the two photodiode signals, one from the pendulum, the other from the HMD. See Figure 2. Our measurements of latency during the experiment are listed in Table 1.
In our VE system, we minimized the latency in several ways. First, we configured the 3rd Tech HiBall tracker to report position at 160Hz (instead of the default 72Hz) and reduced its filtering time-window. Second, we disabled the vertical sync in the graphics card. While the analog video refresh was 60Hz, the frame update rate on the PC was 100-150 fps. This results in a lower end-to-end latency but introduces “tearing” in the video. Whereas some experimenters who were looking for signs of tearing found them, none of the experimental participants reported seeing it. We suspect that the relatively slow response time of the HMD’s LCD masks the tearing and feel that it is a worthwhile trade-off.
Figure 2. We measured latency from the center of the pendulum swing (upper trace) to the middle of the HMD activation curve (ramp in the lower trace).
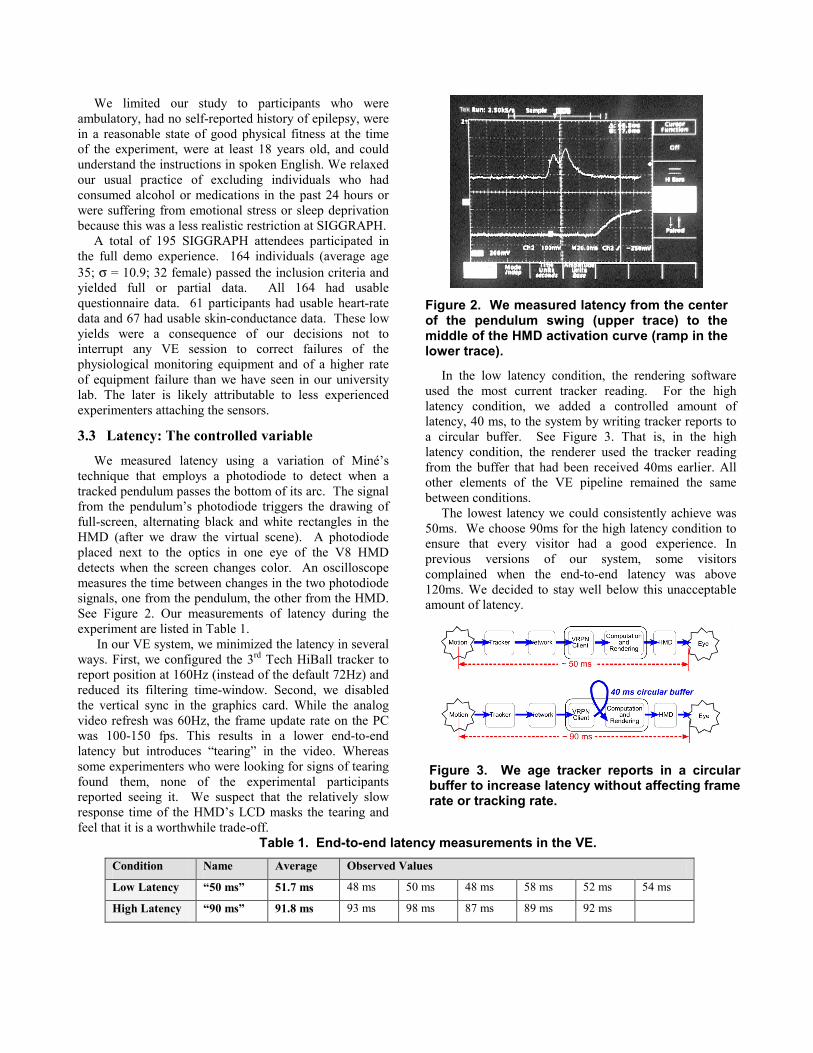
In the low latency condition, the rendering software used the most current tracker reading. For the high latency condition, we added a controlled amount of latency, 40 ms, to the system by writing tracker reports to a circular buffer. See Figure 3. That is, in the high latency condition, the renderer used the tracker reading from the buffer that had been received 40ms earlier. All other elements of the VE pipeline remained the same between conditions.
The lowest latency we could consistently achieve was 50ms. We choose 90ms for the high latency condition to ensure that every visitor had a good experience. In previous versions of our system, some visitors complained when the end-to-end latency was above 120ms. We decided to stay well below this unacceptable amount of latency.
Table 1. End-to-end latency measurements in the VE. Condition Name Average Observed Values
Low Latency “50 ms” 51.7 ms 48 ms 50 ms 48 ms 58 ms 52 ms 54 ms
High Latency “90 ms” 91.8 ms 93 ms 98 ms 87 ms 89 ms 92 ms
Figure 3. We age tracker reports in a circular buffer to increase latency without affecting frame rate or tracking rate.
3.4 Equipment and Environment Model The virtual pit environment. The VE model is an evolution of one by Mel Slater at University College London and used in slightly different forms in Usoh et al. [Usoh 1999], Meehan et al. [Meehan 2002], and Zimmons [Zimmons 2003]. These studies demonstrated that the environment elicits strong physiological and emotional reactions in users.
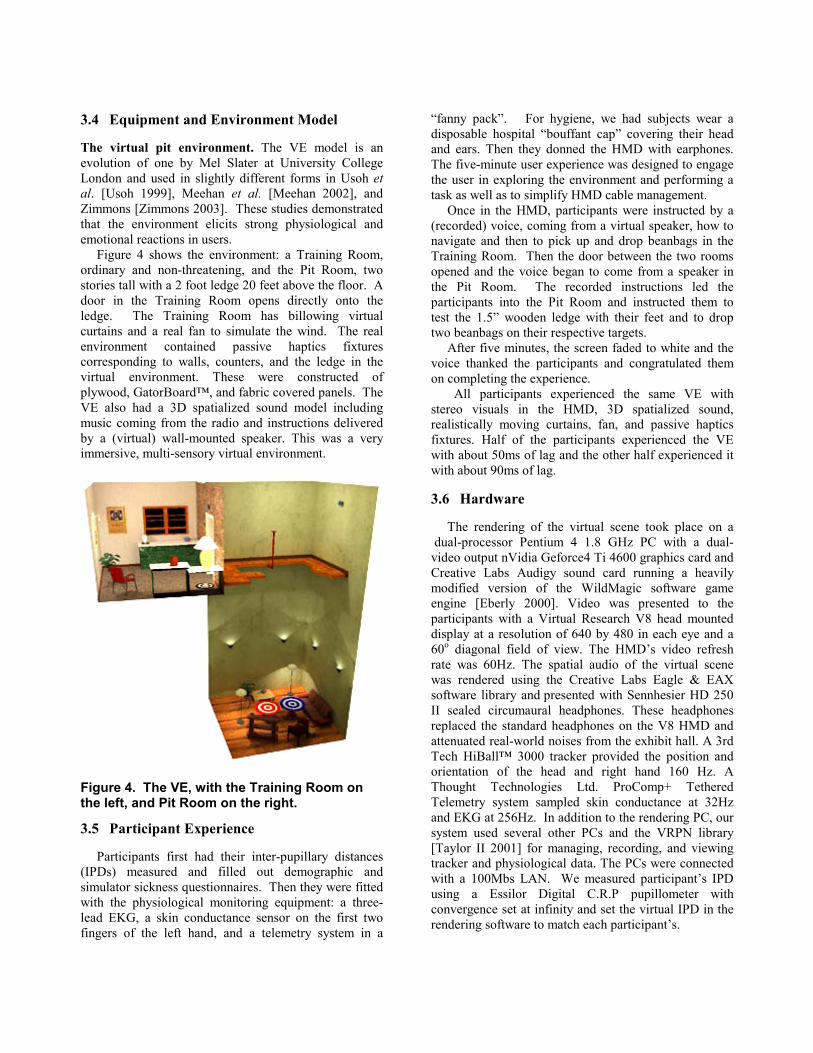
Figure 4 shows the environment: a Training Room, ordinary and non-threatening, and the Pit Room, two stories tall with a 2 foot ledge 20 feet above the floor. A door in the Training Room opens directly onto the ledge. The Training Room has billowing virtual curtains and a real fan to simulate the wind. The real environment contained passive haptics fixtures corresponding to walls, counters, and the ledge in the virtual environment. These were constructed of plywood, GatorBoard™, and fabric covered panels. The VE also had a 3D spatialized sound model including music coming from the radio and instructions delivered by a (virtual) wall-mounted speaker. This was a very immersive, multi-sensory virtual environment.
Figure 4. The VE, with the Training Room on the left, and Pit Room on the right.
3.5 Participant Experience Participants first had their inter-pupillary distances
(IPDs) measured and filled out demographic and simulator sickness questionnaires. Then they were fitted with the physiological monitoring equipment: a three-lead EKG, a skin conductance sensor on the first two fingers of the left hand, and a telemetry system in a
“fanny pack”. For hygiene, we had subjects wear a disposable hospital “bouffant cap” covering their head and ears. Then they donned the HMD with earphones. The five-minute user experience was designed to engage the user in exploring the environment and performing a task as well as to simplify HMD cable management.
Once in the HMD, participants were instructed by a (recorded) voice, coming from a virtual speaker, how to navigate and then to pick up and drop beanbags in the Training Room. Then the door between the two rooms opened and the voice began to come from a speaker in the Pit Room. The recorded instructions led the participants into the Pit Room and instructed them to test the 1.5” wooden ledge with their feet and to drop two beanbags on their respective targets.
After five minutes, the screen faded to white and the voice thanked the participants and congratulated them on completing the experience.
All participants experienced the same VE with stereo visuals in the HMD, 3D spatialized sound, realistically moving curtains, fan, and passive haptics fixtures. Half of the participants experienced the VE with about 50ms of lag and the other half experienced it with about 90ms of lag.
3.6 Hardware
The rendering of the virtual scene took place on a dual-processor Pentium 4 1.8 GHz PC with a dual-video output nVidia Geforce4 Ti 4600 graphics card and Creative Labs Audigy sound card running a heavily modified version of the WildMagic software game engine [Eberly 2000]. Video was presented to the participants with a Virtual Research V8 head mounted display at a resolution of 640 by 480 in each eye and a 60o diagonal field of view. The HMD’s video refresh rate was 60Hz. The spatial audio of the virtual scene was rendered using the Creative Labs Eagle & EAX software library and presented with Sennhesier HD 250 II sealed circumaural headphones. These headphones replaced the standard headphones on the V8 HMD and attenuated real-world noises from the exhibit hall. A 3rd Tech HiBall™ 3000 tracker provided the position and orientation of the head and right hand 160 Hz. A Thought Technologies Ltd. ProComp+ Tethered Telemetry system sampled skin conductance at 32Hz and EKG at 256Hz. In addition to the rendering PC, our system used several other PCs and the VRPN library [Taylor II 2001] for managing, recording, and viewing tracker and physiological data. The PCs were connected with a 100Mbs LAN. We measured participant’s IPD using a Essilor Digital C.R.P pupillometer with convergence set at infinity and set the virtual IPD in the rendering software to match each participant’s.
3.7 Measures and Analysis
We collected logs of the physiological and tracker data and responses to presence, fear, and simulator sickness questionnaires.
Physiological Data. We used two physiological metrics that measure stress in real environments [Guyton 1986; Andreassi 1995; Weiderhold 1998]: � Change in heart rate (∆ Heart Rate). The heart speeds up in stress. � Change in skin conductance (∆ Skin Conductance Level). The hands sweat more in stress.
Each of these measures was constructed to increase when the physiological reaction to the Pit Room was greater.
∆ Heart Rate = mean HR Pit Room - mean HR Training Room.
∆ Skin Conductance = mean SC Pit Room - mean SC Training Room
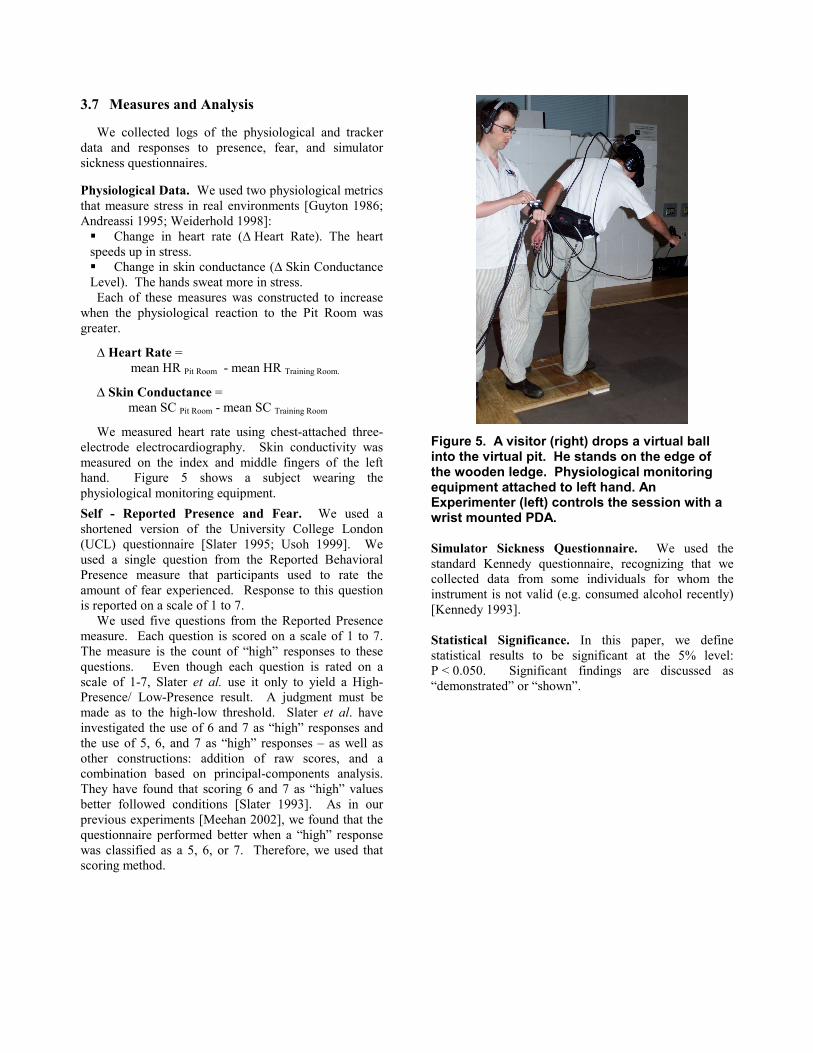
We measured heart rate using chest-attached three-electrode electrocardiography. Skin conductivity was measured on the index and middle fingers of the left hand. Figure 5 shows a subject wearing the physiological monitoring equipment. Self - Reported Presence and Fear. We used a shortened version of the University College London (UCL) questionnaire [Slater 1995; Usoh 1999]. We used a single question from the Reported Behavioral Presence measure that participants used to rate the amount of fear experienced. Response to this question is reported on a scale of 1 to 7.
We used five questions from the Reported Presence measure. Each question is scored on a scale of 1 to 7. The measure is the count of “high” responses to these questions. Even though each question is rated on a scale of 1-7, Slater et al. use it only to yield a High-Presence/ Low-Presence result. A judgment must be made as to the high-low threshold. Slater et al. have investigated the use of 6 and 7 as “high” responses and the use of 5, 6, and 7 as “high” responses – as well as other constructions: addition of raw scores, and a combination based on principal-components analysis. They have found that scoring 6 and 7 as “high” values better followed conditions [Slater 1993]. As in our previous experiments [Meehan 2002], we found that the questionnaire performed better when a “high” response was classified as a 5, 6, or 7. Therefore, we used that scoring method.
Figure 5. A visitor (right) drops a virtual ball into the virtual pit. He stands on the edge of the wooden ledge. Physiological monitoring equipment attached to left hand. An Experimenter (left) controls the session with a wrist mounted PDA.
Simulator Sickness Questionnaire. We used the standard Kennedy questionnaire, recognizing that we collected data from some individuals for whom the instrument is not valid (e.g. consumed alcohol recently) [Kennedy 1993]. Statistical Significance. In this paper, we define statistical results to be significant at the 5% level: P < 0.050. Significant findings are discussed as “demonstrated” or “shown”.
4. Results
We found that lower latency corresponded with higher presence in this stressful VE. ∆Heart Rate was most sensitive to the difference.
4.1 Effect on physiological measures Reaction to the Pit Room. Of primary importance in this experiment is whether the VE elicits any reaction from the users. As in our previous experiments, we found that both ∆Heart Rate and ∆Skin Conductance were consistently higher in the Pit Room than in the Training Room. See Table 2. This confirms that our participants had a reliable physiological reaction to the stress inducing pit room. Table 2. Difference in physiological reaction between the Pit Room and Training Room. Measure Average
Difference (Pit – Training)
# > 0 T-test for H0: Mean > 0
∆∆∆∆Heart Rate 8.6 ∆BPM 60/61 cases P < 0.001 ∆∆∆∆Skin Conductance
3.8 ∆µSiemens 67/67 cases P < 0.001
Correlation among measures. ∆Heart Rate did not correlate significantly with any of the self-reported measures, such as simulator sickness or fear. The only significant correlation between any self-reported measure and any physiological measure was with ∆Skin Conductance and Reported Fear (corr. = .275, P = .024). Table 3. Statistical model for ∆∆∆∆Heart Rate.
Model: ∆∆∆∆Heart Rate =~ Latency
Condition
Average Difference (∆∆∆∆ BPM) Std. Err Sig N
50 ms 10.1 1.06 0.050 32 90 ms 7.0 1.11 29
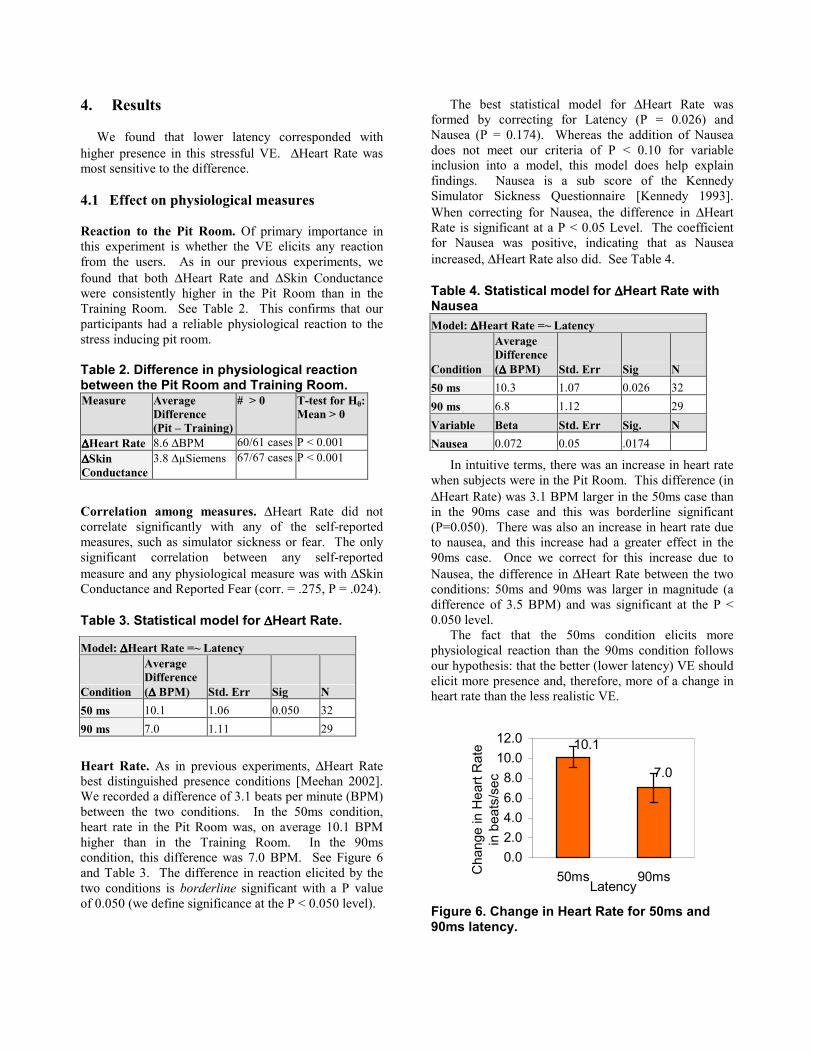
Heart Rate. As in previous experiments, ∆Heart Rate best distinguished presence conditions [Meehan 2002]. We recorded a difference of 3.1 beats per minute (BPM) between the two conditions. In the 50ms condition, heart rate in the Pit Room was, on average 10.1 BPM higher than in the Training Room. In the 90ms condition, this difference was 7.0 BPM. See Figure 6 and Table 3. The difference in reaction elicited by the two conditions is borderline significant with a P value of 0.050 (we define significance at the P < 0.050 level).
The best statistical model for ∆Heart Rate was formed by correcting for Latency (P = 0.026) and Nausea (P = 0.174). Whereas the addition of Nausea does not meet our criteria of P < 0.10 for variable inclusion into a model, this model does help explain findings. Nausea is a sub score of the Kennedy Simulator Sickness Questionnaire [Kennedy 1993]. When correcting for Nausea, the difference in ∆Heart Rate is significant at a P < 0.05 Level. The coefficient for Nausea was positive, indicating that as Nausea increased, ∆Heart Rate also did. See Table 4.
Table 4. Statistical model for ∆∆∆∆Heart Rate with Nausea Model: ∆∆∆∆Heart Rate =~ Latency
Condition
Average Difference (∆∆∆∆ BPM) Std. Err Sig N
50 ms 10.3 1.07 0.026 32 90 ms 6.8 1.12 29 Variable Beta Std. Err Sig. N Nausea 0.072 0.05 .0174
In intuitive terms, there was an increase in heart rate when subjects were in the Pit Room. This difference (in ∆Heart Rate) was 3.1 BPM larger in the 50ms case than in the 90ms case and this was borderline significant (P=0.050). There was also an increase in heart rate due to nausea, and this increase had a greater effect in the 90ms case. Once we correct for this increase due to Nausea, the difference in ∆Heart Rate between the two conditions: 50ms and 90ms was larger in magnitude (a difference of 3.5 BPM) and was significant at the P < 0.050 level.
The fact that the 50ms condition elicits more physiological reaction than the 90ms condition follows our hypothesis: that the better (lower latency) VE should elicit more presence and, therefore, more of a change in heart rate than the less realistic VE.
10.1
7.0
0.02.04.06.08.0
10.012.0
50ms 90msLatency
Cha
nge
in H
eart
Rat
e in
bea
ts/s
ec
Figure 6. Change in Heart Rate for 50ms and 90ms latency.
Skin Conductance. As shown in Table 5, ∆Skin Conductance was non-significantly higher in the 90ms case. This is opposite our hypothesized direction. However, there were significant correlations between ∆Skin Conductance and Nausea (corr. = 0.250, P = 0.041) and this supports the assumption that the increases in skin conductance were not due to an increase in presence, but instead were due to queasiness. This follows since Nausea is known to be associated with an increase in palmar sweat. [Warwick-Evans 1987; Hu 1999] Table 5. Statistical model for ∆∆∆∆Skin Conductance. ∆∆∆∆Skin Conductance =~ Latency
Condition Average Difference (∆∆∆∆µSiemens) Std. Err. Sig. N
50 ms 3.7 0.38 0.724 34 90 ms 3.9 0.39 33
4.2 Effect on self-reported measures Reported Presence. Reported presence was non-significantly higher in the 50ms case than in the 90ms case (P = 0.37). This is in the hypothesized direction. Reported Fear. Reported Fear (a single question: scored on the scale of 1 to 7) was non-significantly higher in the 90ms case. This is in the opposite direction as hypothesized. Simulator Sickness. There were a number of significant results surrounding Kennedy’s Simulator Sickness Questionnaire (SSQ) and its sub scores of Nausea, Disorientation, and Ocular Discomfort. First, participants, in both conditions, reported higher pre and post-exposure simulator sickness scores than in previous studies. We suspect that since the frame rate was higher and the latency was relatively low (50ms and 90 ms), that other factors related to SIGGRAPH contributed to the high simulator sickness: exposure to multiple virtual environments, alcohol consumption, lack of sleep, and general stress.
Reported Fear significantly correlated with the combined Simulator Sickness score (corr. = 0.329, P < 0.000) as well as the sub-scores of Nausea (corr. = 0.333, P < 0.001), Ocular Discomfort (corr. = 0.220, P = 0.005), and Disorientation (corr. = 0.285, P < 0.001). This relationship could be due to a number of factors: if the experience of being near the height is upsetting, it could cause symptoms of simulator sickness, nausea, ocular discomfort, and disorientation. Alternatively, the relationship could be causal in the other direction. It could be possible that the higher simulator sickness
caused visitors to believe more in the virtual experience: attributing the simulator sickness, whatever the cause, to fear of being near a height.
5. Conclusions
Participants experiencing lower end-to-end latency in our stress-inducing VE had significantly more heart rate reaction to the stressful Pit Room than did those in the higher latency condition. Based on this and our previous findings [Meehan 2002], we believe that end-to-end latency, even when below 100ms, is an important parameter in understanding the effectiveness of the VE. Like frame rate, it should be measured, controlled and reported in all VE research.
6. Acknowledgements
We offer our thanks to Mel Slater and his laboratory for the original “virtual pit” model; Thought Technologies for loan of two ProComp+ systems for the study; and 3rdTech, Inc. for technical support at SIGGRAPH 2002.
Beyond the authors, many UNC students & staff worked hard over the summer to build the VE system: Chuck Mason, William Sanders, Angus Antley, Greg Coombe, Thorsten Schueurmann, Mark Harris, David Harrison, John Thomas, Jim Mahaney, and Kurtis Keller.
The study would not have been possible without the help of 20+ UNC faculty members and students who helped conduct the demo and experiment in San Antonio.
This work was supported by grants from the Office of Naval Research, the NIH National Center for Research Resources (P41 RR 02170), and the National Institute for Biomedical Imaging and Bioengineering. Other support was supplied by NVIDIA, and the Link Foundation.
7. References Andreassi, J. L. (1995). Psychophysiology: human behavior
and physiological response. Hillsdale, N.J., Lawrence Erlbaum Associates.
Blade, R. and M. Padgett (2002). Virtual Environments Standards and Terminology. Handbook of Virtual Environments: Design, Implementation, and Applications. K. M. Stanney. Mahwah, NJ., Lawrence Erlbaum Associates, Inc.: 15-27.
Eberly, D. H. (2000). 3D Game Engine Design: A Practical Approach to Real-Time Computer Graphics, Morgan Kaufmann Publishers.
Ellis, S. R., M. J. Young, B. D. Adelstein and S. M. Ehrlich (1999). Discrimination of changes in latency during voluntary hand movement of virtual objects. Proceedings of Human Factors and Ergonomics Society, Houston, TX.
Guyton, A. C. (1986). Basic characteristics of the sympathetic and parasympathetic function. Textbook of Medical Physiology. Philadelphia, W.B. Saunders Company: 688-97.
Hu, S., K. A. McChesney, K. A. Player, A. M. Bahl, J. B. Buchanan and J. E. Scozzafava (1999). Systematic investigation of physiological correlates of motion sickness induced by viewing an optokinetic rotating drum. Aviat Space Environ Med 70(8): 759-65.
Kennedy, R. S., Lane, Berbaum and M. G. Lilienthal (1993). A simulator sickness questionnaire (SSQ): A new method for quantifying simulator sickness. International Journal of Aviation Psychology 3(3): 203-20.
Liang, J., C. Shaw and G. M. (1991). On temporal-spatial realism in the virtual reality environment. Proceedings of Proceedings of ACM UIST '91, New York.
Meehan, M. (2001). Physiological reaction as an objective measure of presence in virtual environments. Computer Science. Chapel Hill, NC, University of North Carolina.
Meehan, M., B. Insko, M. Whitton and F. P. Brooks (2002). Physiological measures of presence in stressful virtual environments. Proceedings of SIGGRAPH 2002, San Antonio, Tx, USA.
Miné, M. R. (1993). Characterization of end-to-end delays in head-mounted display systems. Chapel Hill, NC, University of North Carolina.
Sadowski, W. and K. Stanney (2002). Presence in Virtual Environments. Handbook of Virtual Environments: Design, Implementation, and Applications. K. M. Stanney. Mahwah, NJ., Lawrence Erlbaum Associates, Inc.: 791-806.
Slater, M. and M. Usoh (1993). Presence in immersive virtual environments. Proceedings of Virtual Reality Annual International Symposium (VRAIS).
Slater, M., M. Usoh and Y. Chrysanthou (1995). The influence of dynamic shadows on presence in immersive virtual environments. Proceedings of Virtual Environments '95.
Stanney, K., R. Kennedy and K. Kinggon (2002). Virtual Environment Usage Protocols. Handbook of Virtual Environments: Design, Implementation, and Applications. K. M. Stanney. Mahwah, NJ., Lawrence Erlbaum Associates, Inc.: 721-30.
Taylor II, R., T. Hudson, A. Seeger, H. Weber, J. Juliano and A. Helser (2001). VRPN: A Device-Independent, Network-Transparent VR Peripheral System. Proceedings of Proceedings of the ACM symposium on Virtual Reality Software and Technology, Banff, Alberta, ACM.
Usoh, M., K. Arthur, M. C. Whitton, R. Bastos, A. Steed, M. Slater and F. P. Brooks (1999). Walking > walking-in-place > flying in virtual environments. Proceedings of Proceedings of ACM SIGGRAPH 99, Los Angeles.
Ware, C. and R. Balakrishnan (1994). Reaching for Objects in VR Displays: Lag and Frame Rate. ACM Transactions on Computer-Human Interaction 1(4): 331-56.
Warwick-Evans, L. A., R. E. Church, C. Hancock, D. Jochim, P. H. Morris and F. Ward (1987). Electrodermal activity as an index of motion sickness. Aviat Space Environ Med 58(5): 417-23.
Weiderhold, B. K., R. Gervirtz and M. D. Wiederhold (1998). Fear of flying: A case report using virtual reality therapy with physiological monitoring. CyberPsychology and Behavior 1(2): 97-104.
Zimmons, P. and A. Panter (2003). The influence of rendering quality on presence and task performance in a virtual environment. Proceedings of IEEE VR 2003.