Embed Size (px)
Citation preview
This article was downloaded by: [Stony Brook University]On: 27 October 2014, At: 22:57Publisher: Taylor & FrancisInforma Ltd Registered in England and Wales Registered Number: 1072954 Registeredoffice: Mortimer House, 37-41 Mortimer Street, London W1T 3JH, UK
ErgonomicsPublication details, including instructions for authors andsubscription information:http://www.tandfonline.com/loi/terg20
Effect of keyswitch design of desktopand notebook keyboards related to keystiffness and typing forceMarcia J. Bufton a , Richard W. Marklin a , Mark L. Nagurka a & GuyG. Simoneau ba Department of Mechanical Engineering , Marquette University ,P.O. Box 1881, Milwaukee, WI, 53201–1881, USAb Department of Physical Therapy , Marquette University , 346Walter Schroeder Complex, P.O. Box 1881, Milwaukee, WI,53201–1881, USAPublished online: 20 Feb 2007.
To cite this article: Marcia J. Bufton , Richard W. Marklin , Mark L. Nagurka & Guy G. Simoneau(2006) Effect of keyswitch design of desktop and notebook keyboards related to key stiffness andtyping force, Ergonomics, 49:10, 996-1012, DOI: 10.1080/00140130600577437
To link to this article: http://dx.doi.org/10.1080/00140130600577437
PLEASE SCROLL DOWN FOR ARTICLE
Taylor & Francis makes every effort to ensure the accuracy of all the information (the“Content”) contained in the publications on our platform. However, Taylor & Francis,our agents, and our licensors make no representations or warranties whatsoever as tothe accuracy, completeness, or suitability for any purpose of the Content. Any opinionsand views expressed in this publication are the opinions and views of the authors,and are not the views of or endorsed by Taylor & Francis. The accuracy of the Contentshould not be relied upon and should be independently verified with primary sourcesof information. Taylor and Francis shall not be liable for any losses, actions, claims,proceedings, demands, costs, expenses, damages, and other liabilities whatsoever orhowsoever caused arising directly or indirectly in connection with, in relation to or arisingout of the use of the Content.
This article may be used for research, teaching, and private study purposes. Anysubstantial or systematic reproduction, redistribution, reselling, loan, sub-licensing,systematic supply, or distribution in any form to anyone is expressly forbidden. Terms &

Conditions of access and use can be found at http://www.tandfonline.com/page/terms-and-conditions
Dow
nloa
ded
by [
Ston
y B
rook
Uni
vers
ity]
at 2
2:57
27
Oct
ober
201
4
Effect of keyswitch design of desktopand notebook keyboards relatedto key stiffness and typing force
MARCIA J. BUFTON{, RICHARD W. MARKLIN*{,MARK L. NAGURKA{ and GUY G. SIMONEAU{
{Department of Mechanical Engineering, Marquette University, P.O. Box 1881,
Milwaukee, WI 53201–1881, USA
{Department of Physical Therapy, Marquette University, 346 Walter Schroeder
Complex, P.O. Box 1881, Milwaukee, WI 53201–1881, USA
This study aimed to compare and analyse rubber-dome desktop, spring-
column desktop and notebook keyboards in terms of key stiffness and
fingertip typing force. The spring-column keyboard resulted in the highest
mean peak contact force (0.86N), followed by the rubber dome desktop
(0.68N) and the notebook (0.59N). All these differences were statistically
significant. Likewise, the spring-column keyboard registered the highest
fingertip typing force and the notebook keyboard the lowest. A comparison
of forces showed the notebook (rubber dome) keyboard had the highest
fingertip-to-peak contact force ratio (overstrike force), and the spring-column
generated the least excess force (as a ratio of peak contact force). The results
of this study could aid in optimizing computer key design that could possibly
reduce subject discomfort and fatigue.
Keywords: Computer keys; Computer keyboard; Typing; Typing force
1. Introduction
Although forces required to press computer keyboard keys are low, the repetitive nature
of typing may result in enough cumulative fingertip force for those who type extensively
throughout the workday to contribute to musculoskeletal disorders (MSDs) of the upper
extremity such as carpal tunnel syndrome and tenosynovitis. Rempel and Gerson (1991)
published one of the earliest studies concerning the relationship between applied fingertip
force and keyboarding. In a comparative study between the amount of force applied by
typists to the minimum force required for key activation, they found that typing forces
applied by the participants were 2.2 to 4.7 times greater than the minimum force required
to depress computer keys as determined from force-displacement curves.
*Corresponding author. Email: [email protected]
Ergonomics
Vol. 49, No. 10, 15 August 2006, 996–1012
ErgonomicsISSN 0014-0139 print/ISSN 1366-5847 online ª 2006 Taylor & Francis
http://www.tandf.co.uk/journalsDOI: 10.1080/00140130600577437
Dow
nloa
ded
by [
Ston
y B
rook
Uni
vers
ity]
at 2
2:57
27
Oct
ober
201
4
Studies published by Armstrong et al. (1994) and Martin et al. (1994) showed similar
results between typing forces and keyboard reaction forces. The Armstrong et al. (1994)
study focused on determining if users exerted more force on some keyboards than others.
Instead of typing on one keyboard, participants used three keyboards with different peak
contact force values. The typists exerted 2.5 to 3.9 times more force than the required
forces of the three keyboards. The Martin et al. (1994) study found that the participants
used three to five times more excess force followed by studies with similar ranges of four
to five (Martin et al. 1996) and four to seven (Gerard et al. 1996).
Gerard et al. (1999) furthered keyboard research with a study that incorporated
keyswitch stiffness, typing pace, fatigue, subject discomfort, muscle activity and
auditory feedback. The keyboards included one spring-column key keyboard with a
minimum peak force required to depress a key of 0.72N and an audible click upon
key activation and three rubber dome keyboards with peak contact forces of 0.28N,
0.56N, 0.83N and no audible clicks. They found that participants typed with more
force and reported more discomfort while typing on the stiffer keyboard of 0.83N
peak contact force. As the peak contact force increased, the typing force and
electromyographic (EMG) levels for extensor and flexor activity increased for the
rubber dome keys. Interestingly, the spring-column keyboard (0.72N peak contact
force) had the same ratio between force applied to the keyboard and EMG readings
as the 0.28N rubber dome board. The authors concluded that the auditory feedback
supplied by the click of the spring keys and/or the abrupt force change upon key
activation may have reduced overstrike force and resulted in strike force-EMG levels
on par with the 0.28N keyboard.
These previous studies focused on the relationship of various desktop keyboard and
keyswitch designs to key stiffness, fingertip loading, EMG activity of forearm muscles
and subject comfort. The keyboards were mostly of the rubber dome key type, although a
few utilized the spring-column design. To the authors’ knowledge, however, no studies
have been published on the biomechanical and subjective assessment of notebook
computer keys or on a comparative analysis of notebook and desktop keyboards. Since
notebooks are becoming increasingly popular, their effect relative to MSDs is of interest
since, for those who use a keyboard extensively each workday, they have the same
inherent risk factors of MSDs (high repetition and awkward wrist posture) as
conventional desktop PCs.
The objectives of this present study were:
1. To identify and compare the force-displacement characteristics of notebook (rubber
dome key design) and desktop (rubber-dome and spring-column key design)
computer keyboards from the same manufacturer under dynamic conditions at
normal typing speeds;
2. To compare force-displacement characteristics between various keys within each
of the three keyboards (notebook, rubber-dome desktop and spring-column
desktop);
3. To evaluate the applied fingertip force (as a function of key resistance and travel
distance) during typing on all three keyboards followed by a comparison between
keyboards;
4. To compare the peak contact forces and fingertip forces for each keyboard and
between keyboards;
5. To examine subjective assessment of ease and comfort for each keyboard and typists’
keyboard preference among the three keyboards.
Keyswitch design and typing force 997
Dow
nloa
ded
by [
Ston
y B
rook
Uni
vers
ity]
at 2
2:57
27
Oct
ober
201
4
2. Methods
To accomplish the specified objectives, the experimental design and analysis of this study
were performed in two parts. Part 1 examined the force-displacement characteristics of
the keyboards as the keys were depressed and released at different constant velocities.
Analysis was performed both within and between keyboards. Part 2 examined the
fingertip forces that participants applied to the keys as they typed and provided a
comparative analysis between keyboards. In conjunction with this part of the study,
qualitative results from subject questionnaires were also analysed and compared. The
results from both parts 1 and 2 were then used for a comparison of key stiffness and
typing force between keyboards.
2.1. Experimental design – part 1: an investigation of key stiffness characteristics
The experimental design was a 3 (keyboard)64 (key)63 (test speed) factorial design with
five replicates of each condition in random order for a total of 180 observations. The
three keyboards tested were a desktop rubber-dome, a desktop spring-column and the
notebook. (To the authors’ knowledge, notebook keyboards exclusively use rubber dome
key design.) All keyboards were acquired from the same major computer manufacturer
and had very minimal prior use.
The next independent variable, key type, involved four keys, the ‘a’, ‘e’, ‘s’ and ‘t’.
These keys, which account for four of the six most commonly typed keys in the English
language (Mayzner and Tresselt 1965), are of similar size and design.
The final independent variable considered was key velocity at three levels: 0.5 mm/s;
30 mm/s; and 60 mm/s. A typing speed of 60 mm/s translates to approximately 90 words
per min (wpm) (assuming constant speed of depression and release), which is a reasonable
typing speed for a trained touch typist (Liu 1999). Likewise, 30 mm/s corresponds to
approximately 45 wpm. The two key velocities offer a realistic range of typing speed,
while 0.5 mm/s represents a quasi-static condition.
The dependent variable was the peak contact force required to depress the key as
measured in N. The ‘peak contact travel’ (the distance the key travels from rest to peak
contact force) was measured in mm.
2.1.1. Equipment and measurements. The force-displacement measurements for key
stiffness characteristics were acquired through the test system developed by Nagurka
et al. (1999). A photograph of the test rig (figure 1) provides an overall view of its general
features and layout. This test rig measured key displacement and key force under
controlled velocities of travel. The test rig is described briefly here as it was described in
detail in a recent publication (Nagurka and Marklin 2005). The primary feature was the
machine-driven probe, which struck the key in either a quasi-static (0.5 mm/s) or
dynamic mode. The stage-probe assembly was powered by a stepper motor that also
controls the velocity of the keystroke. At the operator’s command, the stage advanced the
probe arm at a specified velocity and depressed the key to just above the end range of
travel. The stage then reversed direction and returned the probe to its ‘home’ position at
the same velocity the key was depressed. The displacement and force measurements were
acquired during probe movement through the use of sensors. An optical encoder,
attached to the motorized positioning stage, measured displacement up to 100 mm of
travel with a resolution of 1 mm. Simultaneous force measurements were acquired
through the use of a miniature-sized strain gauge load cell mounted in line with the probe
998 M. J. Bufton et al.
Dow
nloa
ded
by [
Ston
y B
rook
Uni
vers
ity]
at 2
2:57
27
Oct
ober
201
4
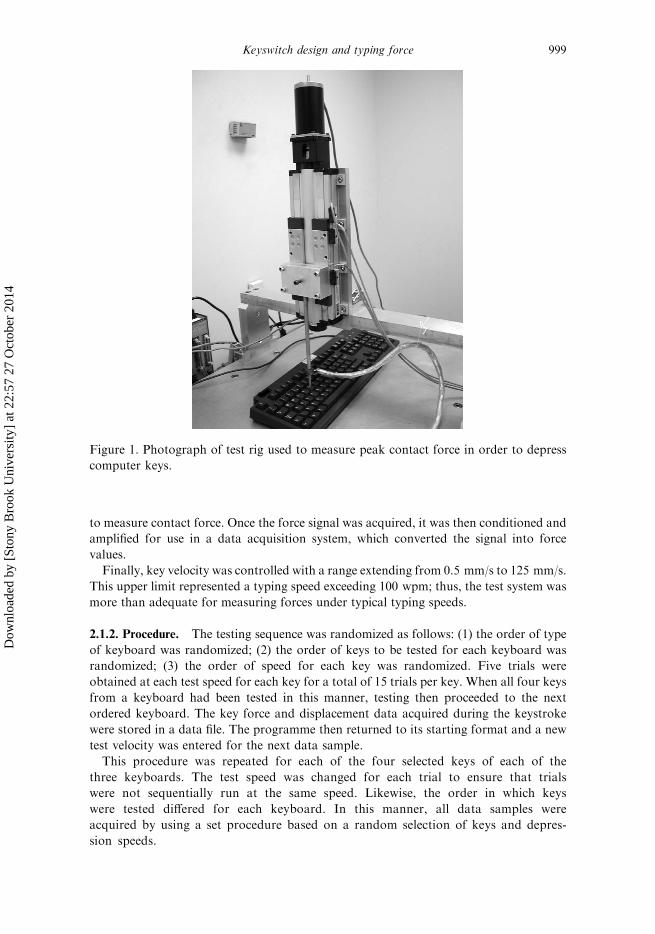
to measure contact force. Once the force signal was acquired, it was then conditioned and
amplified for use in a data acquisition system, which converted the signal into force
values.
Finally, key velocity was controlled with a range extending from 0.5 mm/s to 125 mm/s.
This upper limit represented a typing speed exceeding 100 wpm; thus, the test system was
more than adequate for measuring forces under typical typing speeds.
2.1.2. Procedure. The testing sequence was randomized as follows: (1) the order of type
of keyboard was randomized; (2) the order of keys to be tested for each keyboard was
randomized; (3) the order of speed for each key was randomized. Five trials were
obtained at each test speed for each key for a total of 15 trials per key. When all four keys
from a keyboard had been tested in this manner, testing then proceeded to the next
ordered keyboard. The key force and displacement data acquired during the keystroke
were stored in a data file. The programme then returned to its starting format and a new
test velocity was entered for the next data sample.
This procedure was repeated for each of the four selected keys of each of the
three keyboards. The test speed was changed for each trial to ensure that trials
were not sequentially run at the same speed. Likewise, the order in which keys
were tested differed for each keyboard. In this manner, all data samples were
acquired by using a set procedure based on a random selection of keys and depres-
sion speeds.
Figure 1. Photograph of test rig used to measure peak contact force in order to depress
computer keys.
Keyswitch design and typing force 999
Dow
nloa
ded
by [
Ston
y B
rook
Uni
vers
ity]
at 2
2:57
27
Oct
ober
201
4
2.1.3. Statistical methods. The statistical analysis of key stiffness was designed to
observe a spectrum of differences ranging from keys to keyboards. Tests for statistical
significance were run to detect differences between keys of a same keyboard and those of
different keyboards while also considering the effect of test speed. These factors of test
speed and type of key formed the basis for testing the statistical difference between the
three keyboards. The statistical results were presented in ANOVA table form using the
p-value probability approach and were based on the distributive assumption of normality,
which is justified due to the large sample size. A detailed comparison between pairs of
population means was provided through the use of the Duncan multiple range test.
2.2. Experimental design – part 2: typing force
A single factor, full factorial experiment with one independent variable – keyboard – and
repeated blocking on participants was used in this part of the study. The dependent
variable was the fingertip force transmitted to the keyboard by the subject during typing
trials.
2.2.1. Participants. Ten female participants were chosen for this study based on various
criteria related to health, age, typing speed, skill level and experience. The participants
were required to be ten digit (‘touch’) typists with a minimum typing speed of 40 wpm.
(‘Touch’ is defined as the ability to type accurately without looking at the keys; ‘ten digit
touch typist’ is standard nomenclature for trained typists.) Their ages ranged from 19
to 49 years (mean 41.6, SD 8.9) and their typing experience from 5 to 30 years (mean
20.4, SD 7.5). Subject information forms were filled out on all participants inclu-
ding experience with each keyboard type. Additionally, height (mean 164.4 cm, SD 9.3),
weight (mean 63.4 kg, SD 11.0) and other anthropometric variables were measured on all
participants. Only participants with no previous history of hand paresthesias or related
upper extremity pain or disorders within the past 10 years were considered.
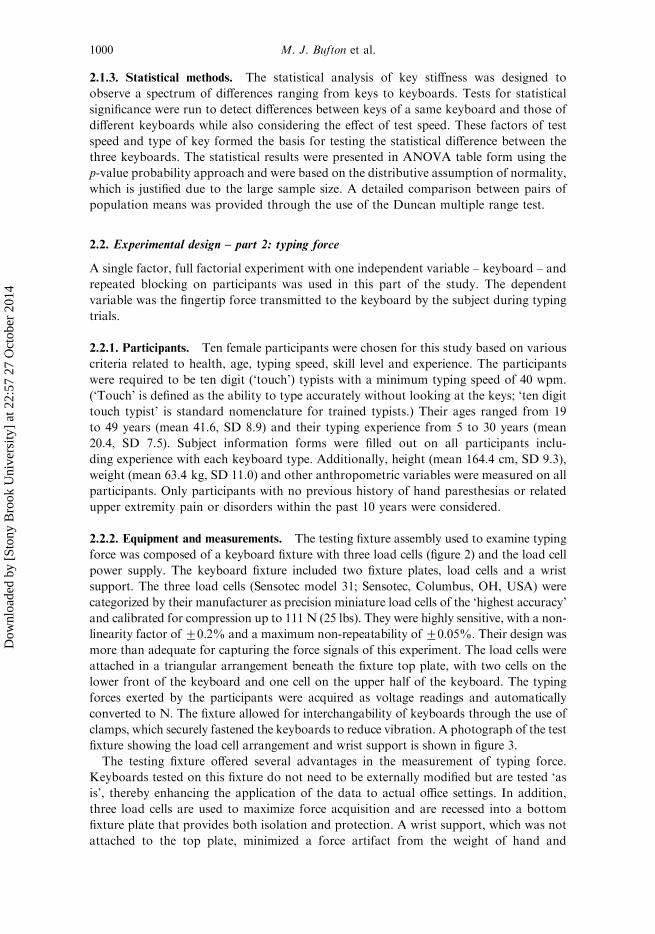
2.2.2. Equipment and measurements. The testing fixture assembly used to examine typing
force was composed of a keyboard fixture with three load cells (figure 2) and the load cell
power supply. The keyboard fixture included two fixture plates, load cells and a wrist
support. The three load cells (Sensotec model 31; Sensotec, Columbus, OH, USA) were
categorized by their manufacturer as precision miniature load cells of the ‘highest accuracy’
and calibrated for compression up to 111 N (25 lbs). They were highly sensitive, with a non-
linearity factor of +0.2% and a maximum non-repeatability of+0.05%. Their design was
more than adequate for capturing the force signals of this experiment. The load cells were
attached in a triangular arrangement beneath the fixture top plate, with two cells on the
lower front of the keyboard and one cell on the upper half of the keyboard. The typing
forces exerted by the participants were acquired as voltage readings and automatically
converted to N. The fixture allowed for interchangability of keyboards through the use of
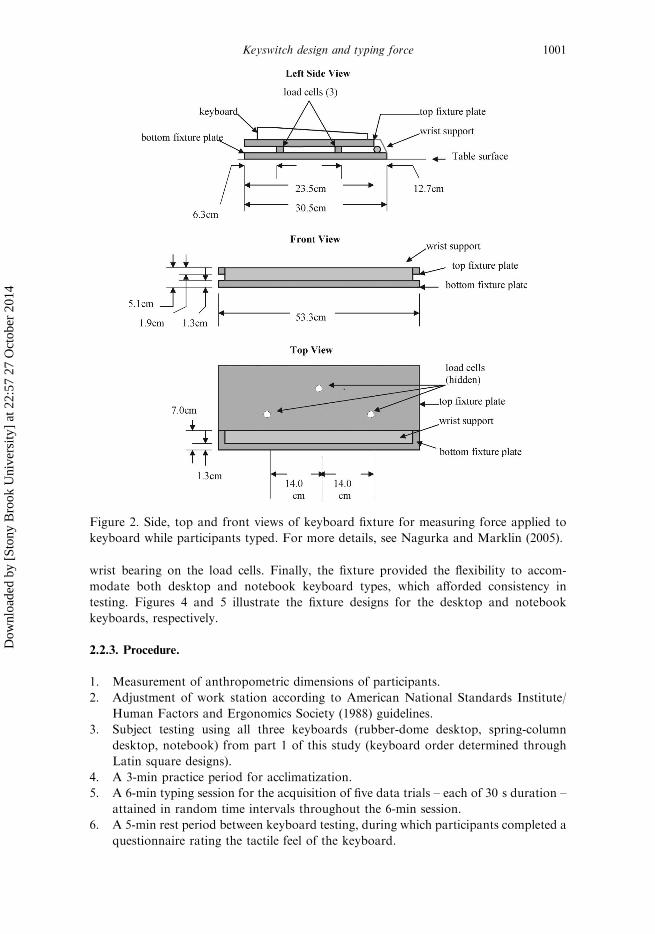
clamps, which securely fastened the keyboards to reduce vibration. A photograph of the test
fixture showing the load cell arrangement and wrist support is shown in figure 3.
The testing fixture offered several advantages in the measurement of typing force.
Keyboards tested on this fixture do not need to be externally modified but are tested ‘as
is’, thereby enhancing the application of the data to actual office settings. In addition,
three load cells are used to maximize force acquisition and are recessed into a bottom
fixture plate that provides both isolation and protection. A wrist support, which was not
attached to the top plate, minimized a force artifact from the weight of hand and
1000 M. J. Bufton et al.
Dow
nloa
ded
by [
Ston
y B
rook
Uni
vers
ity]
at 2
2:57
27
Oct
ober
201
4
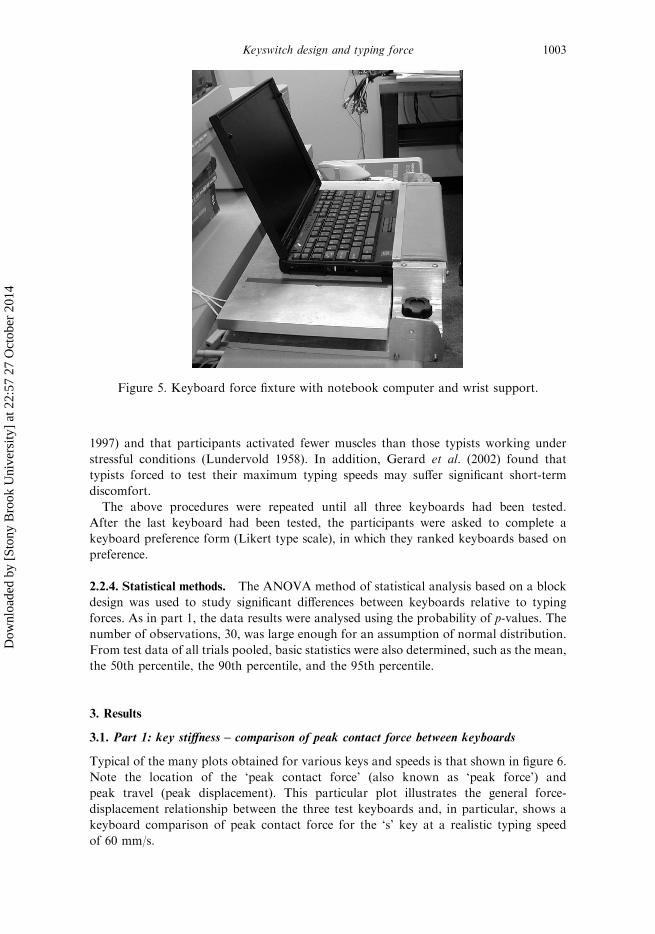
wrist bearing on the load cells. Finally, the fixture provided the flexibility to accom-
modate both desktop and notebook keyboard types, which afforded consistency in
testing. Figures 4 and 5 illustrate the fixture designs for the desktop and notebook
keyboards, respectively.
2.2.3. Procedure.
1. Measurement of anthropometric dimensions of participants.
2. Adjustment of work station according to American National Standards Institute/
Human Factors and Ergonomics Society (1988) guidelines.
3. Subject testing using all three keyboards (rubber-dome desktop, spring-column
desktop, notebook) from part 1 of this study (keyboard order determined through
Latin square designs).
4. A 3-min practice period for acclimatization.
5. A 6-min typing session for the acquisition of five data trials – each of 30 s duration –
attained in random time intervals throughout the 6-min session.
6. A 5-min rest period between keyboard testing, during which participants completed a
questionnaire rating the tactile feel of the keyboard.
Figure 2. Side, top and front views of keyboard fixture for measuring force applied to
keyboard while participants typed. For more details, see Nagurka and Marklin (2005).
Keyswitch design and typing force 1001
Dow
nloa
ded
by [
Ston
y B
rook
Uni
vers
ity]
at 2
2:57
27
Oct
ober
201
4
Participants were further instructed to type at their preferred speeds based on
previous studies that found no relationship between typing speed and fingertip peak force
when individuals typed at their preferred speeds (Sommerich et al. 1996, Feuerstein et al.
Figure 3. Photograph showing load cell arrangement of test fixture used to measure typing
force. The underside of the top plate is exposed, showing the location of the load cells.
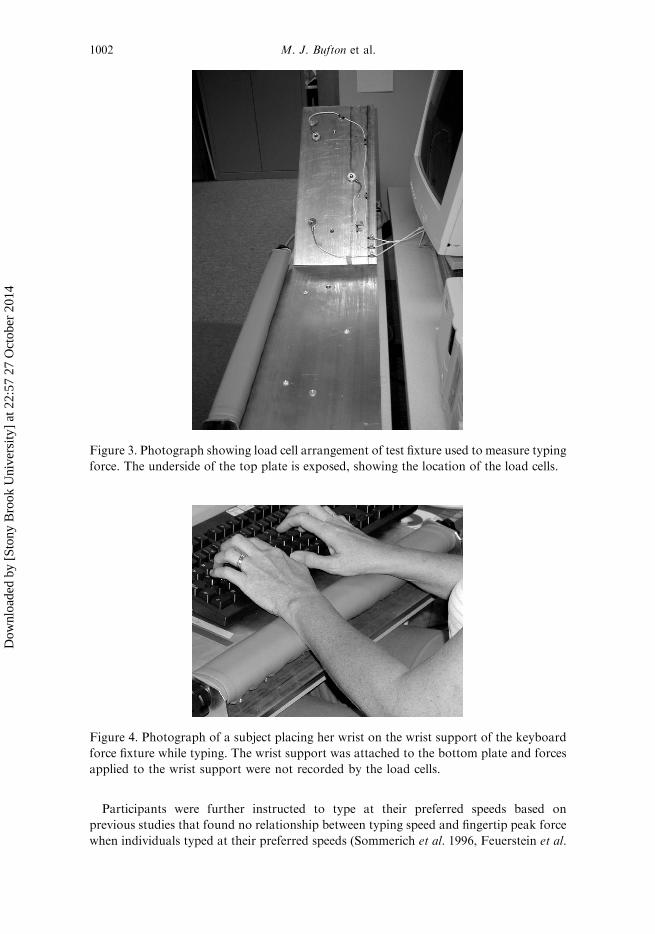
Figure 4. Photograph of a subject placing her wrist on the wrist support of the keyboard
force fixture while typing. The wrist support was attached to the bottom plate and forces
applied to the wrist support were not recorded by the load cells.
1002 M. J. Bufton et al.
Dow
nloa
ded
by [
Ston
y B
rook
Uni
vers
ity]
at 2
2:57
27
Oct
ober
201
4
1997) and that participants activated fewer muscles than those typists working under
stressful conditions (Lundervold 1958). In addition, Gerard et al. (2002) found that
typists forced to test their maximum typing speeds may suffer significant short-term
discomfort.
The above procedures were repeated until all three keyboards had been tested.
After the last keyboard had been tested, the participants were asked to complete a
keyboard preference form (Likert type scale), in which they ranked keyboards based on
preference.
2.2.4. Statistical methods. The ANOVA method of statistical analysis based on a block
design was used to study significant differences between keyboards relative to typing
forces. As in part 1, the data results were analysed using the probability of p-values. The
number of observations, 30, was large enough for an assumption of normal distribution.
From test data of all trials pooled, basic statistics were also determined, such as the mean,
the 50th percentile, the 90th percentile, and the 95th percentile.
3. Results
3.1. Part 1: key stiffness – comparison of peak contact force between keyboards
Typical of the many plots obtained for various keys and speeds is that shown in figure 6.
Note the location of the ‘peak contact force’ (also known as ‘peak force’) and
peak travel (peak displacement). This particular plot illustrates the general force-
displacement relationship between the three test keyboards and, in particular, shows a
keyboard comparison of peak contact force for the ‘s’ key at a realistic typing speed
of 60 mm/s.
Figure 5. Keyboard force fixture with notebook computer and wrist support.
Keyswitch design and typing force 1003
Dow
nloa
ded
by [
Ston
y B
rook
Uni
vers
ity]
at 2
2:57
27
Oct
ober
201
4
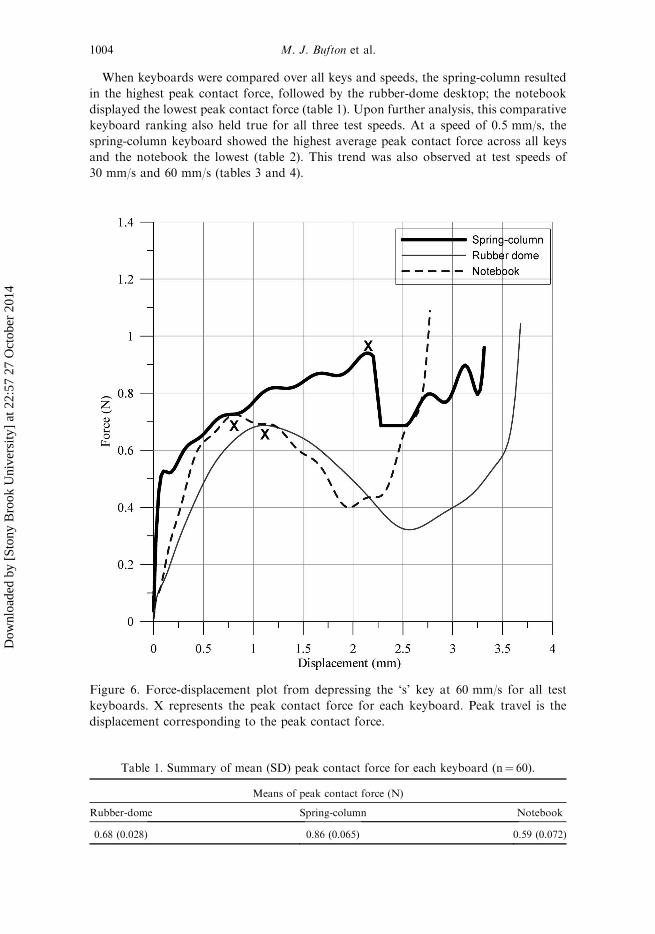
When keyboards were compared over all keys and speeds, the spring-column resulted
in the highest peak contact force, followed by the rubber-dome desktop; the notebook
displayed the lowest peak contact force (table 1). Upon further analysis, this comparative
keyboard ranking also held true for all three test speeds. At a speed of 0.5 mm/s, the
spring-column keyboard showed the highest average peak contact force across all keys
and the notebook the lowest (table 2). This trend was also observed at test speeds of
30 mm/s and 60 mm/s (tables 3 and 4).
Figure 6. Force-displacement plot from depressing the ‘s’ key at 60 mm/s for all test
keyboards. X represents the peak contact force for each keyboard. Peak travel is the
displacement corresponding to the peak contact force.
Table 1. Summary of mean (SD) peak contact force for each keyboard (n¼ 60).
Means of peak contact force (N)
Rubber-dome Spring-column Notebook
0.68 (0.028) 0.86 (0.065) 0.59 (0.072)
1004 M. J. Bufton et al.
Dow
nloa
ded
by [
Ston
y B
rook
Uni
vers
ity]
at 2
2:57
27
Oct
ober
201
4
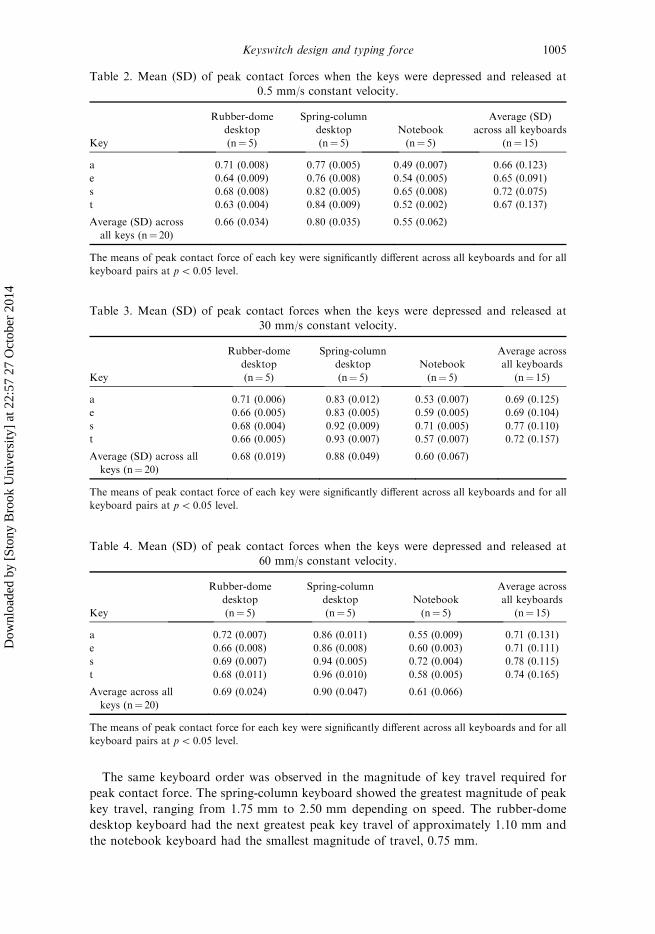
The same keyboard order was observed in the magnitude of key travel required for
peak contact force. The spring-column keyboard showed the greatest magnitude of peak
key travel, ranging from 1.75 mm to 2.50 mm depending on speed. The rubber-dome
desktop keyboard had the next greatest peak key travel of approximately 1.10 mm and
the notebook keyboard had the smallest magnitude of travel, 0.75 mm.
Table 3. Mean (SD) of peak contact forces when the keys were depressed and released at30 mm/s constant velocity.
Key
Rubber-dome
desktop
(n¼ 5)
Spring-column
desktop
(n¼ 5)
Notebook
(n¼ 5)
Average across
all keyboards
(n¼ 15)
a 0.71 (0.006) 0.83 (0.012) 0.53 (0.007) 0.69 (0.125)
e 0.66 (0.005) 0.83 (0.005) 0.59 (0.005) 0.69 (0.104)
s 0.68 (0.004) 0.92 (0.009) 0.71 (0.005) 0.77 (0.110)
t 0.66 (0.005) 0.93 (0.007) 0.57 (0.007) 0.72 (0.157)
Average (SD) across all
keys (n¼ 20)
0.68 (0.019) 0.88 (0.049) 0.60 (0.067)
The means of peak contact force of each key were significantly different across all keyboards and for all
keyboard pairs at p5 0.05 level.
Table 4. Mean (SD) of peak contact forces when the keys were depressed and released at60 mm/s constant velocity.
Key
Rubber-dome
desktop
(n¼ 5)
Spring-column
desktop
(n¼ 5)
Notebook
(n¼ 5)
Average across
all keyboards
(n¼ 15)
a 0.72 (0.007) 0.86 (0.011) 0.55 (0.009) 0.71 (0.131)
e 0.66 (0.008) 0.86 (0.008) 0.60 (0.003) 0.71 (0.111)
s 0.69 (0.007) 0.94 (0.005) 0.72 (0.004) 0.78 (0.115)
t 0.68 (0.011) 0.96 (0.010) 0.58 (0.005) 0.74 (0.165)
Average across all
keys (n¼ 20)
0.69 (0.024) 0.90 (0.047) 0.61 (0.066)
The means of peak contact force for each key were significantly different across all keyboards and for all
keyboard pairs at p5 0.05 level.
Table 2. Mean (SD) of peak contact forces when the keys were depressed and released at0.5 mm/s constant velocity.
Key
Rubber-dome
desktop
(n¼ 5)
Spring-column
desktop
(n¼ 5)
Notebook
(n¼ 5)
Average (SD)
across all keyboards
(n¼ 15)
a 0.71 (0.008) 0.77 (0.005) 0.49 (0.007) 0.66 (0.123)
e 0.64 (0.009) 0.76 (0.008) 0.54 (0.005) 0.65 (0.091)
s 0.68 (0.008) 0.82 (0.005) 0.65 (0.008) 0.72 (0.075)
t 0.63 (0.004) 0.84 (0.009) 0.52 (0.002) 0.67 (0.137)
Average (SD) across
all keys (n¼ 20)
0.66 (0.034) 0.80 (0.035) 0.55 (0.062)
The means of peak contact force of each key were significantly different across all keyboards and for all
keyboard pairs at p5 0.05 level.
Keyswitch design and typing force 1005
Dow
nloa
ded
by [
Ston
y B
rook
Uni
vers
ity]
at 2
2:57
27
Oct
ober
201
4
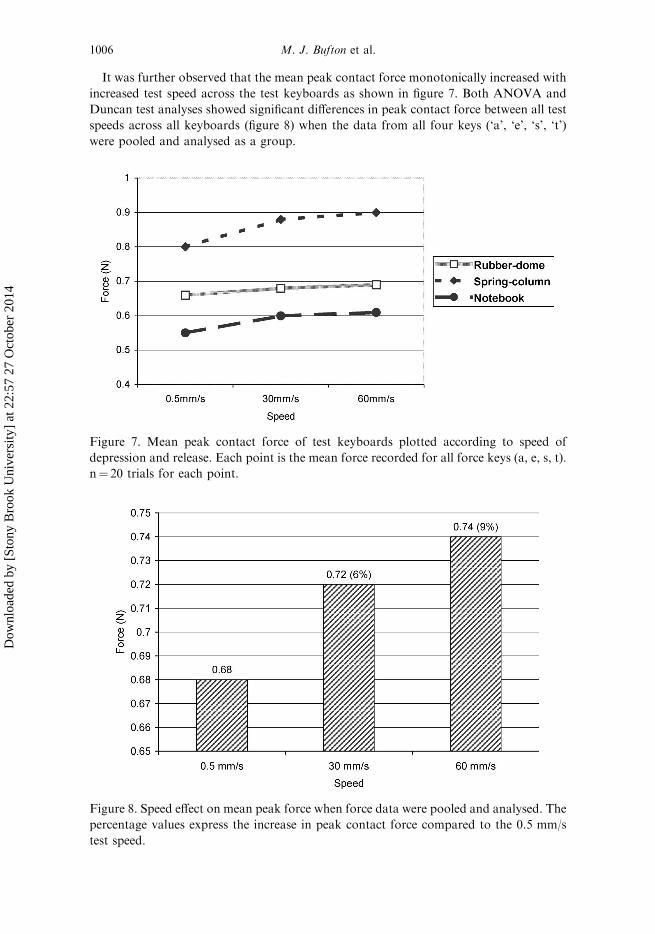
It was further observed that the mean peak contact force monotonically increased with
increased test speed across the test keyboards as shown in figure 7. Both ANOVA and
Duncan test analyses showed significant differences in peak contact force between all test
speeds across all keyboards (figure 8) when the data from all four keys (‘a’, ‘e’, ‘s’, ‘t’)
were pooled and analysed as a group.
Figure 7. Mean peak contact force of test keyboards plotted according to speed of
depression and release. Each point is the mean force recorded for all force keys (a, e, s, t).
n¼ 20 trials for each point.
Figure 8. Speed effect on mean peak force when force data were pooled and analysed. The
percentage values express the increase in peak contact force compared to the 0.5 mm/s
test speed.
1006 M. J. Bufton et al.
Dow
nloa
ded
by [
Ston
y B
rook
Uni
vers
ity]
at 2
2:57
27
Oct
ober
201
4
3.2. Comparison of peak contact force between keys within keyboards
at various test speeds
To provide a comparative study of keys within an individual keyboard, a one-way
ANOVA analysis was run for all test speeds and all four keys for each keyboard. In
general, all ANOVA tests showed significant differences between the four test keys for
each keyboard at each speed. Key forces over all three test speeds ranged from 0.63N to
0.72N for the rubber-dome desktop keyboard and 0.76N to 0.96N for the spring-column
keyboard. The notebook keyboard showed the widest range of key force, 0.49N to 0.72N.
Specifically, post hoc tests of the desktop rubber dome and spring-column keyboards
found some key pairs with no significant differences at certain test speeds. However, all
key pairs within the notebook keyboard were found to be significantly different regardless
of speed.
There was no consistent pattern for keys across keyboards relative to peak contact force.
For each test speed, key ‘a’ generated the greatest peak contact force for the rubber-dome
keyboard (0.71 to 0.72N), key ‘t’ for the spring-column keyboard (0.84 to 0.96N), and key ‘s’
for the notebook keyboard (0.65 to 0.72N). However, the remaining keys of the desktop
keyboards showed no consistent order of peak force for varying test speeds. Alternatively,
the notebook keys were consistent in order of peak force and followed a set trend of ‘s’, ‘e’,
‘t’ and ‘a’ (with ‘s’ exhibiting the greatest force and ‘a’ the least) for each test speed.
3.3. Part 2: fingertip typing force
The summary statistics of typing force applied by participants to keyboards consisted of
four areas of interest: mean fingertip typing force, and 50th, 90th and 95th percentiles.
Table 5 provides a statistical comparison that suggests similarities in means between the
rubber-dome and spring-column desktop keyboards, but not between the desktop and
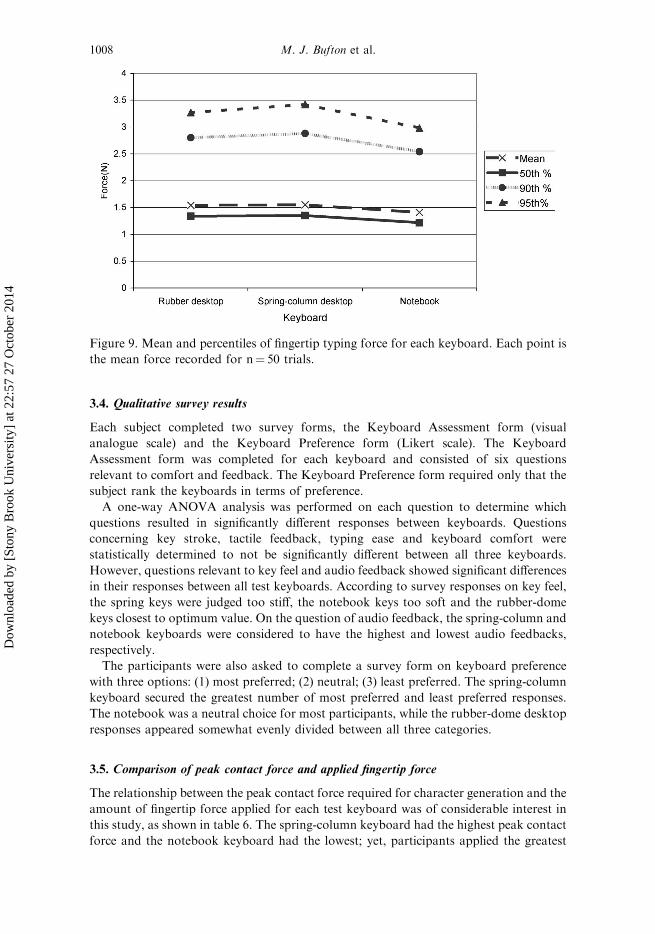
notebook keyboards. These similarities and differences are depicted in figure 9, which
shows the comparatively similar and higher typing forces of the desktop keyboards
(rubber-dome and spring-column) as opposed to those of the notebook keyboard.
An ANOVA analysis of the force percentiles statistically determined that all three
keyboards were significantly different. However, post hoc testing of keyboard pairs at each
percentile discerned no significant difference between the spring and rubber-dome desktop
keyboards, but a significant difference when each was paired with the notebook keyboard.
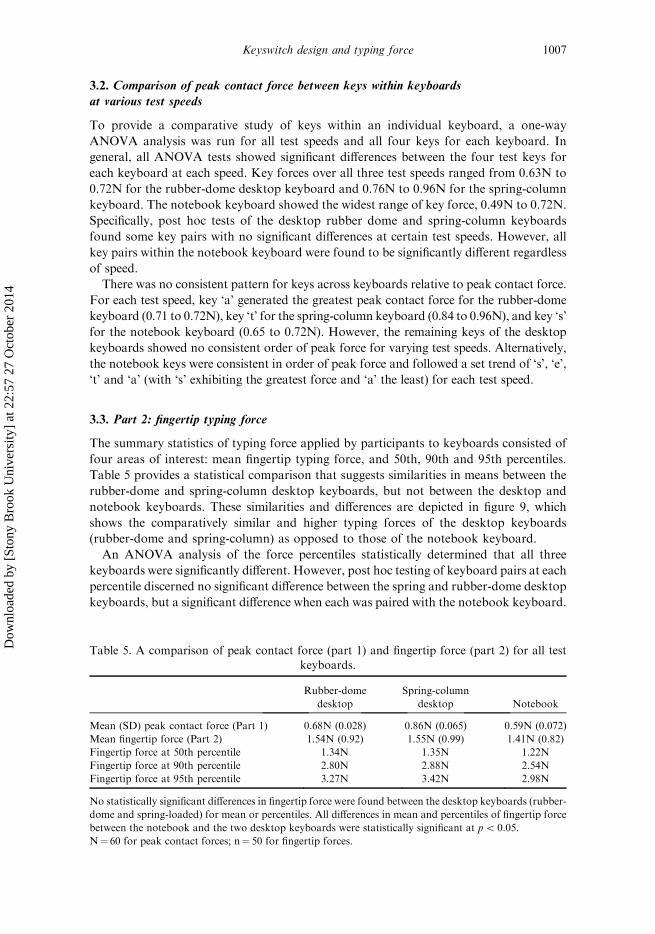
Table 5. A comparison of peak contact force (part 1) and fingertip force (part 2) for all testkeyboards.
Rubber-dome
desktop
Spring-column
desktop Notebook
Mean (SD) peak contact force (Part 1) 0.68N (0.028) 0.86N (0.065) 0.59N (0.072)
Mean fingertip force (Part 2) 1.54N (0.92) 1.55N (0.99) 1.41N (0.82)
Fingertip force at 50th percentile 1.34N 1.35N 1.22N
Fingertip force at 90th percentile 2.80N 2.88N 2.54N
Fingertip force at 95th percentile 3.27N 3.42N 2.98N
No statistically significant differences in fingertip force were found between the desktop keyboards (rubber-
dome and spring-loaded) for mean or percentiles. All differences in mean and percentiles of fingertip force
between the notebook and the two desktop keyboards were statistically significant at p5 0.05.
N¼ 60 for peak contact forces; n¼ 50 for fingertip forces.
Keyswitch design and typing force 1007
Dow
nloa
ded
by [
Ston
y B
rook
Uni
vers
ity]
at 2
2:57
27
Oct
ober
201
4
3.4. Qualitative survey results
Each subject completed two survey forms, the Keyboard Assessment form (visual
analogue scale) and the Keyboard Preference form (Likert scale). The Keyboard
Assessment form was completed for each keyboard and consisted of six questions
relevant to comfort and feedback. The Keyboard Preference form required only that the
subject rank the keyboards in terms of preference.
A one-way ANOVA analysis was performed on each question to determine which
questions resulted in significantly different responses between keyboards. Questions
concerning key stroke, tactile feedback, typing ease and keyboard comfort were
statistically determined to not be significantly different between all three keyboards.
However, questions relevant to key feel and audio feedback showed significant differences
in their responses between all test keyboards. According to survey responses on key feel,
the spring keys were judged too stiff, the notebook keys too soft and the rubber-dome
keys closest to optimum value. On the question of audio feedback, the spring-column and
notebook keyboards were considered to have the highest and lowest audio feedbacks,
respectively.
The participants were also asked to complete a survey form on keyboard preference
with three options: (1) most preferred; (2) neutral; (3) least preferred. The spring-column
keyboard secured the greatest number of most preferred and least preferred responses.
The notebook was a neutral choice for most participants, while the rubber-dome desktop
responses appeared somewhat evenly divided between all three categories.
3.5. Comparison of peak contact force and applied fingertip force
The relationship between the peak contact force required for character generation and the
amount of fingertip force applied for each test keyboard was of considerable interest in
this study, as shown in table 6. The spring-column keyboard had the highest peak contact
force and the notebook keyboard had the lowest; yet, participants applied the greatest
Figure 9. Mean and percentiles of fingertip typing force for each keyboard. Each point is
the mean force recorded for n¼ 50 trials.
1008 M. J. Bufton et al.
Dow
nloa
ded
by [
Ston
y B
rook
Uni
vers
ity]
at 2
2:57
27
Oct
ober
201
4
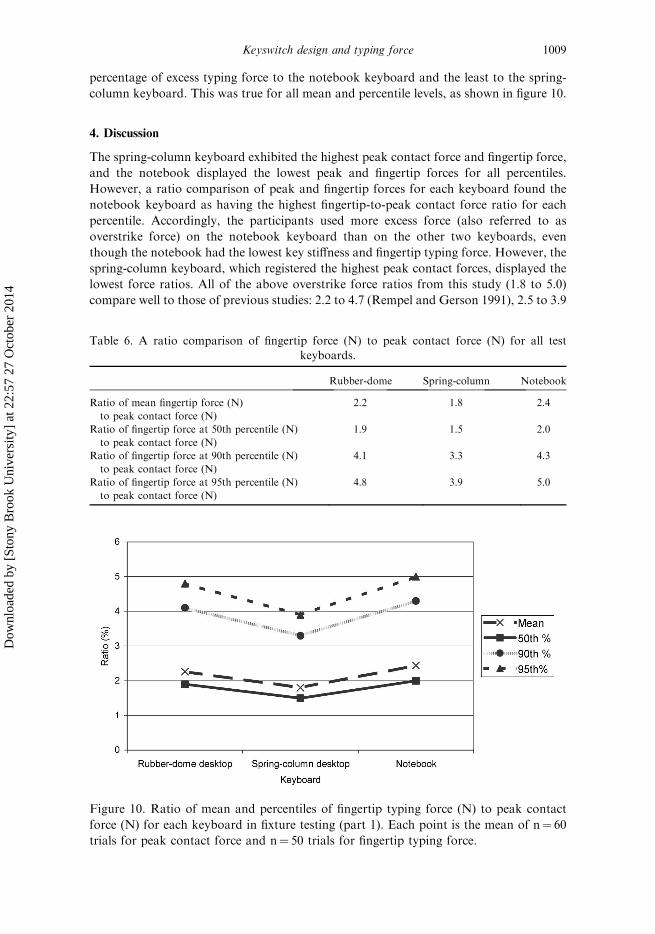
percentage of excess typing force to the notebook keyboard and the least to the spring-
column keyboard. This was true for all mean and percentile levels, as shown in figure 10.
4. Discussion
The spring-column keyboard exhibited the highest peak contact force and fingertip force,
and the notebook displayed the lowest peak and fingertip forces for all percentiles.
However, a ratio comparison of peak and fingertip forces for each keyboard found the
notebook keyboard as having the highest fingertip-to-peak contact force ratio for each
percentile. Accordingly, the participants used more excess force (also referred to as
overstrike force) on the notebook keyboard than on the other two keyboards, even
though the notebook had the lowest key stiffness and fingertip typing force. However, the
spring-column keyboard, which registered the highest peak contact forces, displayed the
lowest force ratios. All of the above overstrike force ratios from this study (1.8 to 5.0)
compare well to those of previous studies: 2.2 to 4.7 (Rempel and Gerson 1991), 2.5 to 3.9
Table 6. A ratio comparison of fingertip force (N) to peak contact force (N) for all test
keyboards.
Rubber-dome Spring-column Notebook
Ratio of mean fingertip force (N)
to peak contact force (N)
2.2 1.8 2.4
Ratio of fingertip force at 50th percentile (N)
to peak contact force (N)
1.9 1.5 2.0
Ratio of fingertip force at 90th percentile (N)
to peak contact force (N)
4.1 3.3 4.3
Ratio of fingertip force at 95th percentile (N)
to peak contact force (N)
4.8 3.9 5.0
Figure 10. Ratio of mean and percentiles of fingertip typing force (N) to peak contact
force (N) for each keyboard in fixture testing (part 1). Each point is the mean of n¼ 60
trials for peak contact force and n¼ 50 trials for fingertip typing force.
Keyswitch design and typing force 1009
Dow
nloa
ded
by [
Ston
y B
rook
Uni
vers
ity]
at 2
2:57
27
Oct
ober
201
4
(Armstrong et al. 1994), 3 to 5 (Martin et al. 1994), 4 to 5 (Martin et al. 1996) and 4 to 7
(Gerard et al. 1996).
The Gerard et al. (1999) study looked at both rubber-dome and spring desktop
keyboards. They found that participants used less overstrike force on spring-column
keyboards than on rubber-dome keyboards of less peak contact force, which is consistent
with findings from this study. The authors surmised that the auditory feedback supplied
by the click of the spring keys and/or the abrupt force change after reaching peak travel
may have reduced the overstrike force. This appears to be a reasonable hypothesis,
particularly when considering that participants assessed the spring-column keyboard
highest in auditory feedback. Possible factors causing excessive overstrike force for the
notebook keyboards may be that the notebook keys exhibited the shortest peak travel
and overall travel distance (see figure 6) and lowest key stiffness of the test keyboards
(0.59N). Participants assessed the notebook key stiffness on the ‘too soft’ end of the
subjective scale. The soft key feel may hinder tactile feedback that signals when the peak
contact force has been reached, resulting in excess typing force.
Another trend observed among all three keyboards was that peak contact force
increased with increasing test speed. This increase was as high as 9% for 60 mm/s
compared to 0.5 mm/s (see figure 8). This relationship between contact force and
displacement rate is indicative of damping (viscous-type) and was discussed by Nagurka
and Marklin (2005). They observed that if the key mechanism follows a viscous damping
model, then force will increase with increasing depression speed since damping dissipates
the energy imparted to the key from the fingertip. Therefore, at speeds greater than
measured in this study (60 mm/s), damping may play a more dominant role in total
contact force. Under conditions of viscous damping, Nagurka and Marklin suggest that
there may be a range of damping that minimizes contact force yet optimizes tactile
feedback.
The peak contact force generated by the four test keys on an individual keyboard were
significantly different from each other, notwithstanding the fact that all four test keys
used the same keycap size and key mechanism within each keyboard. This observation
was valid for all three keyboards and indicates variance in the manufacturing processes.
Although the differences among keys was statistically significant in this study, these
differences may not be noticeable to the user according to the Just Noticeable Difference
(JND) theory (Ikei et al. 1997). In this research study, the rubber-dome desktop keyboard
showed the lowest percentage of difference between keys with an average value of 8.2%
while the notebook displayed the highest difference – a 32% difference between keys. A
user would perhaps be more inclined to notice a difference in peak contact force between
keys of a notebook keyboard than with a rubber-dome desktop keyboard, if such
differences achieved a JND level.
In terms of keyboard preference, participants either emphatically liked or disliked the
spring-column keyboard, while they were more neutral about the notebook and rubber-
dome desktop keyboards. This finding may be due to the fact that spring-column
keyboards are rarely used in office settings now and, to the authors’ knowledge, are not
shipped with most new PCs to customers. Thus, participants in this study may not have
liked spring-column keyboards because of their unfamiliarity with them.
Both keyboard and fingertip testing were performed using testing fixtures with distinct
advantages. The keyboard test rig (figure 1) can quantify force-displacement (under
constant velocity) at both pseudo-static and typical typing speeds to obtain damping. The
fingertip test fixture (figure 4) accommodates keyboards without any external modifi-
cation and also provides a wrist support to minimize a force artefact from hand, wrist or
1010 M. J. Bufton et al.
Dow
nloa
ded
by [
Ston
y B
rook
Uni
vers
ity]
at 2
2:57
27
Oct
ober
201
4
forearm weight. Both testing fixtures provide easy keyboard set-up and the flexibility to
accommodate both desktop and notebook keyboard types.
5. Conclusions
. Over all test keys and speeds, the spring-column keyboard recorded the highest mean
peak contact force, 0.86 N, followed by the rubber-dome keyboard with 0.68 N and
the notebook keyboard with 0.59 N.
. Across all three keyboards, the mean peak contact force increased monotonically as
depression speed increased.
. During typing sessions, participants applied the least fingertip force to the notebook
keyboard keys, but also applied the most excess force to notebook keys; by contrast,
participants applied the least overstrike force to the spring-column keys.
. There were significant differences in peak contact force between test keys of the same
key design and mechanism within each keyboard, regardless of depression speed.
. The spring-column keyboard was either liked or disliked while the rubber-dome
desktop and notebook received more moderate ratings.
. The force overstrike observed in the notebook fingertip-force tests might be reduced
by increased tactile feedback and travel distance in key design.
Acknowledgement
The authors express their gratitude to the Office Ergonomics Research Committee
(OERD) for providing the funds to build the test rig that measured peak contact
forces.
References
AMERICAN NATIONAL STANDARDS INSTITUTE/HUMAN FACTORS AND ERGONOMICS SOCIETY, 1988, American national
standard for human factors engineering of visual display terminal workstation, 100–1988. Available online at:
http://www.hfes.org/Publications/ANSI-HFS-100.html
ARMSTRONG, T., FOULKE, J., MARTIN, B., GERSON, J. and REMPEL, D., 1994, Investigation of applied force in
alphanumeric keyboard work. Journal of the American Industrial Hygiene Association, 55, 30–35.
FEUERSTEIN, M., ARMSTRONG, T., HICKEY, P. and LINCOLN, A., 1997, Computer keyboard force and upper
extremity symptoms. Journal of Occupational and Environmental Medicine, 39, 1144–1153.
GERARD, M., ARMSTRONG, T., FOULKE, J. and MARTIN, B., 1996, Effects of key stiffness on force and development
of fatigue while typing. American Industrial Hygiene Association Journal, 57, 849–854.
GERARD, M., ARMSTRONG, T., FRANZBLAU, A., MARTIN, B. and REMPEL, D., 1999, The effects of keyswitch
stiffness on typing force, finger electromyography, and subjective discomfort. American Industrial Hygiene
Association Journal, 60, 762–769.
GERARD, M., ARMSTRONG, T. and MARTIN, B., 2002, Short and long term effects of auditory feedback on typing
force, EMG and comfort while typing. Applied Ergonomics, 33, 129–138.
IKEI, Y., WAKAMATSU, K. and FUKUDA, S., 1997, Vibratory tactile display of image-based texture. IEEE Computer
Graphics and Applications, 17, 53–61.
LIU, K., 1999, Design of a test rig for measurement of stiffness and damping characteristics of computer
keyboard keys. Master’s thesis, Marquette Univerisity, Milwaukee, WI.
LUNDERVOLD, A., 1958, Electromyographic investigations during typing. Ergonomics, 1, 226–233.
MARTIN, B., ARMSTRONG, T., FOULKE, J., NATARAJAN, S., KLINENBERG, E., SERINA, E. and REMPEL, D., 1994,
Finger forces during computer keyboard work part I: relation of keyboard reaction force to finger flexor
muscles surface EMG. Occupational Health and Safety, 2, 198–200.
MARTIN, B., ARMSTRONG, T., FOUKE, J., NATARAJAN, S., KLINENBERG, E., SERINA, E. and REMPEL, D., 1996,
Keyboard reaction force and finger flexor electromyograms during computer keyboard work. Human Factors,
38, 654–664.
Keyswitch design and typing force 1011
Dow
nloa
ded
by [
Ston
y B
rook
Uni
vers
ity]
at 2
2:57
27
Oct
ober
201
4
MAYZNER, M.S. and TRESSELT, M.E., 1965, Tables of single-letter and diagram frequency counts for various
word-length and letter-position combinations. Psychonomic Monograph Supplements, 1, 13–33.
NAGURKA, M. and MARKLIN, R., 2005, Measurement of stiffness and damping characteristics of computer
keyboard keys. Journal of Dynamic Systems, Measurement, and Control, 127, 283–288.
NAGURKA, M., MARKLIN, R. and LIU, K., 1999, Design of a test rig for measurement of stiffness and damping
characteristics of computer keyboard keys. Proceedings of the 1999 American Control Conference, 2–4 June
1999, San Diego, CA, pp. 1749–1753.
REMPEL, D. and GERSON, J., 1991, Fingertip forces while using three different keyboards. Proceedings of the
Human Factors Society 35th Annual Meeting, 2–6 September 1991, San Francisco, CA, pp. 253–255.
SOMMERICH C., MARRAS W. and PARNIANPOUR M., 1996, A quantitative description of typing biomechanics.
Journal of Occupational Rehabilitation, 6, 33–55.
1012 M. J. Bufton et al.
Dow
nloa
ded
by [
Ston
y B
rook
Uni
vers
ity]
at 2
2:57
27
Oct
ober
201
4