Embed Size (px)
Citation preview
EFFECT OF HIGH PEROXIDE VALUE FATS ON PERFORMANCE OF BROILERS IN NORMAL AND IMMUNE CHALLENGED STATES
A Thesis Presented to
The Faculty of the Graduate School University of Missouri – Columbia
In Partial Fulfillment of the Requirements for the Degree
Master of Science
by Jeremy Parker McGill
Dr. Jeffre D. Firman, Thesis Supervisor JULY 2009
The undersigned, appointed by the Dean of the Graduate School, have examined the thesis entitled EFFECT OF HIGH PEROXIDE VALUE FATS ON PERFORMANCE OF BROILERS IN NORMAL AND IMMUNE CHALLENGED STATES Presented by Jeremy P. McGill A candidate for the degree MASTER OF SCIENCE, And hereby certify that in our opinion it is worthy of acceptance Dr. Jeffre Firman – Thesis Advisor Dr. David Ledoux Dr. Daniel Shaw
ii
ACKNOWLEDGMENTS
First and foremost, I would like to thank Dr. Firman for allowing me
the opportunity to complete a graduate degree in his program. His
knowledge and support have been invaluable throughout this experience.
The practical skills that I have learned from him will always be within arm’s
reach throughout my career. I would also like to thank the other members of
my graduate committee, Dr. Ledoux and Dr. Shaw, for their guidance and
time. Additionally, I would like to thank Dr. Fritsche for his help in getting
the development of the fat up and running and Dr. Reza Kamyab for his
help, time, and advice throughout the years.
I could not continue on if I didn’t thank my lovely wife Liz. Your
patience is remarkable, and I cannot begin to express how much I appreciate
all of your help. Your love and support made this all possible. Thank you
for always believing in me. I would also like to thank my daughter Evelyn.
It will be some time before you can read this, and even longer before you
will want to read this. No matter how stressed or aggravated I may have
been, you always helped me relax and put things into perspective. I will

iii
never forget your infinite two-year-old wisdom, and I quote, “Sometimes
birds eat energy and sometimes they don’t.”
I want to extend a big thanks to all of the graduate students,
undergraduate students, and farm employees who helped me with my trials.
Angela, thank you for all of your help and insight that only a professional
graduate student could possess. You remain my favorite Brazilian. Alex,
with your will of a spider monkey, and Matt, with your school girl
innocence, the days at the farm just wouldn’t have been as fulfilling without
you. To Dr. Ledoux’s lab, thank you. Thank you to Mary Smith, Kathy
Craighead, Cindy Glascock, Jesse Lyons, and Doris Lyons. Your help has
been invaluable.
Lastly I would like to thank my family. My mother and father have
always pushed me to never give up, strive for better, give all you can, and
ask for nothing in return. They have unfailingly led by example. Without
their love and support, I would not be who or where I am today. I would
like to thank my siblings Alex, Dallas, and Connor. We have always found
a reason to laugh and they have been and always will be there when I need
them. Thank you to my other set of parents, Doug and Jenny. Your love
and support have always been unconditional. I love you all.
iv
LIST OF TABLES
Table Page 1. Composition of experimental basal diets for fat rancidity trial; Experiment 1……………………………………………………….….40 2. Effects of fat rancidity level when an antioxidant was added or excluded on body weight gain on day 21, 35, 49, and 0-49; Experiment 1…………………………………………………………..41 3. Effects of fat rancidity level when an antioxidant was added
or excluded on feed intake on day 21, 35, 49, and 0-49; Experiment 1………………………………………………………….42
4. Effects of fat rancidity level when an antioxidant was added
or excluded on feed conversion on days 21, 35, 49, and 0-49; Experiment 1………………………………………………………….43
5. Effects of fat rancidity level when an antioxidant was added
or excluded on 0 – 49 day broiler carcass traits based on the percentage of chilled carcass weight; Experiment 1………………….44
6. Composition of experimental basal diets for fat rancidity trial with the addition of an immune challenge; Experiment 2…………….59 7. Effects of fat rancidity level when an antioxidant was
added or excluded on body weight gain on days 21, 35, 49, and 0 – 49 in the presence of an immune challenge; Experiment 2……………………………………………………….…60
8. Effects of fat rancidity level when an antioxidant was
added or excluded on feed intake on days 21, 35, 49, and 0 – 49 in the presence of an immune challenge;
v
Experiment 2………………………………………………………….61
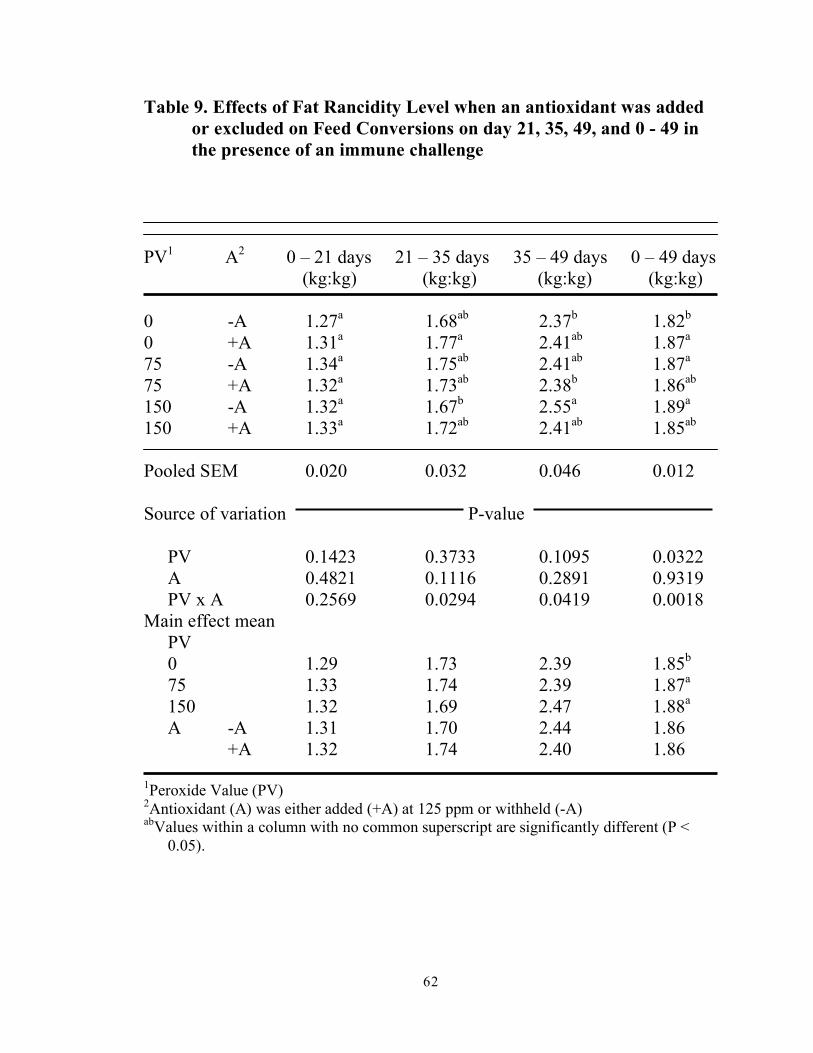
9. Effects of fat rancidity level when an antioxidant was added or excluded on feed conversion on days 21, 35, 49, and 0 – 49 in the presence of an immune challenge; Experiment 2………………………………………………………….62
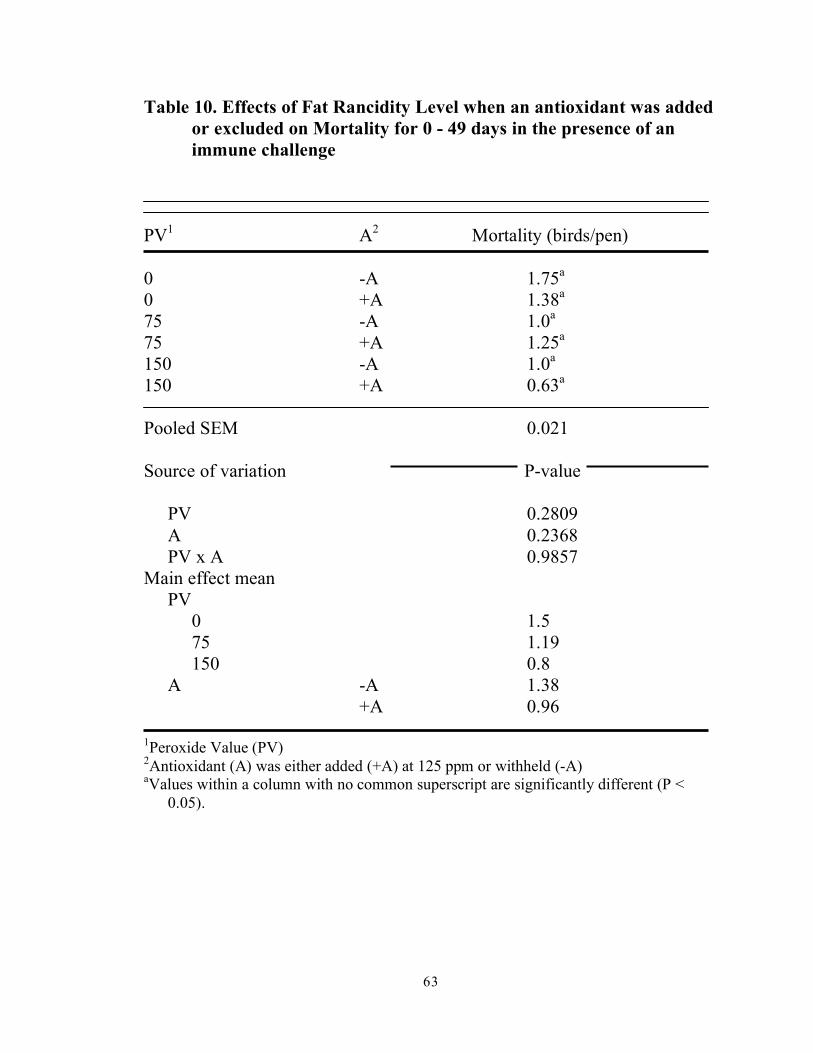
10. Effects of fat rancidity level when an antioxidant was was added of excluded on mortality for 0 – 49 days in the presence of an immune challenge; Experiment 2………..………63 11. Effects of fat rancidity level when an antioxidant was
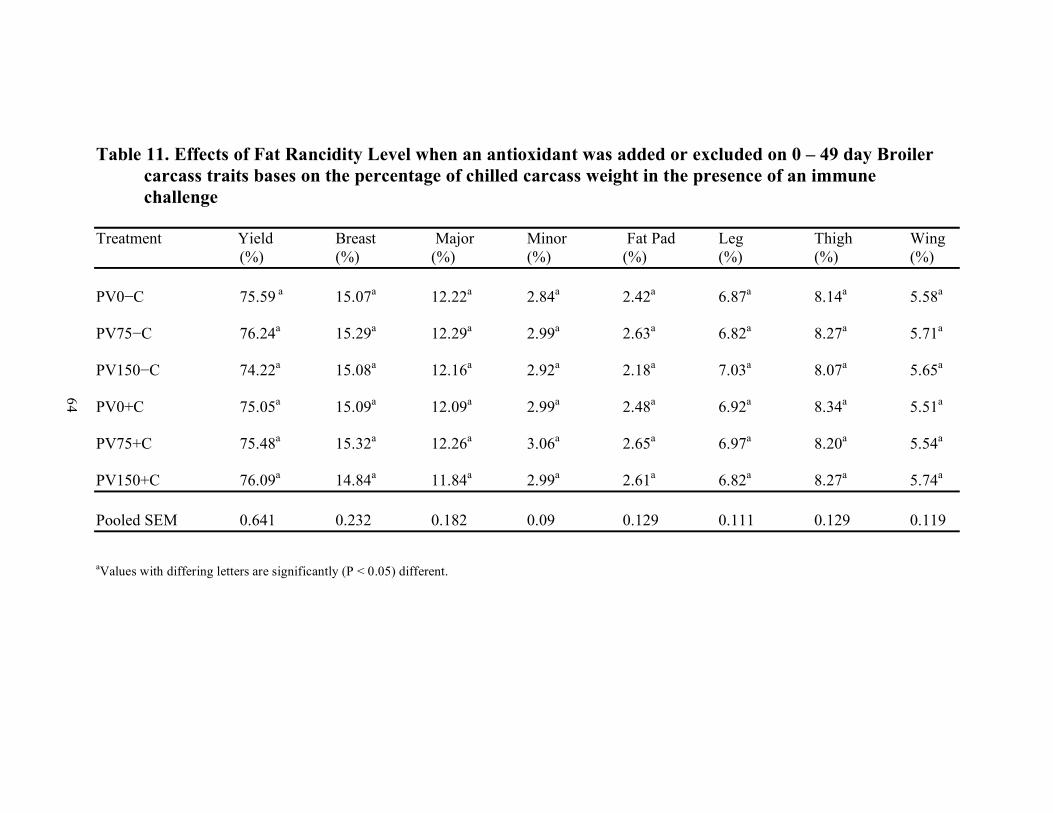
added or excluded on 0 – 49 day broiler carcass traits based on the percentage of chilled carcass weight in the presence of an immune challenge; Experiment 2……………………………..…..64
vi
LIST OF FIGURES Figure Page 1. Initiation and propagation reactions of autoxidation…………..……….22 2. Oxidation over time as measured by peroxide value……………..….....23 3. Oxidation over time as measured by peroxide value, with and without
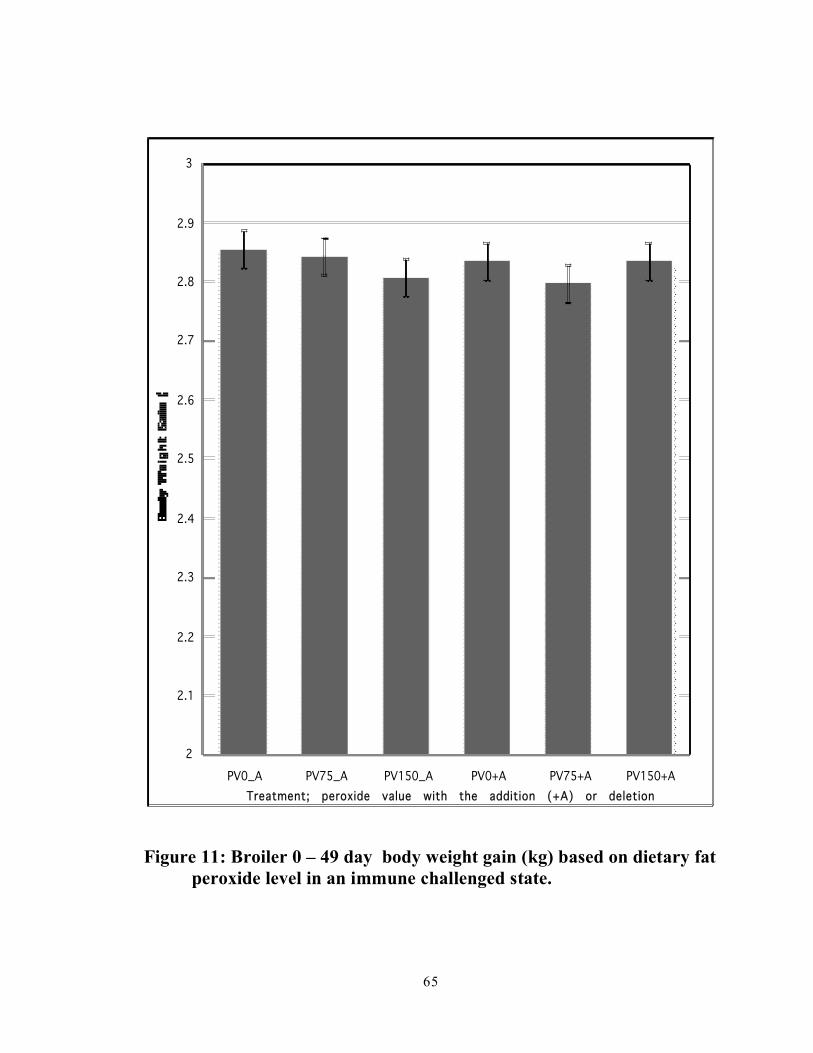
the addition of an antioxidant…………..………..….…………………..24 4. Structure of Vitamin E…………….…………………………….……...25 5. Structure of Ethoxyquin………………………….……………….….…26 6. Structure of BHA………………………………………….…….….…..27 7. Structure of BHT………………………………………….…………....28 8. Broiler 0 – 49 day body weight gain (kg) based on dietary fat peroxide levels, with and without the addition of an antioxidant; Experiment 1…………………………………………………………....45 9. Broiler 0 – 49 day feed intake (kg) based on dietary fat peroxide levels, with and without the addition of an antioxidant; Experiment 1…………………………………………………………...46 10. Broiler 0 – 49 day feed:gain (kg:kg) based on dietary fat peroxide levels, with and without the addition of an antioxidant; Experiment 1………………………………………………………..…47 11. Broiler 0 – 49 day body weight gain (kg) based on dietary fat peroxide level in an immune challenged state; Experiment 2………...65 12. Broiler 0 – 49 day feed intake (kg) based on dietary fat peroxide level in an immune challenged state; Experiment 2…………….……66 13. Broiler 0 – 49 day feed:gain (kg:kg) based on dietary fat peroxide
vii
level in an immune challenged state; Experiment 2………………….67
viii
TABLE OF CONTENTS
ACKNOWLEDGMENTS………………………..…………………………ii LIST OF TABLES…………………………………..……………………...iv LIST OF FIGURES…………………………….……………………….......vi Chapter
1. LITERATURE REVIEW…………………………………….………1 Introduction…………………………………………….……...1 Structure and Composition of Fats and Oils…………….…….3 Feed Fat Quality…………………………………….…………4 Added Fat in Poultry Rations………………………….………6 The Effect of Age on Fat Utilization……………..……...7 The Extra Caloric Value of Fat…………………..……..8 Heat Increment…………………………………..……...8 Metabolizable Energy………………………..…….……9 Rancidity of Fats……………………………………..……….11 Hydrolytic Rancidity…………………………..……….11 Oxidative Rancidity…………………………..…..........12 Antioxidants…………………………………………..………16
ix
Effects of Oxidized Fats and Antioxidants in Poultry Rations on Performance………………………………………..….......17 Effects of Oxidized Fats in Poultry Diets on Immunity…...…19 Summary…………………………………………….….……20
2. EFFECT OF HIGH PEROXIDE VALUE FATS ON
PERFORMANCE OF BROILERS IN A NORMAL IMMUNE STATE………………………………………………………………29 Abstract…………………………………….……….….……..29
Introduction………………………………….………….……30 Materials and Methods…………………………………..…...32 Results and Discussion………………………….……….…...33
3. EFFECT OF HIGH PEROXIDE VALUE FATS ON
PERFORMANCE OF BROILERS IN AN IMMUNECHALLENGED STATE…………………………………………………………..…..48 Abstract…………………………………………..…………...48
Introduction……………………………………………..……49 Materials and Methods………………………………….……51 Results and Discussion………………………………….……53
4. CONCLUSIONS……………………..…………...............................57 5. APPENDICES…...……………………………………..……………68 6. REFERENCES………………………………………..……………..73
1
CHAPTER 1
REVIEW OF LITERATURE
INTRODUCTION
The utilization of rendered fats, blended fats containing both
vegetable oils and rendered fats, and animal by-products that contain fat has
been well established in the United States for many years. The addition of
high levels of fat is not uncommon due to the advanced rendering industry
and, therefore, relatively inexpensive fat sources. In the United States, it is
estimated that use of rendered fat products may save up to $10 per ton of
feed produced (Firman, 2006). The use of these fats in poultry diets
provides many additional benefits including, but not limited to, a cost
effective concentrated energy source, a source of linoleic acid, increased
growth rates, and increased feed efficiency.
While a variety of fats and animal by-products are used regularly in
the United States, many other countries utilize primarily vegetable oils, the
2
use of which can be both sporadic and at considerably lower levels. One of
the problems associated with using rendered fats is the perception that they
might be of decreased quality due to oxidative rancidity, and so fats of
vegetable origin are used as an alternative. These fats are often more
expensive when compared to rendered products, which may contribute to the
overall lower utilization of added fat. Additionally, feed ingredients such as
corn are often less available in other countries and soybean meal is
frequently more expensive, leading to the use of lower quality and lower
energy ingredients. This, paired with the low utilization of fats, may lead to
diets that are lower in metabolizable energy (ME) than those seen in the
United States and therefore lower performance levels. However, as these
trends have occurred, worldwide poultry meat output rose from 8.9 to 70.4
million tons between 1961 and 2001 with middle-income countries making
the greatest overall increase. In terms of world chicken production alone,
middle- and low-income countries achieved the greatest increases from 1961
to 2001, rising 1,139 percent and 898 percent, respectively (Economic
Research Service, USDA website, 2003). Greater flexibility in the use of
additional sources of fat could result in considerable cost savings worldwide.
3
STRUCTURE AND COMPOSITION OF FATS AND OILS
Natural fats and oils are triglycerides, consisting of three fatty acids
linked to a glycerol molecule. The fatty acids may contain anywhere from 4
to 36 carbons, and are categorized as saturated or unsaturated. The chemical
structure of saturated fatty acids does not contain double bonds, while
unsaturated fatty acids contain at least one double bond (Nelson and Cox,
2008). Both the length of the fatty acid and the amount of double bonds
determine the melting point and stability of each individual fat (Dozier,
2003). Typically the more unsaturated a lipid is, the more likely it will be
in a liquid state at room temperature due to a lower melting point.
Therefore, most vegetable oils such as canola oil or corn oil are more
unsaturated, while animal fats such as lard or tallow tend to have a higher
degree of saturation and tend to be solid at room temperature (Cheeke,
2005). The hardness or softness of a fat can be measured by either titer or
iodine value. Titer is a measurement (in degrees) obtained by determining
the solidification point of fatty acids in fats. A fat is classified as tallow if
the titer value is equal to or greater than 40 or as grease if the value is less
than 40. Iodine value (IV) defines the amount of iodine (in grams) that is
4
absorbed by 100 grams of fat. Unsaturated fats have greater IVs than
saturated fats (Pearl, 2004; Shermer and Giesen, 1997).
FEED FAT QUALITY
Several factors can influence the quality of fat used in animal feed,
including free fatty acid levels, moisture, insolubles, and unsaponifiables
(MIU), and rancidity (Firman, 2006). Free fatty acids (FFA) are fatty acids
that are not involved in ester linkage to glycerol. FFA are produced as a
byproduct of hydrolysis in fat. It has been thought that high levels of FFA
(> 20%) usually indicated a possible issue with rancidity (Pearl, 2004;
Dozier, 2003; Zumbado, et al., 1999; Gray and Robinson, 1941; Branion et
al., 1938) and could result in poor performance. Interestingly, other studies
have shown that varying levels of FFA in poultry diets up to 50% do not
negatively affect bird performance, nutritive value, or acceptability as long
as the fats or fat blends have similar fatty acid profiles (level and
saturated:unsaturated ratio) and do not have a high level of rancidity as
indicated by peroxide value (PV) (Waldroup, et al., 1995; De Groote, et al.,
1971; Lewis and Payne, 1963; Siedler, et al., 1955, Treat, et al., 1960).
Only when accompanied by a high PV or a higher degree of saturation were
5
performance issues noted (Wiseman and Salvador, 1991). These studies
suggest that although FFA levels may indicate the potential for problems
with rancidity, the FFA themselves are not responsible for decreased
performance.
MIU are the non-fat products that can decrease the energy content of a
fat (Association of Official Analytical Chemists, 1982). Moisture is one of
these factors influencing the quality of fat. A high level of moisture is one
causative agent in hydrolytic rancidity in fat, which can decrease stability
(Rossell, 1994). Insolubles make up another factor that influences fat
quality. These may include traces of bone, hair, feathers, dirt, etc., and can
create problems with clogging components of fat handling machinery (Pearl,
2004) while contributing little nutritive value. Unsaponifiable matter
includes a variety of compounds, such as fatty alcohols, hydrocarbons,
pigments, and sterols that are not hydrolyzed by the saponification process
in which triglycerides are converted to glycerol and fatty acids (Pearl, 2004).
Considered contaminants, these compounds have a low digestible energy
content, thereby lowering metabolizable energy (Dozier, 2003), and some
contain what is known as the chick edema factor which is highly toxic,
producing edema, liver damage, kidney damage, and other performance
6
decreasing symptoms (Firestone, 1968). Acceptable levels of MIU vary
depending on the source of the quality specifications, but typically the level
of moisture is recommended to be below 1.0%, impurities less than 0.60%,
and unsaponifiables less than 1.0%.
ADDED FAT IN POULTRY RATIONS
Adding fat to livestock and poultry rations provides many benefits. It
is an excellent source of energy, providing 2.25 times the energy of starches
or sugars (Church, 1991), making it an ideal method to raise the energy
density of a diet. As a concentrated energy source it may be a more cost
efficient option than alternative energy sources. Practical benefits of adding
fat to rations include a reduction in dust and dust losses, decreased particle
separation, a source of lubrication for feed mill machinery, and an increase
in the palatability of the ration. It is a good source of linoleic acid (18:2),
which is required by poultry (National Research Council, 1994). Fat will
typically be added to most poultry rations at a minimum of 1-3%, an amount
sufficient to provide the essential fatty acids required and lend beneficial
physical improvements. Additionally, supplementing fat to poultry rations
7
can result in increased growth rates, decreased feed intake, and increased
feed efficiency (Firman, 1995; Sell et al., 1986; Pesti et al., 2002).
The Effect of Age on Fat Utilization
One important consideration when adding fat to poultry rations is the
age of the birds being fed. Carew and coworkers (1972) showed that very
young chicks (2 to 7 days of age) are not fully able to absorb fats in the diet,
but that absorptive capacity increased rapidly with age. Similar results were
found by Renner and Hill (1960), who reported that young chicks had
difficulty utilizing tallow, but that absorbability increased from 2 to 8 weeks
of age. It has also been shown that growing chicks display variability in
their ability to digest and absorb different fat sources (March and Biely,
1957), and that in chicks, absorbability might depend on the fatty acid
profile of the individual fat (Young, 1961), with saturated fatty acids being
less efficiently utilized than unsaturated fatty acids (Young, 1963).
However, Siedler and coworkers (1955) reported that chicks fed diets
supplemented with 0, 3, or 6% added animal fats of varying fatty acids
profiles utilized the fats equally well, although all were stabilized with an
antioxidant. Turkey poults are also less capable of utilizing supplemental
8
fats (Sell et al., 1986), especially those with a high proportion of saturated
fatty acids (Leeson and Atteh, 1995), than older birds.
The Extra Caloric Value of Fat
Added dietary fat exhibits what is known as an extra caloric effect, in
which experimentally obtained ME values for a feed containing added fat
exceed the expected ME value originally calculated (Jenson et al., 1970;
Horani and Sell, 1977). Fat can increase the absorption and nutrient
availability of other ingredients in the ration by increasing the intestinal
transit time, increasing the overall ME of the diet (Mateos and Sell, 1981;
Sell et al., 1983). Data supporting this theory was reported from a trial in
which the addition of fat increased digestibility of meat and bone meal
(Firman and Remus, 1994).
Heat Increment
Another benefit of supplementing fat to poultry rations is a reduction
in heat increment. This is the heat produced from the digestion of feed.
Added fat can lower the overall heat increment of a diet (Dale and Fuller,
1978; Carew and Hill, 1964), therefore increasing the energetic efficiency of
a diet (Fuller and Rendon, 1977; Fuller and Rendon, 1979). This becomes
increasingly important during periods of heat stress. Growth depression due
9
to heat stress has been alleviated in birds consuming diets higher in fat (Dale
and Fuller, 1980), and laying hens show a greater ability to overcome heat
stress when fed diets supplemented with fat (Reid and Weber, 1975).
Metabolizable Energy
It can be very difficult to assign ME values to individual fat sources.
Part of this has to do with previously discussed factors such as the extra
caloric value of fat and the heat increment. Additionally, it is possible to
obtain a variety of ME values for the same fat depending on the level fed,
the type of diet in which they are included, and whether or not they are fed
individually or with other fats (Sibbald et al., 1961). However, it has been
shown many times that, when supplied in a complete diet, different fat
sources will not result in differences in performance (Siedler et al., 1955;
Young, 1961; Pesti et al., 2002; Firman et al., 2008). Although different fat
sources may cause significant differences in ME, those differences may not
translate to significant differences in bird performance.
While the benefits of added fats are obvious, it is important to keep
several issues of possible concern in mind. Increasing levels of fat in the
diet can cause increased body fat deposition in turkeys (Salmon and O’Neil,
1971). One must also be careful when adding fat to layer rations, and major
10
discrepancies exist within the literature with regard to this topic. Isika and
coworkers (2006) reported increasing egg production and egg mass with 5%
fat addition to rations of laying hens from 8-22 weeks of age. Research
conducted by Bohnsack and others (2002) indicates no increase in egg
production but an increase in egg weight at 2 or 6% added fat over three 28-
day periods, while early research by Donaldson and Gordon (1960) reported
depressed hen-housed egg production, poorer feed conversion, increased
mortality, and no effect on egg quality when 3% fat was added to layer
rations over a 350-day period. It is evident from the variability in these
results that age plays a role in laying hen performance as it relates to fat
consumption. Fuller (1996) reports that young birds tend to deposit
increased energy in diets in improved egg production and parameters, while
older hens tend to deposit extra energy as body weight. It is critical to
control energy consumption in laying hens to prevent obesity, which can
greatly decrease performance.
A few additional concerns remain over supplementing dietary fat.
High levels of fat (greater than 10%) may compromise pellet integrity. In
hot weather, high levels of fat may result in greasy bags or equipment.
Finally, adding fat to a ration creates a greater potential for hydrolytic or
11
oxidative rancidity, which can lead to decreased quality and acceptability of
feed.
RANCIDITY OF FATS
One of the concerns with using rendered fats such as tallow, blended
fats, or other fat-containing animal by-products is that they may be of poor
quality due to oxidative rancidity and consequently pose a threat to the
performance or health of the birds. While information on rancidity of fats
has been available for over 60 years (Gray and Robinson, 1941), relatively
little work has been done on the oxidative rancidity of fats and the effects on
performance or immune function in poultry.
Hydrolytic Rancidity
Two major forms of rancidity exist, namely hydrolytic and oxidative,
both of which cause unpleasant flavors and odors in fats and feeds that
contain added fat. Hydrolytic rancidity occurs when triglycerides are
hydrolyzed into fatty acids and glycerol. More specifically, this type of
rancidity occurs in the presence of moisture and an enzymatic catalyst and
results in the liberation of free fatty acids, which have a lower flavor
threshold than the parent triglycerides (Rossell, 1994). This is why
hydrolytic rancidity causes a distinct rancid flavor, which is a contributing
12
factor to the decreased quality and acceptability of the fat (Galliard, 1994).
The most effective methods to reduce the occurrence of hydrolytic rancidity
would be to reduce the amount of moisture in the fat source or store the fat
or feed at cold temperatures. Other than the formation of off-flavors and
odors, another reason to avoid hydrolytic rancidity is that the reactions of
hydrolysis supply free oleic, linoleic, and linolenic acids that could then
undergo further oxidative rancidity (Hamilton, 1994).
Oxidative Rancidity
Oxidative rancidity, also termed autoxidation, is certainly the most
complex type of rancidity and causes the greatest level of concern among
producers. Although all fats are made up of a variety of fatty acids, fats that
contain a high level of unsaturated fatty acids tend to be more susceptible to
autoxidation, as rancidity typically takes place at a double bond (Hamilton,
1994; Dozier, 2003). Oxidation proceeds at different rates for each of the
abundantly occurring unsaturated fatty acids, with the order of reactivity
being linolenic > linoleic > oleic (Berger, 1994; Hamilton, 1994). The
process of autoxidation consists of three main phases: initiation,
propagation, and termination.
13
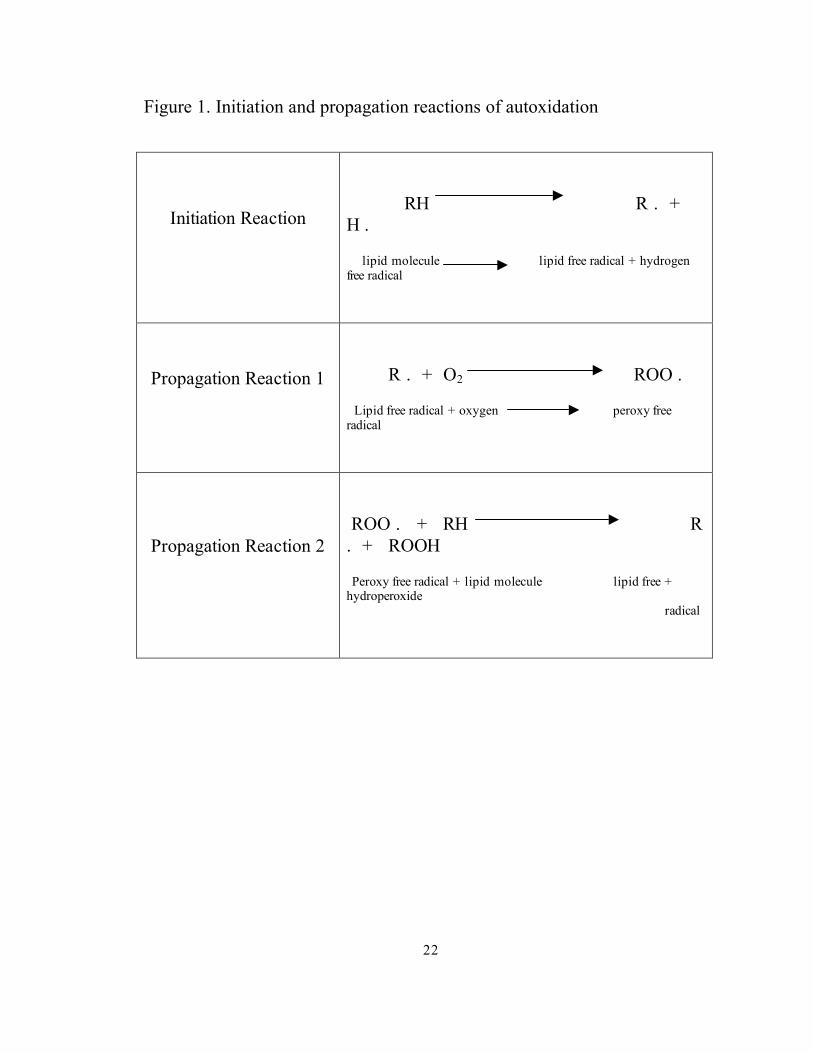
Three reactions take place during initiation and propagation, which
are shown in Figure 1 (adapted from Talbot, 2004). Initiation takes place
when two free radicals are formed through the cleavage of a hydrogen atom
from a triglyceride, a reaction that usually requires a heavy metal catalyst
such as copper, or energy from heat or light (Talbot, 2004). At this point,
oxidation occurs at a relatively slow, uniform rate of speed during what is
known as the induction period. Next, in the first of two propagation
reactions, a peroxy radical is formed when the triglyceride free radical reacts
with an oxygen molecule. In the second propagation reaction, the peroxy
radical reacts with another triglyceride, forming a hydroperoxide and
regenerating a new free radical that is then available to react with another
oxygen molecule, causing an accelerated chain-reaction to occur (Hamilton,
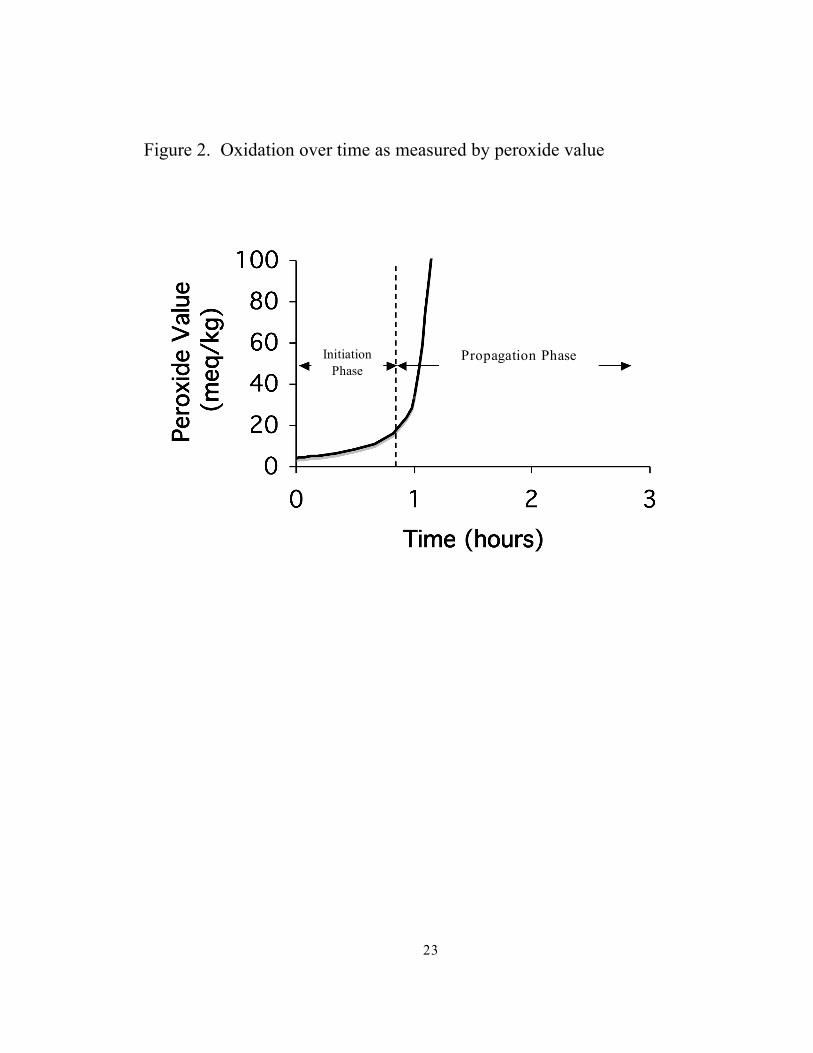
1994). The hydroperoxide concentration can be measured, providing a
peroxide value. Oxidation over time as measured by peroxide value
(adapted from Coppen, 1994), is shown in Figure 2.
The hydroperoxides that form during the propagation phase are very
unstable, and break down to a number of secondary products such as
aldehydes and alcohols, which contribute to the unpleasant flavors
associated with rancid fats (Hamilton, 1994), or other polymers which are
14
unavailable and therefore lower the energy content of the fat (Shermer and
Giesen, 1997) and are capable of affecting the absorption of, or even
destroying, fat-soluble vitamins (Sanders, 1994). Over time, this rate of
breakdown becomes equal to the rate of hydroperoxide formation resulting
in a temporary equilibrium. Subsequent to this point, hydroperoxide
decomposition continues until the double bonds in the fatty acid are
destroyed, ending the supply of newly formed hydroperoxides (Shermer and
Giesen, 1997). Additionally, termination reactions occur in which two
radicals combine and form a product that does not feed those reactions of
propagation (Hamilton, 1994; Talbot, 2004). Eventually, this termination
phase proceeds until the concentration of hydroperoxides returns to a level
near zero (Shermer and Giesen, 1997).
A variety of methods exist to test the level of rancidity in a product,
most of which involve testing for levels of products of oxidation or
intermediates of the reactions (Grettie and Newton, 1931). These levels are
constantly changing during autoxidation, so accurate interpretation of the
results can be challenging. Because of this, it is common to utilize at least
two different testing methods in order to acquire the necessary information
on the stability of the fat in question (Shermer and Giesen, 1997). Two of
15
the most commonly used tests are Peroxide Value (PV) and the Active
Oxygen Method (AOM). PV reveals the current level of oxidative rancidity,
measured as milliequivalents of peroxide per kilogram (meq/kg), while the
AOM test measure PVs at various time intervals while bubbling air through
the fat and is used to predict the ability of a fat in storage to remain stable
over time (Pearl, 2004). Recommended maximum levels of PV and
oxidative stability vary depending on the source.
It is possible to minimize or delay the development of oxidative
rancidity in fat or feeds containing added fat during handling and storage.
Berger (1994) reports four main influences on the rate of autoxidation. The
first involves the level of contact with air. Oxidation cannot occur without
oxygen, and proper storage and handling conditions can reduce the
interaction between the fat source and air. The second influence is
temperature. Berger (1994) reports that the rate of reaction of oxygen with
fat can double with every 10 degree Celsius increase in temperature. By
keeping fats in the coolest storage conditions possible or, in situations where
heating is required for handling of fats that tend to be in a solid state at room
temperature, by avoiding overheating, this rate of reaction can be slowed.
The third factor that can increase the rate of oxidation is the presence of
16
catalysts such as some metals and traces of already oxidized fat. Contact
with copper or iron should be avoided, and cleanliness can prevent contact
between non-oxidized and oxidized fat. Finally, light can stimulate photo-
oxidation, so exposure should be minimized as much as possible.
ANTIOXIDANTS
An alternative method for delaying the development of oxidative
rancidity is the use of an antioxidant. The benefits of antioxidant addition to
products that are susceptible to oxidation have long been recognized and
utilized, and have been discussed in detail as early as the 1940’s (Mattill,
1947). An ideal antioxidant possesses several important qualities, including
being safe to use for both humans and livestock, effective at low
concentrations, easy to incorporate, heat tolerant, (important in the pelleting
process), affordable, as well as odorless, colorless, and tasteless (Coppen,
1994). Antioxidants interrupt either the initiation or propagation phase of
autoxidation (Hamilton, 1994) by supplying hydrogen atoms to the free
radicals, stabilizing them before they are allowed to react further and
converting them back to the original fatty acid (Rumsey, 1978). This
remains true until the antioxidant has been completely consumed, and it is
17
important to realize that antioxidants are not capable of preventing
oxidation, just delaying it. They are useful for extending the shelf life of fat-
containing products, decreasing waste, decreasing nutritional losses due to
the oxidation of fat-soluble vitamins, and increasing the number of fats that
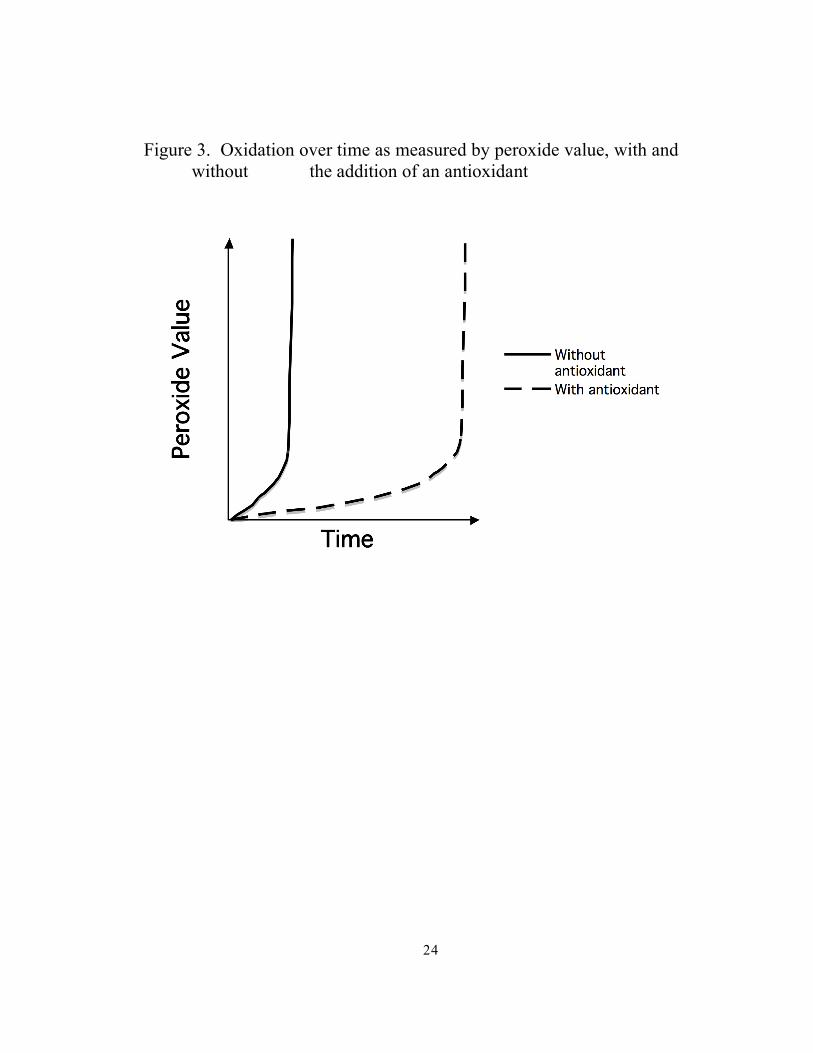
can be utilized in a diet (Coppen, 1994). The earlier an antioxidant is added,
(that is, during initiation versus propagation) the more effective it is, and the
effects of adding an antioxidant to a fat early on, (adapted from Coppen,
1994) are displayed in Figure 3. It is also important to keep in mind that
antioxidants do not prevent hydrolytic rancidity or the formation of FFAs,
and they are not capable of returning an oxidized fat to a non-oxidized state
(Coppen, 1994).
EFFECTS OF OXIDIZED FATS AND ANTIOXIDANTS IN
POULTRY DIETS ON PERFORMANCE
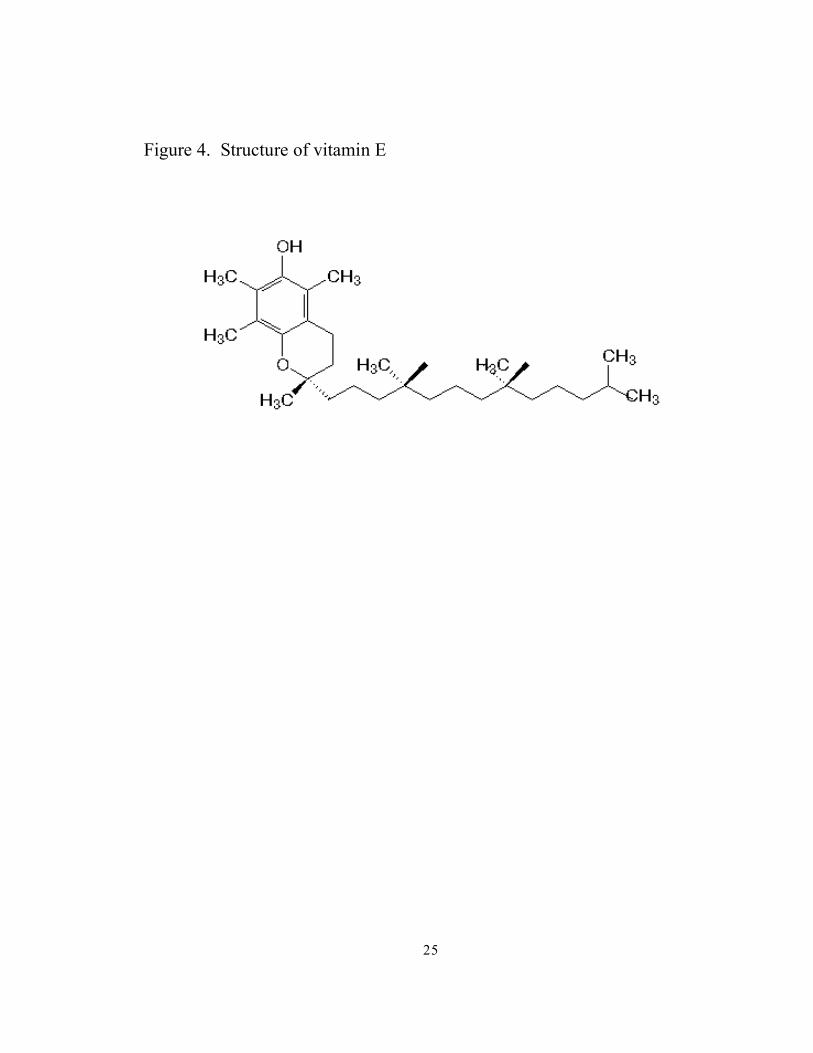
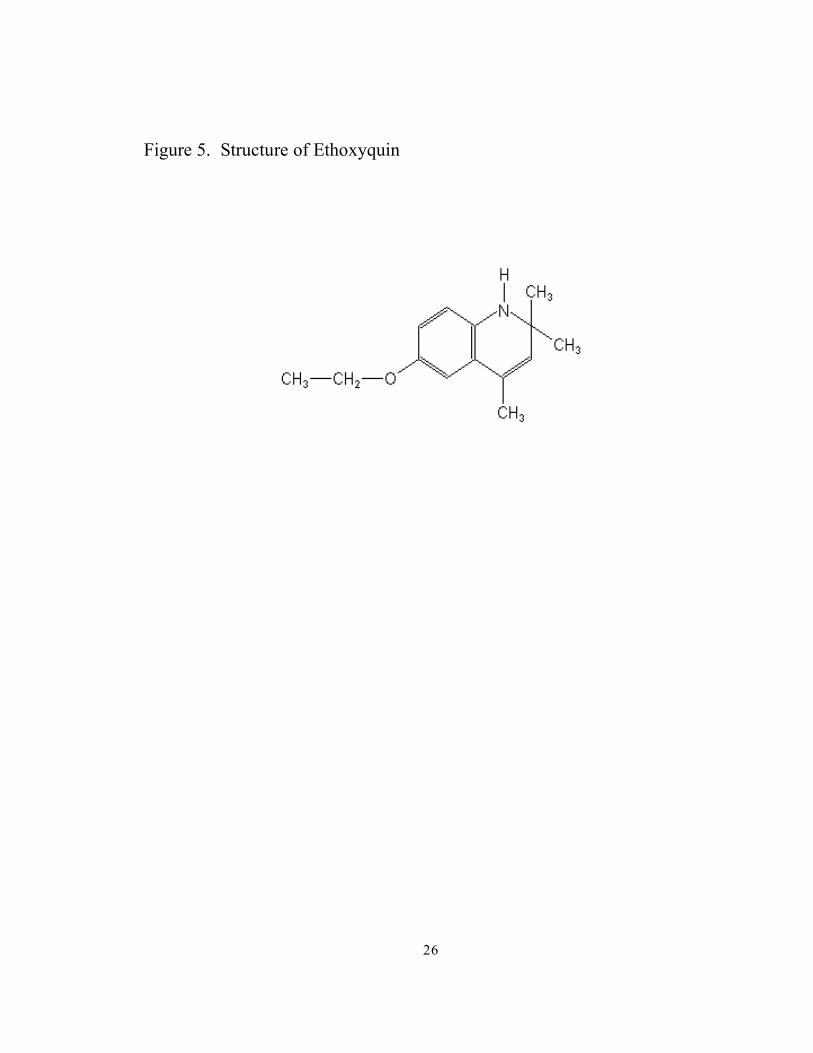
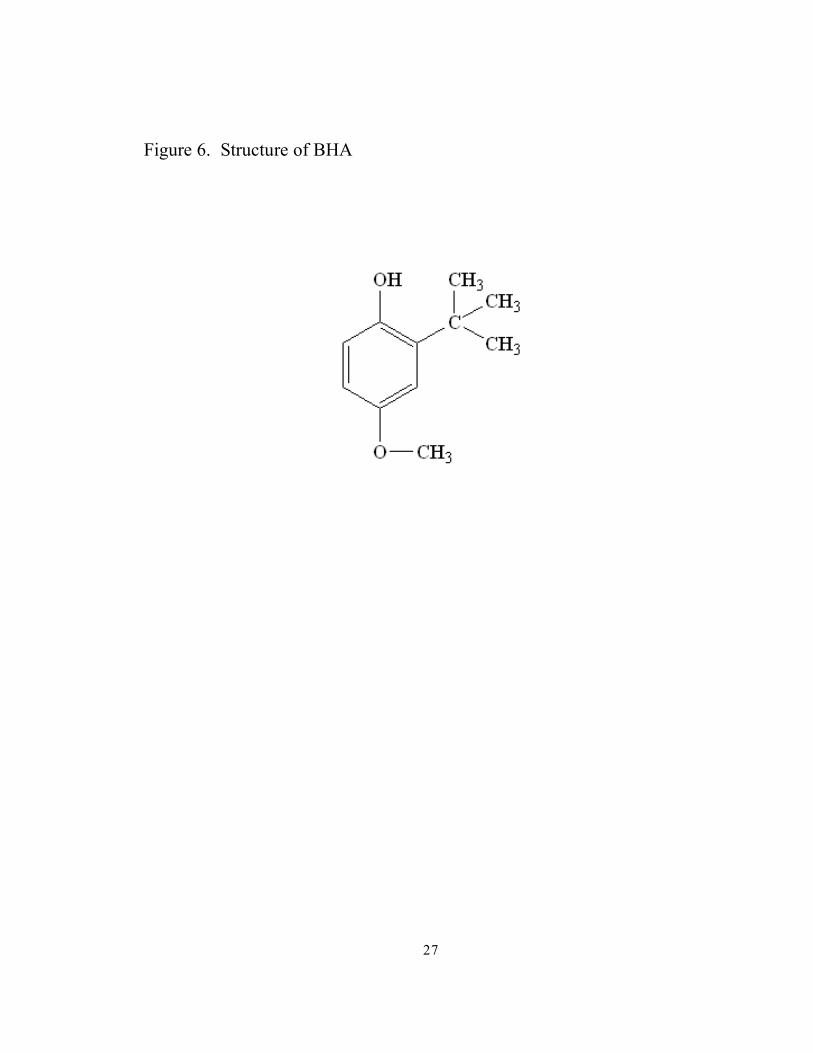
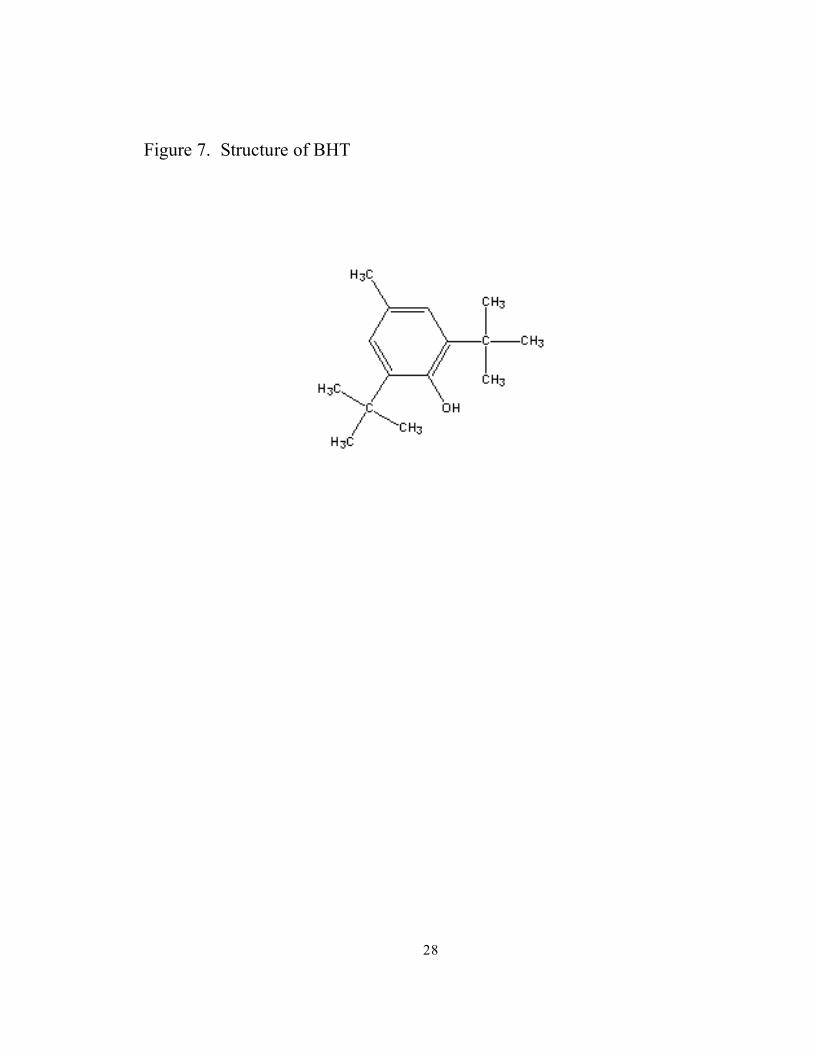
A large number of antioxidants exist, including natural compounds
such as vitamin E (Figure 4) and other tocopherols, and synthetic
compounds such as ethoxyquin (Figure 2), butylated hydroxyanisole (BHA)
(Figure 3), and butylated hydroxytoluene (BHT) (Cheeke, 2005). All three
18
of these synthetic antioxidants have demonstrated efficacy in reducing the
rate of oxidative rancidity in broiler diets (Njobeh, 2006). A broiler trial
conducted by Cabel and others (1988) included diets containing fat oxidized
to 0, 50, 100, or 150 meq/kg, each of which were supplemented with 0, 62.5,
or 125 ppm ethoxyquin. At 21 and 42 days, birds consuming the feed with a
peroxide value of 100 and 175 displayed decreased body weight when
compared to those consuming 0 meq/kg, but at 49 days only those birds
consuming 175 meq/kg had reduced body weight gain and feed efficiency.
Ethoxyquin supplementation resulted in greater body weight gain at 49 days,
and as the peroxide levels of the diets increased, supplementation of
ethoxyquin reduced the negative affects of the diets with elevated peroxide
levels, especially those with 125 ppm.
While severe oxidation has been shown to cause decreased weight
gain, feed efficiency, fertility, hatchability, and is associated with health
disorders such as encephalomalacia (Cabel et al., 1988, Lin et al., 1989),
there are certainly differences in reported effects of feeding oxidized fat and
at what levels negative effects will be seen. Performance of poultry has
generally not been significantly compromised when oxidized fats with PV
levels up to 100 meq/kg were fed (Lea et al., 1966; L’Estrange et al., 1966;
19
Carpenter, et al., 1966). More recently, experimental data using turkeys
showed no deleterious effects on growth performance from feeding oxidized
fats (Leeson et al., 1997), and research conducted by Pesti and coworkers
(2002) in which various oils with a range of peroxide values were fed to
broilers resulted in no deleterious effects on performance, although birds
were not taken to typical growout weights.
It has been shown that PV higher than 100 meq/kg can cause
depression in performance parameters. A study was conducted in which
dietary treatments containing either fresh vegetable oil (PV of 1 meq/kg) or
oxidized oil (PV of 156 meq/kg) were fed to broilers. At 35 days of age the
trial was concluded, and birds consuming feed with 156 meq/kg PV
displayed lower body weight (Enberg, 1996). While a review of the
literature certainly produces conflicting opinions concerning the effects of
feeding oxidized fat to poultry and the levels at which negative effects may
be observed, it is consistently agreed upon that the addition of commercial
antioxidants has reduced the impact of oxidized fats (Cabel et al., 1988).
EFFECTS OF OXIDIZED FATS IN POULTRY DIETS ON
IMMUNITY
20
Although from the literature it seems that feeding fats with a
peroxide value less than 100 meq/kg should be safe in poultry, concern still
exists over feeding such fats. One of these concerns stems from the belief
that oxidized fats may compromise immune function. However, a very
limited amount of research has been done on this topic in poultry. It has
been shown that the presence of unstabilized rancid fat in the intestine
increases the number of E. coli and decreases Lactobacilli populations in the
small intestine (Dibner, et al., 1995). Despite this lack of research, it is
known that the free-radical mechanism of autoxidation leads to the
formation of several products that have been previously mentioned that are
known to be toxic (Sanders, 1994) and may compromise immune function
and cell wall integrity (Sevanian and Peterson, 1986). It is apparent that
additional investigation is needed in this area.
SUMMARY
The benefits of added fat in poultry diets are well established, and the
use of rendered fats in the United States is a common practice that has been
proven to be safe and cost effective. In many other countries, there is a
significant potential market for rendered fats and fat-containing animal by-
21
products, especially as world population increases and poultry meat and eggs
become an increasingly popular protein source. However, fear of decreased
quality due to oxidative rancidity and the subsequent effects on performance
and immunity stand in the way.
Currently, there are no true industry standards for measuring the level
of rancidity of fats, and very little research has been conducted on the effect
of feeding oxidized fats on immunity and bird health. While it seems that
excessive peroxide values of individual fats (greater than 100 meq/kg) may
cause performance problems, little evidence exists that fats with lower PVs
should be of concern. However, concern remains over the issue of oxidative
rancidity, the toxic secondary products of oxidative decomposition, and the
potential for compromised immune function that might result. Continued
research is imperative in order to define the acceptable level of rancidity and
to determine if high levels of peroxide values affect immune function.
22
Figure 1. Initiation and propagation reactions of autoxidation
Initiation Reaction
RH R . + H .
lipid molecule lipid free radical + hydrogen free radical
Propagation Reaction 1
R . + O2 ROO .
Lipid free radical + oxygen peroxy free radical
Propagation Reaction 2
ROO . + RH R . + ROOH
Peroxy free radical + lipid molecule lipid free + hydroperoxide radical
23
Figure 2. Oxidation over time as measured by peroxide value
Initiation Phase
Propagation Phase
24
Figure 3. Oxidation over time as measured by peroxide value, with and without the addition of an antioxidant
25
Figure 4. Structure of vitamin E
26
Figure 5. Structure of Ethoxyquin
27
Figure 6. Structure of BHA
28
Figure 7. Structure of BHT
29
CHAPTER 2
EFFECT OF HIGH PEROXIDE VALUE FATS ON PERFORMANCE OF
BROILERS IN A NORMAL IMMUNE STATE
ABSTRACT
A floor pen trial was conducted to determine the effect of high
peroxide value fats on performance of broilers. One thousand four hundred
and forty day-old straight run broilers were obtained from a commercial
hatchery and randomly assigned to 48 floor pens. Each floor pen contained
30 broilers. Dietary treatments were developed in a 3 x 2 factorial using
three levels of fat rancidity, peroxide value (PV) of 0, 75, and 150. One half
of each peroxide value diet also received an antioxidant, ethoxyquin, at 125
ppm. Six dietary treatments with 8 replicates were fed to Ross 708 broilers
from hatch to week 7. Diets were formulated based on standard industry
diets meeting all of the NRC requirements with the exception of fat being
forced into the diet at 3% for the starter ration (0 – 3 wks), 6% in the grower
30
ration (3 – 5 wks), and 6% in the finisher ration (5 – 7 wks). The trial
measured the performance of the broilers based on the parameters of feed
intake (FI), weight gain (WG), and feed conversion (F:G). An initial pen
weight was taken on day 1 for each of the 48 pens. Birds were weighed at 3,
5, and 7 weeks of age to calculate FE. At week 7, four birds per pen (32
birds/treatment) were sacrificed in order to obtain a fat pad weight, carcass
weight, and percent meat yield. Experimental data were analyzed by
analysis of variance using the JMP program. The ANOVA indicated that
diets with a peroxide value of 75 or greater exhibit poorer feed conversion
than the treatment with an acceptable peroxide value. Furthermore, the
addition of an antioxidant to the diets with a peroxide value of 75 or greater
yielded a numerically improved feed conversion over the diets with the same
peroxide value but no antioxidant.
INTRODUCTION
The use of fats and fat-containing animal by-products is well
established in the United States. Fat addition to poultry rations provides a
31
concentrated energy source that is capable of increasing growth rates,
decreasing feed intake, and increasing feed efficiency (Firman, 1995; Sell et
al., 1986; Pesti et al., 2002). It has been estimated that use of rendered fat
products may save up to $10 per ton of feed produced (Firman, 2006).
Potential cost savings may be even greater in international markets in which
poultry production of low- and middle-income countries continues to rise
(Economic Research Service, USDA website, 2003). However,
internationally there is a trend toward an underutilization of fats and animal
meals containing fat compared to more traditional and more expensive
ingredients like soybean meal and vegetable oil. One of the biggest problems
with marketing and selling products such as tallow is the perception that
rendered fats, and fat containing meals, are of poor quality due to oxidative
rancidity.
Relatively little research has been done relating peroxide value (PV)
of fats to broiler performance. The objective of this study was to look at
how PV affected the performance of broilers grown to market age based on
feed intake (FI), weight gain (WG), and feed conversion (F:G).
32
MATERIALS AND METHODS
One thousand four hundred and forty day-old straight-run broilers
were obtained from a commercial hatchery and randomly assigned to floor
pens in an environmentally controlled house. The birds were exposed to 24
hours of fluorescent lighting. Six dietary treatments were replicated eight
times with thirty birds per replication. Birds were fed diets formulated to
resemble standard industry diets that met all of the NRC requirements.
Access to experimental diets and water was provided ad libitum for the
duration of the trial. Fat was set to a level of 3% within the starter diet (0-3
weeks) and 6% within the grower (3-5 weeks) and finisher diet (5-7 weeks).
Diets were formulated to meet NRC requirements using least-cost
formulation software. A 3 x 2 factorial was the model used for this trial with
three levels of fat rancidity: peroxide value (PV) of 0, 75 and 150. Each
peroxide value treatment was then divided into two, with or without an
antioxidant at 125 ppm (Ethoxyquin, Novus Intl., St. Louis, MO).
Birds and feed were weighed on a pen basis on day 0, 21, 35, and 49
to determine weight gain, feed intake, and feed conversion. Feed:Gain was
adjusted for mortality; weight of bird (mortality) was added to the pen
weight gain, then feed consumed was divided by pen weight gain. On day
33
49 four birds from each pen, two males and two females, were wing-banded,
individually weighed, and removed from feed. On day 50 the 192
individually weighed birds were slaughtered and processed to determine the
chilled carcass weight, weight of the fat pad, major cuts such as leg, thigh,
wing, pectoralis major, pectoralis minor and percent yield. The birds were
cared for using standard husbandry guidelines derived from standard
operating procedures.
Analysis of data was performed using pen as the experimental unit.
The JMP statistical analysis software package was used to perform Analysis
of Variance (ANOVA) with a factorial design using the general linear
model. The level of significance was established at P < 0.05. Mean
comparisons for all pairs were conducted using the Least Significant
Difference test.
RESULTS AND DISCUSSION
In this study, body weight gain, feed intake, feed conversion (F:G),
and processing yields were determined in order to determine if different
34
levels of fat rancidity, with and without the addition of an antioxidant,
exerted an effect on broiler performance. Mixed results were observed.
Results for weight gain (BWG) are presented in Table 2. Significant
differences (P < 0.05) in BWG occurred only in the 21-35 day period. There
were no differences (P > 0.05) in BWG among the treatments during the 0 –
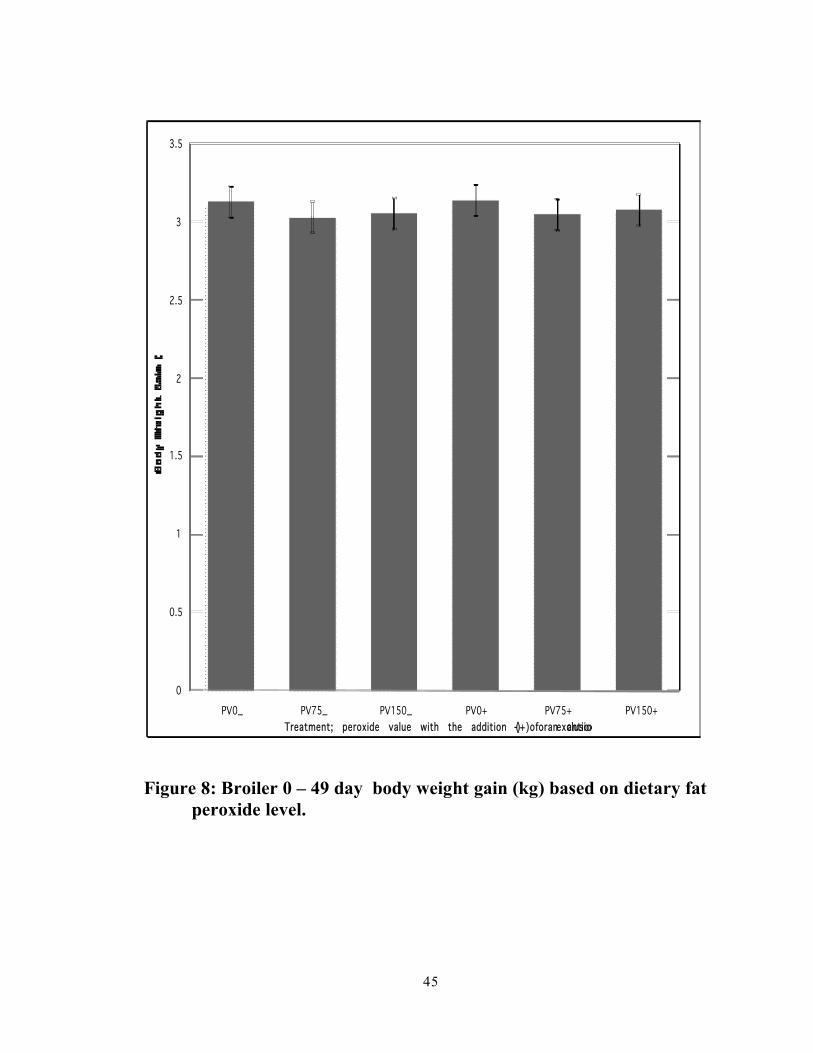
21 day and 35 – 49 day periods. The 0 – 49 day period also had no
significant difference among the treatments for body weight gain (Figure 8).
Within the 21 – 35 day period there was a significant difference (P < 0.05)
between the two treatments with the low peroxide values, PV0− and PV0+,
and the treatments with higher peroxide values, PV75−, PV150−, and
PV75+. The treatment PV150+ was not significantly different when
compared to all other treatments within the 21 – 35 day period (P < 0.05).
PV seemed to be the main effect, with the PVO treatments resulting in
significantly improved performance except in the case of the PV150+
treatment. It would appear that the ethoxyquin supplementation may have
exerted a positive effect, except that it is unclear why the PV75+ treatment
did not also result in improved body weight gain over the other diets
containing elevated levels of PV with no ethoxyquin.
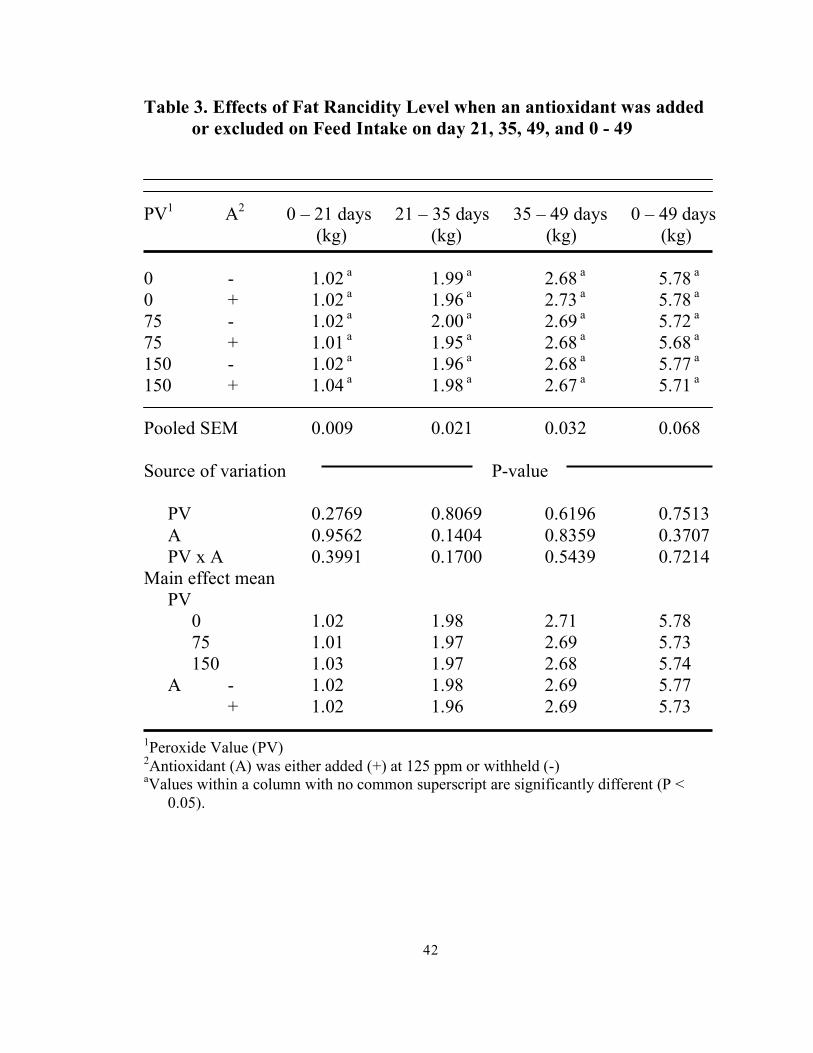
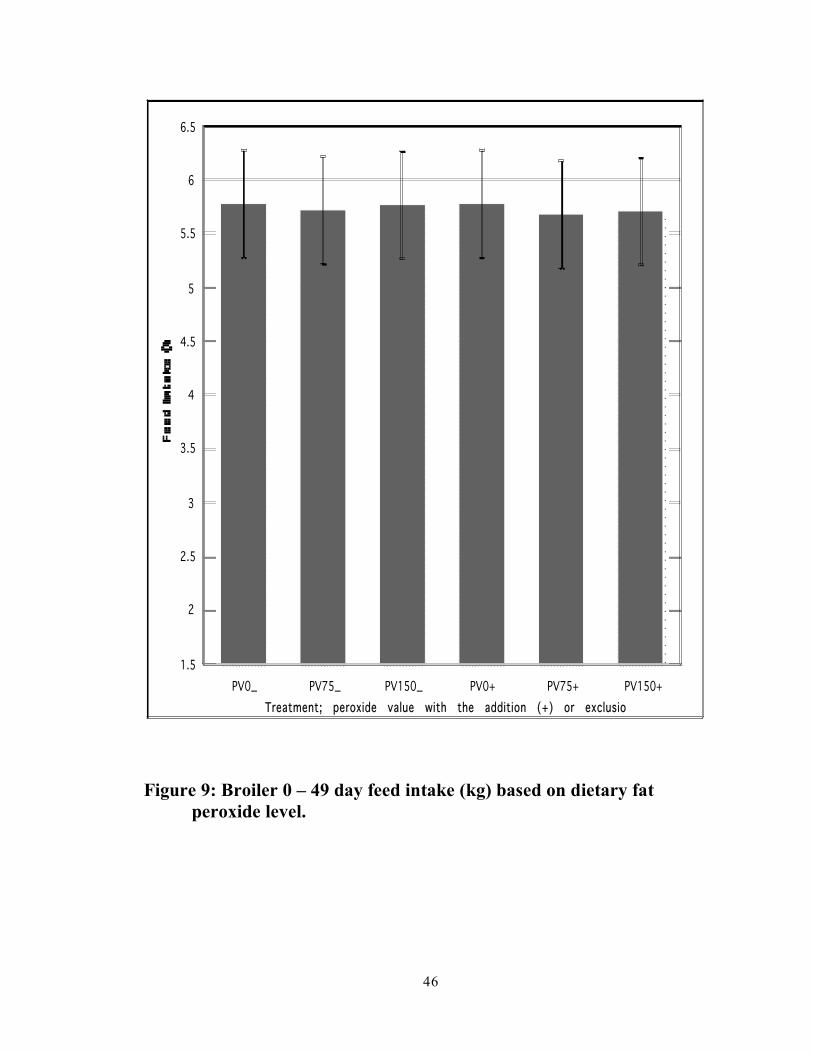
Feed intake (FI) data are summarized in Table 3. When looking at the
FI among treatments there was not a significant difference (P > 0.05) among
35
the treatments for any of the three time frames, 0 – 21 days, 21 – 35 days, or
35 – 49 days. There also was no significant difference when the treatments
were compared for the total feed intake, from 0 – 49 days (Figure 9).
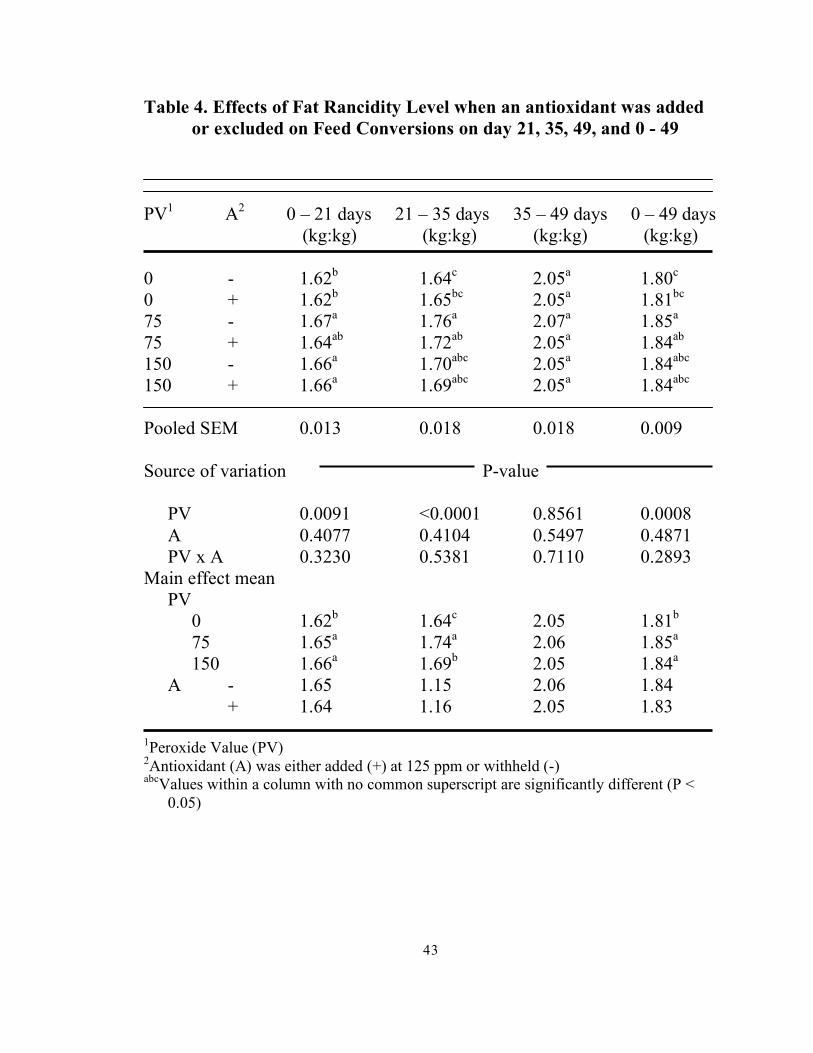
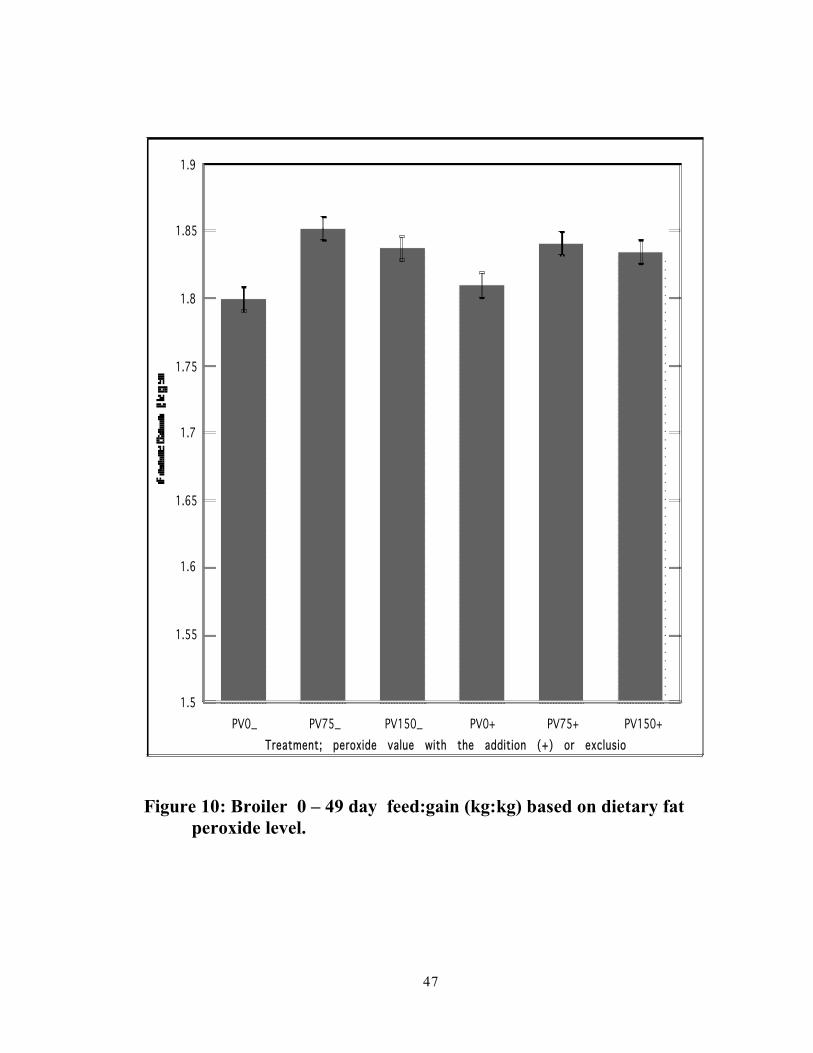
The data for feed conversion (F:G) are presented on Table 4. The F:G
for the 0 – 21 day period demonstrates that there was a significant difference
(P < 0.05) among treatments. The two treatments with the low peroxide
values, PV0− and PV0+, had a significantly improved F:G when compared
to the treatments with higher peroxide values, PV75−, PV150−, and
PV150+. The treatment PV75+ was not significantly different when
compared to all other treatments, again indicating that the antioxidant may
have had a beneficial effect at lower PV levels during the starter period.
During the 21 – 35 day period the high rancidity diets PV150− and PV150+
were not significantly different from any of the other treatments. The PV0−
diet resulted in significantly improved feed conversion over the diets
containing the middle PV level of fat, PV75− and PV75+. There was also a
significant difference between the PV75− and the PV0+ treatments, with the
PV0+ treatment resulting in improved F:G (1.65 versus 1.76 for the PV75-).
For the period of 35 – 49 day there was no difference among the
treatments (P > 0.05). However, the 0 – 49 (Figure 10) day results were
36
similar to those for the 21 – 35 day period with the high rancidity diets
PV150− and PV150+ showing no significant differences (P > 0.05) from any
of the other treatments. The PV0− diet was significantly different (P < 0.05)
from the diets containing the middle PV level of fat, PV75− and PV75+.
There was also a significant difference between the PV75− and the PV0+
treatments.
Mortality occurred randomly throughout treatments at a consistently
low level. Therefore, statistical analysis was not run on the mortality data.
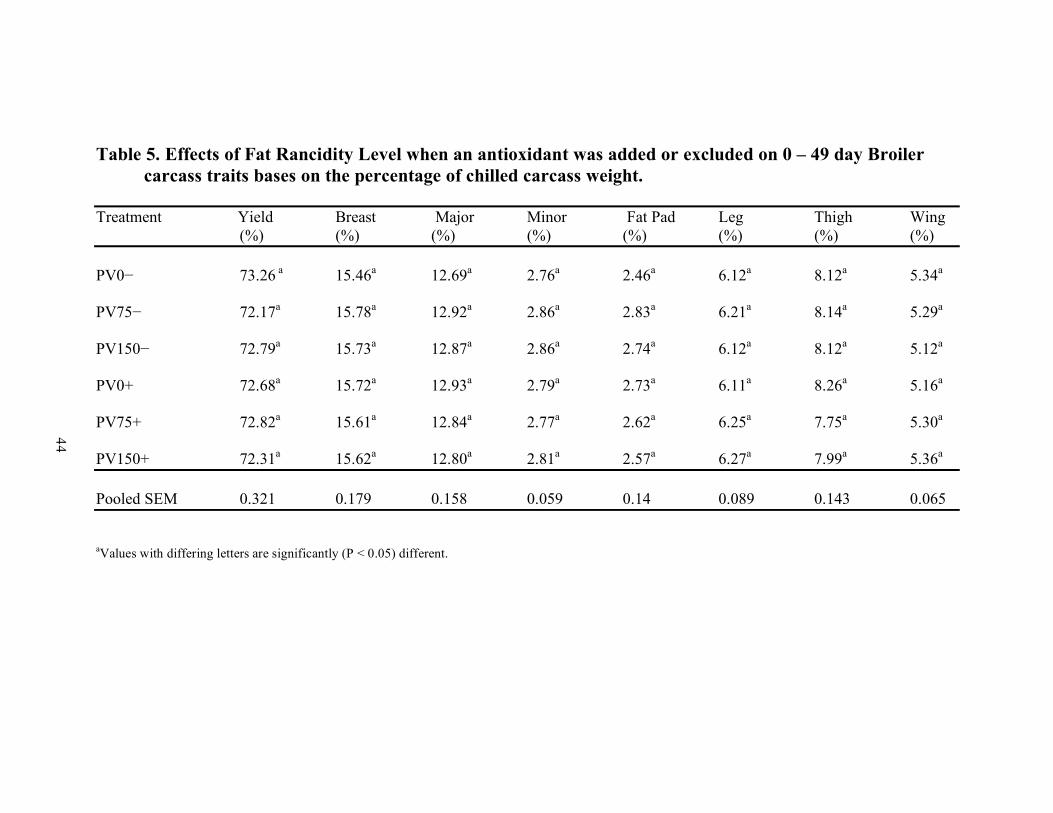
Processing attributes are summarized on Table 5. All of the
processing data were calculated as a percentage of chilled carcass weight.
There was no significant difference (P > 0.05) among treatments when
comparing percent yield, breast, major, minor, fat pad, leg, thigh, and wing.
It is unclear why variable results in body weight gain and feed
conversion occurred, especially within the 21 – 35 day period, and it is
difficult to conclude that either peroxide value or the addition of an
antioxidant caused conclusive effects in this period. Research conducted by
Cabel and coworkers (1988), in which a 4 x 3 factorial arrangement of diets
containing 0, 50, 100, or 175 meq/kg peroxide and either 0, 63, or 125 ppm
ethoxyquin was utilized, displayed results that were somewhat similar.
Birds consuming treatments that contained fat with PVs of 100 or 175 had
37
decreased weight gain at 21 and 42 days. At 49 days, only feed containing
fat with a PV of 175 meq/kg resulted in significantly decreased body
weights, and the addition of an antioxidant to diets containing fat with a PV
of 175 relieved the depression in gain. Feed efficiency in the same trial
mirrored the body weight gain data, with a significant decrease in body
weight occurring only at the highest peroxide level and the addition of
ethoxyquin failing to correct the depression. Another trial conducted by
Enberg and others (1996) utilized diets containing either fresh fat with a PV
of 1 meq/kg or oxidized fat (PV = 156 meq/kg) fed to broilers from 0 – 35
days of age. Body weight gain was significantly decreased in birds that
consumed the high PV treatment. The authors of these two trials came to the
conclusion that fat containing elevated peroxide levels can result in
decreased performance of broilers, and Cabel and coworkers (1988) also
concluded that the addition of ethoxyquin alleviated these negative effects.
These conclusions have been somewhat inconsistently demonstrated in the
literature. Similar finding have been found (Waldroup et al., 1960; Inoue et
al., 1984; Shermer and Calabotta, 1985), although the level of rancidity
needed to cause deleterious effects has not been agreed upon. Conversely,
earlier research performed by other groups has been unable to report
differences in performance of turkeys or broilers fed fat that was oxidized
38
(Lea et al., 1966; Carpenter et al., 1966; L’Estrange et al., 1966; Oertel and
Hartfiel, 1982). However, in each of these experiments the authors included
an antioxidant to the diets in an effort to keep a steady peroxide level, and it
is possible that the harmful effect of the peroxide was negated by the
antioxidant.
The results of the current study indicate that an elevated peroxide
level may cause a depression in body weight gain, especially when an
antioxidant is not utilized, in later phases of growth, but that when looking at
the overall growth period (0 – 49 days) no significant differences were seen.
Peroxide level, antioxidant inclusion, or period of growth did not seem to
affect feed intake. Feed conversion varied across growth periods, peroxide
values, and antioxidant addition; however, during the overall 0 – 49 day
growth period, F:G was significantly improved (P < 0.05) in the non-
antioxidant treatments for birds consuming PV0 fat over those consuming
PV75- treatments (1.80 versus 1.85, respectively), and the improvement in
F:G of the PV0- groups over the PV150- (1.180 versus 1.84, respectively)
was approaching statistical significance, indicating that PV did have an
overall negative effect on feed conversion. It appears from this experiment
that peroxide level had no effect on processing yields regardless of
antioxidant addition, indicating that it may be possible to feed rations with
39
some level of rancidity. It is unknown at this time why live performance
seemed to be depressed more in the 21 – 35 day period, and why antioxidant
addition seemed to ameliorate some of the negative performance at certain
PV levels and not at others. Based on results from this study and those from
the literature, it appears that the addition of an antioxidant, especially to
feeds containing fat with a PV below 150 meq/kg, can be useful in
alleviating some of the negative effects caused by oxidative rancidity.
40
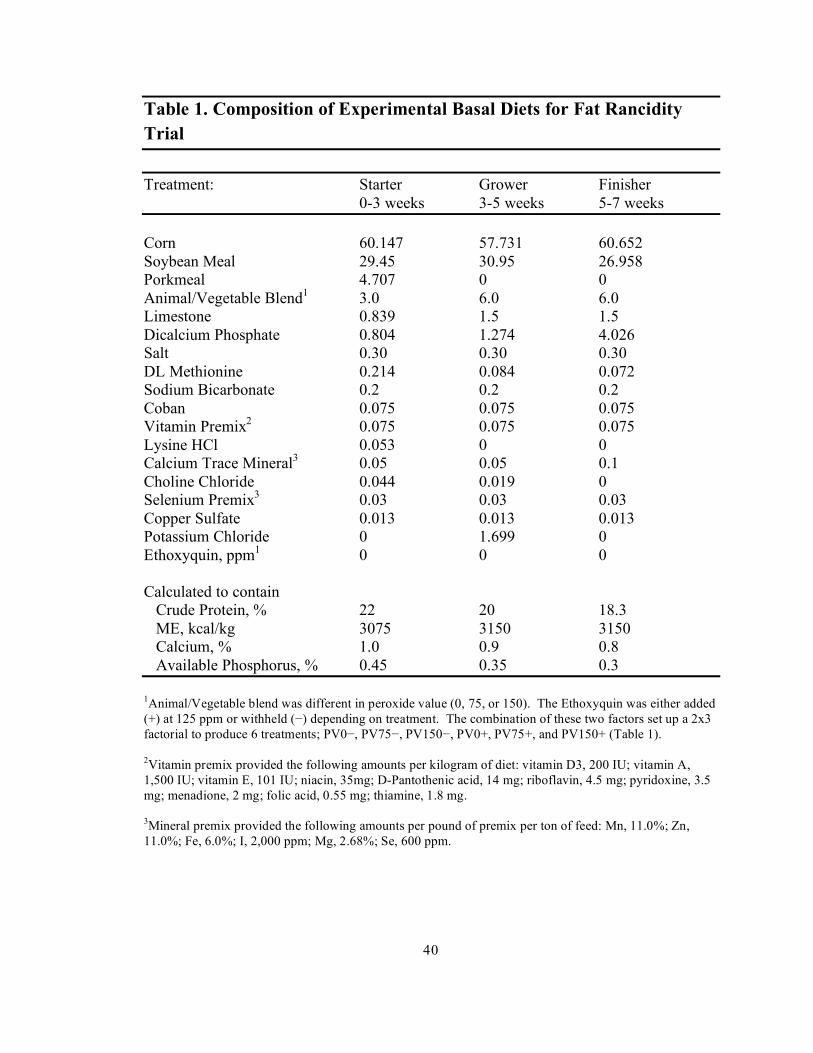
Table 1. Composition of Experimental Basal Diets for Fat Rancidity Trial Treatment: Starter Grower Finisher 0-3 weeks 3-5 weeks 5-7 weeks Corn 60.147 57.731 60.652 Soybean Meal 29.45 30.95 26.958 Porkmeal 4.707 0 0 Animal/Vegetable Blend1 3.0 6.0 6.0 Limestone 0.839 1.5 1.5 Dicalcium Phosphate 0.804 1.274 4.026 Salt 0.30 0.30 0.30 DL Methionine 0.214 0.084 0.072 Sodium Bicarbonate 0.2 0.2 0.2 Coban 0.075 0.075 0.075 Vitamin Premix2 0.075 0.075 0.075 Lysine HCl 0.053 0 0 Calcium Trace Mineral3 0.05 0.05 0.1 Choline Chloride 0.044 0.019 0 Selenium Premix3 0.03 0.03 0.03 Copper Sulfate 0.013 0.013 0.013 Potassium Chloride 0 1.699 0 Ethoxyquin, ppm1 0 0 0 Calculated to contain Crude Protein, % 22 20 18.3 ME, kcal/kg 3075 3150 3150 Calcium, % 1.0 0.9 0.8 Available Phosphorus, % 0.45 0.35 0.3 1Animal/Vegetable blend was different in peroxide value (0, 75, or 150). The Ethoxyquin was either added (+) at 125 ppm or withheld (−) depending on treatment. The combination of these two factors set up a 2x3 factorial to produce 6 treatments; PV0−, PV75−, PV150−, PV0+, PV75+, and PV150+ (Table 1). 2Vitamin premix provided the following amounts per kilogram of diet: vitamin D3, 200 IU; vitamin A, 1,500 IU; vitamin E, 101 IU; niacin, 35mg; D-Pantothenic acid, 14 mg; riboflavin, 4.5 mg; pyridoxine, 3.5 mg; menadione, 2 mg; folic acid, 0.55 mg; thiamine, 1.8 mg. 3Mineral premix provided the following amounts per pound of premix per ton of feed: Mn, 11.0%; Zn, 11.0%; Fe, 6.0%; I, 2,000 ppm; Mg, 2.68%; Se, 600 ppm.
41
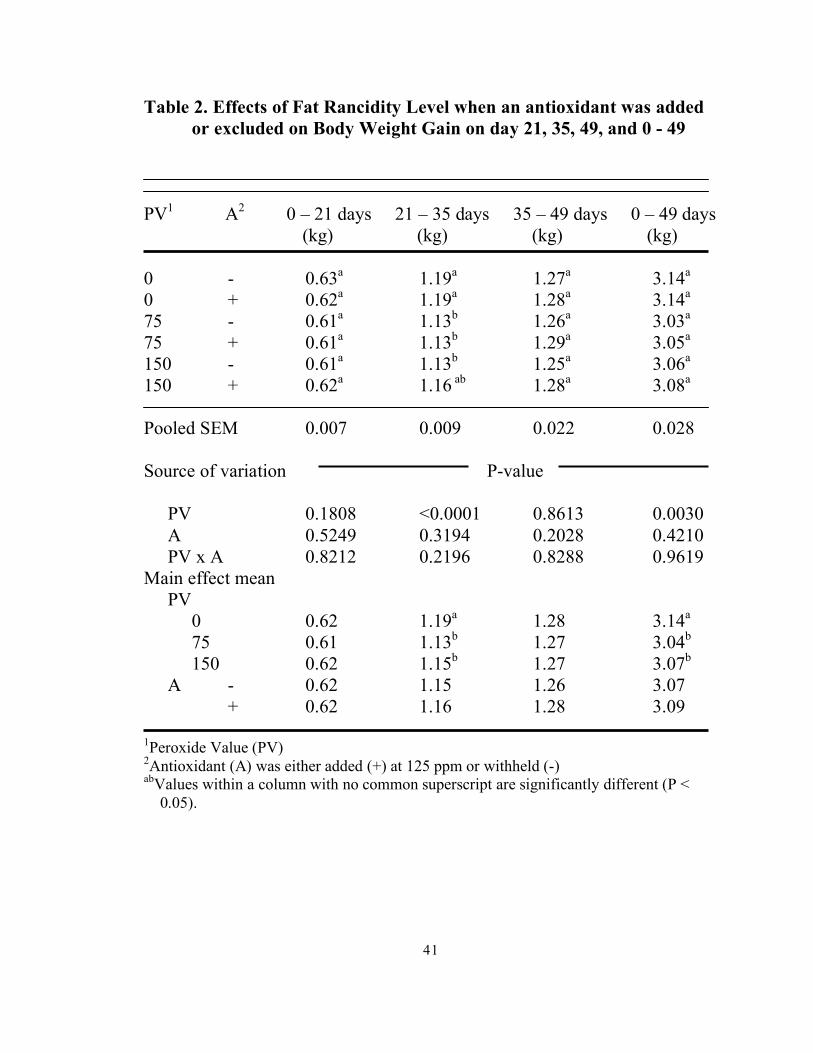
Table 2. Effects of Fat Rancidity Level when an antioxidant was added or excluded on Body Weight Gain on day 21, 35, 49, and 0 - 49
PV1 A2 0 – 21 days 21 – 35 days 35 – 49 days 0 – 49 days (kg) (kg) (kg) (kg) 0 - 0.63a 1.19a 1.27a 3.14a 0 + 0.62a 1.19a 1.28a 3.14a 75 - 0.61a 1.13b 1.26a 3.03a 75 + 0.61a 1.13b 1.29a 3.05a 150 - 0.61a 1.13b 1.25a 3.06a 150 + 0.62a 1.16 ab 1.28a 3.08a
Pooled SEM 0.007 0.009 0.022 0.028 Source of variation P-value PV 0.1808 <0.0001 0.8613 0.0030 A 0.5249 0.3194 0.2028 0.4210 PV x A 0.8212 0.2196 0.8288 0.9619 Main effect mean PV 0 0.62 1.19a 1.28 3.14a
75 0.61 1.13b 1.27 3.04b
150 0.62 1.15b 1.27 3.07b
A - 0.62 1.15 1.26 3.07 + 0.62 1.16 1.28 3.09 1Peroxide Value (PV) 2Antioxidant (A) was either added (+) at 125 ppm or withheld (-) abValues within a column with no common superscript are significantly different (P < 0.05).
42
Table 3. Effects of Fat Rancidity Level when an antioxidant was added or excluded on Feed Intake on day 21, 35, 49, and 0 - 49
PV1 A2 0 – 21 days 21 – 35 days 35 – 49 days 0 – 49 days (kg) (kg) (kg) (kg) 0 - 1.02 a 1.99 a 2.68 a 5.78 a 0 + 1.02 a 1.96 a 2.73 a 5.78 a 75 - 1.02 a 2.00 a 2.69 a 5.72 a 75 + 1.01 a 1.95 a 2.68 a 5.68 a 150 - 1.02 a 1.96 a 2.68 a 5.77 a 150 + 1.04 a 1.98 a 2.67 a 5.71 a
Pooled SEM 0.009 0.021 0.032 0.068 Source of variation P-value PV 0.2769 0.8069 0.6196 0.7513 A 0.9562 0.1404 0.8359 0.3707 PV x A 0.3991 0.1700 0.5439 0.7214 Main effect mean PV 0 1.02 1.98 2.71 5.78
75 1.01 1.97 2.69 5.73
150 1.03 1.97 2.68 5.74
A - 1.02 1.98 2.69 5.77 + 1.02 1.96 2.69 5.73 1Peroxide Value (PV) 2Antioxidant (A) was either added (+) at 125 ppm or withheld (-) aValues within a column with no common superscript are significantly different (P < 0.05).
43
Table 4. Effects of Fat Rancidity Level when an antioxidant was added or excluded on Feed Conversions on day 21, 35, 49, and 0 - 49
PV1 A2 0 – 21 days 21 – 35 days 35 – 49 days 0 – 49 days (kg:kg) (kg:kg) (kg:kg) (kg:kg) 0 - 1.62b 1.64c 2.05a 1.80c 0 + 1.62b 1.65bc 2.05a 1.81bc 75 - 1.67a 1.76a 2.07a 1.85a 75 + 1.64ab 1.72ab 2.05a 1.84ab 150 - 1.66a 1.70abc 2.05a 1.84abc 150 + 1.66a 1.69abc 2.05a 1.84abc
Pooled SEM 0.013 0.018 0.018 0.009 Source of variation P-value PV 0.0091 <0.0001 0.8561 0.0008 A 0.4077 0.4104 0.5497 0.4871 PV x A 0.3230 0.5381 0.7110 0.2893 Main effect mean PV 0 1.62b 1.64c 2.05 1.81b
75 1.65a 1.74a 2.06 1.85a
150 1.66a 1.69b 2.05 1.84a
A - 1.65 1.15 2.06 1.84 + 1.64 1.16 2.05 1.83 1Peroxide Value (PV) 2Antioxidant (A) was either added (+) at 125 ppm or withheld (-) abcValues within a column with no common superscript are significantly different (P < 0.05)
44
Table 5. Effects of Fat Rancidity Level when an antioxidant was added or excluded on 0 – 49 day Broiler carcass traits bases on the percentage of chilled carcass weight.
Treatment Yield Breast Major Minor Fat Pad Leg Thigh Wing (%) (%) (%) (%) (%) (%) (%) (%) PV0− 73.26 a 15.46a 12.69a 2.76a 2.46a 6.12a 8.12a 5.34a PV75− 72.17a 15.78a 12.92a 2.86a 2.83a 6.21a 8.14a 5.29a PV150− 72.79a 15.73a 12.87a 2.86a 2.74a 6.12a 8.12a 5.12a PV0+ 72.68a 15.72a 12.93a 2.79a 2.73a 6.11a 8.26a 5.16a PV75+ 72.82a 15.61a 12.84a 2.77a 2.62a 6.25a 7.75a 5.30a PV150+ 72.31a 15.62a 12.80a 2.81a 2.57a 6.27a 7.99a 5.36a Pooled SEM 0.321 0.179 0.158 0.059 0.14 0.089 0.143 0.065 aValues with differing letters are significantly (P < 0.05) different.
45
0
0.5
1
1.5
2
2.5
3
3.5
PV0_ PV75_ PV150_ PV0+ PV75+ PV150+Treatment; peroxide value with the addition (+) or exclusion (-) of an antioxidant
Figure 8: Broiler 0 – 49 day body weight gain (kg) based on dietary fat peroxide level.
46
1.5
2
2.5
3
3.5
4
4.5
5
5.5
6
6.5
PV0_ PV75_ PV150_ PV0+ PV75+ PV150+Treatment; peroxide value with the addition (+) or exclusion (_) of an antioxidant
Figure 9: Broiler 0 – 49 day feed intake (kg) based on dietary fat peroxide level.
47
1.5
1.55
1.6
1.65
1.7
1.75
1.8
1.85
1.9
PV0_ PV75_ PV150_ PV0+ PV75+ PV150+Treatment; peroxide value with the addition (+) or exclusion (_) of an antioxidant
Figure 10: Broiler 0 – 49 day feed:gain (kg:kg) based on dietary fat peroxide level.
48
CHAPTER 3
EFFECT OF HIGH PEROXIDE VALUE FATS ON PERFORMANCE OF
BROILERS IN AN IMMUNE CHALLENGED STATE
ABSTRACT
A floor pen trial was conducted to determine the effect of high
peroxide value fats on performance of broilers in an immune challenged
state. One thousand four hundred and forty day-old straight run broilers
were obtained from a commercial hatchery and randomly assigned to 48
floor pens. Each floor pen contained 30 broilers. Dietary treatments were
developed as a 3 x 2 factorial using three levels of fat rancidity, with
peroxide values (PV) of 0, 75, and 150. The diets were each divided, and
one of each of the different peroxide value diets also received an antioxidant,
ethoxyquin, at 125 ppm. Six dietary treatments with 8 replicates were fed to
Ross 708 broilers from hatch to week 7. Diets were formulated based on
standard industry diets meeting all of the NRC requirements with the
49
exception of fat being forced into the diet at 3% for the starter ration (0 – 3
wks), 6% in the grower ration (3 – 5 wks), and 6% in the finisher ration (5 –
7 wks). At 4 weeks of age the broilers underwent a coccidial challenge. The
trial measured the performance of the immune challenged broilers based on
the parameters of feed intake (FI), weight gain (WG), and feed conversion
(F:G). An initial pen weight was taken on day 1 for each of the 48 pens.
Birds were weighed at 3, 5, and 7 weeks of age to calculate F:G. At week 7,
four birds per pen (32 birds/treatment) were sacrificed in order to obtain a fat
pad weight, carcass weight, percent meat yield, and cecal scoring.
Experimental data were analyzed by analysis of variance using the JMP
program. The ANOVA indicated that birds consuming diets with a peroxide
value of 75 or greater exhibit poorer feed conversion than the treatment with
an acceptable peroxide value. Furthermore, diets with the added antioxidant
demonstrated no statistical difference in feed conversion due to peroxide
value. There were also no significant effects of the immune challenge in
combination with peroxide levels on bird performance.
INTRODUCTION
50
The use of fats and fat-containing animal by-products is well
established in the United States. Fat addition to poultry rations provides a
concentrated energy source that is capable of increasing growth rates,
decreasing feed intake, and increasing feed efficiency (Firman, 1995; Sell et
al., 1986; Pesti et al., 2002). It has been estimated that use of rendered fat
products may save up to $10 per ton of feed produced (Firman, 2006).
Potential cost savings may be even greater in international markets in which
poultry production of low- and middle-income countries continues to rise
(Economic Research Service, USDA website, 2003). However,
internationally there is a trend toward an underutilization of fats and animal
meals containing fat compared to more traditional and more expensive
ingredients like soybean meal and vegetable oil. One of the biggest problems
with marketing and selling products such as tallow is the perception that
rendered fats, and fat containing meals, are of poor quality due to oxidative
rancidity.
One of the concerns with using oxidized fats is the potential for
negative health effects. To date, there is very little research investigating the
effects of autoxidized fats on the immune function of broilers. Despite this
lack of research, it is known that the free-radical mechanism of autoxidation
leads to the formation of several products that are known to be toxic
51
(Sanders, 1994) and may compromise immune function and cell wall
integrity (Sevanian and Peterson, 1986). It is apparent that additional
investigation is needed in this area. The objective of this study was to look
at how PV affected the growth of broilers based on feed intake (FI), weight
gain (WG), and feed conversion (F:G), with and without an immune
challenge.
MATERIALS AND METHODS
One thousand four hundred and forty day-old straight-run broilers were
obtained from a commercial hatchery and randomly assigned to floor pens in
an environmentally controlled house. The birds were exposed to 24 hours of
fluorescent lighting. Six dietary treatments were replicated eight times with
thirty birds per replication. Birds were fed diets formulated as standard
industry diets that met all of the NRC requirements. Access to experimental
diets and water was provided ad libitum for the duration of the trial. Fat was
set to the level of 3% within the starter diet (0 – 3 weeks) and 6% within the
grower (3 – 5 weeks) and finisher diet (5 – 7 weeks).
52
Diets were formulated to meet NRC requirements using least-cost
formulation software. A 3 x 2 factorial was the model used for this trial with
three levels of fat rancidity with one level based on the peroxide value (PV)
of that fat, PV of 7 (PV0), one at 75 (PV75), and one at 150 (PV150). Each
peroxide value treatment was then divided so that one of the treatments for
each level of rancidity contained the addition of an antioxidant (+A) at 125
ppm (Ethoxyquin, Novus Int., St. Louis, MO), while the remaining treatment
for each level of rancidity had the antioxidant withheld (−A).
Birds and feed were weighed on a pen basis on day 0, 21, 35, and 49
to determine weight gain, feed intake, and feed conversion. Feed:Gain was
adjusted for mortality; weight of bird (mortality) was added to the pen
weight gain; feed consumed divided by pen weight gain. An immune
challenge was presented to the birds by way of coccidiosis on day 28. The
coccidial challenge was administered to the birds by using a live vaccination
of Cocci-vac at four times the treatment dosage. On day 49 four birds from
each pen, two males and two females, were wing-banded, individually
weighed, and removed from feed. On day 50 the 192 individually weighed
birds were slaughtered and processed to determine the cecal score, chilled
carcass weight, weight of the fat pad, major cuts such as leg, thigh, wing,
breast major, breast minor and percent yield. The birds were cared for using
53
standard husbandry guidelines derived from standard operating procedures.
Analysis of data was performed using pen as the experimental unit.
The JMP statistical analysis software package was used to perform Analysis
of Variance (ANOVA) with a factorial design using the general linear
model. The level of significance was established at P < 0.05. Mean
comparisons for all pairs were conducted using the Least Significant
Difference test.
RESULTS AND DISCUSSION
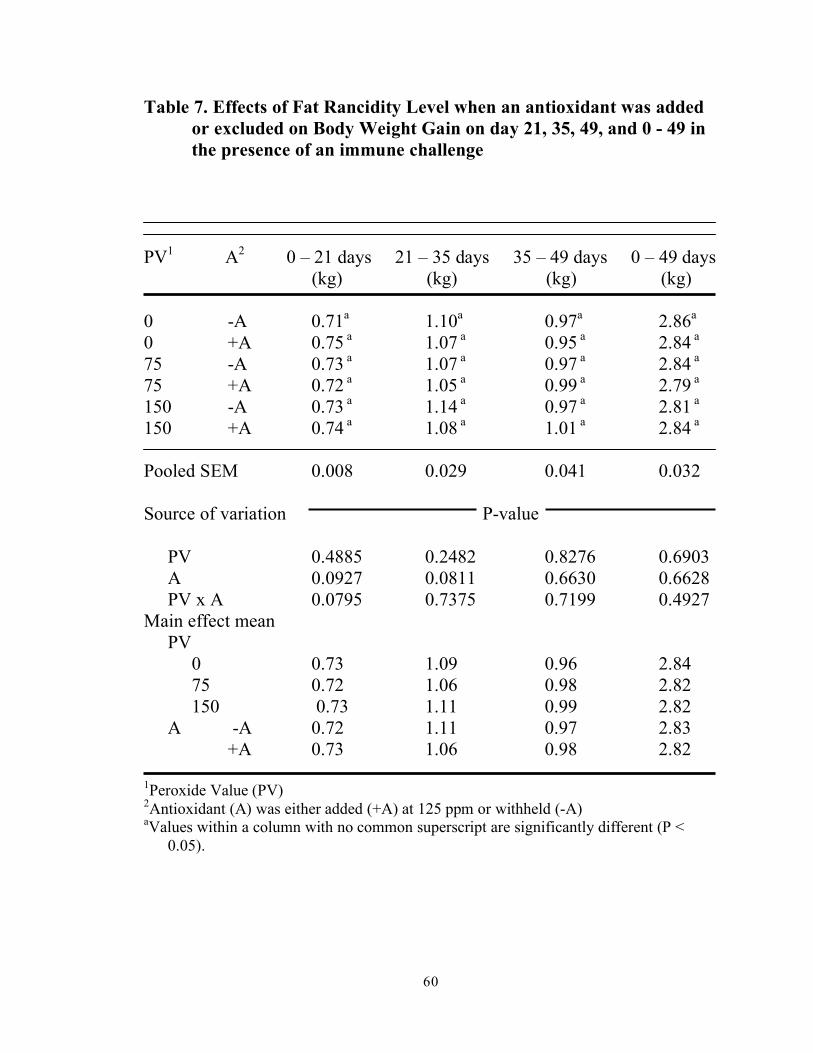
Results for weight gain (BWG) are demonstrated in Table 7. In the
trial there were no differences (P > 0.05) in BWG among the treatments
during the 0 – 21 day, 21 – 35 day, and 35 – 49 day periods. There were
also no significant differences overall for the 0 – 49 day period (Figure 11).
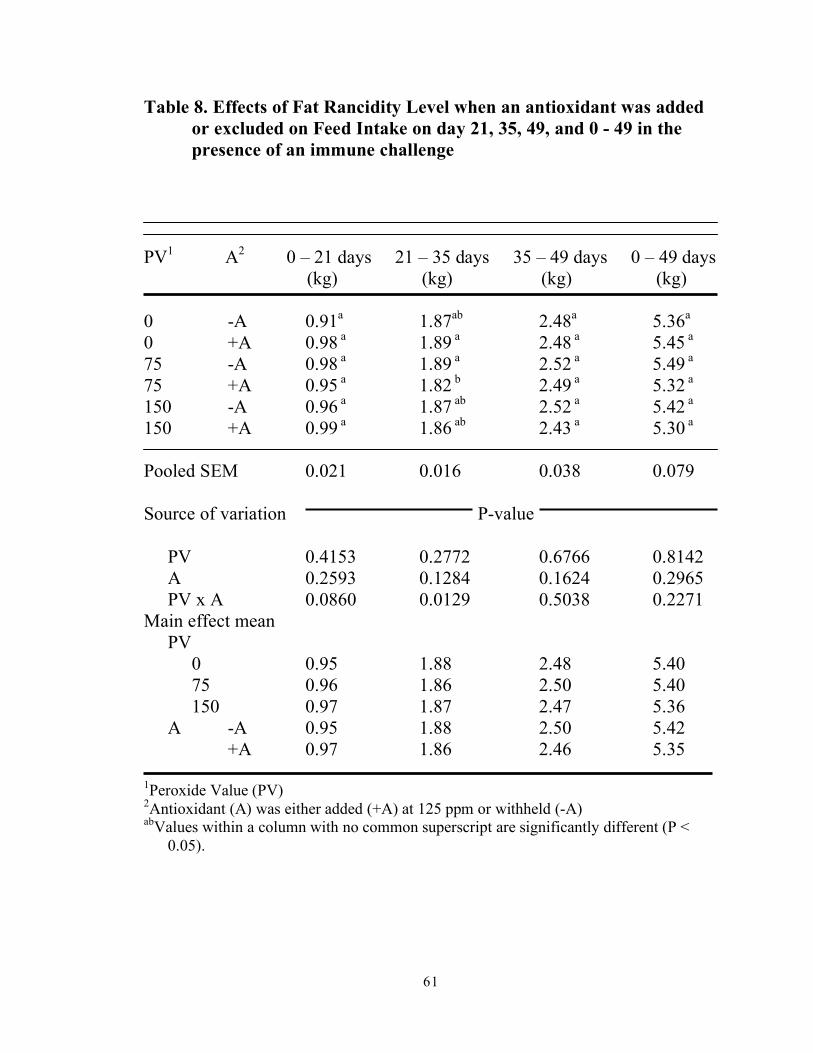
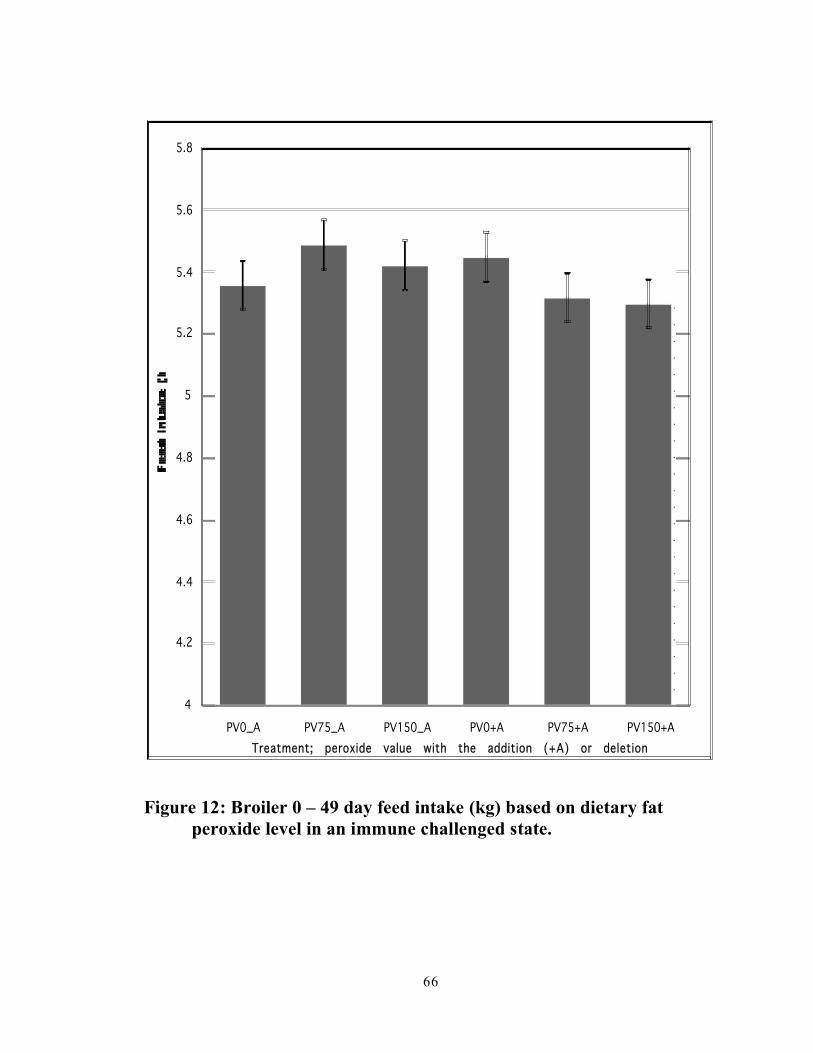
Feed intake (FI) data are listed in Table 8. When looking at the FI
among treatments there were not significant differences (P > 0.05) among
the treatments for 0 – 21 days and 35 – 49 days periods. There was also no
significant difference for the 0 – 49 day period (Figure 12) among the
treatments. There was a significant difference (P < 0.05) among the
treatments for the 21 – 35 day period. The two high rancidity levels,
54
PV150−A and PV150+A, and the control group, PV0−A, did not differ from
the other three treatments, PV75−A, PV0+A, and PV75+A. The PV75−A
and PV0+A treatments did not differ from each other, but both were
significantly different from the PV75+A treatment (PV75-A = 1.89 kg and
PV0+A = 1.89 kg versus PV75+A = 1.82 kg).
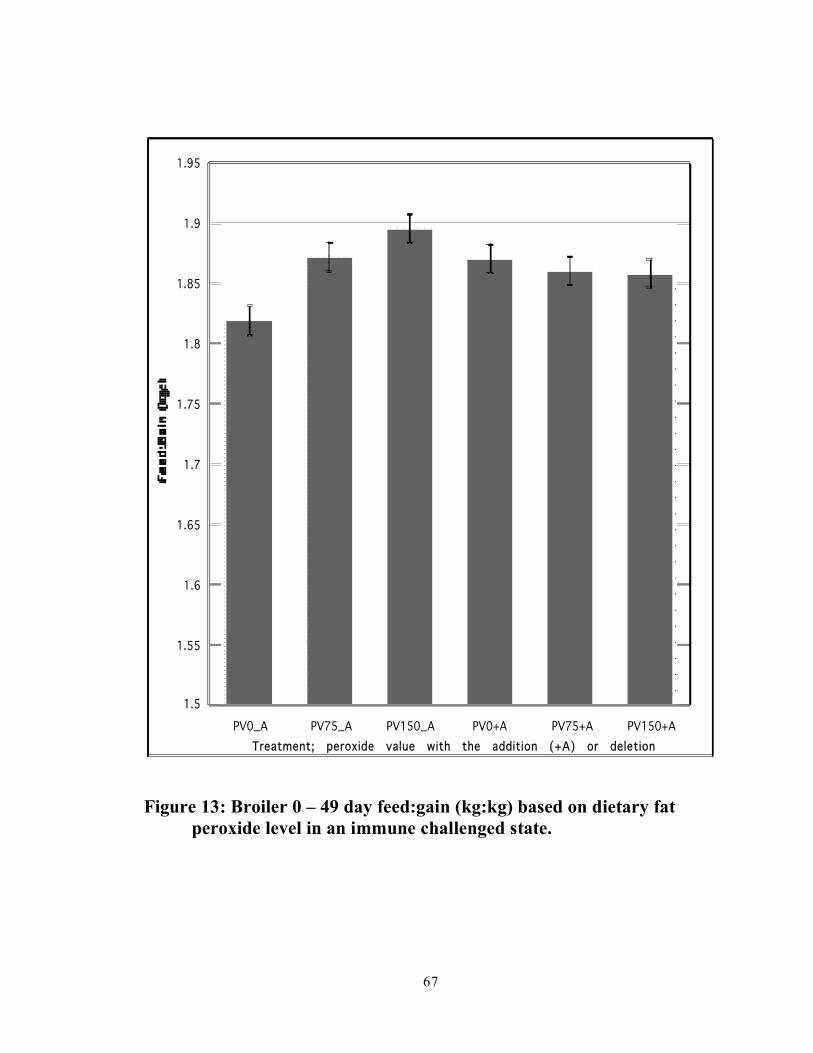
The data for feed conversion (F:G) are listed on Table 9. The F:G for
the 0 – 21 day period demonstrates that there was no significant difference
(P > 0.05) found among treatments. During the 21 – 35 day period the high
rancidity diet without the antioxidant, PV150−A, was significantly different
from the low rancidity diet containing the antioxidant, PV0+A. The four
other diets (PV0−A, PV75−A, PV75+A, and PV150+A) were not
significantly different from each other within the 21 – 35 day period.
For the period of 35 – 49 day there was no difference among the
PV75−A, PV0+A, and PV150+A treatments. The treatments PV0−A and
PV75+A were significantly different from the PV150−A treatment. For the
0 – 49 (Figure 13) day period the low rancidity level without the antioxidant,
PV0−A, was statistically different than the PV75−A, PV150−A, and PV0+A
treatments. The treatments with increased rancidity and the addition of an
antioxidant, PV75+A and PV150+A, were statistically similar to the four
other treatments.
55
The data for mortality are listed in Table 10. Mortality occurred
randomly throughout treatments at a consistently low level. There were no
significant differences among treatments even when exposed to an immune
challenge.
Processing attributes are summarized in Table 11. All of the
processing data were calculated as a percentage of chilled carcass weight.
There were no significant differences (P > 0.05) among treatments when
comparing percent yield, breast, major, minor, fat pad, leg, thigh, and wing.
Cecal examination revealed little indication of coccidiosis, although
signs of mild coccidiosis, such as occasional bloody droppings and ruffled
feathers, were seen in the birds near the end of the trial. Ceca were visually
scored on a scale from 1 – 4 based on occurrence and severity of ulcers,
lesions, hemorrhage and lining integrity, with a score of 1 denoting little or
no presence of clear indicators of coccidiosis and 4 denoting severe
indication of coccidiosis. Occasional, random occurrences of mild lesions in
the cecal lining were observed across treatments, but none so severe as to
receive a score above 1. Scores of 1 were assigned across all treatment
groups.
The current trial revealed no negative effects on weight gain caused
by either immune challenge or elevated peroxide values. Feed intake was
56
only depressed during the 21 – 35 day period, with the birds consuming the
PV75+A treatment consuming the least amount of feed (1.82 kg), and no
significant differences (P > 0.05) were seen for the overall 0 – 49 day period.
Feed conversion varied somewhat across periods of growth, immune status,
and peroxide values, although F:G for the 0-49 day period was significantly
improved (P < 0.05) in the non-antioxidant treatments for birds consuming
PV0 fat (PV0-A = 1.82 versus 1.87 and 1.89 for PV75-A and PV150-A,
respectively), indicating that PV did have an overall negative effect on feed
conversion and that antioxidant addition corrected that negative effect. No
differences were seen in processing data (P > 0.05).
Cecal examination did not reveal severe signs of coccidiosis even
though mild signs of the challenge were observed in the live birds, so it is
difficult from these data to draw any conclusion on the effects of fat
rancidity on birds with an immune challenge. It does not appear that diets
containing oxidized fat worsened immune function in birds challenged with
coccidiosis. It has been shown that the presence of unstabilized rancid fat in
the intestine increases the number of E. coli and decreases Lactobacilli
populations in the small intestine (Dibner, et al., 1995), and is known that
the free-radical mechanism of autoxidation leads to the formation of several
products that have been previously mentioned and that are known to be toxic
57
(Sanders, 1994) and may compromise immune function and cell wall
integrity (Sevanian and Peterson, 1986). The lack of research in this area
makes it apparent that additional investigation is needed.
CONCLUSIONS
The benefits of added fat in poultry diets are well established, and the
use of rendered fats in the United States is a common practice proven to be
safe and cost effective. In many other countries, there is a significant
potential market for rendered fats and fat-containing animal by-products,
especially as world population increases and demand rises for poultry meat
and eggs. However, fear of decreased quality due to oxidative rancidity and
the subsequent effects on performance and immunity may prevent utilization
of these fat sources.
Currently, very little research has been conducted on the effect of
feeding oxidized fats on immunity and bird health. While it seems that
excessive peroxide values of individual fats (greater than 100 meq/kg) may
cause performance problems, little evidence exists that fats with lower PVs
should be of concern. However, concern remains over the issue of oxidative
rancidity, the toxic secondary products of oxidative decomposition, and the
58
potential for compromised immune function that might result. These results
indicate that the inclusion of high peroxide value fats can cause a depression
in overall live performance parameters, especially feed conversion, but that
the addition of an antioxidant can improve performance in birds consuming
diets containing rancid fat. In the case of the second trial, birds also seemed
to overcome the immune challenge of the coccidiostat administered at higher
than recommended dose. Continued research is imperative in order to define
an acceptable level of rancidity and to determine if high levels of peroxide
values affect immune function.
59
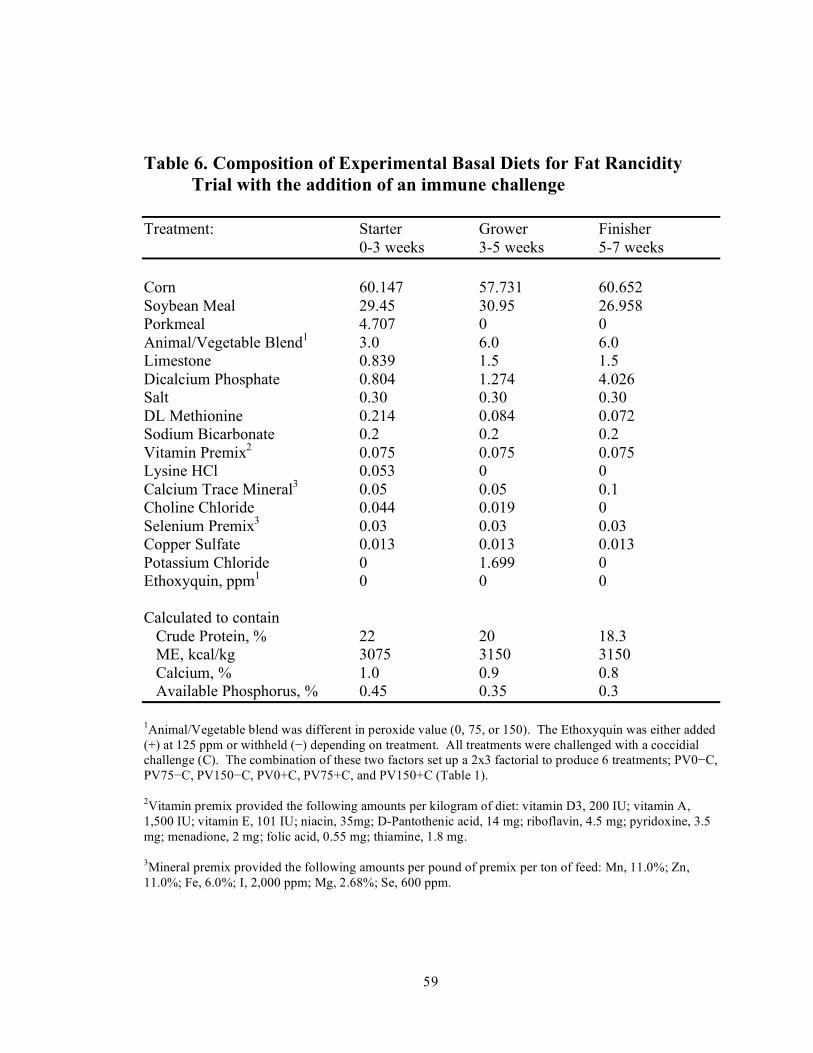
Table 6. Composition of Experimental Basal Diets for Fat Rancidity Trial with the addition of an immune challenge
Treatment: Starter Grower Finisher 0-3 weeks 3-5 weeks 5-7 weeks Corn 60.147 57.731 60.652 Soybean Meal 29.45 30.95 26.958 Porkmeal 4.707 0 0 Animal/Vegetable Blend1 3.0 6.0 6.0 Limestone 0.839 1.5 1.5 Dicalcium Phosphate 0.804 1.274 4.026 Salt 0.30 0.30 0.30 DL Methionine 0.214 0.084 0.072 Sodium Bicarbonate 0.2 0.2 0.2 Vitamin Premix2 0.075 0.075 0.075 Lysine HCl 0.053 0 0 Calcium Trace Mineral3 0.05 0.05 0.1 Choline Chloride 0.044 0.019 0 Selenium Premix3 0.03 0.03 0.03 Copper Sulfate 0.013 0.013 0.013 Potassium Chloride 0 1.699 0 Ethoxyquin, ppm1 0 0 0 Calculated to contain Crude Protein, % 22 20 18.3 ME, kcal/kg 3075 3150 3150 Calcium, % 1.0 0.9 0.8 Available Phosphorus, % 0.45 0.35 0.3 1Animal/Vegetable blend was different in peroxide value (0, 75, or 150). The Ethoxyquin was either added (+) at 125 ppm or withheld (−) depending on treatment. All treatments were challenged with a coccidial challenge (C). The combination of these two factors set up a 2x3 factorial to produce 6 treatments; PV0−C, PV75−C, PV150−C, PV0+C, PV75+C, and PV150+C (Table 1). 2Vitamin premix provided the following amounts per kilogram of diet: vitamin D3, 200 IU; vitamin A, 1,500 IU; vitamin E, 101 IU; niacin, 35mg; D-Pantothenic acid, 14 mg; riboflavin, 4.5 mg; pyridoxine, 3.5 mg; menadione, 2 mg; folic acid, 0.55 mg; thiamine, 1.8 mg. 3Mineral premix provided the following amounts per pound of premix per ton of feed: Mn, 11.0%; Zn, 11.0%; Fe, 6.0%; I, 2,000 ppm; Mg, 2.68%; Se, 600 ppm.
60
Table 7. Effects of Fat Rancidity Level when an antioxidant was added or excluded on Body Weight Gain on day 21, 35, 49, and 0 - 49 in the presence of an immune challenge
PV1 A2 0 – 21 days 21 – 35 days 35 – 49 days 0 – 49 days (kg) (kg) (kg) (kg) 0 -A 0.71a 1.10a 0.97a 2.86a 0 +A 0.75 a 1.07 a 0.95 a 2.84 a 75 -A 0.73 a 1.07 a 0.97 a 2.84 a 75 +A 0.72 a 1.05 a 0.99 a 2.79 a 150 -A 0.73 a 1.14 a 0.97 a 2.81 a 150 +A 0.74 a 1.08 a 1.01 a 2.84 a
Pooled SEM 0.008 0.029 0.041 0.032 Source of variation P-value PV 0.4885 0.2482 0.8276 0.6903 A 0.0927 0.0811 0.6630 0.6628 PV x A 0.0795 0.7375 0.7199 0.4927 Main effect mean PV 0 0.73 1.09 0.96 2.84
75 0.72 1.06 0.98 2.82
150 0.73 1.11 0.99 2.82
A -A 0.72 1.11 0.97 2.83 +A 0.73 1.06 0.98 2.82 1Peroxide Value (PV) 2Antioxidant (A) was either added (+A) at 125 ppm or withheld (-A) aValues within a column with no common superscript are significantly different (P < 0.05).
61
Table 8. Effects of Fat Rancidity Level when an antioxidant was added or excluded on Feed Intake on day 21, 35, 49, and 0 - 49 in the presence of an immune challenge
PV1 A2 0 – 21 days 21 – 35 days 35 – 49 days 0 – 49 days (kg) (kg) (kg) (kg) 0 -A 0.91a 1.87ab 2.48a 5.36a 0 +A 0.98 a 1.89 a 2.48 a 5.45 a 75 -A 0.98 a 1.89 a 2.52 a 5.49 a 75 +A 0.95 a 1.82 b 2.49 a 5.32 a 150 -A 0.96 a 1.87 ab 2.52 a 5.42 a 150 +A 0.99 a 1.86 ab 2.43 a 5.30 a
Pooled SEM 0.021 0.016 0.038 0.079 Source of variation P-value PV 0.4153 0.2772 0.6766 0.8142 A 0.2593 0.1284 0.1624 0.2965 PV x A 0.0860 0.0129 0.5038 0.2271 Main effect mean PV 0 0.95 1.88 2.48 5.40
75 0.96 1.86 2.50 5.40
150 0.97 1.87 2.47 5.36
A -A 0.95 1.88 2.50 5.42 +A 0.97 1.86 2.46 5.35 1Peroxide Value (PV) 2Antioxidant (A) was either added (+A) at 125 ppm or withheld (-A) abValues within a column with no common superscript are significantly different (P < 0.05).
62
Table 9. Effects of Fat Rancidity Level when an antioxidant was added or excluded on Feed Conversions on day 21, 35, 49, and 0 - 49 in the presence of an immune challenge
PV1 A2 0 – 21 days 21 – 35 days 35 – 49 days 0 – 49 days (kg:kg) (kg:kg) (kg:kg) (kg:kg) 0 -A 1.27a 1.68ab 2.37b 1.82b 0 +A 1.31a 1.77a 2.41ab 1.87a 75 -A 1.34a 1.75ab 2.41ab 1.87a 75 +A 1.32a 1.73ab 2.38b 1.86ab 150 -A 1.32a 1.67b 2.55a 1.89a 150 +A 1.33a 1.72ab 2.41ab 1.85ab
Pooled SEM 0.020 0.032 0.046 0.012 Source of variation P-value PV 0.1423 0.3733 0.1095 0.0322 A 0.4821 0.1116 0.2891 0.9319 PV x A 0.2569 0.0294 0.0419 0.0018 Main effect mean PV 0 1.29 1.73 2.39 1.85b
75 1.33 1.74 2.39 1.87a
150 1.32 1.69 2.47 1.88a
A -A 1.31 1.70 2.44 1.86 +A 1.32 1.74 2.40 1.86 1Peroxide Value (PV) 2Antioxidant (A) was either added (+A) at 125 ppm or withheld (-A) abValues within a column with no common superscript are significantly different (P < 0.05).
63
Table 10. Effects of Fat Rancidity Level when an antioxidant was added or excluded on Mortality for 0 - 49 days in the presence of an immune challenge
PV1 A2 Mortality (birds/pen) 0 -A 1.75a 0 +A 1.38a
75 -A 1.0a 75 +A 1.25a
150 -A 1.0a
150 +A 0.63a
Pooled SEM 0.021 Source of variation P-value PV 0.2809 A 0.2368 PV x A 0.9857 Main effect mean PV 0 1.5
75 1.19
150 0.8
A -A 1.38 +A 0.96 1Peroxide Value (PV) 2Antioxidant (A) was either added (+A) at 125 ppm or withheld (-A) aValues within a column with no common superscript are significantly different (P < 0.05).
64
Table 11. Effects of Fat Rancidity Level when an antioxidant was added or excluded on 0 – 49 day Broiler carcass traits bases on the percentage of chilled carcass weight in the presence of an immune challenge
Treatment Yield Breast Major Minor Fat Pad Leg Thigh Wing (%) (%) (%) (%) (%) (%) (%) (%) PV0−C 75.59 a 15.07a 12.22a 2.84a 2.42a 6.87a 8.14a 5.58a PV75−C 76.24a 15.29a 12.29a 2.99a 2.63a 6.82a 8.27a 5.71a PV150−C 74.22a 15.08a 12.16a 2.92a 2.18a 7.03a 8.07a 5.65a PV0+C 75.05a 15.09a 12.09a 2.99a 2.48a 6.92a 8.34a 5.51a PV75+C 75.48a 15.32a 12.26a 3.06a 2.65a 6.97a 8.20a 5.54a PV150+C 76.09a 14.84a 11.84a 2.99a 2.61a 6.82a 8.27a 5.74a Pooled SEM 0.641 0.232 0.182 0.09 0.129 0.111 0.129 0.119
aValues with differing letters are significantly (P < 0.05) different.
65
2
2.1
2.2
2.3
2.4
2.5
2.6
2.7
2.8
2.9
3
PV0_A PV75_A PV150_A PV0+A PV75+A PV150+ATreatment; peroxide value with the addition (+A) or deletion (_A) of an antioxidant
Figure 11: Broiler 0 – 49 day body weight gain (kg) based on dietary fat peroxide level in an immune challenged state.
66
4
4.2
4.4
4.6
4.8
5
5.2
5.4
5.6
5.8
PV0_A PV75_A PV150_A PV0+A PV75+A PV150+ATreatment; peroxide value with the addition (+A) or deletion (_A) of an antioxidant
Figure 12: Broiler 0 – 49 day feed intake (kg) based on dietary fat peroxide level in an immune challenged state.
67
1.5
1.55
1.6
1.65
1.7
1.75
1.8
1.85
1.9
1.95
PV0_A PV75_A PV150_A PV0+A PV75+A PV150+ATreatment; peroxide value with the addition (+A) or deletion (_A) of an antioxidant
Figure 13: Broiler 0 – 49 day feed:gain (kg:kg) based on dietary fat peroxide level in an immune challenged state.
68
APPENDIX A
Fat Preparation
1. Locate a 55-gallon metal barrel/drum.
2. Fill the metal barrel half full of animal/vegetable blended fat.
3. Fill the other half of the metal barrel with soy oil.
4. Take into consideration the space required to aerate the fat. Only fill the barrel approximately 5/6 full of fat. This will leave a space for aeration so the fat does not spill over the edge.
5. Place a barrel heat band on the barrel approximately three inches from the ground.
6. Set the heat band to warm the fat to approximately 135-140ºF.
7. Connect four ¼ inch aquarium air lines by using three ¼ inch air line “t” type connectors. Attach the air lines to an air compressor.
8. Attach metal washers (or another source of weight) to the end of the four air lines and insert them into the metal barrel.
9. Turn on the air compressor and adjust to 3 – 5 psi.
10. Test the peroxide value often until the desired level is achieved.
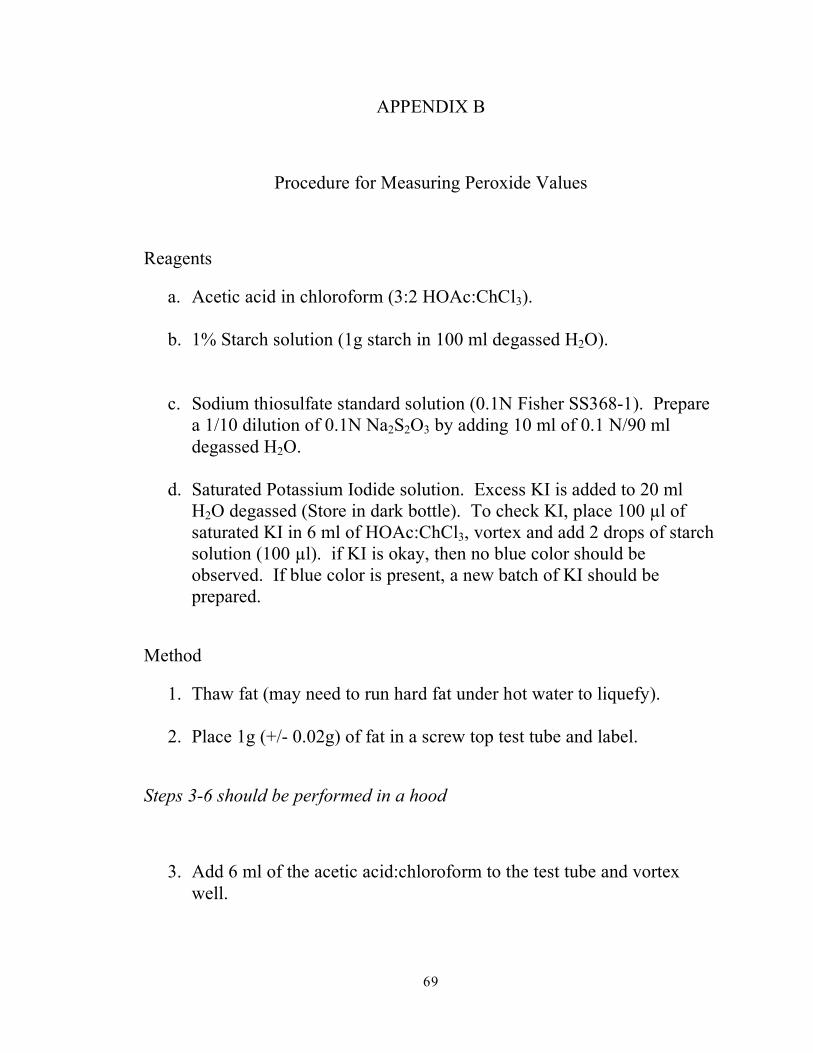
69
APPENDIX B
Procedure for Measuring Peroxide Values
Reagents
a. Acetic acid in chloroform (3:2 HOAc:ChCl3). b. 1% Starch solution (1g starch in 100 ml degassed H2O).
c. Sodium thiosulfate standard solution (0.1N Fisher SS368-1). Prepare
a 1/10 dilution of 0.1N Na2S2O3 by adding 10 ml of 0.1 N/90 ml degassed H2O.
d. Saturated Potassium Iodide solution. Excess KI is added to 20 ml
H2O degassed (Store in dark bottle). To check KI, place 100 µl of saturated KI in 6 ml of HOAc:ChCl3, vortex and add 2 drops of starch solution (100 µl). if KI is okay, then no blue color should be observed. If blue color is present, a new batch of KI should be prepared.
Method
1. Thaw fat (may need to run hard fat under hot water to liquefy). 2. Place 1g (+/- 0.02g) of fat in a screw top test tube and label.
Steps 3-6 should be performed in a hood
3. Add 6 ml of the acetic acid:chloroform to the test tube and vortex well.
70
4. Add 100 µl of KI remembering to prime pipette with some KI. For 1 minute vortex every fifteen seconds. (TIME IS CRITICAL)
5. After the 1 minute add 6 ml of degassed H2O to the test tube. Get all
samples to this point before proceeding. (Add H2O quickly) 6. Shake the starch solution well before using. Add 1.0 ml of starch to
the test tube and vortex.
7. A purple color forms between the two layers. Slowly add sodium
thiosulfate standard solution (0.1N) by increments of 100 µl. shake the test tube and let stand until settled. Keep adding sodium thiosulfate until the layer of granules no longer has any purple color to it. The second of the duplicates should be titrated more carefully with 0.1N and 0.01N Na2S2O3 to provide a more precise peroxide value (PV). The increments can be increased at first in fats known to have high peroxide values. The increments can also be decreased as the purple color is fading to get a closer estimate.
Calculations
Peroxide Value (PV)(mEqv/Kg sample) = (ml Na2S2O3)(xN)
Kg of sample
71
APPENDIX C
Weighing of Birds
1. Remove birds from feed 4 hours prior to weighing.
2. Use a functional scale that has the ability to weigh in the desired units (0.01 pounds).
3. Put a container or coop(s) on the scale to restrain the birds and press tare on the scale so the container’s weight is not included in the pen weight.
4. Place all of the birds from a single pen into the container(s) that is resting on the scale.
5. Include all of the containers that are figured into the tare weight whether they contain birds or not.
6. Wait until the scale has equilibrated and read the weight so it may be recorded on the weigh sheet.
7. Place the birds back into the assigned pen, and continue to the next pen.
72
APPENDIX D
Using JMP Statistical Analysis Software
1. Turn on the computer.
2. Click on the JMP icon of select JMP program under start menu.
3. Select new data table under the file menu.
4. Double click on the first column, and type in column heading; for example, average bird gain, intake, feed:gain, etc.
5. Double click on the first cell until a period appears.
6. Copy and paste data from Excel spreadsheet into the appropriate columns.
7. Select fit Y by X under the analyze menu.
8. Select parameters, dependent variable as Y-axis, independent variable as X-axis.
9. Select ok.
10. Click on the red triangle, which will pull down a list of options.
11. Select one-way ANOVA.
73
REFERENCES
Association of Official Analytical Chemists. 1982. Official Methods of the AOAC. Washington, DC.
Berger, K.G. 1994. Practical measures to minimize rancidity in processing and storage. Pp. 68-83 in: Rancidity in Foods. 3rd edition. J.C. Allen and R.J. Hamilton, eds. Chapman and Hall. London, UK.
Biely, J. and B. March. 1957. Fat studies in poultry. 7. Fat and nitrogen retention in chicks fed diets containing different levels of fat and protein. Poultry Sci. 36:1235-1240.
Bohnsack, C.R., R.H. Harms, W.D. Merkel and G.B. Russell. 2002. Performance of commercial layers when fed diets with four levels of corn oil or poultry fat. J. Appl. Poultry Res. 11:68-76.
Branion, H.D., A.F. Dawson, J.R. Cavers and I. Motzok. 1938. The alleged toxicity of free fatty acid and nitrogen in cod liver oil. Poultry Sci. 17:213-223.
Cabel, M.C., P.W. Waldroup, W.D. Shermer and D.F. Calabotta. 1988. Effects of ethoxyquin feed preservative and peroxide level on broiler performance. Poultry Sci. 67:7125-1730.
Carew, L.B. Jr., and F.W. Hill. 1964. Effect of corn oil on metabolic efficiency of energy utilization by chicks. J. Nutr. 83:293-299.
Carew, L.B. Jr., R.H. Machemer, Jr., R.W. Sharp and D.C. Foss. 1972. Fat absorption by the very young chick. Poultry Sci. 51:738-742.
Carpenter, K.J. and J.L. L’Estrange. 1966. Effects of moderate levels of oxidized fat in animal diets under controlled conditions. Proc. Nutr. Soc. 25(1):25-31.
Cheeke, P.R. 2005. Applied Animal Nutrition: Feeds and Feeding. 3rd Ed. Pearson Education, Inc. Upper Saddle River, New Jersey.

74
Church, D.C. 1991. High Energy Feedstuffs. In: Livestock Feeds and Feeding. 3rd Ed. D.C. Church, Ed. Prentice Hall. Englewood Cliffs, New Jersey.
Coppen, P.P. 1994. The use of antioxidants. Pp. 84-103 in: Rancidity in Foods. 3rd edition. J.C. Allen and R.J. Hamilton, eds. Chapman and Hall. London, UK.
Dale, N.M. and H.L. Fuller. 1978. Effect of ambient temperature and dietary fat on feed preference of broilers. Poultry Sci. 57:1635-1640.
Dale, N.M. and H.L. Fuller. 1980. Effect of diet composition on feed intake and growth of chicks under heat stress. II. Constant vs. cycling temperatures. Poultry Sci. 59:1434-1441.
De Groote, G., N. Reyntens and J. Amich-Gali. 1971. Fat Studies. 2. The metabolic efficiency of energy utilization of glucose, soybean oil, and different animal fats by growing chicks. Poultry Sci. 50:808-819.
Dibner, J.J., C.A. Atwell, M.L. Kitchell and W.D. Shermer. 1996. Feeding of oxidized fats to broilers and swine – effects of enterocyte turnover, hepatocyte proliferation and gut associated lymphoid tissue. Anim. Feed Sci. Technol. 62(1):1-13.
Donaldson, W.E. and C.D. Gordon. 1960. The effect of 3% added animal fat on laying hen performance. Poultry Sci. 39:583-587.
Dozier, W.A. III. 2003. How well do you know your fat? The University of Georgia College of Agriculture and Environmental Sciences. Popular Press Article. http://www.cpes.peachnet.edu/poultry/oxidation.pdf.
Economic Research Service/USDA website. 2001. Patterns of world poultry consumption and production. Downloaded on 2/22/2009. www.ers.usda.gov/publications/WRS03/dec03/wrs0302/wrs0302b.pdf.
Enberg, R.M., C. Lauridsen, S.K. Jensen and K. Jakobsen. 1996. Inclusion of oxidized vegetable oil in broiler diets: Its influence on nutrient
75
balance and on the antioxidative status of broilers. Poultry Sci. 75(8):1003-1011.
Fedde, M.R., P.E. Waibel and R.E. Burger. 1960. Factors affecting the absorbability of certain dietary fats in the chick. J. Nutr. 70:447-452.
Firestone, D. 1968. A review of methods for determining pesticide residues, contaminants and adulterants in fats and oils. J. Am. Oil Chemists’ Soc. 45:210A-249A.
Firman, J.D. and J.C. Remus. 1994. Fat additions increase digestibility of meat and bone meal. J. Appl. Poultry Res. 3:80-82.
Firman, J.D. 1995. Protein and energy utilization by the turkey. Proceedings of the “Maximizing profits for the poultry and swine industries” conference, Cincinnati, OH, Griffin Industries.
Firman, J.D. 2006. Rendered Products in Poultry Nutrition. Pp. 125-139 in: Essential Rendering: All About the Animal By-Products Industry. Ed. D.L. Meeker. National Renderers Association. Kirby Lithographic Company, Inc. Arlington, VA.
Firman, J.D., A. Kamyab and H. Leigh. 2008. Comparison of fat sources in rations of broilers from hatch to market. Intl. J. Poultry Sci. 7(12):1152-1155.
Fuller, H.L. 1996. Utilizing rendered products: Poultry. Pp. 107-126 in: The Original Recyclers. D.A. Franco and W. Swanson, eds. Assoc. Am. Feed Control Off. Oxford, IN.
Fuller, H.L. and M. Rendon. 1977. Energetic efficiency of different dietary fats for growth of young chicks. Poultry Sci. 56:549-557.
Fuller, H.L. and M. Rendon. 1979. Energetic efficiency of corn oil and poultry fat at different levels on broiler diets. Poultry Sci. 58:1234-1238.
76
Galliard, T. 1994. Rancidity in cereal products. Pp. 141-159 in: Rancidity in Foods. 3rd edition. J.C. Allen and R.J. Hamilton, eds. Chapman and Hall. London, UK.
Gray, R.E. and H.E. Robinson. 1941. Free fatty acids and rancidity in relation to animal by-product protein concentrates. Poultry Sci. 20:36-41.
Grettie, D.P. and R.C. Newton. 1931. Susceptibility of fats to oxidative rancidity: A method of measuring the rate of formation of oxidative decomposition products in fats and oils. J. Am. Oil Chemists’ Soc. 8(8):291-294.
Hamilton, R.J. 1994. The chemistry of rancidity in foods. Pp. 1-21 in: Rancidity in Foods. 3rd edition. J.C. Allen and R.J. Hamilton, eds. Chapman and Hall. London, UK.
Horani, F. and J.L. Sell. 1977. Effect of feed grade animal fat on laying hen performance and on metabolizable energy of rations. Poultry Sci. 56:1972-1980.
Inoue, T., A. Kurashige, T. Minetoma, and F. Shigyo. 1984. Nutritional effect of oxidized soybean oil in broiler diets. Pp. 368-369 in: World’s Poultry Congress XVII. Helsinki, Finland.
Isika, M.A., E.A. Agiang and B.I. Okon. 2006. Palm oil and animal fats for increasing dietary energy in rearing pullets. Intl. J. Poultry Sci. 5(1):43-46.
Jensen, L.S., G.W. Schumaier and J.D. Latshaw. 1970. “Extra caloric” effect of dietary fat for developing turkeys as influenced by calorie-protein ratio. Poultry Sci. 49:1697-1704.
Lea, C.H., L.J. Parr, J.L. L’Estrange and K.J. Carpenter. 1966. Nutritional effects of autoxidized fats in animal diets. 3. The growth of turkeys on diets containing oxidized fish oil. Br. J. Nutr. 20:123-132.
Leeson, S. and J.O. Atteh. 1995. Utilization of fats and fatty acids by turkey poults. Poultry Sci. 74:2003-2010.
77
Leeson, S., A.K. Zubair, E.J. Squires and C. Forsberg. 1997. Influence of dietary levels of fat, fiber, and copper sulfate and fat rancidity on cecal activity in the growing turkey. Poultry Sci. 76:59-66.
Lewis, D. and C.G. Payne. 1963. Fats and amino acids in broiler rations. 3. Supplementation with different levels and types of fat. Br. Poultry Sci. 4:13-18.
Lin, C.F., A. Asghar, J.I. Gray, D.J. Buckley, A.M. Booren, R.L. Crackel and C.J. Flegal. 1989. Effects of oxidized dietary oil and antioxidant supplementation on broiler growth and meat stability. Br. Poultry Sci. 30:855-864.
L’Estrange, J.L., K.J. Carpenter, C.H. Lea and L.J. Parr. 1966. Nutritional effects of autoxidized fats in animal diets. 2. Beef fat in the diet of broiler chicks. Br. J. Nutr. 20:113-121.
March, B. and J. Biely. 1957. Fat studies in poultry. 6. Utilization of fats of different melting points. Poultry Sci. 36:71-75.
Mateos, G.G. and J.L. Sell. 1981. Nature of the extrametabolic effect of supplemental fat used in semipurified diets for laying hens. Poultry Sci. 60:1925.
Mattill, H.A. 1947. Antioxidants. Annu. Rev. Biochem. 16:177-192.
National Research Council. 1994. Nutrient Requirements of Poultry. 9th Rev. Ed. National Academy Press, Washington, D.C.
Nelson, D.L. and M.M. Cox. 2008. Principles of Biochemistry. 5th Ed. W.H. Freeman and Company. New York, NY.
Njobeh, P.B., P.A. Iji and I.V. Nsahlai. 2006. Influence of composition and storage conditions on the concentrations of free fatty acids and peroxides in broiler diets. Intl. J. Poultry Sci. 5(3):279-283.
Oertel, M.L. and W. Hartfiel. 1982. Effect of fresh and oxidized fats/oils and of pro- and antioxidants on the growth of broiler chicks. Arch. Geflugelkd. 46:13-19.
78
Pearl, G.G. 2004. Rendering 101: Raw material, rendering process, and animal by-products. Render, August 2004. Pp. 30.
Pesti, G.M., R.I. Bakalli, M. Qiao and K.G. Sterling. 2002. A comparison of eight grades of fat as broiler feed ingredients. Poultry Sci. 81:382-390.
Reid, B.L. and C.W. Weber. 1975. Supplemental dietary fat and laying hen performance. Poultry Sci. 54:422-428.
Renner, R. and F.W. Hill. 1960. The utilization of corn oil, lard and tallow by chickens of various ages. Poultry Sci. 39:849-854.
Renner, R. and F.W. Hill. 1961. Utilization of fatty acids by the chicken. J. Nutr. 74:259-264.
Rossell, J.B. 1994. Measurement of rancidity. Pp. 22-53 in: Rancidity in Foods. 3rd edition. J.C. Allen and R.J. Hamilton, eds. Chapman and Hall. London, UK.
Rumsey, G.L. 1978. Antioxidants in compounded feeds. In: Fish Feed Technology. Lectures presented at the FAO/UNDP training course in Fish College of Fisheries, University of Washington. Seattle, Washington. October 9 – December 15. http://www.fao.org/docrep/X5738E/x5738e0b.htm#chapter%2010.%20antioxidants%20in%20compounded%20feeds
Salmon, R.E. and J.B. O’Neil. 1971. The effect of the level and source of dietary fat on the growth, feed efficiency, grade and carcass composition of turkeys. Poultry Sci. 50(5):1456-1467.
Sanders, T.A.B. Nutritional aspects of rancidity. Pp. 128-140 in: Rancidity in Foods. 3rd edition. J.C. Allen and R.J. Hamilton, eds. Chapman and Hall. London, UK.
Sell, J.L., J.A. Eastwood and G.G. Mateos. 1983. Influence of supplemental fat on diet metabolizable energy and ingesta transit time in laying hens. Nutr. Rep. Int. 28:487.
79
Sell, J.L., A. Krogdahl and N. Hanyu. 1986. Influence of age on utilization of supplemental fats by young turkeys. Poultry Sci. 65:546-554.
Sevanian, A. and A.R. Peterson. 1986. The cytotoxic and mutagenic properties of cholesterol oxidation products. Food Chem. Toxicol. 24(10-11):1103-1110.
Shermer, W.D. and D.F. Calabotta. 1985. Oxidation of feed: How much has occurred. Feedstuffs Nov. 4:19-20.
Shermer, W.D. and A.F. Giesen. 1997. Quality control methods to monitor oxidative status of fats: What do fat tests tell you? Feed Management 48(5).
Sibbald, I.R., S.J. Slinger and G.C. Ashton. 1961. Factors affecting the metabolizable energy content of poultry feeds. Poultry Sci. 40:303-308.
Siedler, A.J., H.E. Scheid and B.S. Schweigert. 1955. Effects of different grades of animal fats on the performance of chicks. Poultry Sci. 34:411-414.
Talbot, G. 2004. When good taste goes bad. Intl. Food Ing. 3:23-25.
Treat, C.M., B.L. Reid, R.E. Davies and J.R. Couch. 1960. Effect of animal fat and mixtures of animal and vegetable fats containing varying amounts of free fatty acids on performance of cage layers. Poultry Sci. 39:1550-1555.
Waldroup, P.W., C.R. Douglas, J.T. McCall and R.H. Harms. 1960. The effects of Santoquin on the performance of broilers. Poultry Sci. 39:1313-1317.
Waldroup, P.W., S.E. Watkins and E.A. Saleh. 1995. Comparison of two blended animal-vegetable fats having low or high free fatty acid content. J. Appl. Poultry Res. 4:41-48.
80
Wiseman, J. and F. Salvador. 1991. The influence of free fatty acid content and degree of saturation on the apparent metabolizable energy value of fats fed to broilers. Poultry Sci. 70:573-582.
Young, R.J. 1961. The energy value of fats and fatty acids for chicks. I. Metabolizable energy. Poultry Sci. 40:1225-1233.
Young, R.J., R.L. Garret and M, Griffith. 1963. Factors affecting the absorbability of fatty acid mixtures high in saturated fatty acids. Poultry Sci. 42:1146-1154.
Ziggers, D. 2005. Oils and fats indispensable in feed. Feed Tech 9(3):16-19.
Zumbado, M.E., C.W. Scheele and C. Kwakernaak. 1999. Chemical composition, digestibility, and metabolizable energy content of different fat and oil by-products. J. Appl. Poultry Res. 8:263-271.