Embed Size (px)
Citation preview

Effect of heat treatment and iron content on the microstructure and mechanical
properties of a secondary Al-Si-Cu alloy
Dissertation zur Erlangung des akademischen Grades
Doktor der Ingenieurwissenschaften (Dr.-Ing.)
Vorgelegt im Fachbereich Maschinenbau
der Universität Kassel
Von Ing. Ind. Inigo Bacaicoa
Tag der mündlichen Prüfung: 11.07.2019
1. Gutachter: Prof. Dr. rer. nat. Angelika Brückner-Foit
2. Gutachter: Prof. Dr.-Ing. Martin Fehlbier
Kassel im Mai 2019

I
Because it is she that I have listened to, when she grumbled, or boasted, or even sometimes when she said nothing. Because she is my rose.
Antoine de Saint-Exupéry, The Little Prince (1943)
II
Acknowledgement
The present work has been carried out during my activity as research assistant at the Division of Quality and Reliability, Institute of Materials Engineering, University of Kassel. I would like to thank all the staff of the Institute for Materials Engineering for their help and friendly work.
I would like to specially thank Prof. Brückner-Foit for giving me the opportunity to work in the Institute under her guidance and supervision. I am particularly grateful for her support and advice during my stay in the Institute. I would like to thank her for the trust she placed in allowing me to independently design experiments, conduct laboratory work, discuss results and present them at international conferences. She also always provided the support I required to come up with new ideas and to discuss the results, promoting the gain in knowledge. I also thank Prof. Felhbier from the Institute for Foundry-Technology for his supervision of the doctoral thesis as well as the excellent cooperative work with his team in the field of casting process.
I would like to thank the Hessen State Ministry of Higher Education, Research and the Arts - Initiative for the Development of Scientific and Economic Excellence (LOEWE) for the financial support of the research project “Safer Materials”. In this context, I would also like to thank Prof. Heim and Dr. Feldmann for the coordination of the research project and the cooperation to fulfill the project goals.
I would like to extend my thanks to my colleagues in the working group Martin Lütje, Frank Zeismann, Christoph Skotarek, Jens von Schumann, Marcel Wicke, John Steger, Stephanie Möller, Sascha Horn and Tim Ickler, with whom I learnt a lot over the years, not only about materials engineering. I thank them all for their support and friendship.
Finally, I would like to thank my family for their constant support and encouragement.
Inigo Bacaicoa
III
Erklärung
Hiermit versichere ich, dass ich die vorliegende Dissertation selbständig, ohne unerlaubte Hilfe Dritter angefertigt und andere als die in der Dissertation angegebenen Hilfsmittel nicht benutzt habe. Alle Stellen, die wörtlich oder sinngemäß aus veröffentlichten oder unveröffentlichten Schriften entnommen sind, habe ich als solche kenntlich gemacht. Dritte waren an der inhaltlichen Erstellung der Dissertation nicht beteiligt; insbesondere habe ich nicht die Hilfe eines kommerziellen Promotionsberaters in Anspruch genommen. Kein Teil dieser Arbeit ist in einem Promotions- oder Habilitationsverfahren durch mich verwendet worden.
Kassel, den 11.07.2019
Inigo Bacaicoa
IV
Abstract
In this work the effect of heat treatments on the microstructure and mechanical properties of a secondary Al-Si-Cu alloy is studied. A Design of Experiments (DoE) was developed in order to optimize the heat treatment parameters and analyze the dissolution and fragmentation of the iron-rich inclusions as well as the improvement of the mechanical properties by non-equilibrium heat treatments. The iron-rich intermetallic inclusions were characterized as-cast and after heat treatment both by two-dimensional metallography and three-dimensional computed-tomography. The results of the microstructural characterization were statistically analyzed and comparison between the two-dimensional and the three-dimensional analysis established with the aim of determining the accuracy of the classic two-dimensional microstructural analysis. The three-dimensional characterization of defects served as base for the analysis of the interaction between defects, especially between iron-rich inclusions and pores. Fatigue tests were performed with the objective of studying the effect of iron-rich inclusions on the fatigue behavior of the secondary alloy. The fracture surfaces of the post-mortem fatigue specimens were analyzed by micro computed-tomography and scanning electron microscopy. The effect of the iron content on the microstructural and mechanical properties was studied with as-cast alloy and under the effect of non-equilibrium heat treatment in order to study the effect of these inclusions on the fracture behavior of the material. The three-dimensional reconstructions enabled to determine the interaction between defects and the cross sectional fracture surfaces were analyzed by scanning electron microscopy with the aim of analyzing the influence of these inclusions on the crack propagation mechanism in secondary cast Al-Si-Cu alloy.

V
Kurzfassung
In dieser Arbeit wird der Einfluss von Wärmebehandlung auf die Mikrostruktur und die mechanischen Eigenschaften einer sekundären Al-Si-Cu-Legierung untersucht. Ein statistischer Versuchsplan wurde entwickelt, um sowohl die Verbesserung der mechanischen Eigenschaften durch Nichtgleichgewichtigswärmebehandlungen zu optimieren als auch die Auflösung und Fragmentierung der eisenreichen Einschlüsse zu analysieren. Die eisenreichen intermetallischen Einschlüsse wurden im Gusszustand und nach Wärmebehandlung durch zweidimensionale Metallographie und dreidimensionale Computertomographie charakterisiert. Die Ergebnisse der mikrostrukturellen Charakterisierung wurden statistisch analysiert und ein Vergleich zwischen der zweidimensionalen und der dreidimensionalen Analyse durchgeführt. Die dreidimensionale Charakterisierung von Defekten diente als Grundlage für die Analyse der Wechselwirkung zwischen Defekten, insbesondere zwischen eisenreichen Einschlüssen und Poren. Ermüdungstests wurden mit gegossenen und wärmebehandelten Proben durchgeführt, um die Wirkung eisenreicher Einschlüsse auf das Ermüdungsverhalten der Sekundärlegierung zu untersuchen. Die Bruchflächen der Ermüdungsproben wurden mit der Mikro-Computertomographie und der Rasterelektronenmikroskopie analysiert. Die Auswirkung des Eisengehalts auf die mikrostrukturellen und mechanischen Eigenschaften wurde im Gusszustand und unter der Wirkung einer Wärmebehandlung untersucht. Die dreidimensionalen Rekonstruktionen, mit denen die Wechselwirkung zwischen Defekten und den Querschnittsbruchflächen bestimmt werden konnte, wurden durch Rasterelektronenmikroskopie analysiert, um den Einfluss dieser Einschlüsse auf den Rissausbreitungsmechanismus in der Al-Si-Cu-Legierung aus Sekundärguss zu analysieren.

VI
Table of Content
1 Introduction ............................................................................................................ 1
1.1 Background ....................................................................................................................... 2
1.2 Objectives ......................................................................................................................... 5
1.3 Structure of the Thesis ...................................................................................................... 6
2 Literature Review ................................................................................................... 7
2.1 Al-Si-Cu alloys ................................................................................................................. 8
2.2 Secondary Al-Si alloys ................................................................................................... 11
2.3 Casting process ............................................................................................................... 12 2.3.1 Sand casting .......................................................................................................................... 12 2.3.2 Die casting ............................................................................................................................ 12 2.3.3 High Pressure Die Casting .................................................................................................... 13
2.4 Microstructure ................................................................................................................ 18 2.4.1 Eutectic Silicon ..................................................................................................................... 18 2.4.2 Iron-rich intermetallic inclusions ......................................................................................... 19 2.4.3 Copper-rich phases ............................................................................................................... 20
2.5 Heat treatments ............................................................................................................... 22
2.6 Three-dimensional microstructure characterization ....................................................... 24
3 Material and experimental methods .................................................................. 27
3.1 Material ........................................................................................................................... 28
3.2 Casting process ............................................................................................................... 30
3.3 Heat treatment characterization ...................................................................................... 38
3.4 Microstructure characterization methods ....................................................................... 43 3.4.1 Optical microscopy ............................................................................................................... 44 3.4.2 Scanning electron microscopy (SEM) .................................................................................. 44 3.4.3 X-ray tomography (µ-CT) .................................................................................................... 45 3.4.4 3D segmentation ................................................................................................................... 47 3.4.5 FE simulation ....................................................................................................................... 47
4 Effect of non-equilibrium heat treatments on microstructure and tensile properties of an Al-Si-Cu alloy .................................................................................. 49
4.1 Influence of heat treatment on microstructure ................................................................ 51
4.2 Influence of heat-treatment on mechanical properties ................................................... 59
4.3 Fracture surface analysis ................................................................................................ 62
4.4 Discussion ....................................................................................................................... 66
4.5 Conclusions .................................................................................................................... 67

VII
5 Characterization of the ß-Al5FeSi inclusions in a Fe-rich Al-Si-Cu alloy by X-ray tomography and Finite Element analysis ........................................................... 68
5.1 3D morphology of the ß-Al5FeSi inclusions .................................................................. 69
5.2 Influence of the ß-Al5FeSi inclusions on pores .............................................................. 74
5.3 Influence of heat treatment on the 3D morphology ß-Al5FeSi inclusions ..................... 78
5.4 Simulation of the influence of the 3D morphology of the ß-Al5FeSi inclusions on the stress concentration factors ................................................................................................... 82
5.5 Comparative investigation between two-dimensional imaging methods and X-ray tomography in the characterization of the ß-Al5FeSi inclusions .......................................... 85
5.6 Discussion ....................................................................................................................... 90
5.7 Conclusions .................................................................................................................... 92
6 Three-dimensional characterization of the fracture mechanisms of a Fe-rich Al-Si-Cu alloy .................................................................................................................... 93
6.1 Tensile tests .................................................................................................................... 94 6.1.1 Effect of the ß-Al5FeSi inclusions on the damage evolution under tensile loading ............. 94 6.1.2 Effect of iron content under tensile loading ......................................................................... 96
6.2 Fatigue tests .................................................................................................................. 103 6.2.1 Fatigue behavior and damage mechanisms in the standard alloy ....................................... 103 6.2.2 Increased iron content......................................................................................................... 107
6.3 Discussion ..................................................................................................................... 119
6.4 Conclusions .................................................................................................................. 120
Summary .................................................................................................................... 121
References .................................................................................................................. 123
Appendix 1 List of publications ............................................................................... 136


Introduction 1
1 Introduction
2 Introduction
1.1 Background
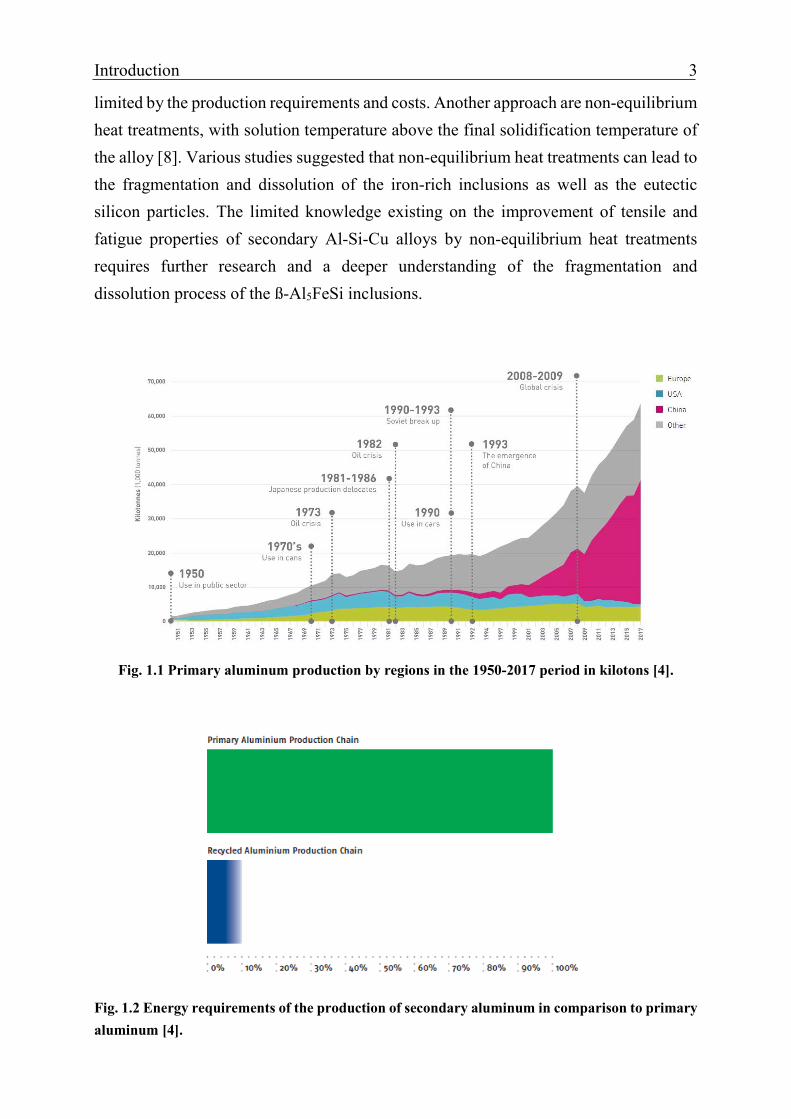
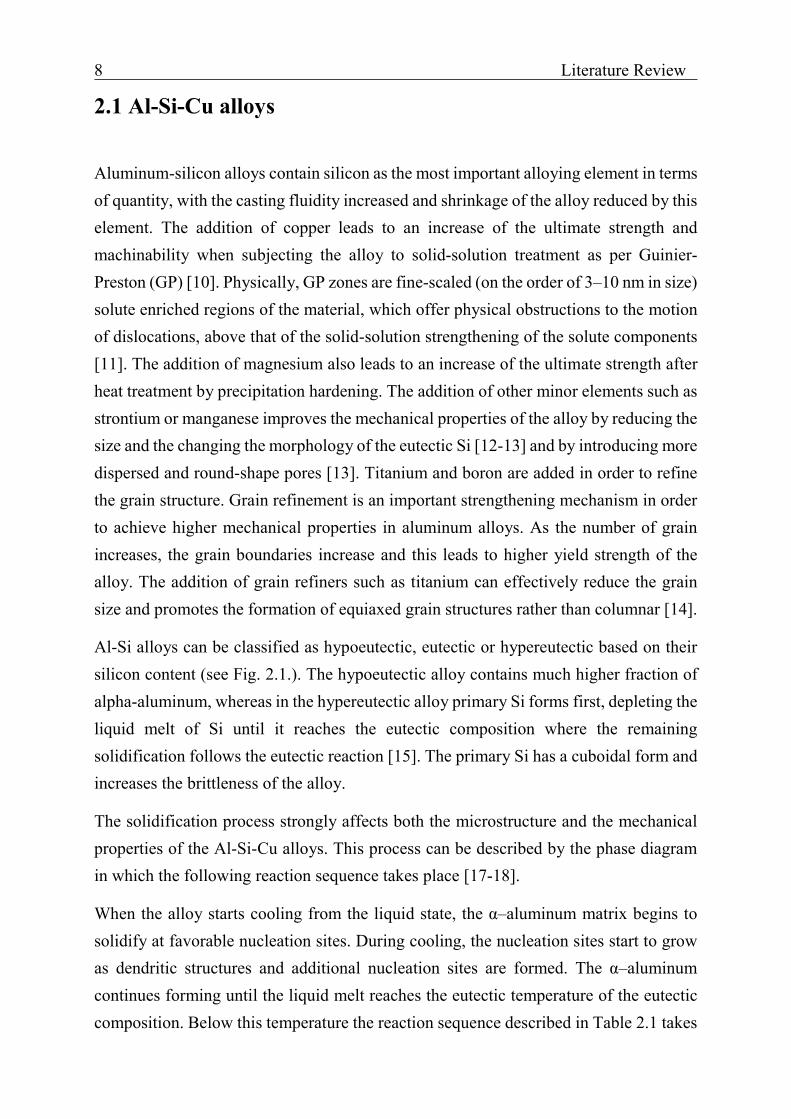
Cast aluminum alloys are one of the most important alloys in the automotive industry due to the combination of good mechanical properties, castabilility, resistance-to-weight ratio and recycling possibilities [1]. Cast aluminum alloys are essential in modern lightweight vehicles and currently used for a wide range of components, such as engine blocks, cylinder heads and chassis components [2]. The increasing demand for aluminum-based products (see Fig. 1.1) together with a higher environmental concern has led in recent years to an increase in the use of aluminum scrap for the production of aluminum alloys [3]. Secondary aluminum alloys, which are made of a mixture of primary aluminum and recycled aluminum, enable to decrease the environmental impact of the high energy-demanding aluminum production and to reduce the production costs associated to the large-scale use of aluminum. The advantages associated with the use of secondary aluminum include the reduction of CO2 emissions as well as decreasing production costs and optimizing the life-cycle of resources [4]. As a matter of fact, secondary aluminum produced from recycled metal requires about 2.8 KWh/kg whereas primary aluminum requires 45 KWh/kg (see Fig. 1.2). EU still imports approximately 50 per cent of its aluminum ingots. Environmental requirements on the domestic production is fulfilled through the continuous increase of recycled production. Moreover, in 2017 EU exported around 906,000 tons of aluminum scrap, what means that EU is a net exporter of aluminum scrap.
Between 85% and 90% of the aluminum cast parts used in the automotive industry are made of Al-Si alloys. Particularly, the secondary Al-Si-Cu system has gained importance as a result of its good properties and recyclability. Nevertheless, the accumulated elements in the aluminum scrap reduce the mechanical properties of the alloy and this limits the use in high-performance application, where reliability has to be ensured. Different methods have been developed in order to remove the accumulated elements, but these methods are usually associated with very high costs [5]. In this sense, iron has a particular negative effect since it promotes the formation of brittle intermetallic inclusions that reduce the ductility and strength of the alloy.
Different approaches have been proposed in order to avoid the iron-rich intermetallic inclusions, such as the increase of the cooling rate in the casting process or the addition of elements such as strontium or manganese [6-7]. However, these approaches are
Introduction 3
limited by the production requirements and costs. Another approach are non-equilibrium heat treatments, with solution temperature above the final solidification temperature of the alloy [8]. Various studies suggested that non-equilibrium heat treatments can lead to the fragmentation and dissolution of the iron-rich inclusions as well as the eutectic silicon particles. The limited knowledge existing on the improvement of tensile and fatigue properties of secondary Al-Si-Cu alloys by non-equilibrium heat treatments requires further research and a deeper understanding of the fragmentation and dissolution process of the ß-Al5FeSi inclusions.
Fig. 1.1 Primary aluminum production by regions in the 1950-2017 period in kilotons [4].
Fig. 1.2 Energy requirements of the production of secondary aluminum in comparison to primary aluminum [4].

4 Introduction
X-ray tomography has emerged recently and has proved to have an extraordinary capability to provide 3D images of the microstructure of materials [9]. High resolution computed-tomography is especially well adapted for aluminum alloys due to their low mass attenuation coefficient.
This enables the three-dimensional analysis of the size and morphology of the iron-rich compounds in order to accurately characterize these inclusions, as the 2D analysis of polished metallographic pictures may not be able to accurately quantify these phases due to their complex morphology. Moreover, the data obtained from micro computed-tomography can be imported into FE software for the analysis of the stress concentrations for different morphologies and establish quality parameters for this alloy.
Furthermore, the fracture behavior of the detrimental iron-rich inclusions and their influence on the tensile and fatigue fracture mechanism should be studied in order to ensure the reliability of automotive structural parts manufactured by secondary aluminum alloys. An in-depth knowledge of the behavior of these inclusions under static and cyclic stress is required for microstructure-based fracture simulation models.
The interaction of the iron-rich inclusions with other relevant defects such as shrinkage and gas pores is also relevant in this context. The effect of iron can be analyzed by systematically varying the iron content of the cast Al-Si alloy and relating the damage mechanism to the three-dimensional morphology and size of the defect structures obtained by computed tomography and scanning electron microscope.

Introduction 5
1.2 Objectives
The main goal of this work is to study the effect of heat treatments on the microstructure and mechanical properties of a secondary Al-Si-Cu alloy. A Design of Experiments (DoE) was developed in order to optimize the heat treatment parameters and analyze the dissolution and fragmentation of the iron-rich inclusions as well as the improvement of the mechanical properties by non-equilibrium heat treatments. The iron-rich intermetallic inclusions were characterized as-cast and after heat treatment both by two-dimensional metallography and three-dimensional computed-tomography. The results of the microstructural characterization were statistically analyzed and comparison between the two-dimensional and the three-dimensional analysis established with the aim of determining the accuracy of the classic two-dimensional microstructural analysis. Moreover, the three-dimensional reconstructions of the iron-rich inclusions were imported to a Finite Element software in order to determine the influence of the morphology on the stress concentration factors of the iron-rich inclusions. This enabled to compare the effect of the iron-rich compounds with other microstructural features such as pores and Cu-rich phases. The three-dimensional characterization of defects served as base for the analysis of the interaction between defects, especially between iron-rich inclusions and pores. Fatigue tests were performed with as-cast and heat-treated specimens with the objective of studying the effect of iron-rich inclusions on the fatigue behavior of the secondary alloy. The fracture surfaces of the post-mortem fatigue specimens were analyzed by micro computed-tomography and scanning electron microscopy.
In a second stage of the work, the effect of the iron content on the microstructural and mechanical properties was studied with the as-cast alloy and under the effect of non-equilibrium heat treatment. The iron content was systematically varied and specimens with different iron content were cast under real casting conditions. The iron-rich intermetallic inclusions were characterized by micro computed tomography for different iron contents and both tensile and fatigue tests performed in order to study the effect of these inclusions on the fracture behavior of the material. The three-dimensional reconstructions enabled to determine the interaction between defects and the cross sectional fracture surfaces were analyzed by scanning electron microscopy in order to analyze the influence of these inclusions on the crack propagation mechanism in secondary cast Al-Si-Cu alloy.

6 Introduction
1.3 Structure of the Thesis
The work is structured in five chapters: first, Chapter 2 contains literature review, in which information regarding the studied alloy and the main phases as well as the casting process and heat treatment is briefly presented. Chapter 3 is Experimental Methods, and it summaries the experimental procedures and techniques employed in this work. Chapter 4 presents the results of the study of the effect of heat treatments on the microstructure and mechanical properties of secondary Al-Si-Cu alloy. This includes both the optimization of non-equilibrium heat treatment in terms of microstructure and mechanical properties together with the analysis of the damage behavior under tensile loading. Chapter 5 focuses on the three-dimensional characterization of the iron-rich inclusions by micro computed-tomography and the comparison with two-dimensional metallography. Chapter 6 presents the effect of the iron content on the microstructure and mechanical properties, with special focus on the interaction between defects and shows the results of the influence of the iron-rich inclusions on the crack propagation mechanism during fatigue loading. Finally, the main conclusions and future perspectives are presented and the discussion is extended.

Literature Review 7
2 Literature Review
8 Literature Review
2.1 Al-Si-Cu alloys
Aluminum-silicon alloys contain silicon as the most important alloying element in terms of quantity, with the casting fluidity increased and shrinkage of the alloy reduced by this element. The addition of copper leads to an increase of the ultimate strength and machinability when subjecting the alloy to solid-solution treatment as per Guinier-Preston (GP) [10]. Physically, GP zones are fine-scaled (on the order of 3–10 nm in size) solute enriched regions of the material, which offer physical obstructions to the motion of dislocations, above that of the solid-solution strengthening of the solute components [11]. The addition of magnesium also leads to an increase of the ultimate strength after heat treatment by precipitation hardening. The addition of other minor elements such as strontium or manganese improves the mechanical properties of the alloy by reducing the size and the changing the morphology of the eutectic Si [12-13] and by introducing more dispersed and round-shape pores [13]. Titanium and boron are added in order to refine the grain structure. Grain refinement is an important strengthening mechanism in order to achieve higher mechanical properties in aluminum alloys. As the number of grain increases, the grain boundaries increase and this leads to higher yield strength of the alloy. The addition of grain refiners such as titanium can effectively reduce the grain size and promotes the formation of equiaxed grain structures rather than columnar [14].
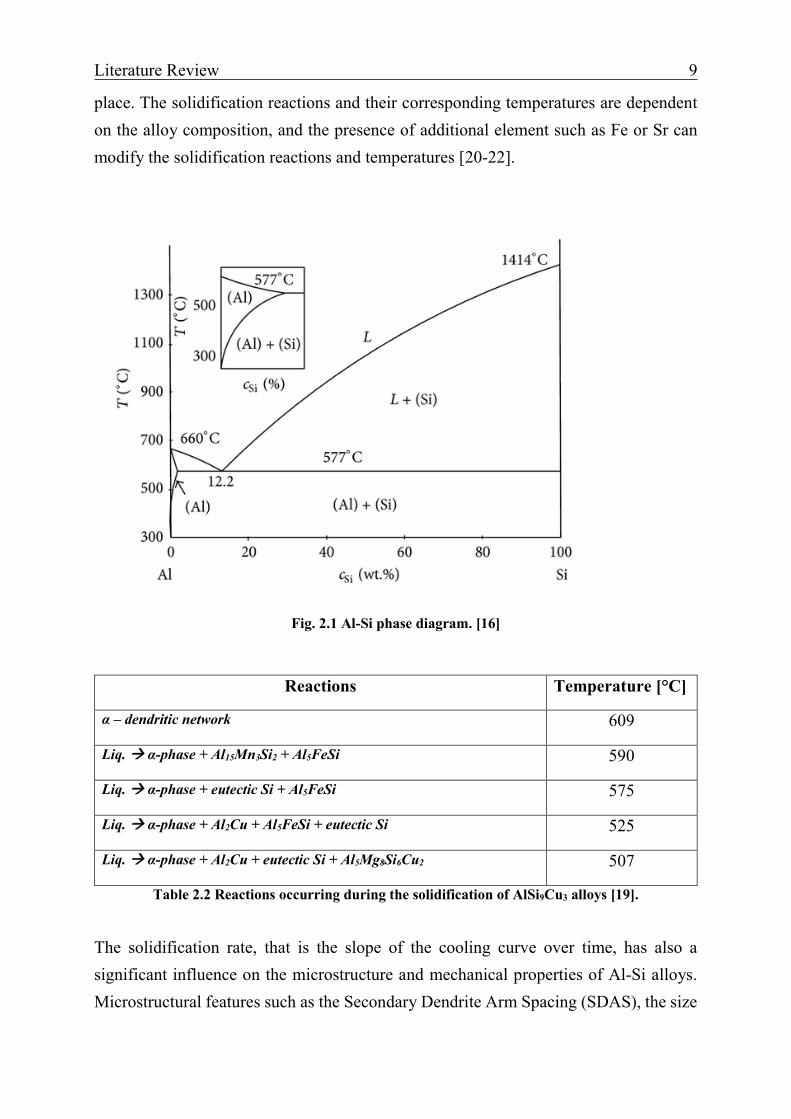
Al-Si alloys can be classified as hypoeutectic, eutectic or hypereutectic based on their silicon content (see Fig. 2.1.). The hypoeutectic alloy contains much higher fraction of alpha-aluminum, whereas in the hypereutectic alloy primary Si forms first, depleting the liquid melt of Si until it reaches the eutectic composition where the remaining solidification follows the eutectic reaction [15]. The primary Si has a cuboidal form and increases the brittleness of the alloy.
The solidification process strongly affects both the microstructure and the mechanical properties of the Al-Si-Cu alloys. This process can be described by the phase diagram in which the following reaction sequence takes place [17-18].
When the alloy starts cooling from the liquid state, the α–aluminum matrix begins to solidify at favorable nucleation sites. During cooling, the nucleation sites start to grow as dendritic structures and additional nucleation sites are formed. The α–aluminum continues forming until the liquid melt reaches the eutectic temperature of the eutectic composition. Below this temperature the reaction sequence described in Table 2.1 takes
Literature Review 9
place. The solidification reactions and their corresponding temperatures are dependent on the alloy composition, and the presence of additional element such as Fe or Sr can modify the solidification reactions and temperatures [20-22].
Fig. 2.1 Al-Si phase diagram. [16]
Reactions Temperature [°C]
α – dendritic network 609
Liq. α-phase + Al15Mn3Si2 + Al5FeSi 590
Liq. α-phase + eutectic Si + Al5FeSi 575
Liq. α-phase + Al2Cu + Al5FeSi + eutectic Si 525
Liq. α-phase + Al2Cu + eutectic Si + Al5Mg8Si6Cu2 507
Table 2.2 Reactions occurring during the solidification of AlSi9Cu3 alloys [19].
The solidification rate, that is the slope of the cooling curve over time, has also a significant influence on the microstructure and mechanical properties of Al-Si alloys. Microstructural features such as the Secondary Dendrite Arm Spacing (SDAS), the size

10 Literature Review
and morphology of eutectic silicon and iron-rich intermetallic inclusions are strongly dependent on this feature.
The Secondary Dendrite Arm Spacing is defined as the distance between the dendritic secondary arms [23]. In order to determine the SDAS, the total spacing from the first to the last arm is measured and it is divided by the number of existing dendrite arms [24-25]. When the solidification rate is high, the average SDAS decreases, leading to higher tensile strength and elongation. Besides, higher solidification rates results in the formation of lower and more uniform distribution of shrinkage pores and refined eutectic silicon precipitates due to extended mass feeding [26].
Fig. 2.2 Definition of secondary (λ2) dendrite arm spacing [27].
An empirical equation (see Equation 2.1) is often used to describe the relationship between the solidification rate and the coarseness of the microstructure, where tf is the solidification time, n and K are specific parameters of the alloy [28].
𝑆𝑆𝑆𝑆𝑆𝑆𝑆𝑆 = 𝐾𝐾 𝑡𝑡𝑓𝑓𝑛𝑛 (Equation 2.1)
Therefore, controlling the solidification rate in the production process is essential to achieve the required microstructure. The mechanism by which the eutectic nucleates and growths affects considerably the formation of pores and intermetallic inclusions, whose size and morphology have a significant influence on the tensile and fatigue properties of the alloy.

Literature Review 11
2.2 Secondary Al-Si alloys
The rise in the production of recycled Al-S alloys increases the number of residual elements that are trapped in the solid-solution. Iron is one the most critical alloying elements, since it promotes the formation of brittle Al-Si-Fe intermetallic inclusions that reduce the mechanical properties of the alloy [29]. The origin of these iron impurities are the steel tools, scrap materials and the subsequent melting and casting of different alloys in the casting mold [30]. The formation of the brittle Al-Si-Fe inclusions can be suppressed by the addition of neutralizing elements [31-32], increasing the solidification rate during the casting process [33], or by subjecting the alloy to specific heat treatments [8]. Manganese is one of the most effective alloying elements which are used in order to neutralize the effect of iron and modify the iron-rich phases to less harmful morphologies. However, manganese is not always the most suitable solution since it can react with other elements contained in the melt causing the formation of complex compounds [7]. It has also been reported that strontium addition leads to the dissolution of more than two-third of the iron-rich intermetallic inclusions as well as the modification of the Mg2Si particles [32] The mechanism of the modification of the iron-rich phase by the combined addition of Sr and Mn can be explained by two effects: on the one hand, preventing the growth of the iron-rich phases in certain crystallographic lattice planes in which strontium is absorbed; and on the other hand, promoting the formation of less harmful morphologies of the iron-rich intermetallic inclusions, such as the Chinese script instead of the plate-like morphology [7].
Increasing the cooling rate can also lead to a significant refinement of the iron-rich inclusions as well as the grain size and the secondary dendritic arm spacing. The reduction of the secondary dendritic arm spacing increases the dendritic boundary area per unit volume, what leads to thinner and more isolated liquid channels, preventing the connection between iron intermetallic inclusions nucleating at different sites [33]. Finally, heat treatments have been suggested as an effective method to avoid the detrimental effect of the iron-rich intermetallic inclusions. Under conventional heat treatments the iron-rich phases do change in any significant way. However, several reports [8, 34] have suggested that non-equilibrium heat treatments with temperature above the final solidification temperature of the alloy can significantly dissolve and fragment the iron-rich inclusions resulting in a significant improvement in mechanical properties.

12 Literature Review
2.3 Casting process
2.3.1 Sand casting
Sand casting is a relatively low-cost casting method commonly used in the casting industry. Sand, which is abundantly available and easy to form, is used to build the mold and allows for high design flexibility and low initial investment. However, there are some limitations regarding accuracy, surface finish and final shape, and therefore, considerable efforts have been made in recent years in order to improve the quality of sand casting by introducing new sand compositions and developing new molding techniques [35]. In this type of casting, the mold is usually made of a mixture of sand, silica and other additives that act as binders.
Plaster casting is similar to sand casting except sand is replaced by plaster. Plaster usually consists of gypsum, strengtheners and water. Plaster casting can be an economical replacement for other casting techniques due to the low cost of plaster and mold production [35]. Nevertheless, there are some disadvantages associated with plaster casting, such as the fact that mold quality is dependent on composition and plaster curing techniques. Another disadvantage is that, unlike sand, plaster cannot be recycled after being used.
Sand casting is associated with lower cooling rates compared to die casting, what leads to the formation of a coarser microstructure in terms SDAS as well as larger micro-pores and intermetallic inclusions [36, 37]. The interconnectivity levels between defects is also higher in this type of casting and the mechanical properties are reduced, if the components are not subjected to additional treatments.
2.3.2 Die casting
Die casting is a permanent die casting method by which high production rates can be achieved due to the reduced time required to prepare the mold from one cast to the next and the higher conductivity of the mold material compared with sand or plaster. Steel is one of the most common mold materials due to the high conductivity and good machinability of steel alloys [38, 39]. The steel mold is coated with a refractory wash made of acetylone, soot or sodium silicate in order to ease the removal of the cast after
Literature Review 13
solidification, to avoid any non-intended solidification direction as well as to prevent chemical reactions between the molten alloy and steel. Permanent molds have a limited life of between 50,000-150,000 casting shots before wearing out due to repeated fluid flow from incoming molten metal or internal thermal fatigue cracking [39].
The high conductivity of the materials used for producing permanent molds lead to higher heat transfers rates that result in lower solidification times and higher cooling rates. The increase in the cooling rate enables to achieve relatively higher strength metals compared with the castings produced by sand casting [40]. However, the costs associated with permanent casting are typically higher than in sand casting, particularly when the number of castings is reduced [41].
2.3.3 High Pressure Die Casting
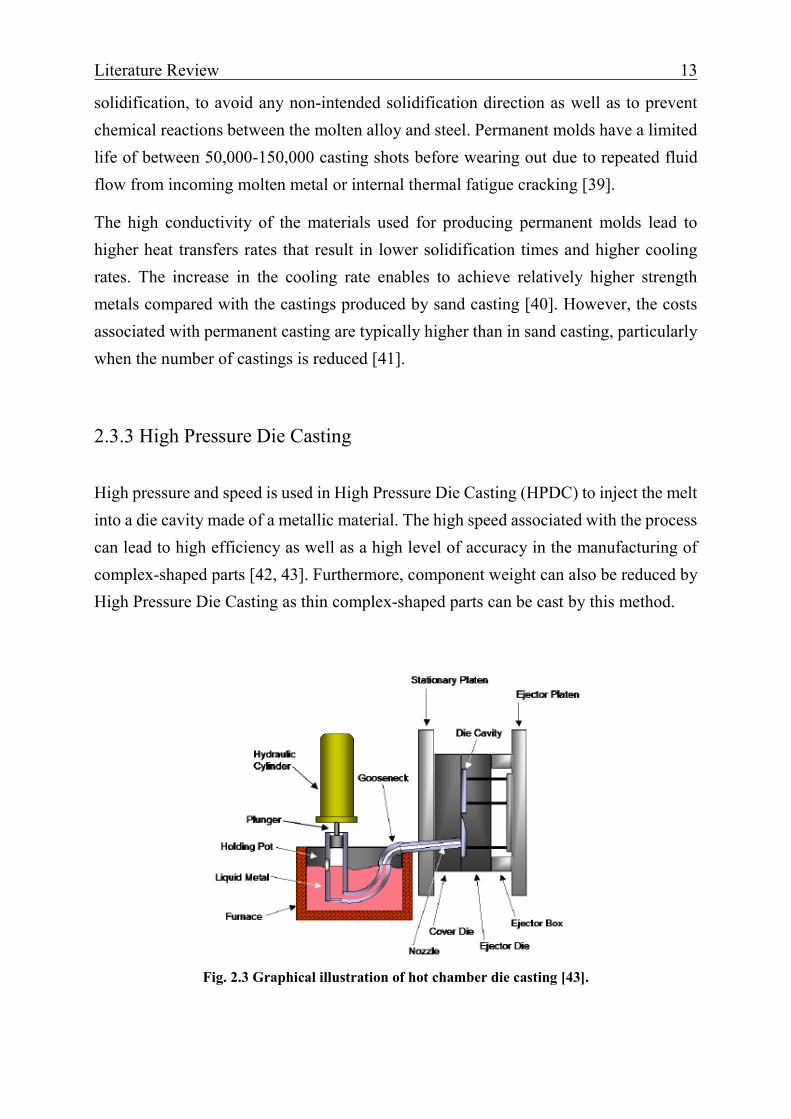
High pressure and speed is used in High Pressure Die Casting (HPDC) to inject the melt into a die cavity made of a metallic material. The high speed associated with the process can lead to high efficiency as well as a high level of accuracy in the manufacturing of complex-shaped parts [42, 43]. Furthermore, component weight can also be reduced by High Pressure Die Casting as thin complex-shaped parts can be cast by this method.
Fig. 2.3 Graphical illustration of hot chamber die casting [43].

14 Literature Review
Based on the method of delivering the melt to the die cast, hot chamber and cold chamber HPDC processes can be distinguished [45]. In the hot chamber method, the melt is delivered from the reservoir into the gooseneck and it is directly injected into the mold. Pneumatic or hydraulic pistons are usually utilized to allow the melt to flow out of the gooseneck into the die cavity after the gooseneck is filled with molten metal [45, 46]. Hot chamber HPDC is mainly used in the casting of zink, tin and lead-based alloys since only metals with low melting temperatures can remain molten before reaching the die cast [44, 47]. Al-based alloys cannot be cast by this metal injection system since they can be easily degraded and iron can gather in the melt pool [44, 48], leading the formation of hard iron-rich particles during casting [49].
Fig. 2.4 Graphical illustration of cold chamber die casting [50].
Cold chamber HPDC is characterized by holding the melted alloy in a separate furnace and transporting the amount of melt needed into an unheated injection cylinder that delivers the molten material into the die cavity by applying pressure with a hydraulic or mechanical piston [51, 52]. The significant time required to deliver the melt to the cold chamber from the furnace results in slower cycle times compared to hot chamber HPDC, in which cycles times up to 15 cycles/min can be achieved. However, aluminum, magnesium and copper alloys can be cast with this method since minimum contact takes place between the injection chamber and the molten metal. Alloys with different requirements can be cast by this method at a high production rate as well as a minimum dimensional tolerance, what reduces the need of subjecting cast parts to additional machining.

Literature Review 15
The metals with high castability are the ones that can be cast free of defects and with the required dimensional characteristics. Different techniques can be applied to solve the problems that can reduce the quality of the cast parts.
One of the most common problem in the casting process are material movements that occur due to the shrinkage of the melt, which can cause dimensional as well as microstructural defects [53]. As result of this phenomenon, also known as feeding, pores can form depending on the solidification rate in regions where feeding is incomplete. Different feeding mechanisms, such as liquid, mass, interdendritic or solid feeding can occur in the different ranges of the solidification period [53]. Macrosegretation is the formation of large segregated phases within a sub-volume of the melt material known as mushy zone. The segregation of these phases occur due to the movement of liquid melt and solid material within the mushy zone [54].
The movement of the material can occur if grains form at early stage in solidification which are not attached to neighboring grains, floating or settling together with inclusions [55]. Since liquid and solid phases present different concentrations, the solute-rich liquid can be transported from one zone of the casting to another, leading to the formation of solute-depleted and solute-enriched zones. Solidification shrinkage can also cause the movement of liquid or solid material fractions as well as thermo-solutal and forced convection in the interdendritic liquid [55]. Dobatkin [56] formulated the main idea as follows:
“The shrinkage of the surface zone of the billet is compensated by the alloy, enriched in the low-melting alloy component. For the next layers, a certain equilibrium is established, and the internal zone of the billet appears to be depleted of the low-melting component, as the transport of the matrix melt to the periphery is not compensated. The degree of the negative segregation directly depends on the horizontal solidification range (apparently horizontal dimension of the transition region) and the degree of volumetric solidification shrinkage. The segregation direction coincides with the direction of cooling. With the inclined solidification front, the degree of segregation is the greater, the larger is the inclination of the solidification front to the horizon.”
Different techniques have been designed to visualize the redistribution of solute at the macro-scale in order to study the transportation of alloying elements that can lead to macrosegregation [57]. These methods were first based on metallographic observations conducted on casting alloys with different compositions. Since two-dimensional

16 Literature Review
microstructural characterization methods have been reported to be not suitable for statistical analysis of shrinkage defects [58] and quantitative methods like Energy Dispersive X-ray Spectroscopy are limited to small areas, new methods have been proposed to numerically characterize macrosegregation. One of this methods is based on the coupling of solute and energy conservation equation with Lattice-Boltzmann Method. In this approach [57] the effect of solidification shrinkage as well as thermos-solutal convection is taken into account and high numerical stability can be achieved.
Internal stresses can occur when the solidification shrinkage and thermal contraction is significant. The regions of the cast volume that are not completely solidified can tear apart if the strength of the material in the sub-volume is low. In this regions the lack of feeding can cause the formation of defects such as pores. Therefore, it is required to provide enough feeding to the mushy zone in order to increase the permeability of the molten material and enable the liquid to flow [59]. The concept of fluidity is related to the ability of the melt to flow without significant restriction from the solidified material [54].
One method to quantify fluidity is to measure the distance that the melt can flow across a small channel [54, 60]. Different models have been developed in order to estimate fluidity based on the flow length [59]. Composition influences the fluidity of the alloy [54, 60]. In aluminium alloys, the addition of the certain elements such as Fe, Ti or Zn can reduce the fluidity of the alloy [61, 62].
Several studies have analyzed the influence of alloy composition on the fluidity of aluminum alloys. The alloy composition can vary the viscosity, surface tensions, freezing range and solidification mode of the alloy. High fluidity levels are typically associated with short freezing range alloys, in which the solidification process is based on the advance of place interface, such as in pure metals or eutectic alloys. On the contrary, the lowest fluidity is characteristic of long freezing range alloys, in which constitutional undercooling can induce the formation of isolated crystals that can arrest the flow and reduce fluidity [63]. The grain size of the solidified phase together with thickness of the flow channel determine the maximum solid fraction before the melt stops continue flowing. Except for aluminum MMCs, fluidity generally increases with melt temperature for a given alloy composition. Grain size can also affect the fluidity of the alloy and its influence generally depends on the grain refiner content as well as holding temperature and time in the furnace.

Literature Review 17
Several studies [64-72] analyzed the detrimental effect of iron in the formation of pores in Al-Si alloys. These studies reported that the addition of Fe enhanced the formation of ß-Al5FeSi plates that act as physical restriction to the flow of molten material, and hence block the intedrendritic feeding. Taylor et al. [67] reported that porosity levels increase proportional to the iron content since the maximum size and volume fraction of the ß-Al5FeSi inclusions also increase with the iron content. On the contrary, other studies concluded that porosity levels do not show direct proportionality to iron content [69]. Roy et al. [69] suggested that iron rich ß-phases act as nucleants for pores and also restrain their growth. This study was carried by the observation of two-dimensional micrographs and it has been reported that two-dimensional microstructural characterization is insufficient for an accurate quantification of the pores [58, 73-74].
Investigations on this field also predicted that a minimum in porosity should occur at critical iron content for all Al-Si alloys [67]. This model proposed that ß-Al5FeSi inclusions were unable to nucleate eutectic grains at lower iron contents with respect to the critical iron content. Fe-rich ß-phases reduced the permeability of the material at higher iron content due to the physical restriction of the melt flow as well as nucleation of the ternary eutectic in interdendritic spaces [70]. Nevertheless, this theoretical porosity minimum at the critical iron content has not been experimentally verified [68]. Several studies have rejected the porosity minimum theory. Otte et al. [71] considered that the nucleation of Al-Si grains on ß-Al5FeSi inclusions may not have a significant influence on the formation of pores. In this work it was reported that porosity levels were determined by the structure of the solid/liquid interface.
In the alloys with high iron contents, Al-Si eutectic grains were reported to nucleate on large ß-Al5FeSi inclusions before the main Al-Si solidification interface, decreasing the permeability of the alloy. Puncreobutr [72] quantitatively investigated the effect of the ß-Al5FeSi inclusions on the porosity formation by synchrotron X-ray tomography. In-situ solidification as well as isothermal semisolid analysis were performed in this work. It was reported that the formation of ß-Al5FeSi inclusions can block the interdendritic channels leading to porosity formation as result of hydrogen supersaturation in commercial Al-7.5Si-3.5Cu alloys. This study revealed that a high volume fraction of Fe-rich ß-phases can increase the hot-tearing susceptibility and cause brittle failure of the material. It was also reported that the ß-Al5FeSi inclusions increase the morphological complexities of the pores, leading to highly tortuous and branched pores.

18 Literature Review
2.4 Microstructure
2.4.1 Eutectic Silicon
Silicon is added in order to improve fluidity, decrease shrinkage as well as improve wear resistance of the alloy. It is well known that the coarse plate-like morphology of the eutectic Si reduces the mechanical properties of the Al-Si alloys as a result of the high stress concentrations caused by the faceted morphology. However, there are several methods to increase the mechanical properties of the Al-Si alloys by modifying the size and morphology of the eutectic Si precipitates.
One of this methods is the addition of modifying elements such strontium that transform the coarse eutectic Si plate-like network into a finer fibrous morphology. Although the discovery of the modification effect dates back to 1921, there are different theories that explain the exact modification mechanism. One of the most widely accepted theory is the impurity-induced twinning according to which the impurity atoms are adsorbed at the growth steps of silicon crystals growing by the twin plane re-entrant edge (TPRE) mechanism [75]. The high twin density of Si fibers would require strontium atoms to distribute uniformly rather than within the silicon phase [75, 76]. Besides strontium, there are several other elements that can modify the morphology of the eutectic silicon such as sodium and antimony [77], although strontium is the most commonly used due to its low toxicity and fading.
Another method to refine the size and the morphology of the eutectic silicon is increasing the cooling rate associated to the casting process. Rapid cooling or quenching can significantly reduce the size of the eutectic silicon also in the absence of chemical modifiers. Recent studies [78] have suggested that even if the eutectic refinement increases with cooling rate, only values of cooling rate higher than 0.7 K/s lead to a significant reduction of the eutectic silicon.
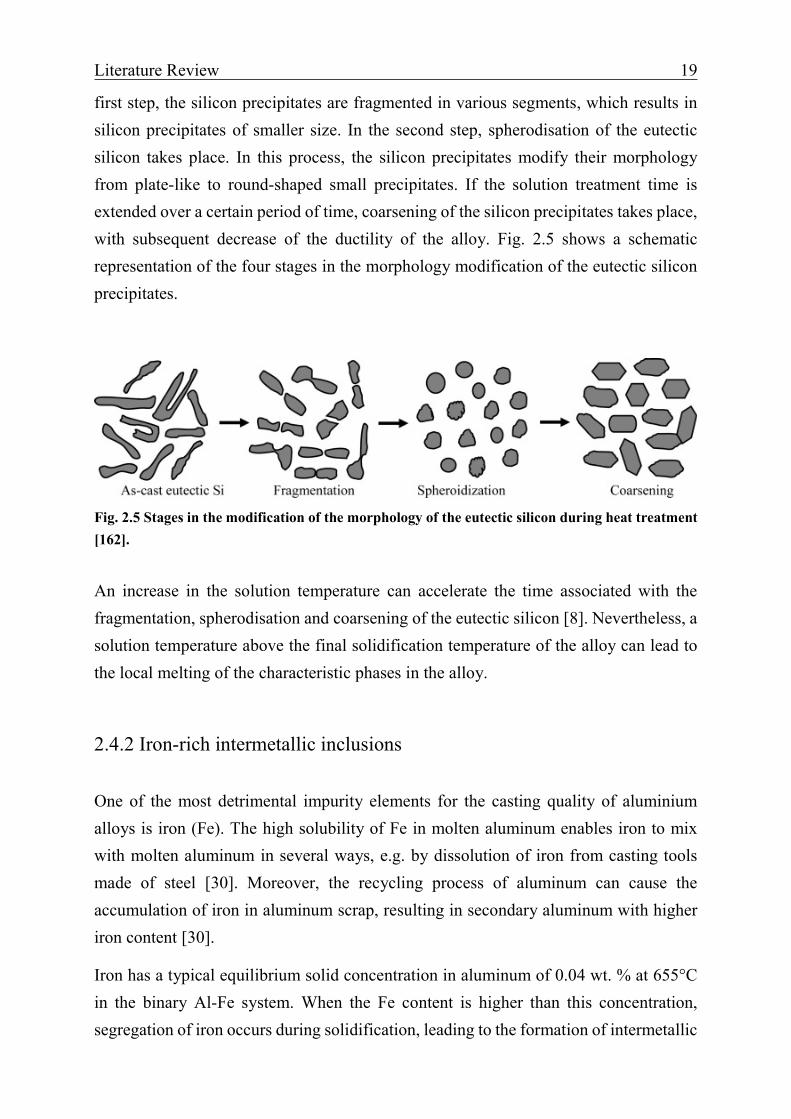
Solution treatment can also modify the polyhedral morphology of the eutectic silicon precipitates into more spherical morphologies as well as reduce the size the precipitates. The morphology of the eutectic silicon can be modified from polyhedral to globular structure. The modification of the silicon morphology can improve the strength and the ductility of the alloy [79]. During solution heat treatment, the alloy is heated to a temperature close the eutectic temperature for a certain period of time. The process of the modification of the silicon morphology is characterized by three steps [8]: In the
Literature Review 19
first step, the silicon precipitates are fragmented in various segments, which results in silicon precipitates of smaller size. In the second step, spherodisation of the eutectic silicon takes place. In this process, the silicon precipitates modify their morphology from plate-like to round-shaped small precipitates. If the solution treatment time is extended over a certain period of time, coarsening of the silicon precipitates takes place, with subsequent decrease of the ductility of the alloy. Fig. 2.5 shows a schematic representation of the four stages in the morphology modification of the eutectic silicon precipitates.
Fig. 2.5 Stages in the modification of the morphology of the eutectic silicon during heat treatment [162].
An increase in the solution temperature can accelerate the time associated with the fragmentation, spherodisation and coarsening of the eutectic silicon [8]. Nevertheless, a solution temperature above the final solidification temperature of the alloy can lead to the local melting of the characteristic phases in the alloy.
2.4.2 Iron-rich intermetallic inclusions
One of the most detrimental impurity elements for the casting quality of aluminium alloys is iron (Fe). The high solubility of Fe in molten aluminum enables iron to mix with molten aluminum in several ways, e.g. by dissolution of iron from casting tools made of steel [30]. Moreover, the recycling process of aluminum can cause the accumulation of iron in aluminum scrap, resulting in secondary aluminum with higher iron content [30].
Iron has a typical equilibrium solid concentration in aluminum of 0.04 wt. % at 655°C in the binary Al-Fe system. When the Fe content is higher than this concentration, segregation of iron occurs during solidification, leading to the formation of intermetallic

20 Literature Review
compounds comprised of iron, aluminum and other alloying elements. Metastable Al6Fe together with θ-Al13Fe phases were identified in [85] and it was reported that under equilibrium conditions transformation from Al6Fe to Al13Fe4 is possible. If the Fe content increases to levels above the iron solubility in aluminum, various Al-Si-Fe phases differing in chemical composition, morphology and crystal structure are formed in the Al-Si-Fe systems.
The Fe-rich inclusions in the Al-Si-Fe systems can be classified based on their crystal structure and morphology. Several phases have been identified in different studies, such as β-Al5FeSi, δ-Al4FeSi2, α -Al15(Fe,Mn)3Si2, Al8Mg3FeSi6, Al8Fe2Si and Al3FeSi. Although there is consensus regarding the morphology, the crystal structure of the ß-Al5FeSi, reported to be monoclinic [80] as well as orthorhombic [81] and tetragonal [82], remains a debated topic. Even if more than twenty different phases have been identified in Al-Si-Cu alloys, the α-Al15(Fe,Mn)3Si and ß-Al5FeSi are the most common ones in Al-Si alloys [83]. Contrary to the α-intermetallics, which appear in a “Chinese script” morphology or polygonal form, the ß-intermetallics exhibit a highly faceted plate-like morphology [84].
Wanderka et al. [86] studied the nucleation and growth of the Fe-rich δ-phase by the so-called cell formation mechanism. It was observed by X-ray tomography that the δ-particles nucleate on small liquid areas growing towards their center. It was reported that this nucleation process repeats itself and blocking between the Fe-rich particles and the eutectic Al-Si phases can occur. Solute concentration was determined as the driving factor for the nucleation of the δ-phase instead of the density of the substrate. This work reports that nucleation on the eutectic silicon precipitates is the main growth mechanisms for the Fe-rich δ-particles as well as the interaction with the eutectic silicon phase.
2.4.3 Copper-rich phases
Based on the aluminum-silicon (Al-Si) system, copper is one of the main alloying elements. Adidition of copper to Al-Si alloys causes the formation of Al2Cu phases, which increase the strength of the cast alloys. It is well known that at approximately 548°C the amount of Cu in the solid-solution is about 5.7%. This value decreases with decreasing temperature, reaching 0.1-0.2 wt. % at 250°C. In 319 alloys, copper forms

Literature Review 21
an intermetallic phase with Al that precipitates during solidification either as block-like Al2Cu or in eutectic for as Al+Al2Cu [87].
The copper content in Al–Cu–Si–Mg alloys affect the mechanical properties. By increasing the amount of copper, tensile strength and hardness increase due to precipitation hardening. It is found that increasing copper content from 1 to 6%, tensile strength increases from 152 to 402 MPa and hardness increases from 45 to 118 HB [88].
The β-Al5FeSi phase platelets act as preferred precipitation sites for the copper phase and hence lessen the degree of segregation. Thus, addition of Fe can accelerate the copper phase dissolution. However, phosphorus addition has a negative effect on Al2Cu dissolution due to (i) its solubility in the Al2Cu phases, and (ii) the formation of Al2O3 oxide particles which act as nucleation sites for the precipitation of the block-like Al2Cu phase. It retards the complete dissolution of this copper phase even after 100 hours solution treatment. In the case when phosphorus and iron are added together, the negative effect of phosphorus can be neutralized to some extent [88].
Calorimetry was successfully used to monitor the evolution of the dissolution of the Al2Cu intermetallic phase in two Al–Si–Cu–Mg alloys in [89]. In order to obtain accurate measurements, a proper heating rate was defined. The heating rate had to be high enough to avoid dissolution of the intermetallic phase during heating. However, increasing the heating rate too much produced overlapping of the DSC peaks reducing accuracy. The results obtained were in good agreement with metallographic measurements.
The alloys studied had similar compositions but very different microstructures. The dissolution rate of Al2Cu during isothermal heating was related to the microstructure of the alloy. In the alloy produced by ingot metallurgy a solution treatment of at least 2 hours were required to reach equilibrium dissolution of the Al2Cu phase. In the thixoformed alloy, the Al2Cu phase was fine and the phases had very high aspect ratios that favored faster dissolution in the matrix.
22 Literature Review
2.5 Heat treatments
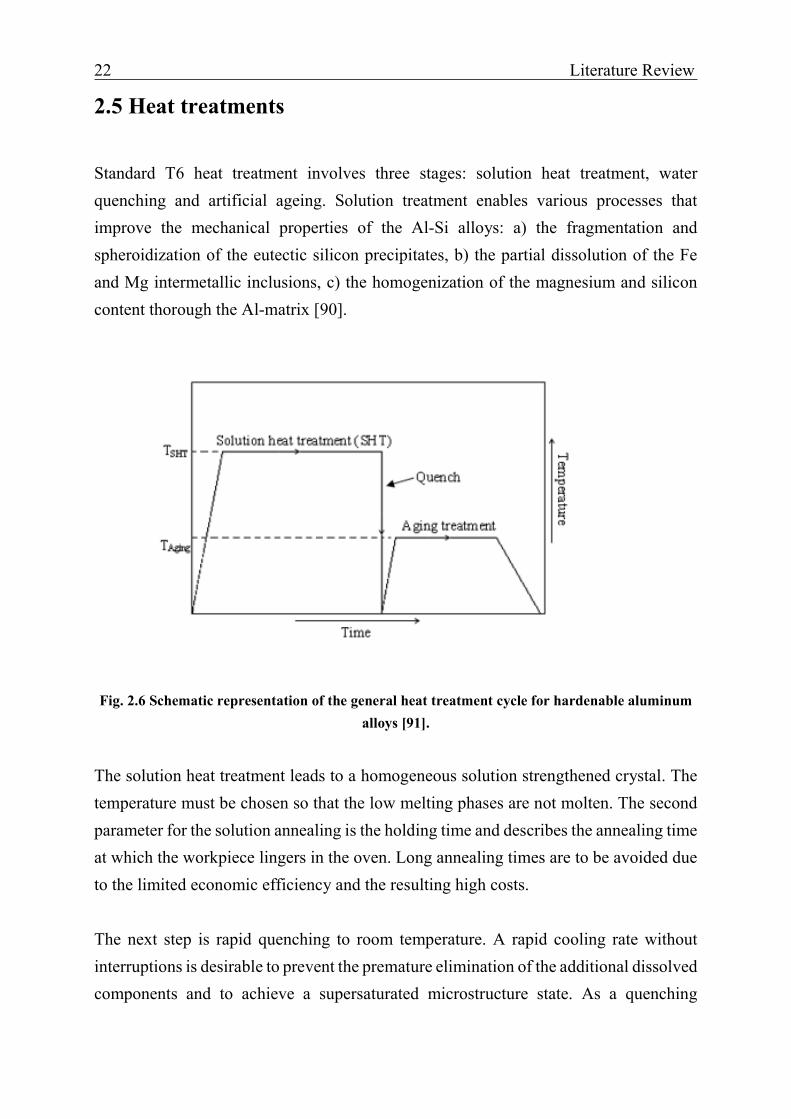
Standard T6 heat treatment involves three stages: solution heat treatment, water quenching and artificial ageing. Solution treatment enables various processes that improve the mechanical properties of the Al-Si alloys: a) the fragmentation and spheroidization of the eutectic silicon precipitates, b) the partial dissolution of the Fe and Mg intermetallic inclusions, c) the homogenization of the magnesium and silicon content thorough the Al-matrix [90].
Fig. 2.6 Schematic representation of the general heat treatment cycle for hardenable aluminum alloys [91].
The solution heat treatment leads to a homogeneous solution strengthened crystal. The temperature must be chosen so that the low melting phases are not molten. The second parameter for the solution annealing is the holding time and describes the annealing time at which the workpiece lingers in the oven. Long annealing times are to be avoided due to the limited economic efficiency and the resulting high costs. The next step is rapid quenching to room temperature. A rapid cooling rate without interruptions is desirable to prevent the premature elimination of the additional dissolved components and to achieve a supersaturated microstructure state. As a quenching

Literature Review 23
medium, water is usually used to quickly pass through the critical temperature range between 400 ° C and 290 ° C.
The supersaturated crystal thus produced wants to reach an equilibrium state by diffusion, since atoms can migrate into the vacancies thus produced. To accelerate this process, the material is aged at elevated temperature. If this takes place at temperatures below 100 ° C, it is called cold aging, at temperatures above 100 ° C of hot aging [19, 92-93].
Hot aging involves metastable phases that cause a hardening effect. These phases have a different lattice structure than the solid-solution crystal. Unlike cold-aging, they are partially coherent and are also called Guinier-Preston II zones. The longer the heat aging takes, the more the partially coherent precipitates replace the coherent ones. The level of temperature can speed up the rate of this conversion. Thus, maximum values of the mechanical properties such as hardness, yield strength and tensile strength are achieved, but at the expense of ductility [93].
As for the homogenization of Mg and Si content throughout the Al-matrix, higher solution heat treatment temperatures (e.g., from 500°C to 540°C) can promote the dissolution of higher amounts of Mg2Si [32].
Heat treatment standards discourage conducting heat treatments above the final solidification point of the alloy (for example, 498°C for Al-Si alloys containing copper). These temperature standards are based on the assumption that heat treatment above the final solidification point of the alloy can cause the melting of the phases whose solidification temperature is below the solution temperature, leading to formation of small amounts of liquid phase that reduce the mechanical properties of the alloy.
24 Literature Review
2.6 Three-dimensional microstructure characterization
The acquisition of 3D images by X-ray computed tomography is fast becoming a widely used tool for microstructural characterization [94]. Accurate representation of the geometry, phase or grain microstructure can be extracted from X-ray tomography data for numerical modelling or quantitative analysis of microstructural features. Microstructural evolution can be characterized by the so called time lapse (4D) imaging [94]. The morphological characterization of defects such as inclusions and pores is required for quality and reliability control of structural parts as well as for the material characterization. Parameters such as size, surface area and volume of inclusions or pores can be measured with X-ray tomographic techniques. This has been one of the major outputs of early tomography measurements on particulate composites [95, 96] subsequently refined to quantify the local particle volume fraction [96, 97] since clustering can have a detrimental effect on the fracture properties of composites. The size of reinforcing TiB2 particle clusters were measured in [98] using static imaging. In this work, it was revealed that the size and number of the clusters reduce as the high temperature time increased.
The growth of microspores was measured by Toda et al. [99] in pure Al and Mg samples using high resolution computed-tomography at high temperatures. Defect population quantification from 3D images generally yield more accurate results provided when segmentation and resolution are properly conducted because there is no need for transforming a 2D histogram into a 3D one. However, in all the cases listed above, where the shape of the inclusions is rather simple, 2D analysis coupled with stereology remains a cost-effective and useful tool. Moreover, quantification errors can occur in tomography analysis.
For example, an insufficient resolution can lead to errors in the quantification of the nucleation stage of ductile damage where the inability to detect a high number of small cavities lead to a significance bias in the results [100]. That being said, when the morphology of the pores or the inclusions is more complex, 2D observation can no longer provide an accurate quantification of the microstructural features. The morphology of the pores is the key factor in the crack initiation process of Al-Si alloys [92-97]. The grey-level texture of 3D images can also be used to quantify complex features such as the local orientation of second phases in aluminum alloys [87-91].

Literature Review 25
These methods are based on the calculation of the gradient in the neighborhood of each voxel. The local orientation of Widmanstatten structures were measured by this method in a dual phase titanium alloys [98]. Furthermore, the microstructure and crystallographic orientation of directionally solidified Mg-4 wt% Zn alloy were characterized by X-ray computed tomography (XCT) and electron backscatter diffraction (EBSD) in [99]. Results reveal that Mg-4 wt% Zn alloy with dendritic microstructure exhibits typical {0002} basal texture along growth direction. Three-dimensional (3D) short fatigue crack growth behaviour in a cast magnesium alloy, Elektron 21, was studied using a combination of X-ray diffraction contrast tomography (DCT) and microtomography at the European Synchrotron Radiation Facility. A 3D map of grain shapes and crystallographic orientations was produced in a miniature fatigue specimen using DCT [100].
Dendritic microstructural evolution during the solidification of Mg-Zn alloys was investigated as a function of Zn concentration using in situ synchrotron X-ray tomography [101]. It was revealed that increasing Zn content from 25 wt% to 50 wt% causes a Dendrite Orientation Transition (DOT) from a six-fold snow-flake structure to a hyper-branched morphology and then back to a six-fold structure.
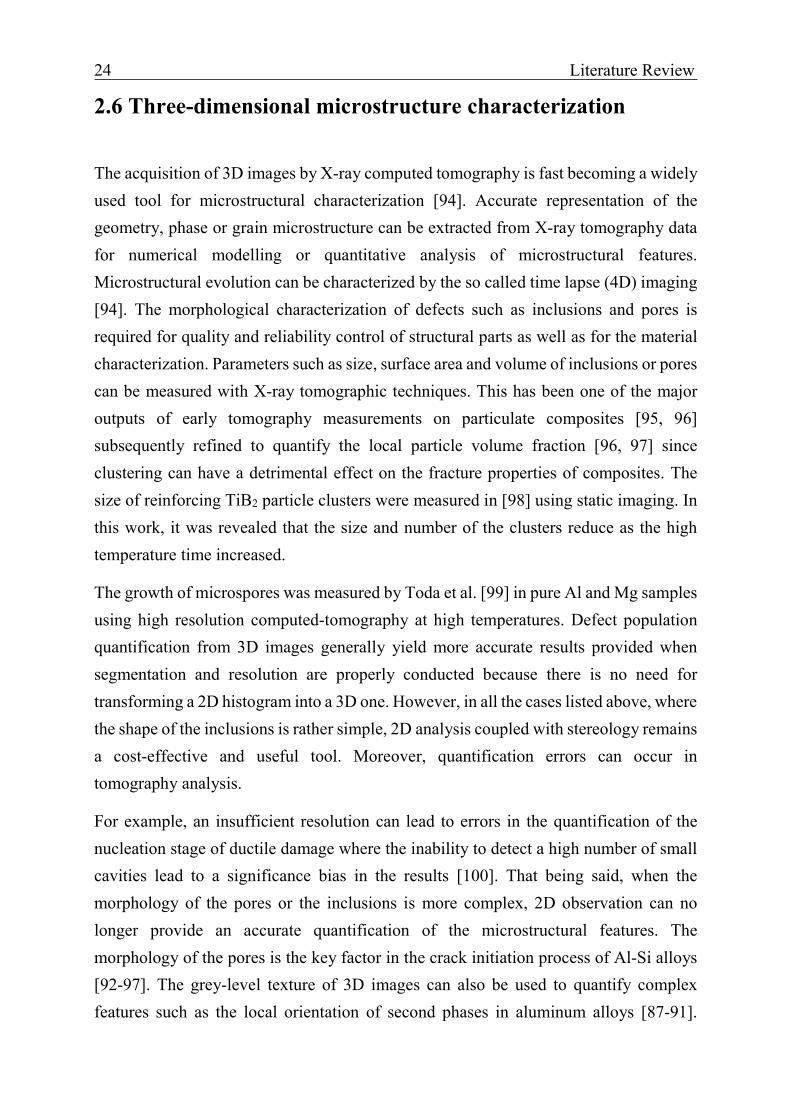
In the study from Buffiere et al. [102], in situ damage initiation was investigated in an AlSi7Cu3Mg alloy using X-ray synchrotron tomography. The results revealed that the 3D microstructure of the material consists in a complex 3D network of relatively coarse phases. Fig. 2b shows a 3D network of entangled very large particles (Silicon precipitates, Al2Cu, α-AlFeSi, β-AlFeSi) and pores. The various phases present in the alloy were segmented on reconstructed gray level images in the background. However, noise and the small difference between the gray levels of the different phases made automatic thresholding of the various phases difficult. Therefore, a Paganin algorithm [103] was used for reconstruction in order to obtain a better contrast between the different phases. However, the authors remarked that the differentiation between Al2Cu and Fe-rich intermetallics remains complicated, and therefore, manual segmentation of these phases was required. While the highly coherent beams characteristic of long synchrotron beamlines makes them well suited to phase contrast imaging, the technique is not restricted to synchrotron sources. Indeed X-ray computed tomography has proved invaluable in several applications [104-105]. However, since the incident beam is polychromatic, phase retrieval is not as effective as for synchrotron X-ray imaging.
26 Literature Review
Fig. 2.7 3D rendering of the microstructure of the alloy. Around the pores (in purple) the Fe-rich (in green) and Al2Cu (yellow) particles form a dense 3D network [164].

Material and experimental methods 27
3 Material and experimental methods
28 Material and experimental methods
3.1 Material
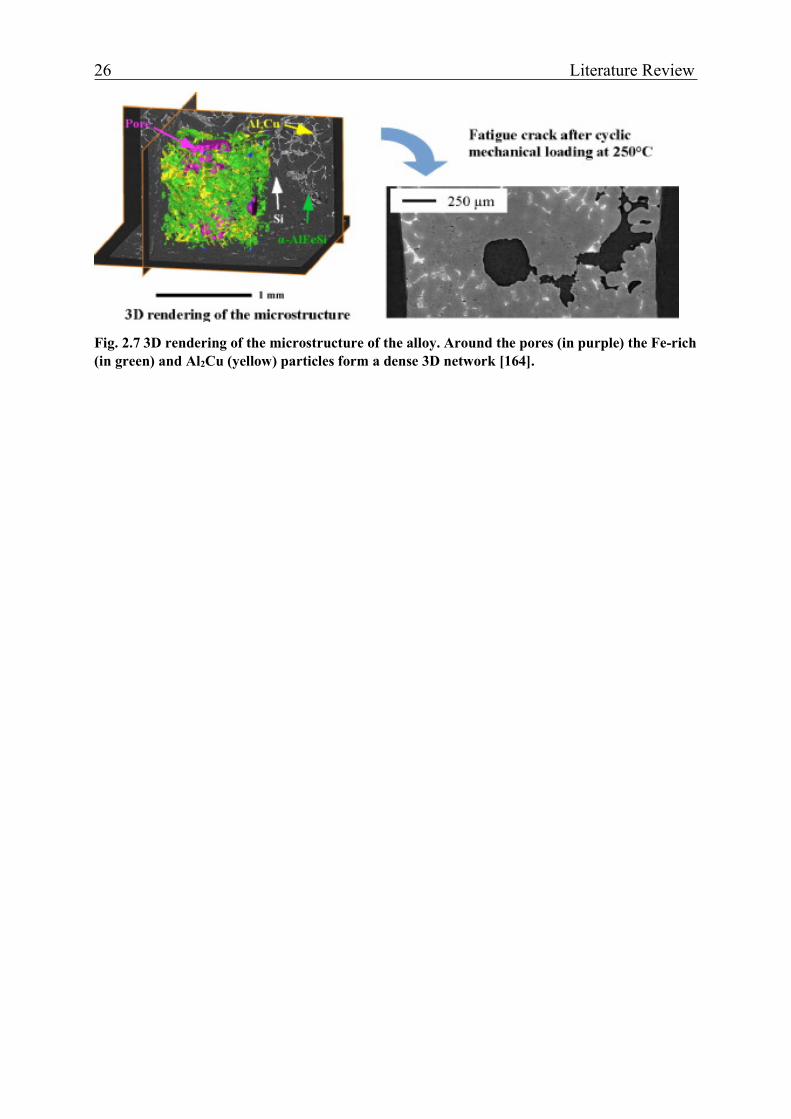
The alloy composition was measured by EDX in a Scanning Electron Microscope (SEM) and the results are shown in Table 3.1. High concentrations of alloying elements gathered during the recycling cycle, such as Fe, Mn and Cr, is a common issue in secondary Al-Si-Cu alloys. A high Fe content in the alloy composition can lead to the formation of different types of Al-Si-Fe intermetallic phases that reduce the mechanical properties of the material and can enhance the formation of pores [64-71]. Moreover, excess content of Mn can reduce the ß-Al5FeSi phase and promote the formation of the less detrimental Chinese-Script-like α-Al15(Fe,Mn)3Si. In the alloy composition it can be noted that it contains 0.6 weight % of Fe with a relationship Mn:Fe of 0.28. The Fe content tends to form a considerable amount of ß-Al5FeSi since this Mn:Fe relationship does not lead to a significant substitution from ß-phase to the less detrimental α-Al15(Fe,Mn)3Si2 [7].
Si Cu Mg Fe Zn Mn Ni Ti Al
12.96 1.52 0.68 0.6 0.48 0.17 0.05 0.04 rest
Table 3.1 Chemical Composition of the Al-Si-Cu alloy (wt. %).
Fig. 3.1 shows the typical microstructure of the Fe-rich Al-Si-Cu alloy, which consists of the α-matrix, eutectic Si precipitates, Fe-rich intermetallic phases and Cu-intermetallics. In the alloy used for experiments two main Fe-rich intermetallic phases have been observed: The α-Al15(FeMn)3Si2 with Chinese script and cubic crystal structure and the β-Al5FeSi with needle-like appearance and monoclinic crystal structure. The β-phase is brittle and appears as highly faceted platelets, which causes the loss of strength and ductility in the cast alloy.
Cu is in Al-Si-Cu cast alloys present primarily as phases: Al2Cu or Al-Al2Cu-Si [19,106]. The Al2Cu phase is often observed to precipitate both in a small blocky shape with microhardness 185 HV 0.01 [19], whereas the Al-Al2Cu-Si phase is observed in very fine multi-phase eutectic-like deposits with microhardness 280 HV 0.0 [106].

Material and experimental methods 29
Titanium can act as an effective grain refinement element in Al-Si alloys. [107, 108] Tronche et al. [108] revealed that addition of 0.15% Titanium can reduce the average grain size from 1676 µm to 533 µm in a primary hypoeutectic Al-Si alloy. Table 2 shows the results of the EDX analysis of the different intermetallic phases identified in the studied alloy:
Fig. 3.1 Main inclusions of recycled Al-Si-Cu alloy: 1- α-Al15(FeMn)3Si2, 2- β-Al5FeSi, 3- Euectic silicon, 4- Al2Cu.
Intermetallic Phase
Si Cu Mg Fe Mn Al
α-Al15(Fe,Mn)3Si2 8.5 3.6 - 16.6 8.4 60.8
ß-Al5FeSi 14.2 - - 19.67 3.8 57.3
Al2Cu - 39.06 - - - 52
Table 3.2 Chemical composition of intermetallic phases.
30 Material and experimental methods
3.2 Casting process
3.2.1 Sand casting
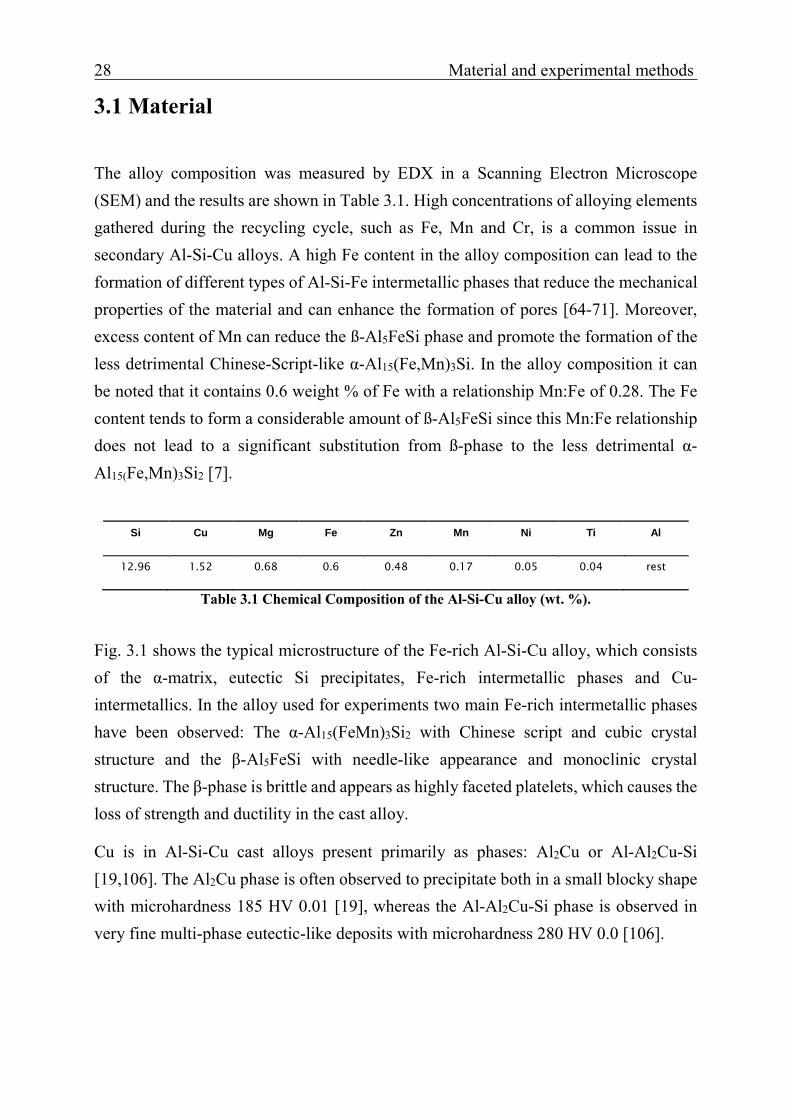
Prior to the casting of the specimens, casting simulation was performed in the Institute for Foundry-Technology of the University of Kassel in cooperation with Adam Fros (Prof. Fehlbier) and Martin Lütje [58,73-74,109-112] using the simulation software Magma [113] in order to optimize the casting parameters. Different mold geometries (see Fig. 3.2) as well as filling strategies, melt temperatures and filling times were considered. Table 1 shows the combination of parameters for the different simulations conducted in the casting simulation software. AlSi9Cu3 was considered as the cast material in every simulation.
The filling strategy was held constant in all simulations except in simulation #7 (see Table 1), in which a ramp from 0 cm2/s at 0s to 200 cm2/s at 5s was considered. The melt temperatures varied from 670°C to 720°C and the filling time from 3.5s to 7s in the different casting simulations. The feeding efficiency was 30% in the whole set of simulations and silica water glass at room temperature was considered. The results of the simulations revealed that the parameters from simulation #8 were the optimal ones regarding castability, feeding and homogeneous distribution of the melt.
Table 3.3 Cast simulation parameters.
Material and experimental methods 31
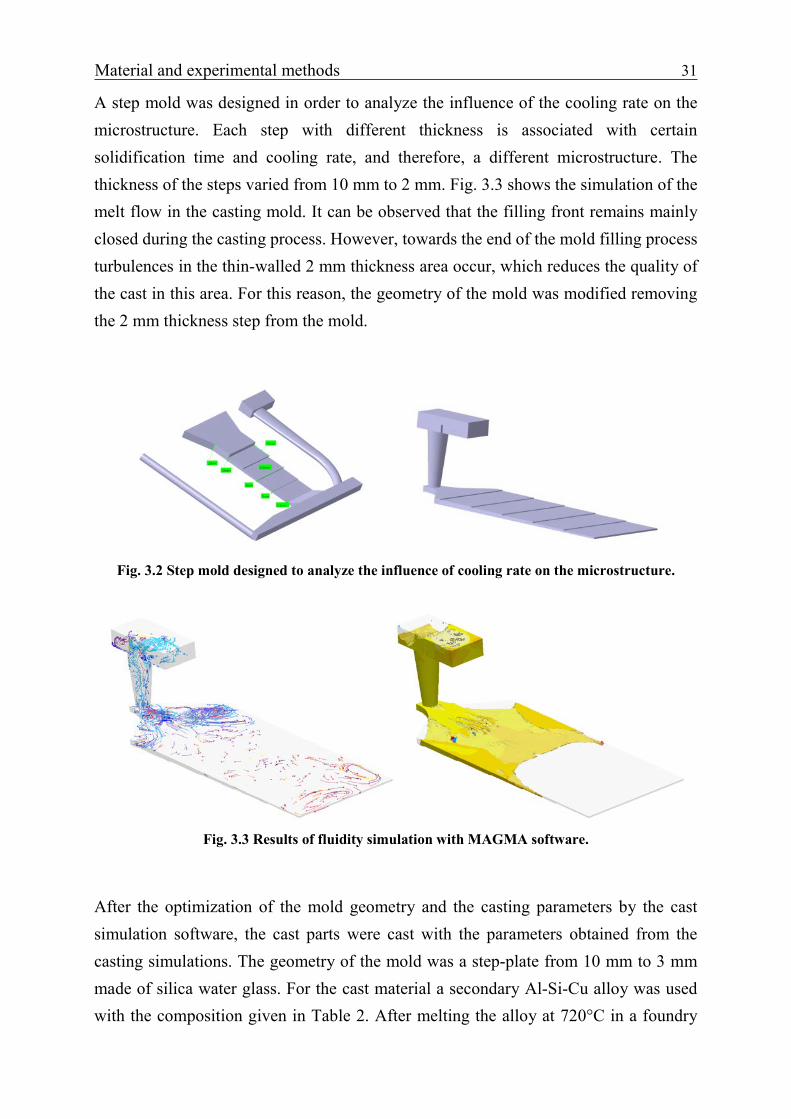
A step mold was designed in order to analyze the influence of the cooling rate on the microstructure. Each step with different thickness is associated with certain solidification time and cooling rate, and therefore, a different microstructure. The thickness of the steps varied from 10 mm to 2 mm. Fig. 3.3 shows the simulation of the melt flow in the casting mold. It can be observed that the filling front remains mainly closed during the casting process. However, towards the end of the mold filling process turbulences in the thin-walled 2 mm thickness area occur, which reduces the quality of the cast in this area. For this reason, the geometry of the mold was modified removing the 2 mm thickness step from the mold.
Fig. 3.2 Step mold designed to analyze the influence of cooling rate on the microstructure.
Fig. 3.3 Results of fluidity simulation with MAGMA software.
After the optimization of the mold geometry and the casting parameters by the cast simulation software, the cast parts were cast with the parameters obtained from the casting simulations. The geometry of the mold was a step-plate from 10 mm to 3 mm made of silica water glass. For the cast material a secondary Al-Si-Cu alloy was used with the composition given in Table 2. After melting the alloy at 720°C in a foundry
32 Material and experimental methods
furnace, the melt was manually poured into the sand mold at an approximate constant rate during 6s. Specimens were cut from the different steps and the microstructure was analyzed by optical microscopy in order to identify the different microstructural features and defects.
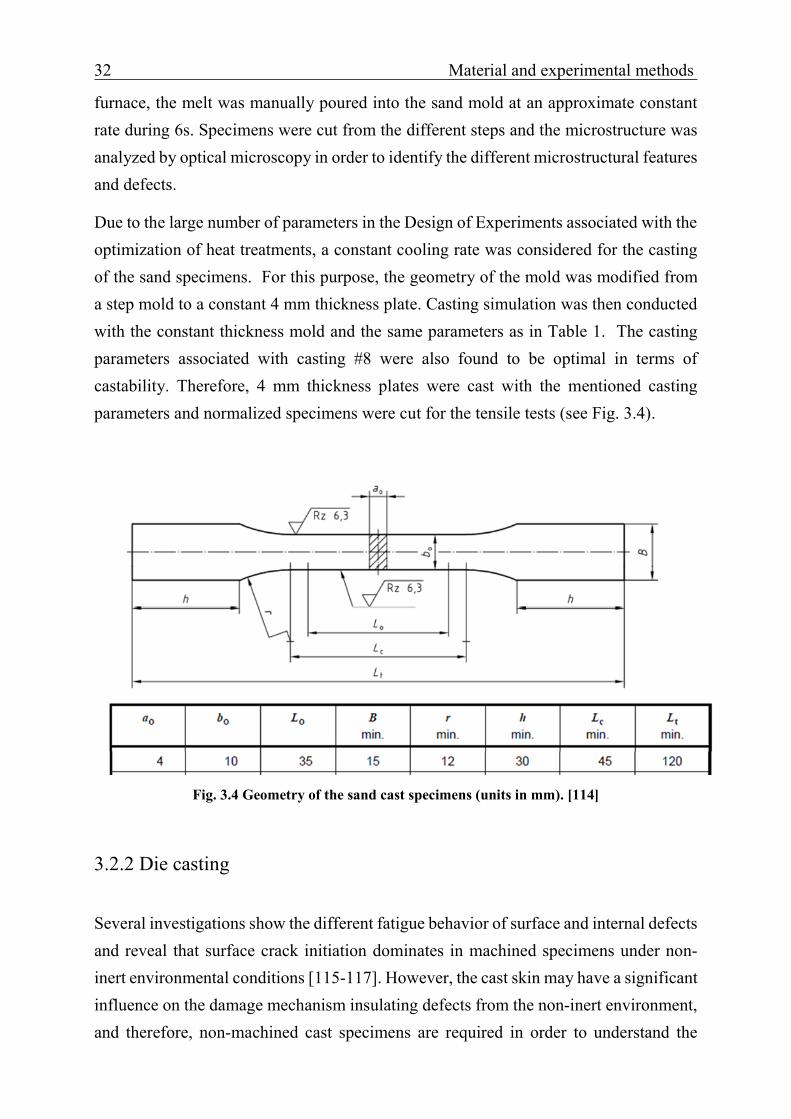
Due to the large number of parameters in the Design of Experiments associated with the optimization of heat treatments, a constant cooling rate was considered for the casting of the sand specimens. For this purpose, the geometry of the mold was modified from a step mold to a constant 4 mm thickness plate. Casting simulation was then conducted with the constant thickness mold and the same parameters as in Table 1. The casting parameters associated with casting #8 were also found to be optimal in terms of castability. Therefore, 4 mm thickness plates were cast with the mentioned casting parameters and normalized specimens were cut for the tensile tests (see Fig. 3.4).
Fig. 3.4 Geometry of the sand cast specimens (units in mm). [114]
3.2.2 Die casting
Several investigations show the different fatigue behavior of surface and internal defects and reveal that surface crack initiation dominates in machined specimens under non-inert environmental conditions [115-117]. However, the cast skin may have a significant influence on the damage mechanism insulating defects from the non-inert environment, and therefore, non-machined cast specimens are required in order to understand the
Material and experimental methods 33
effect of the defect position on the fatigue resistance of the cast Al-Si-Cu alloys. For this purpose, a die casting mold was designed in cooperation with Martin Lütje [58, 73-74,109-112] with normalized round-shape fatigue specimens.
The geometry of the fatigue specimens is shown in Fig. 3.7. The casting of finished fatigue specimens enables the fatigue testing of the material in the casting skin, which can isolate the casting defects from the air environment and enhance the sub-surface crack initiation.
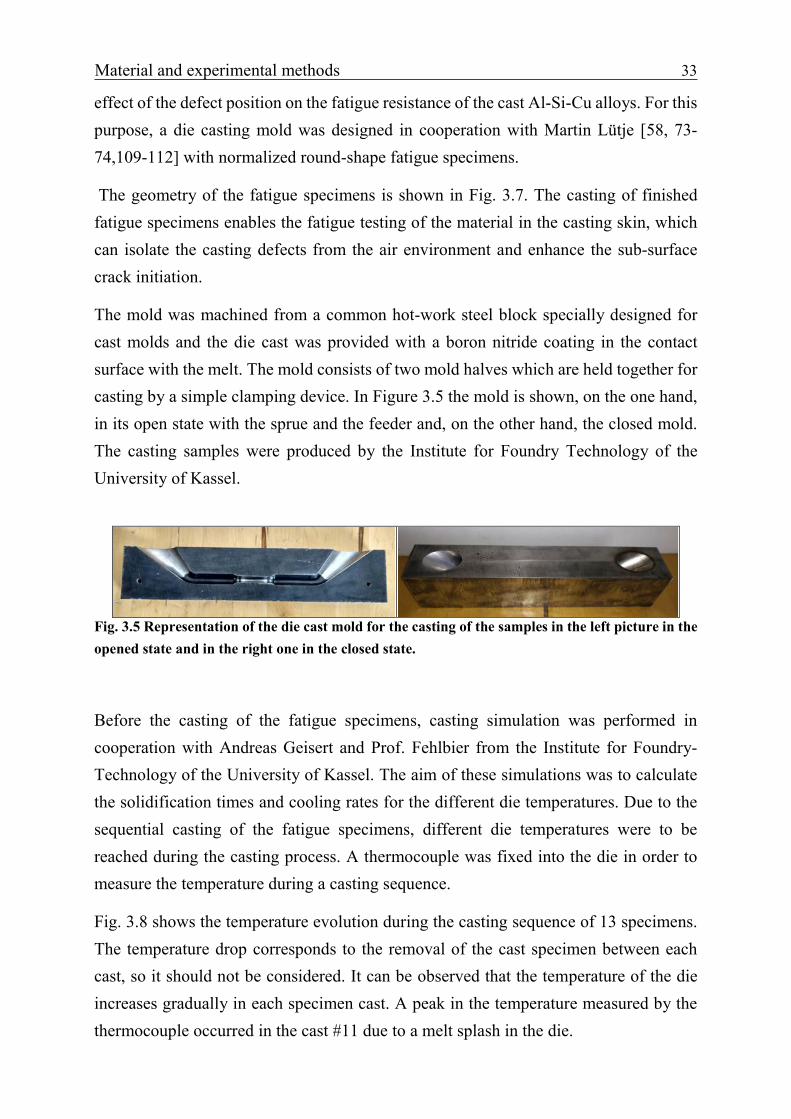
The mold was machined from a common hot-work steel block specially designed for cast molds and the die cast was provided with a boron nitride coating in the contact surface with the melt. The mold consists of two mold halves which are held together for casting by a simple clamping device. In Figure 3.5 the mold is shown, on the one hand, in its open state with the sprue and the feeder and, on the other hand, the closed mold. The casting samples were produced by the Institute for Foundry Technology of the University of Kassel.
Fig. 3.5 Representation of the die cast mold for the casting of the samples in the left picture in the opened state and in the right one in the closed state.
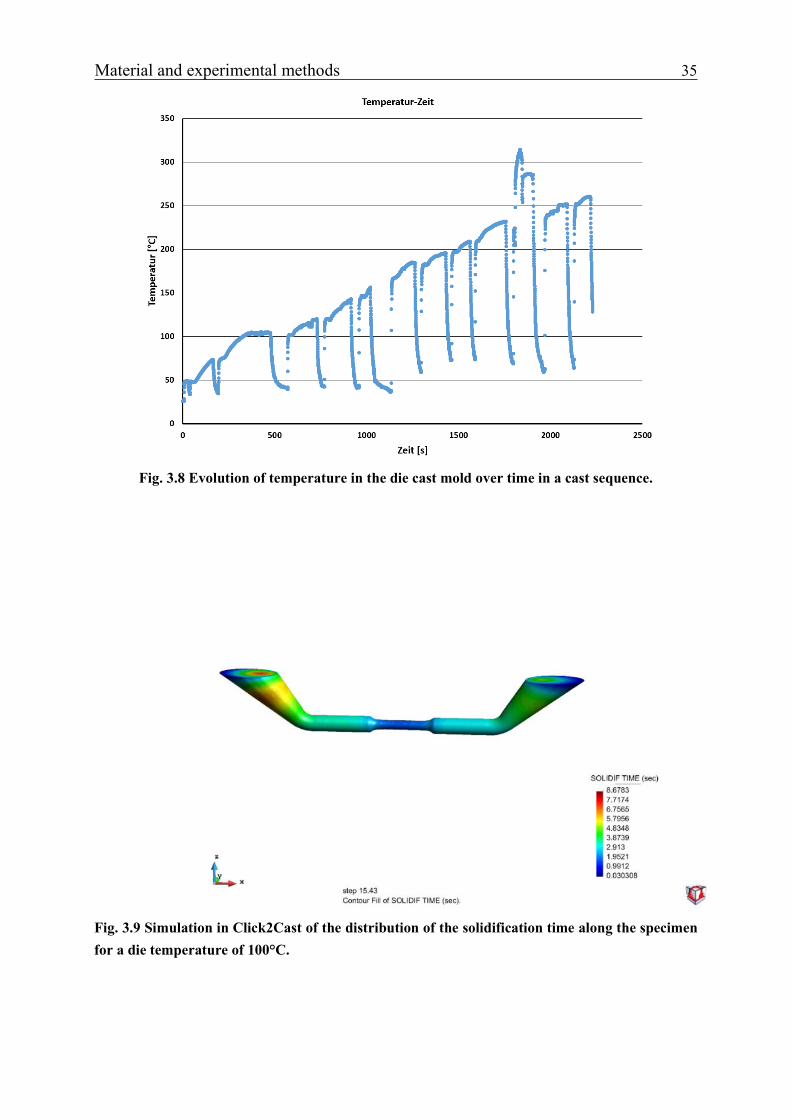
Before the casting of the fatigue specimens, casting simulation was performed in cooperation with Andreas Geisert and Prof. Fehlbier from the Institute for Foundry-Technology of the University of Kassel. The aim of these simulations was to calculate the solidification times and cooling rates for the different die temperatures. Due to the sequential casting of the fatigue specimens, different die temperatures were to be reached during the casting process. A thermocouple was fixed into the die in order to measure the temperature during a casting sequence.
Fig. 3.8 shows the temperature evolution during the casting sequence of 13 specimens. The temperature drop corresponds to the removal of the cast specimen between each cast, so it should not be considered. It can be observed that the temperature of the die increases gradually in each specimen cast. A peak in the temperature measured by the thermocouple occurred in the cast #11 due to a melt splash in the die.

34 Material and experimental methods
The measured temperatures were used for the simulation of the solidification times and cooling rates in Click2Cast [118] and MAGMA [113]. Fig. 3.9-3.10 shows an example of the distribution of the solidification time around within the specimen for a die temperature of 100°C and 200°C. Fig. 3.11 shows an example of calculated cooling rate distribution for a fatigue specimens cast in the die at room temperature. Fig. 3.12 shows the estimated micro-porosity distribution associated with the casting with the die at room temperature.
The variation in the solidification rates and cooling rates associated with the casting of each specimen lead to fatigue specimens with different characteristic defect sizes. A relative high dispersion in the defect size enabled the characterization and classification of the different damage scenarios based on their harmfulness as well as the nature of their mechanisms.
Fig. 3.6 CAD model of the die cast for the simulation in MAGMA and Click2Cast.
Fig. 3.7 Geometry of the fatigue cast specimens (units in mm).
Material and experimental methods 35
Fig. 3.8 Evolution of temperature in the die cast mold over time in a cast sequence.
Fig. 3.9 Simulation in Click2Cast of the distribution of the solidification time along the specimen for a die temperature of 100°C.

36 Material and experimental methods
Fig. 3.10 Simulation in CLikc2Cast of the distribution of the solidification time along the specimen for a die temperature of 200 °C.
Fig. 3.11 Simulation in MAGMA of the distribution of the cooling rate along the specimen for the die at room temperature.

Material and experimental methods 37
Fig. 3.12 Simulation in MAGMA of the distribution of the microporosity along the specimen for the die at room temperature.

38 Material and experimental methods
3.3 Heat treatment characterization
Before performing heat treatment parameter optimization based on the Design of Experiments (DoE), heat treatments were characterized in order to be able to accurately analyze the influence of solution temperature and solution time as well as the influence of quenching cooling rate and quenching media.
The temperature stabilization period is the time required for a specific specimen geometry to reach a certain solution temperature in a laboratory furnace. The stabilization period depends on the geometric characteristics of the specimen, such as the thickness, and on the heating power and space volume of the laboratory furnace.
In order to measure the stabilization period, three thermocouples were riveted at three equidistant points along the length of the sample in the inner part of the specimen. The thermocouples yielded the exact variation of the temperature of the samples as a function of time during the heat treatments. The thermocouples were connected to a Yokogawa MV-100 mobile recorder, which was used to record and store the value of the temperature of the sample at different times with time interval of 0.25s. It was configured in display data mode for the measurement of temperature stabilization period and in event data mode for the measurement of temperature of the sample at the intervals of 0.25 seconds during quenching process.
Measurement of the temperature stabilization period for different solution temperatures enables the precise setting of the time period for which the sample should be kept at the respective solution temperatures. Solution temperatures at 495°C, 510°C and 525°C were considered and the measured stabilization periods were 70, 72 and 75 minutes respectively.
Determination of cooling rates at different quenching media was required for analyzing the influence of cooling rate and quenching media on the microstructure and hardness of the alloy. Samples were quenched in different quenching media immediately after the completion of solution treatment. The data recorded in the Yokogawa recorder was used to plot the temperature versus time graph and hence calculate the cooling rate. It was found that the average cooling rate within the temperature range of 450°C to 200°C has the most critical influence on the strength, so average cooling rates were calculated within this temperature range from the cooling curve [119].

Material and experimental methods 39
a)
b)
Fig. 3.13 Evolution of temperature in the specimen during quenching for different quenching specimens: a) Water quench at 30°C, 40°C, 50°C, 60°C, 80°C , 85°C and 90°C with 4 mm specimens; b) Oil, Marquench, air pressure with 4 mm specimens and air pressure with 6mm specimens and room air.
Slow quenching is not suitable with water because it begins to boil at higher temperatures upon contact with the sample. The sample is surrounded by gas bubbles and cooled unevenly. The gradients were calculated here only up to 85 ° C water temperature, because at 90 ° C, this effect was already strong to observe.
50100150200250300350400450500550
2.5 3.5 4.5 5.5 6.5 7.5 8.5
Tem
pera
ture
[°C]
Time [s]
30°C
40°C
50°C
60°C
80°C
85°C
90°C
40 Material and experimental methods
For lower cooling rates several variants were tested, such as quenching with oil at room temperature and Marquench 600 polymer, which can lead to low cooling rates during quenching. In addition, specimens were cooled with room air and with compressed air through 2 nozzles at a distance of 11 cm to the sample and with a pressure of 8 bar. Moreover, the sample thickness was varied between 4 and 6 mm in order to cover additional cooling rate ranges. Some cooling curves are shown in Fig. 3.13 and a list of all interpolated cooling rates is given in Table 3.4.
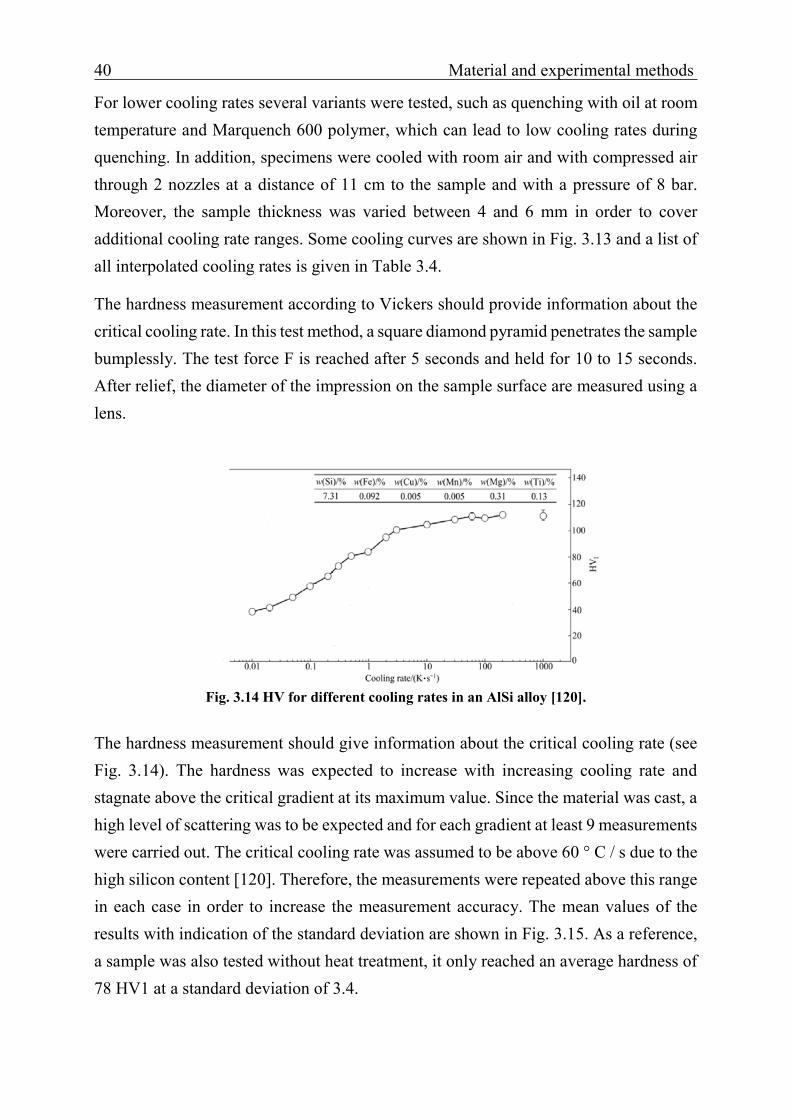
The hardness measurement according to Vickers should provide information about the critical cooling rate. In this test method, a square diamond pyramid penetrates the sample bumplessly. The test force F is reached after 5 seconds and held for 10 to 15 seconds. After relief, the diameter of the impression on the sample surface are measured using a lens.
Fig. 3.14 HV for different cooling rates in an AlSi alloy [120].
The hardness measurement should give information about the critical cooling rate (see Fig. 3.14). The hardness was expected to increase with increasing cooling rate and stagnate above the critical gradient at its maximum value. Since the material was cast, a high level of scattering was to be expected and for each gradient at least 9 measurements were carried out. The critical cooling rate was assumed to be above 60 ° C / s due to the high silicon content [120]. Therefore, the measurements were repeated above this range in each case in order to increase the measurement accuracy. The mean values of the results with indication of the standard deviation are shown in Fig. 3.15. As a reference, a sample was also tested without heat treatment, it only reached an average hardness of 78 HV1 at a standard deviation of 3.4.
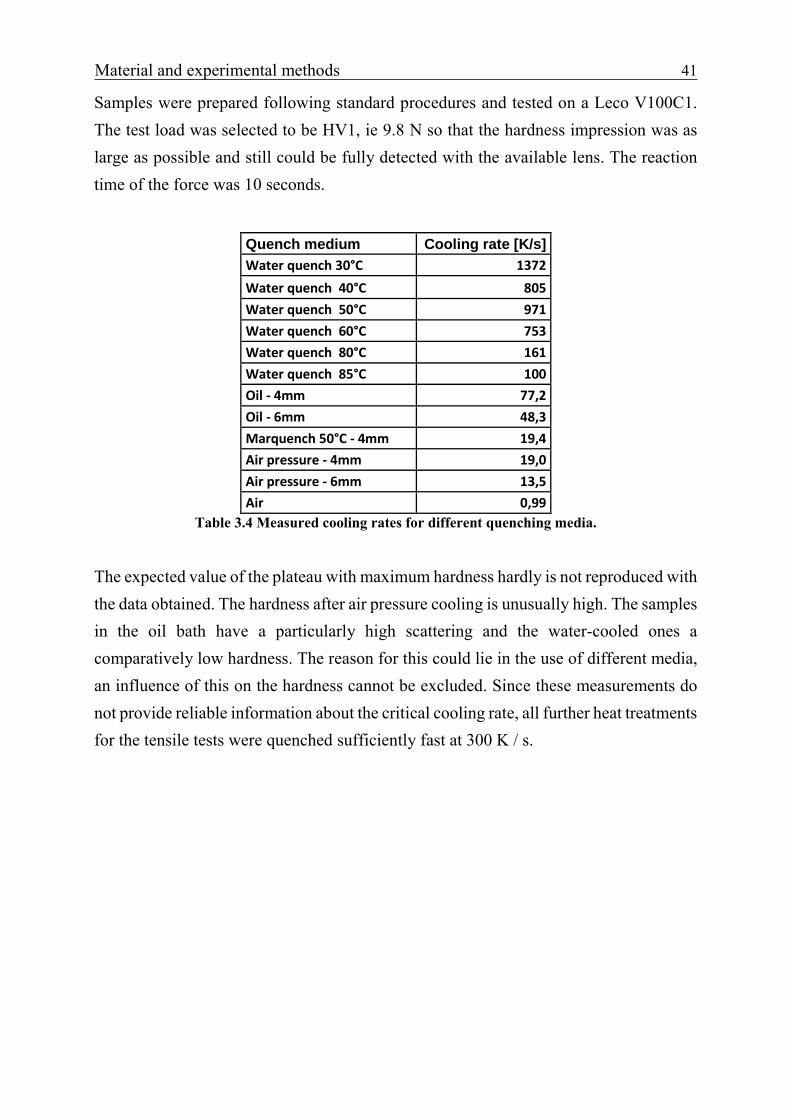
Material and experimental methods 41
Samples were prepared following standard procedures and tested on a Leco V100C1. The test load was selected to be HV1, ie 9.8 N so that the hardness impression was as large as possible and still could be fully detected with the available lens. The reaction time of the force was 10 seconds.
Quench medium Cooling rate [K/s] Water quench 30°C 1372 Water quench 40°C 805 Water quench 50°C 971 Water quench 60°C 753 Water quench 80°C 161 Water quench 85°C 100 Oil - 4mm 77,2 Oil - 6mm 48,3 Marquench 50°C - 4mm 19,4 Air pressure - 4mm 19,0 Air pressure - 6mm 13,5 Air 0,99
Table 3.4 Measured cooling rates for different quenching media.
The expected value of the plateau with maximum hardness hardly is not reproduced with the data obtained. The hardness after air pressure cooling is unusually high. The samples in the oil bath have a particularly high scattering and the water-cooled ones a comparatively low hardness. The reason for this could lie in the use of different media, an influence of this on the hardness cannot be excluded. Since these measurements do not provide reliable information about the critical cooling rate, all further heat treatments for the tensile tests were quenched sufficiently fast at 300 K / s.

42 Material and experimental methods
Fig. 3.15 Measured hardness for different cooling rates and quenching media.
Room air
Air pressure
Marquench
Oil (6 mm)
Oil (4 mm)
Water 85°C Water 80°C
Water 75°C
90
95
100
105
110
115
120
125
130
135
140
1 14 19 48 77 100 161 173
HV 1
Cooling rate K/s

Material and experimental methods 43
3.4 Microstructure characterization methods
The characterization of the microstructural features required different microscopic methods in order to achieve a balance between morphological accuracy and statistical significance. The heat treatment optimization based on the microstructural observations relied mainly on optical microscopy combined with scanning electron microscopy (SEM) in order to collect data on a high number of heat treatments. Optical microscopy enabled a time-efficient evaluation of the microstructure with the aim of analyzing the effect of different heat treatment parameters, such as solution temperature, solution time, cooling rate, quenching media, ageing temperature and ageing time. The results obtained by optical microscopy were compared and contrasted with the results from scanning electron microscopy (SEM).
Energy-dispersive X-ray spectroscopy (EDX) in SEM allowed an accurate phase characterization regarding phase composition and crystallographic structure. The combination of optical microscopy with scanning electron microscopy was a key strategy for an accurate evaluation of the microstructure for different heat treatment parameters based on the Design of Experiments (DoE). Scanning electron microscopy also enabled a precise analysis of the fracture surfaces for both tensile and fatigue specimens. The accurate analysis of the fracture surfaces was required in order to determine the damage mechanism during the mechanical tests, especially for the identification of the crack initiation sites as well as the crack propagation path.
After the heat treatment optimization, X-ray tomography was used in order to accurately characterize the three-dimensional morphology of the microstructural features and their spatial arrangement. This three-dimensional microstructural characterization method was a novel procedure to quantify the accuracy of the two-dimensional measurements of iron-rich inclusions in the as-cast state and after heat treatment. Moreover, the reconstructions of the data obtained by computed-tomography were used for FE simulation, what was key to evaluate the effect of the iron-rich inclusions on the mechanical properties of the alloy and the interaction with other microstructural features, such as shrinkage pores.

44 Material and experimental methods
3.4.1 Optical microscopy
Samples were prepared according to standard metallographic procedures. This included various steps: first, mounting the material samples in resin specimens, second, using a rotating grinding machine for mechanical abrasion with abrasive SiC sheets with 180, 320, 600, 1200, 2400 and 4000 grit size [121]; third, polishing with diamond paste of 3 µm and 1 µm sizes [122]. Finally, the specimens were polished with OPS solution of 0.05 µm. Distilled water and ethanol were used between each polishing step and the excess solution was removed with ethanol from the specimens after the OPS solution due to the corrosive attack. The potential particles attached to the specimens were removed by ultrasonic bath in ethanol and then the specimens dried with hot air. Since the contrast obtained after these grinding and polishing procedures was sufficient for the observation of the Fe-rich and Cu-rich intermetallic inclusions as well as the eutectic silicon precipitates, no etching was applied to the specimens before the observations under optical microscope. The metallographic observations were conducted with the optical microscope ZEISS Axioplan [123] and the metallographic pictures were obtained with the digital image acquisition software ZEISS AxioVision linked to the microscope. [124]. Quantitative metallography was carried out using the image analysis software ImageJ [125] with a minimum of 30 images at 200x magnification per specimen in order to generate data regarding length and area fraction of the ß-Al5FeSi inclusions.
For the quantification of the length of the ß-Al5FeSi, the average of all the measured inclusions and the average of the longest inclusion in each metallographic picture were considered. Color contrast and shape filters were also applied in order to differentiate the ß-Al5FeSi inclusions from the rest of the material. Microstructural details were also acquired by optical microscopy at 500x magnification.
3.4.2 Scanning electron microscopy (SEM)
The same specimen preparation procedures as in the case of optical microscopy were used for the microstructure observations in a scanning electron microscope. A ZEISS Ultra 55 Plus [126] high-resolution scanning electron microscope with a field emission cathode was used in order to analyze the composition of the different phases in the
Material and experimental methods 45
studied alloy as well as to characterize the fracture surfaces of the tensile and fatigue specimens. The SEM was used to investigate the crack initiation and propagation mechanisms by analyzing the crack origin in the different fracture surfaces as well as the crack path along the fractured specimen. Energy-dispersive X-ray spectroscopy (EDX) was used for the analysis of the chemical composition of the different phases in the alloy in order to accurately determine the role of the different inclusions on the damage mechanism. The EDX examinations were performed with the ESPRIT 2.1 software from Bruker [127]. Prior to microscopic analysis in the SEM, the specimens were subjected to plasma cleaning in vacuum during 10 minutes.
The SEM is very well suited for the analysis of fractures surfaces due to its high depth of field and secondary electron detector (SE2 detector). An acceleration voltage of 20 KV and an aperture diaphragm of 30 µm was generally used for the mapping of the topography in the fracture surfaces and draw conclusions about the origin of the crack initiation.
A backscatter detector (BSD detector), which images the diffracted primary electrons and thus provides in-depth information on the microstructural features, was used for a more detailed analysis of the crack path at 20 KV acceleration voltage. The EDX analysis were also performed at 20 KV acceleration voltage, but at an aperture of 120 µm. The working distance of the detector was set at around 11 mm to obtain a resolution
of between 1-2 µm for the different analyses.
3.4.3 X-ray tomography (µ-CT)
The three-dimensional measurements were carried out with a ZEISS Xradia Versa 520 [128] X-ray microscope from the University of Kassel in cooperation with Martin Lütje [58,73-74,109-112]. Traditional projection-based micro-CT techniques rely on high geometric magnification to achieve high resolution and require a small spot size to minimize geometric penumbra and imposes very small working distances. On the contrary, the Xradia 520 Versa employs high detector resolution (rD), allowing samples to be imaged up to 0.7 µm resolution without relying on high geometric magnification.
Cubic samples of 4 mm size were used for the tomographic analysis of the ß-Al5FeSi inclusions, whereas 7 mm diameter normalized round specimens for the analysis of
46 Material and experimental methods
fracture surfaces. After positioning the specimen in the scan holder specially designed by ZEISS for µ-CT scans, source and detector distances with respect to the specimens were selected. The Region of Interest (ROI) was aligned to the center of the samples holder in order to allow maximum flexibility for source and detector positioning.
A source distance of about 20 mm and the 4X objective was used to enhance absorption contrast, and various detector distances were considered to achieve good resolutions for the different analyses. Absorption contrast enhances contrast between different phases and the Al-matrix, since absorption differences can be detected with low energy X-ray photons.
For the selection of the filter, the voltage was initially set at 80 KV and an image was captured without filter to measure the transmission rate. Depending on the result of the transmission rate, a certain filter was selected for the analysis. After setting the required filter, another image was captured at 80 KV voltage. If the measured transmission rate was above 35% or below 20%, the voltage was modified to achieve a transmission rate between 20% and 35%. An optimal voltage of 60 KV was considered for the X-ray analysis, with a current of 85.6 μA. 995 radiographs were captured with a resolution of 1.0-3.0 μm and an exposure time of 10-15 s for the different analysis. The samples were automatically rotated during the analysis, pausing at discrete angles to collect 2D projection images.
Prior to the main 3D tomography analysis, a Warm-Up analysis was conducted for 1 hour to reach a stable working temperature. Projection images were then combined together to produce a 3D reconstruction of the volume of the sample. Multiple references are automatically acquired throughout the 3D tomographic acquisition. This improves image quality by having more representative references.
After the images during the µ-CT analysis had been acquired, the acquired radiographs were reconstructed with “TXM Reconstructor” (ZEISS) software, setting an optimal beam-hardening and center-shift to improve contrast differences between the microstructural features. The reconstruction data were saved as DICOM files for the segmentation of the Fe-rich inclusions and the pores.

Material and experimental methods 47
3.4.4 3D segmentation
The DICOM files were exported to the commercial rendering package Avizo software [129]. A non-local means filter was applied in order to enhance the grayscale contrast between the Fe-rich inclusions and the Al-matrix. The ß-Al5FeSi inclusions were manually segmented and automatically interpolated along the slides. The casting pores were segmented with a multi-grayscale thresholding tool. After segmenting the ß-Al5FeSi particles and shrinkage pores data of volume, surface and maximum Feret size of each defect were obtained with the Label Analysis option. For the simulation of the casting defects, a surface model of the defect was created in Avizo and the exported as STL file.
The exported models are not suitable for performing numerical computations directly since the STL files only describe the surface geometry of each pore without any representation of the common CAD attributes. Therefore, the local pore geometry reconstructed by μ-CT was first converted into a 3D volumetric model using the commercial software Geomagic Studio 14 [130]. After importing the STL-triangulated surface, the polygon mesh was retriangulated to produce a more uniform tessellation. In addition, imperfections were automatically repaired and the coordinate system was centered in the pore center of gravity to facilitate the following numerical investigation.
The subsequent generation of a Non-Uniform Rational B-Spline (NURBS) surface was developed by the decomposition of the polygonal model into quadrangular patches. Regions with relative low-curvature portions were detected, allowing a separate specification of the NURBS parameters in the flat and curved areas. Once the initially produced patch layout was locally optimized, an ordered grid was constructed within each patch and finally the NURBS surface, whose precision is affected by the density of the grid, was computed.
3.4.5 FE simulation
For the Finite Element simulation of the detrimental effect of the iron-rich inclusions on the mechanical properties of Al-Si alloy, the methods developed by Marcel Wicke (Prof. Brückner-Foit) in the University of Kassel [131] were used in order to calculate the stress concentrations on the iron-rich inclusions for different stress states. The largest

48 Material and experimental methods
identified ß-Al5FeSi inclusion and shrinkage pore were separately segmented and exported to a commercial software (ABAQUS) [132] for the calculation of the local stress concentration factors (Kt). After inserting the casting defects in an FE model of a cylindrical volume representing the matrix material, a uniaxial displacement was imposed to the upper surface of the cylinder to simulate a quasi-static tensile test. The element type used for meshing was the ten-node quadratic tetrahedral element (C3D10) of the ABAQUS code.
The pores were inserted as cavities and the ß-Al5FeSi particles were assumed to be stiff elastic solids, with a Young’s modulus of 150 GPa and Poisson’s ratio of 0.28 [133], whereas for the matrix material a Young´s modulus of 70 GPa and Poisson´s ratio of 0.3 were used. In order to correctly evaluate the local stress concentrations, a convergence study was performed [131]. The region close to the defects was modelled with a refined mesh and the convergence of the model was achieved. The stress concentration factor (Kt) was defined as the ratio between the peak von Mises stress and the nominal far-field stress [135].
Three rotation angles φ, ψ and χ around the x, y and z axis of the coordinate system centered in the defect center of gravity were defined, which were simultaneously rotated around these axes from 0° to 360° in steps of 45° (512 configurations). A new FE model was thus generated for each configuration to be solved for the identification of critical regions in terms of local stress concentrations.
The effect of non-equilibrium heat treatments 49
4 Effect of non-equilibrium heat
treatments on microstructure and tensile properties of an Al-Si-Cu alloy
50 The effect of non-equilibrium heat treatments
The T6-heat treatment parameters were optimized following the established Design of Experiments (DoE) and the dissolution and fragmentation of the iron-rich inclusions were analyzed in detail as well as the effect on the mechanical properties of the studied alloy. Firstly, the influence of the heat treatment parameters on the microstructure was analyzed by measuring the eutectic silicon and iron-rich inclusion sizes for different solution temperature and time. Parallel to the above procedure, tensile tests were performed with specimens subjected to different heat treatments following the same DoE. After the optimization of the solution treatment parameters, the ageing treatment parameters were optimized for the optimal heat treatment. The fracture surfaces of the tensile specimens were analyzed in a scanning electron microscope (SEM) in order to determine the damage mechanisms of the alloy for different heat treatments.
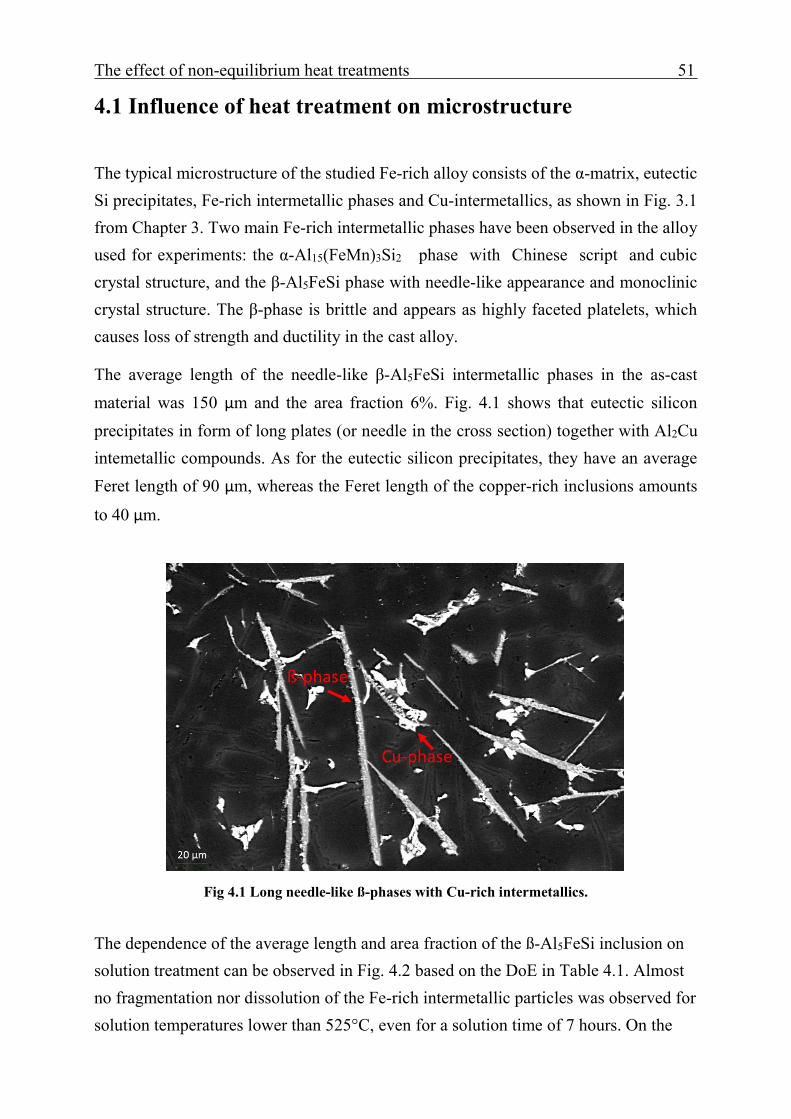
The effect of non-equilibrium heat treatments 51
4.1 Influence of heat treatment on microstructure
The typical microstructure of the studied Fe-rich alloy consists of the α-matrix, eutectic Si precipitates, Fe-rich intermetallic phases and Cu-intermetallics, as shown in Fig. 3.1 from Chapter 3. Two main Fe-rich intermetallic phases have been observed in the alloy used for experiments: the α-Al15(FeMn)3Si2 phase with Chinese script and cubic crystal structure, and the β-Al5FeSi phase with needle-like appearance and monoclinic crystal structure. The β-phase is brittle and appears as highly faceted platelets, which causes loss of strength and ductility in the cast alloy.
The average length of the needle-like β-Al5FeSi intermetallic phases in the as-cast material was 150 µm and the area fraction 6%. Fig. 4.1 shows that eutectic silicon precipitates in form of long plates (or needle in the cross section) together with Al2Cu intemetallic compounds. As for the eutectic silicon precipitates, they have an average Feret length of 90 µm, whereas the Feret length of the copper-rich inclusions amounts
to 40 µm.
Fig 4.1 Long needle-like ß-phases with Cu-rich intermetallics.
The dependence of the average length and area fraction of the ß-Al5FeSi inclusion on solution treatment can be observed in Fig. 4.2 based on the DoE in Table 4.1. Almost no fragmentation nor dissolution of the Fe-rich intermetallic particles was observed for solution temperatures lower than 525°C, even for a solution time of 7 hours. On the
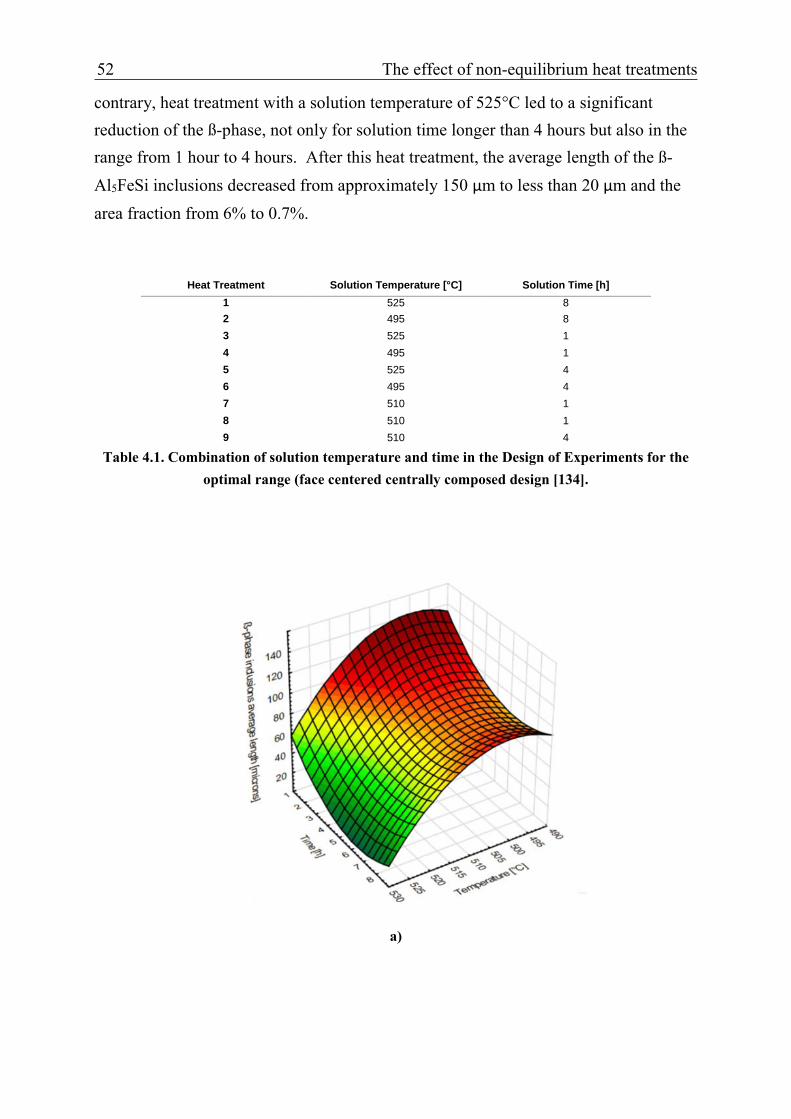
52 The effect of non-equilibrium heat treatments
contrary, heat treatment with a solution temperature of 525°C led to a significant reduction of the ß-phase, not only for solution time longer than 4 hours but also in the range from 1 hour to 4 hours. After this heat treatment, the average length of the ß-Al5FeSi inclusions decreased from approximately 150 µm to less than 20 µm and the area fraction from 6% to 0.7%.
Heat Treatment Solution Temperature [°C] Solution Time [h] 1 525 8 2 495 8 3 525 1 4 495 1 5 525 4 6 495 4 7 510 1 8 510 1 9 510 4
Table 4.1. Combination of solution temperature and time in the Design of Experiments for the optimal range (face centered centrally composed design [134].
a)
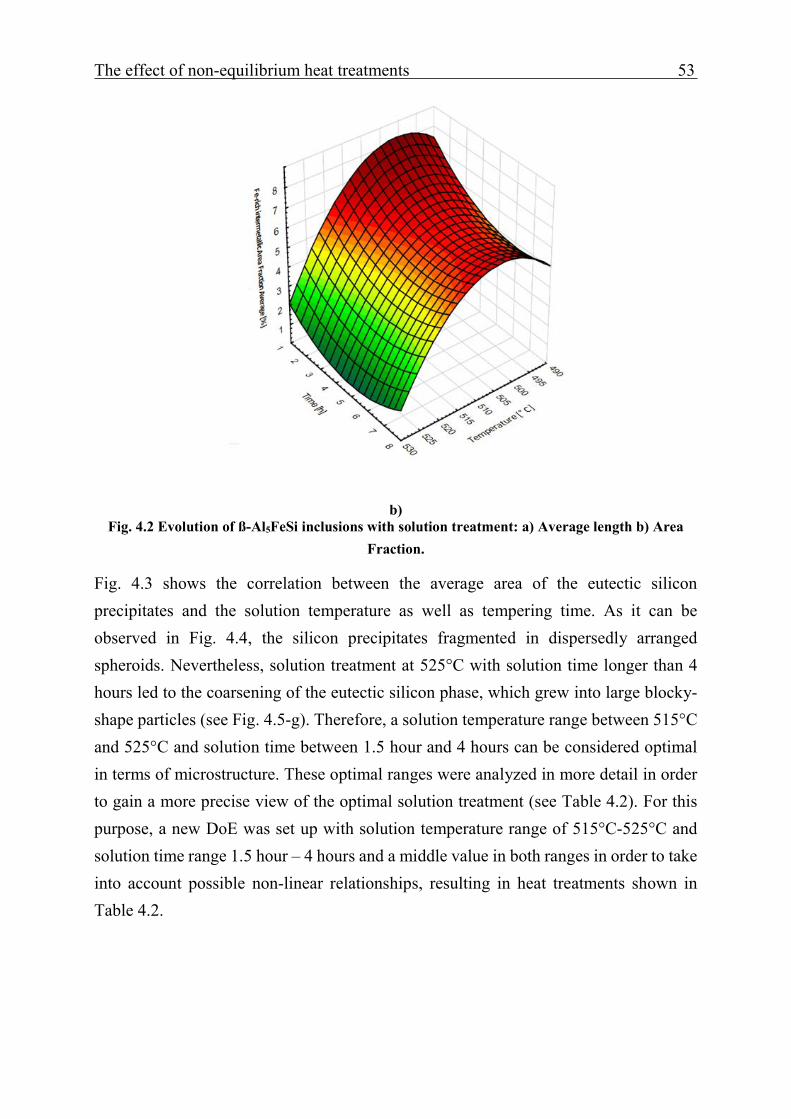
The effect of non-equilibrium heat treatments 53
b) Fig. 4.2 Evolution of ß-Al5FeSi inclusions with solution treatment: a) Average length b) Area
Fraction.
Fig. 4.3 shows the correlation between the average area of the eutectic silicon precipitates and the solution temperature as well as tempering time. As it can be observed in Fig. 4.4, the silicon precipitates fragmented in dispersedly arranged spheroids. Nevertheless, solution treatment at 525°C with solution time longer than 4 hours led to the coarsening of the eutectic silicon phase, which grew into large blocky-shape particles (see Fig. 4.5-g). Therefore, a solution temperature range between 515°C and 525°C and solution time between 1.5 hour and 4 hours can be considered optimal in terms of microstructure. These optimal ranges were analyzed in more detail in order to gain a more precise view of the optimal solution treatment (see Table 4.2). For this purpose, a new DoE was set up with solution temperature range of 515°C-525°C and solution time range 1.5 hour – 4 hours and a middle value in both ranges in order to take into account possible non-linear relationships, resulting in heat treatments shown in Table 4.2.
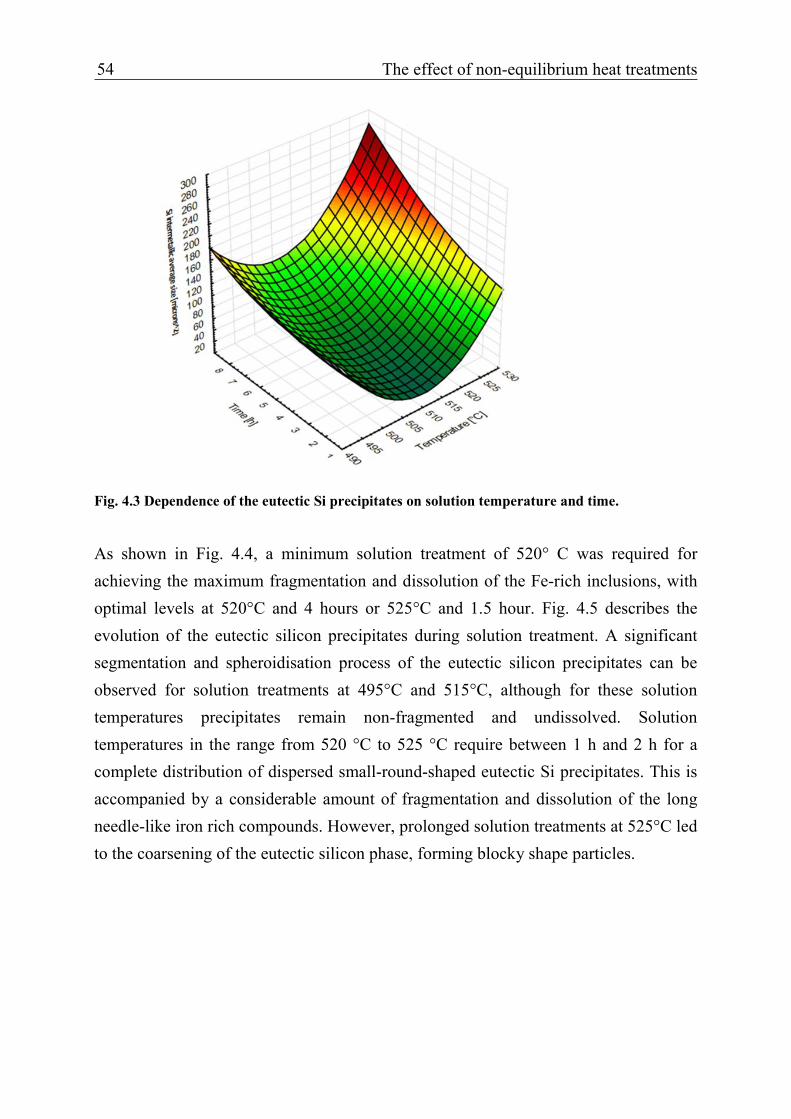
54 The effect of non-equilibrium heat treatments
Fig. 4.3 Dependence of the eutectic Si precipitates on solution temperature and time.
As shown in Fig. 4.4, a minimum solution treatment of 520° C was required for achieving the maximum fragmentation and dissolution of the Fe-rich inclusions, with optimal levels at 520°C and 4 hours or 525°C and 1.5 hour. Fig. 4.5 describes the evolution of the eutectic silicon precipitates during solution treatment. A significant segmentation and spheroidisation process of the eutectic silicon precipitates can be observed for solution treatments at 495°C and 515°C, although for these solution temperatures precipitates remain non-fragmented and undissolved. Solution temperatures in the range from 520 °C to 525 °C require between 1 h and 2 h for a complete distribution of dispersed small-round-shaped eutectic Si precipitates. This is accompanied by a considerable amount of fragmentation and dissolution of the long needle-like iron rich compounds. However, prolonged solution treatments at 525°C led to the coarsening of the eutectic silicon phase, forming blocky shape particles.
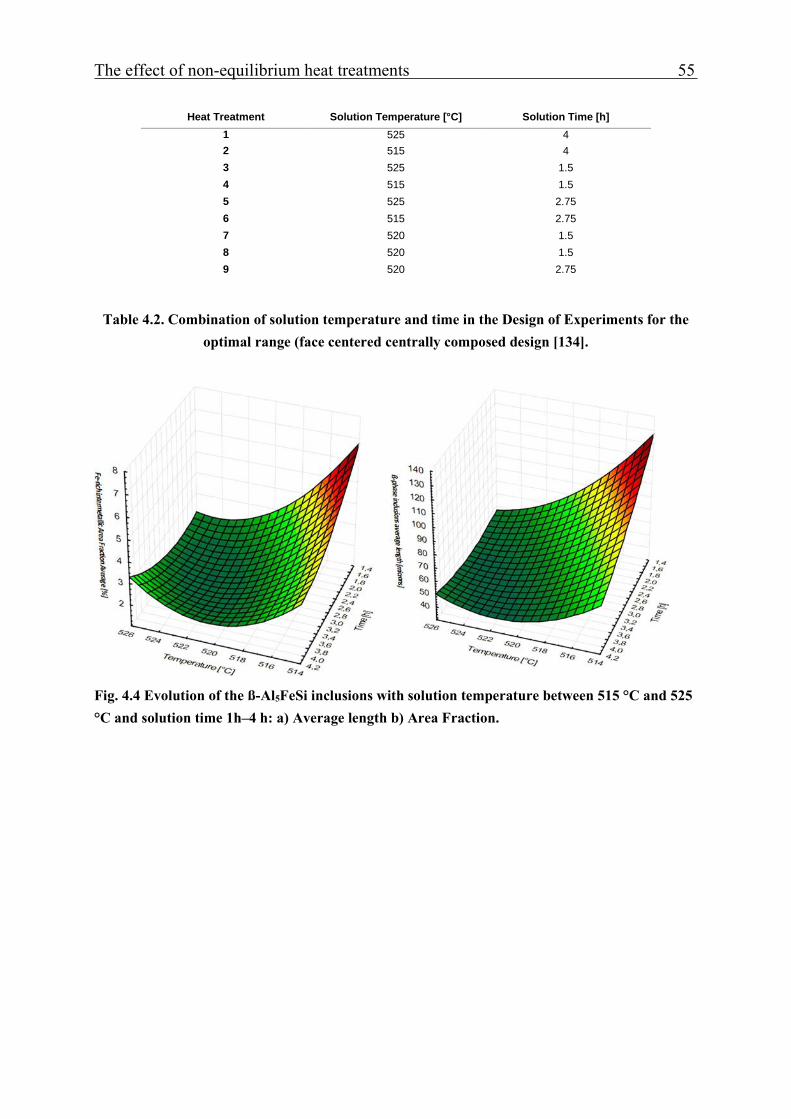
The effect of non-equilibrium heat treatments 55
Heat Treatment Solution Temperature [°C] Solution Time [h]
1 525 4 2 515 4 3 525 1.5 4 515 1.5 5 525 2.75 6 515 2.75 7 520 1.5 8 520 1.5 9 520 2.75
Table 4.2. Combination of solution temperature and time in the Design of Experiments for the optimal range (face centered centrally composed design [134].
Fig. 4.4 Evolution of the ß-Al5FeSi inclusions with solution temperature between 515 °C and 525 °C and solution time 1h–4 h: a) Average length b) Area Fraction.

56 The effect of non-equilibrium heat treatments
a) Non-treated e) 525°C, 1 h
b) 495°C, 4 h f) 520°C, 4 h
c) 495°C, 8 h g) 525°C, 8 h
d) 510°C, 4 h h) 525°C, 7 h
Fig. 4.5 Evolution of microstructure with solution treatment.

The effect of non-equilibrium heat treatments 57
Holding solution time longer than 4 hours at 520° C caused the incipient melting of copper intermetallic precipitates (see Fig.4.6). The holes in the microghaphs correspond to the spherical liquid droplets of the molten Cu-rich compounds that fell out during the polishing of the specimens. The local melting seems to start at grain boundaries together the coarsening process of the eutectic silicon. Solution times longer than 4 hours at 520°C – 525°C led to the total coarsening of the eutectic silicon particle with an increase of liquid of melted copper phases of about 2%.
The decrease of the average length of the ß-Al5FeSi is explained by the fragmentation of these inclusions into smaller segments (usually three) that are seen to undergo a subsequent dissolution process that starts at the tips and continues all around the periphery of the compound, as a result of which the area fraction of the ß-phase decreases (see Fig. 4.7).
Fig. 4.6 Incipient local melting of copper intermetallics after solution treatment at 525°C for 4h.

58 The effect of non-equilibrium heat treatments
Fig. 4.7. Fragmentation and dissolution mechanism of long-needle-like ß-Al5FeSi.

The effect of non-equilibrium heat treatments 59
4.2 Influence of heat-treatment on mechanical properties
An average ultimate strength (UTS) of 154 MPa and elongation (EL) of 0.48% was obtained for the as-cast alloy. The average UTS range from 156 MPa to 270 MPa and EL from 0.41% to 1.73% in the whole set of tests performed based on the DoE. Fig. 4.8 shows the dependence of the average UTS and EL on solution temperature and time.
(a)
(b)
Fig. 4.8 Ultimate Strength (a) and Elongation (b) for solution temperature between 495°C-525°C and solution time 1 h – 11 h.

60 The effect of non-equilibrium heat treatments
For both 495 °C and 510 °C solution temperatures, the average UTS increased from 170 MPa for 1 hour solution time to almost 220 MPa for 4 hours and 7 hours treatments. The highest UTS was obtained at 525 °C and 1 hour time with an average UTS of 271 MPa, although for longer solution times the average tensile strength dropped sharply to 168 MPa. Elongation values increased with solution temperature and time with a maximum value of 1.7% at 525 °C and 4 hour solution time.
(a)
(b)
Fig. 4.9 Ultimate Strength and Elongation for ageing temperature between 160°C-220°C and solution time 1 h – 11 h.

The effect of non-equilibrium heat treatments 61
These results match with the microstructural observations reported in the previous chapter. The tensile strength and ductility increase slightly for solution temperatures in the range 495 °C– 515 °C due to the fragmentation and spheroidisation of the silicon precipitates, but the lack of dissolved ß-Al5FeSi hinders a larger improvement of the tensile properties. At 525 °C and 1 hour solution treatment, UTS reaches the maximum value, as this is the solution treatment in which a considerable amount of fragmentation and dissolution of ß-Al5FeSi can be found together with spheroidized eutectic silicon. The coarsening of Si precipitates for solution time longer than 2 h at 525 °C leads to a significant loss of tensile strength, although ductility is not affected by this fact.

62 The effect of non-equilibrium heat treatments
4.3 Fracture surface analysis
The fracture surface of the tensile specimens were evaluated in a scanning electron microscope (SEM) in order to determine the damage mechanism for the untreated and heat-treated alloy, especially with respect to failure behavior.
Fig. 4.10 shows a SEM fractograph obtained from the fracture surface of an untreated tensile specimen. Typical cleavage fracture can be observed, in which the fracture plane follows a transcrystalline plane and failure occurs by cleavage of a massive brittle ß-Al5FeSi platelet. The iron rich ß-phases that appear as long-needle-like inclusions in 2D micrographs are seen as smooth platelets with copper intermetallic compounds in the vicinity and surrounded by eutectic silicon precipitates that are also in form of large platelets fractured by transgranular cleavage mechanism. The main crack propagates in the direction of the cleavage ß-A5FeSi and secondary cracks are also visible around the iron rich platelet, which reveals the brittle nature of the ß-phases and their susceptibility to initiate cracks. Fig. 4.11 provides similar examples of fracture surfaces of the non-treated samples. As expected, cleavage fracture of large ß-Al5FeSi and silicon precipitates can be observed along which cracks extend and cause brittle failure.
Fig. 4.10 SEM fractograph of an as-cast fractured tensile specimen.
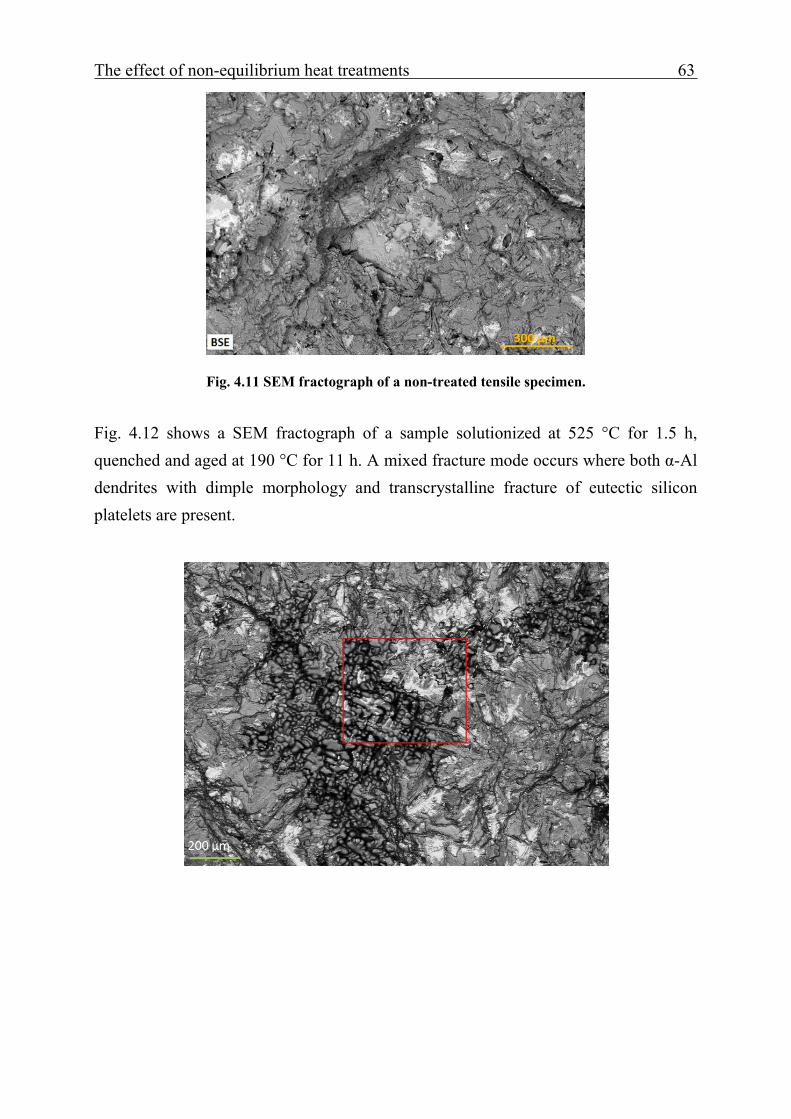
The effect of non-equilibrium heat treatments 63
Fig. 4.11 SEM fractograph of a non-treated tensile specimen.
Fig. 4.12 shows a SEM fractograph of a sample solutionized at 525 °C for 1.5 h, quenched and aged at 190 °C for 11 h. A mixed fracture mode occurs where both α-Al dendrites with dimple morphology and transcrystalline fracture of eutectic silicon platelets are present.
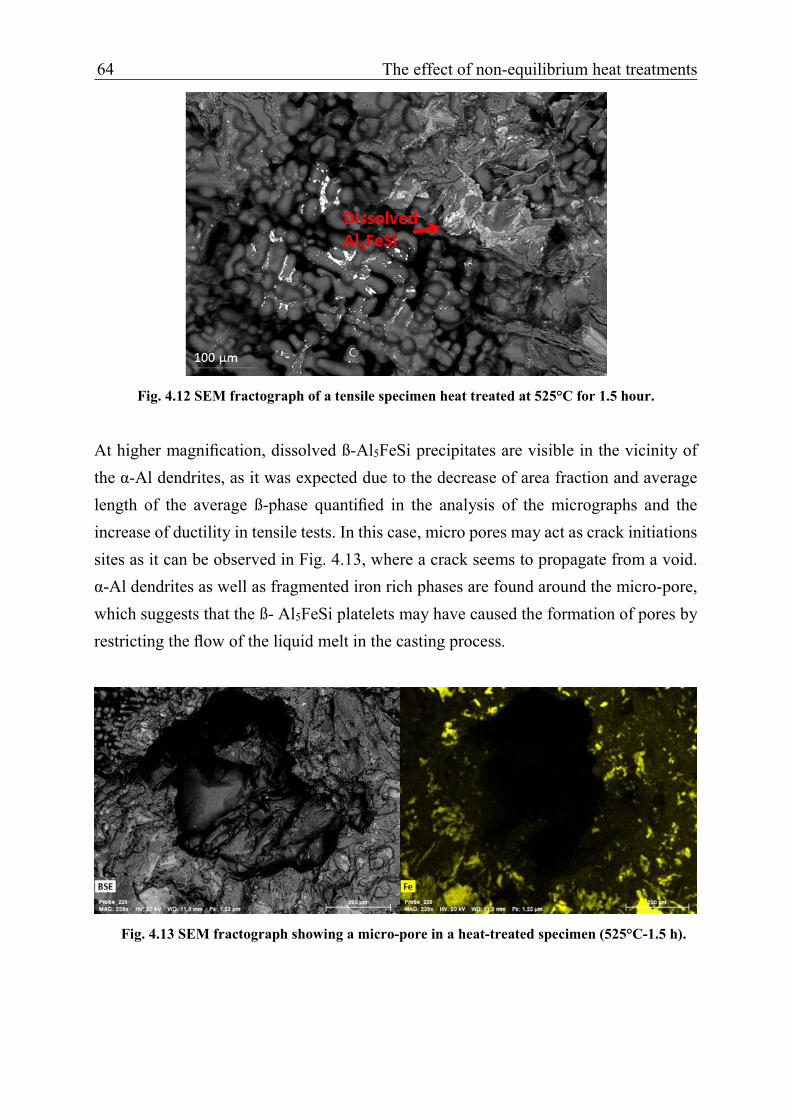
64 The effect of non-equilibrium heat treatments
Fig. 4.12 SEM fractograph of a tensile specimen heat treated at 525°C for 1.5 hour.
At higher magnification, dissolved ß-Al5FeSi precipitates are visible in the vicinity of the α-Al dendrites, as it was expected due to the decrease of area fraction and average length of the average ß-phase quantified in the analysis of the micrographs and the increase of ductility in tensile tests. In this case, micro pores may act as crack initiations sites as it can be observed in Fig. 4.13, where a crack seems to propagate from a void. α-Al dendrites as well as fragmented iron rich phases are found around the micro-pore, which suggests that the ß- Al5FeSi platelets may have caused the formation of pores by restricting the flow of the liquid melt in the casting process.
Fig. 4.13 SEM fractograph showing a micro-pore in a heat-treated specimen (525°C-1.5 h).
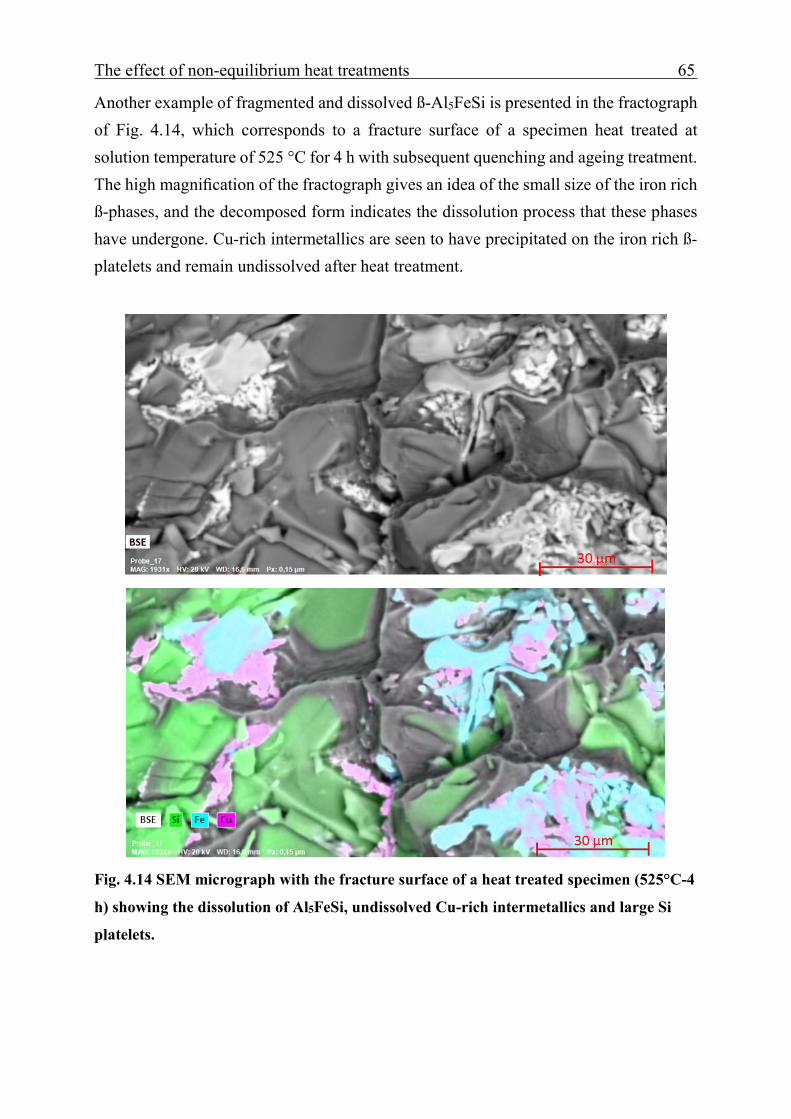
The effect of non-equilibrium heat treatments 65
Another example of fragmented and dissolved ß-Al5FeSi is presented in the fractograph of Fig. 4.14, which corresponds to a fracture surface of a specimen heat treated at solution temperature of 525 °C for 4 h with subsequent quenching and ageing treatment. The high magnification of the fractograph gives an idea of the small size of the iron rich ß-phases, and the decomposed form indicates the dissolution process that these phases have undergone. Cu-rich intermetallics are seen to have precipitated on the iron rich ß-platelets and remain undissolved after heat treatment.
Fig. 4.14 SEM micrograph with the fracture surface of a heat treated specimen (525°C-4
h) showing the dissolution of Al5FeSi, undissolved Cu-rich intermetallics and large Si
platelets.
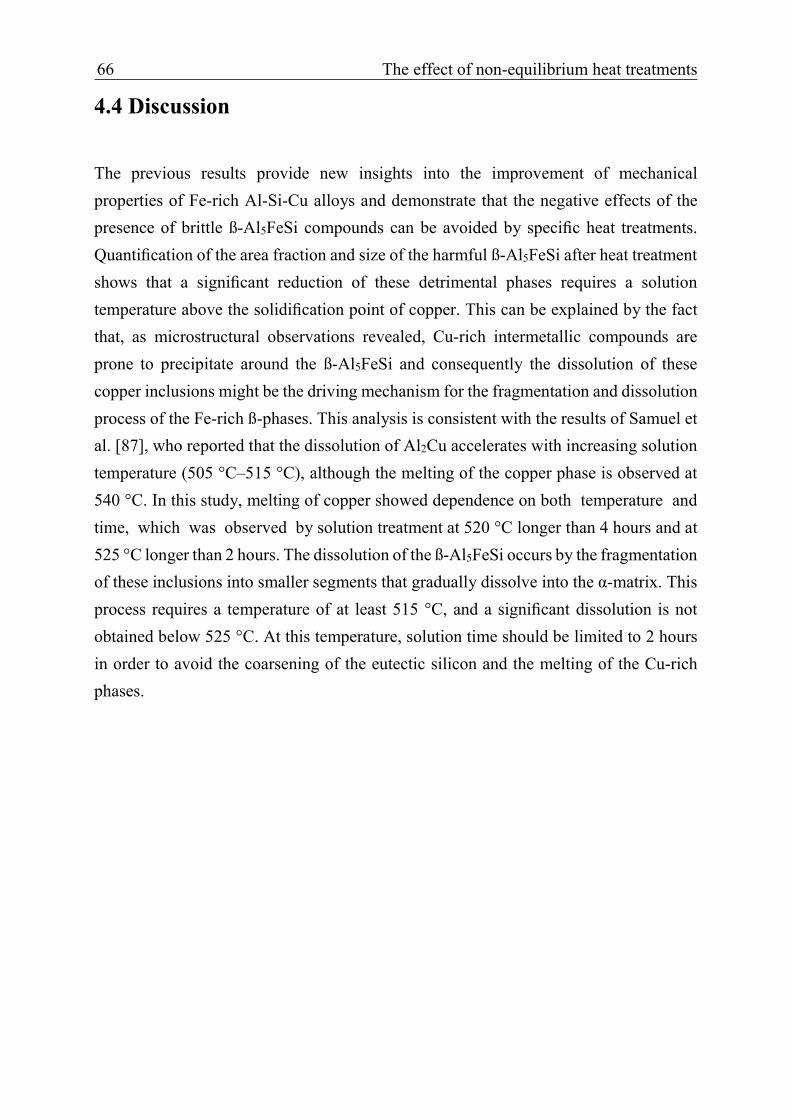
66 The effect of non-equilibrium heat treatments
4.4 Discussion
The previous results provide new insights into the improvement of mechanical properties of Fe-rich Al-Si-Cu alloys and demonstrate that the negative effects of the presence of brittle ß-Al5FeSi compounds can be avoided by specific heat treatments. Quantification of the area fraction and size of the harmful ß-Al5FeSi after heat treatment shows that a significant reduction of these detrimental phases requires a solution temperature above the solidification point of copper. This can be explained by the fact that, as microstructural observations revealed, Cu-rich intermetallic compounds are prone to precipitate around the ß-Al5FeSi and consequently the dissolution of these copper inclusions might be the driving mechanism for the fragmentation and dissolution process of the Fe-rich ß-phases. This analysis is consistent with the results of Samuel et al. [87], who reported that the dissolution of Al2Cu accelerates with increasing solution temperature (505 °C–515 °C), although the melting of the copper phase is observed at 540 °C. In this study, melting of copper showed dependence on both temperature and time, which was observed by solution treatment at 520 °C longer than 4 hours and at 525 °C longer than 2 hours. The dissolution of the ß-Al5FeSi occurs by the fragmentation of these inclusions into smaller segments that gradually dissolve into the α-matrix. This process requires a temperature of at least 515 °C, and a significant dissolution is not obtained below 525 °C. At this temperature, solution time should be limited to 2 hours in order to avoid the coarsening of the eutectic silicon and the melting of the Cu-rich phases.

The effect of non-equilibrium heat treatments 67
4.5 Conclusions
The influence of the different heat treatment parameters on the morphology of the ß-Al5FeSi as well as the tensile properties have been methodologically analyzed. Based on the results from the present study, the following may be concluded:
(1) The iron rich ß-phases undergo considerable fragmentation and dissolution for
solution treatments at 520 °C–525 °C for more than 1 hour. Increasing solution time more than 2 h leads to incipient coarsening of eutectic Si precipitates and melting of Cu- rich intermetallic inclusions. The fragmentation and dissolution of ß-Al5FeSi for solution treatments at lower temperatures is very limited.
(2) The maximum ultimate strength was obtained at a solution temperature of 525 °C and solution time 1.5 hour. Solution times longer than 2 hours at 525 °C originate a sharp decrease of ultimate tensile strength. The highest ductility is associated to solution temperatures at 525 °C, with a peak value for 4 h solution time.
(3) After solution treatment at 525 °C for 1.5 hour and ageing treatment at 190 °C for 11 hours or at 220 °C for 6 hours is optimal in terms of both ultimate strength and ductility.
(4) Fractography results indicate a ductile fracture mode at a solution temperature of 525 °C for 1.5 hour with dimpled structure of α-Al dendrites and dissolved ß-Al5FeSi.
(5) In the as-cast alloy ß-Al5FeSi intermetallic inclusions are seen as massive smooth platelets that act as main fracture initiation sites. After heat treatment at 525 °C for 1.5 hour, the Fe-rich ß- phase platelets have a fragmented and dissolved morphology.
68 Characterization of the Fe-rich inclusions
5 Characterization of the ß-Al5FeSi inclusions in a Fe-rich Al-Si-Cu alloy by X-ray tomography and Finite Element analysis
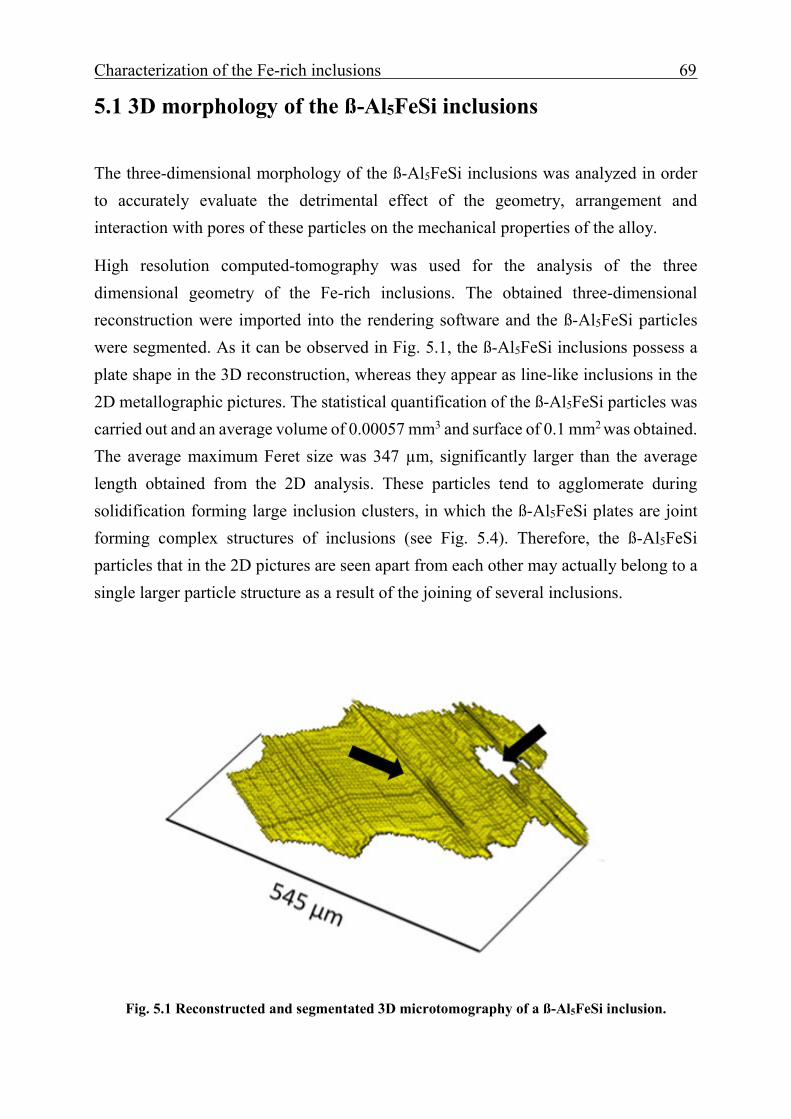
Characterization of the Fe-rich inclusions 69
5.1 3D morphology of the ß-Al5FeSi inclusions
The three-dimensional morphology of the ß-Al5FeSi inclusions was analyzed in order to accurately evaluate the detrimental effect of the geometry, arrangement and interaction with pores of these particles on the mechanical properties of the alloy.
High resolution computed-tomography was used for the analysis of the three dimensional geometry of the Fe-rich inclusions. The obtained three-dimensional reconstruction were imported into the rendering software and the ß-Al5FeSi particles were segmented. As it can be observed in Fig. 5.1, the ß-Al5FeSi inclusions possess a plate shape in the 3D reconstruction, whereas they appear as line-like inclusions in the 2D metallographic pictures. The statistical quantification of the ß-Al5FeSi particles was carried out and an average volume of 0.00057 mm3 and surface of 0.1 mm2 was obtained. The average maximum Feret size was 347 µm, significantly larger than the average length obtained from the 2D analysis. These particles tend to agglomerate during solidification forming large inclusion clusters, in which the ß-Al5FeSi plates are joint forming complex structures of inclusions (see Fig. 5.4). Therefore, the ß-Al5FeSi particles that in the 2D pictures are seen apart from each other may actually belong to a single larger particle structure as a result of the joining of several inclusions.
Fig. 5.1 Reconstructed and segmentated 3D microtomography of a ß-Al5FeSi inclusion.
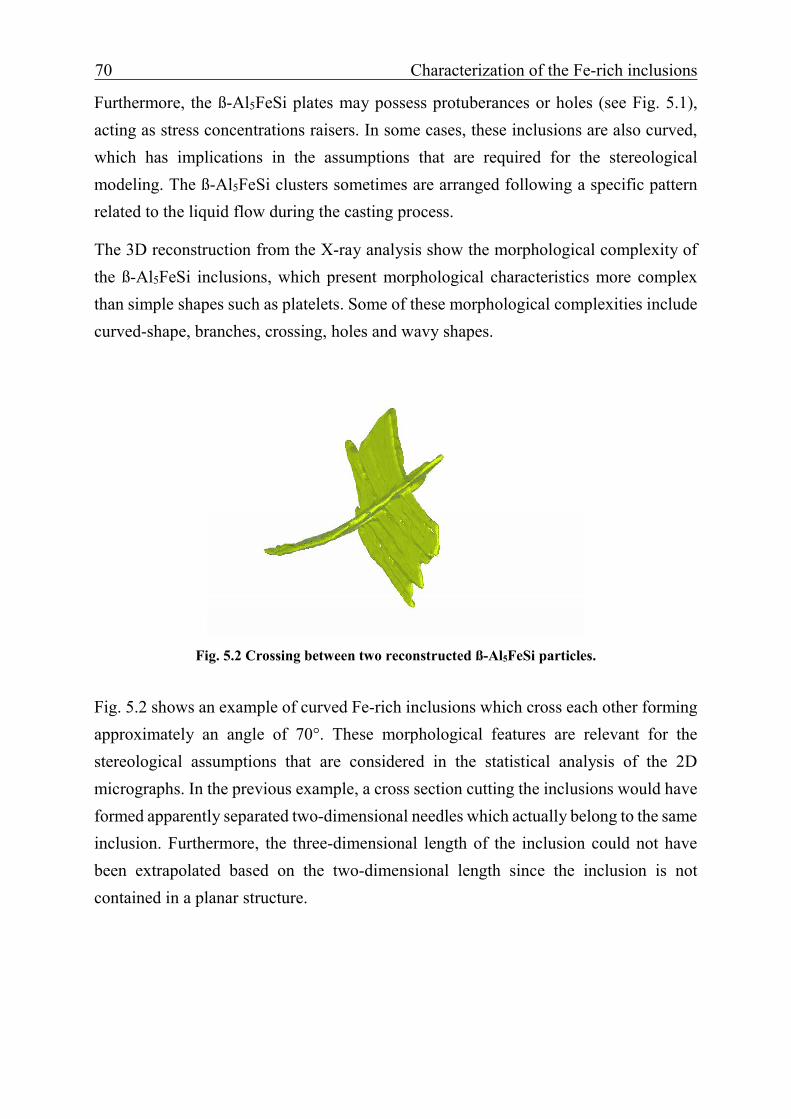
70 Characterization of the Fe-rich inclusions
Furthermore, the ß-Al5FeSi plates may possess protuberances or holes (see Fig. 5.1), acting as stress concentrations raisers. In some cases, these inclusions are also curved, which has implications in the assumptions that are required for the stereological modeling. The ß-Al5FeSi clusters sometimes are arranged following a specific pattern related to the liquid flow during the casting process.
The 3D reconstruction from the X-ray analysis show the morphological complexity of the ß-Al5FeSi inclusions, which present morphological characteristics more complex than simple shapes such as platelets. Some of these morphological complexities include curved-shape, branches, crossing, holes and wavy shapes.
Fig. 5.2 Crossing between two reconstructed ß-Al5FeSi particles.
Fig. 5.2 shows an example of curved Fe-rich inclusions which cross each other forming approximately an angle of 70°. These morphological features are relevant for the stereological assumptions that are considered in the statistical analysis of the 2D micrographs. In the previous example, a cross section cutting the inclusions would have formed apparently separated two-dimensional needles which actually belong to the same inclusion. Furthermore, the three-dimensional length of the inclusion could not have been extrapolated based on the two-dimensional length since the inclusion is not contained in a planar structure.
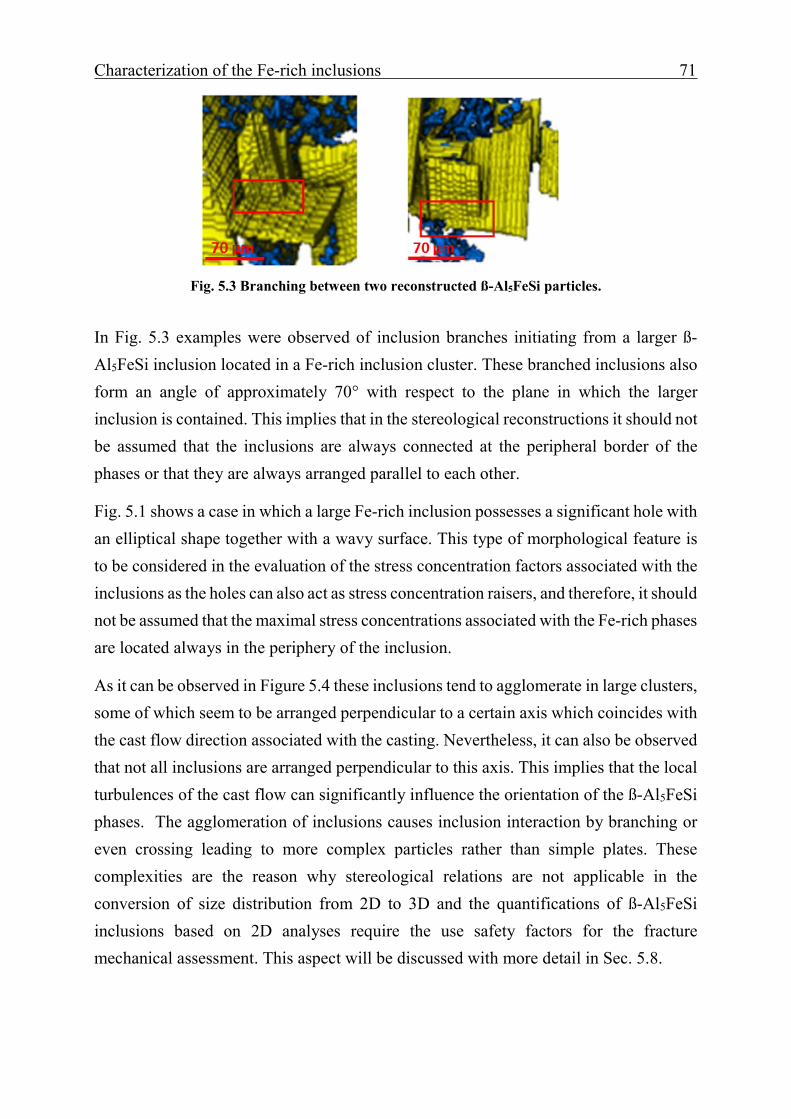
Characterization of the Fe-rich inclusions 71
Fig. 5.3 Branching between two reconstructed ß-Al5FeSi particles.
In Fig. 5.3 examples were observed of inclusion branches initiating from a larger ß-Al5FeSi inclusion located in a Fe-rich inclusion cluster. These branched inclusions also form an angle of approximately 70° with respect to the plane in which the larger inclusion is contained. This implies that in the stereological reconstructions it should not be assumed that the inclusions are always connected at the peripheral border of the phases or that they are always arranged parallel to each other.
Fig. 5.1 shows a case in which a large Fe-rich inclusion possesses a significant hole with an elliptical shape together with a wavy surface. This type of morphological feature is to be considered in the evaluation of the stress concentration factors associated with the inclusions as the holes can also act as stress concentration raisers, and therefore, it should not be assumed that the maximal stress concentrations associated with the Fe-rich phases are located always in the periphery of the inclusion.
As it can be observed in Figure 5.4 these inclusions tend to agglomerate in large clusters, some of which seem to be arranged perpendicular to a certain axis which coincides with the cast flow direction associated with the casting. Nevertheless, it can also be observed that not all inclusions are arranged perpendicular to this axis. This implies that the local turbulences of the cast flow can significantly influence the orientation of the ß-Al5FeSi phases. The agglomeration of inclusions causes inclusion interaction by branching or even crossing leading to more complex particles rather than simple plates. These complexities are the reason why stereological relations are not applicable in the conversion of size distribution from 2D to 3D and the quantifications of ß-Al5FeSi inclusions based on 2D analyses require the use safety factors for the fracture mechanical assessment. This aspect will be discussed with more detail in Sec. 5.8.

72 Characterization of the Fe-rich inclusions
Fig. 5.4 Volume elements with agglomerated ß-Al5FeSi phases forming a cluster.
Fig. 5.5 shows a SEM fractograph taken from the fracture surface of a tensile specimen. The cleavage fracture of a massive brittle ß-Al5FeSi particle can be observed, which reveals the brittle nature of these inclusions. Cu-rich compounds are also visible in the vicinity together with secondary cracks. These observations reveal that the morphological characteristics of the ß-Al5FeSi inclusions have a significant influence on the fracture behavior of the studied alloy.
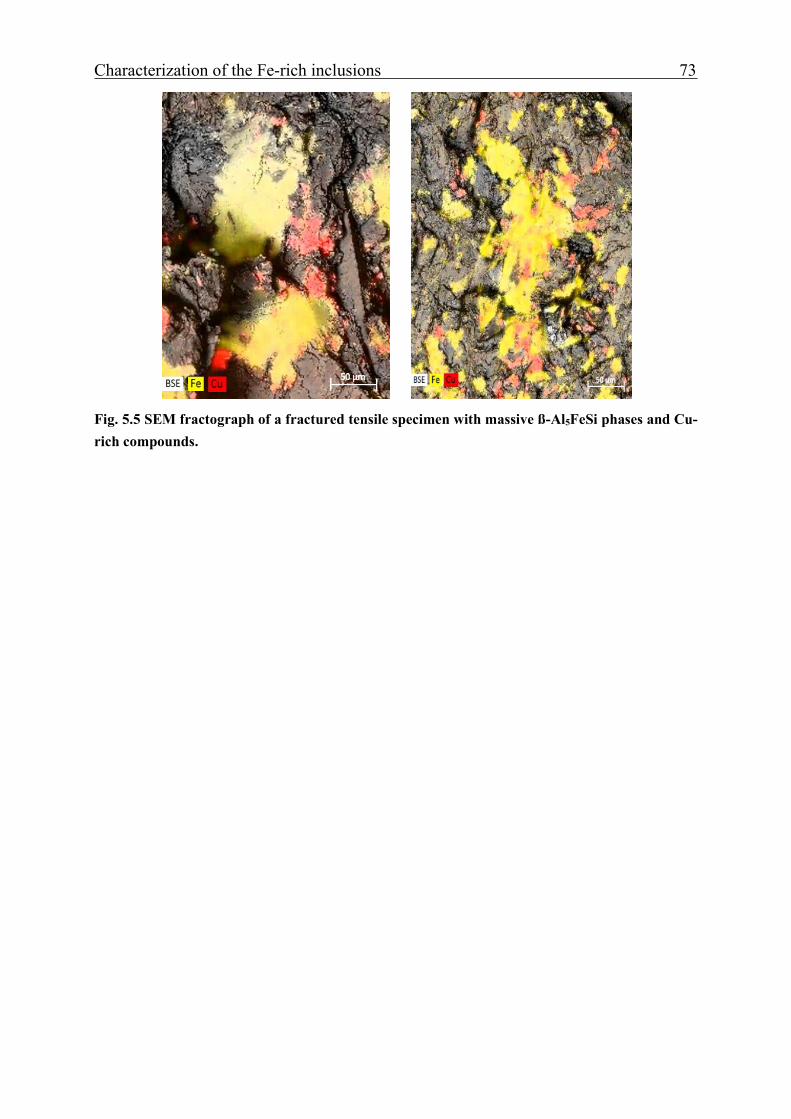
Characterization of the Fe-rich inclusions 73
Fig. 5.5 SEM fractograph of a fractured tensile specimen with massive ß-Al5FeSi phases and Cu-rich compounds.
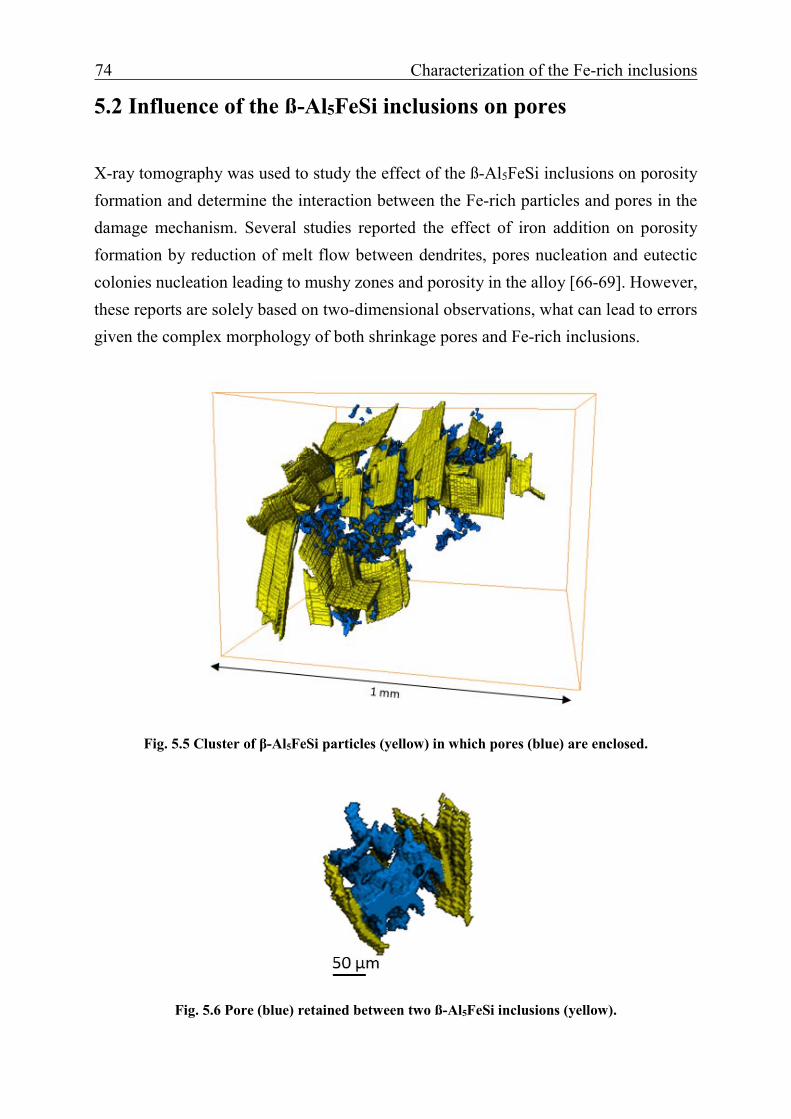
74 Characterization of the Fe-rich inclusions
5.2 Influence of the ß-Al5FeSi inclusions on pores
X-ray tomography was used to study the effect of the ß-Al5FeSi inclusions on porosity formation and determine the interaction between the Fe-rich particles and pores in the damage mechanism. Several studies reported the effect of iron addition on porosity formation by reduction of melt flow between dendrites, pores nucleation and eutectic colonies nucleation leading to mushy zones and porosity in the alloy [66-69]. However, these reports are solely based on two-dimensional observations, what can lead to errors given the complex morphology of both shrinkage pores and Fe-rich inclusions.
Fig. 5.5 Cluster of β-Al5FeSi particles (yellow) in which pores (blue) are enclosed.
Fig. 5.6 Pore (blue) retained between two ß-Al5FeSi inclusions (yellow).
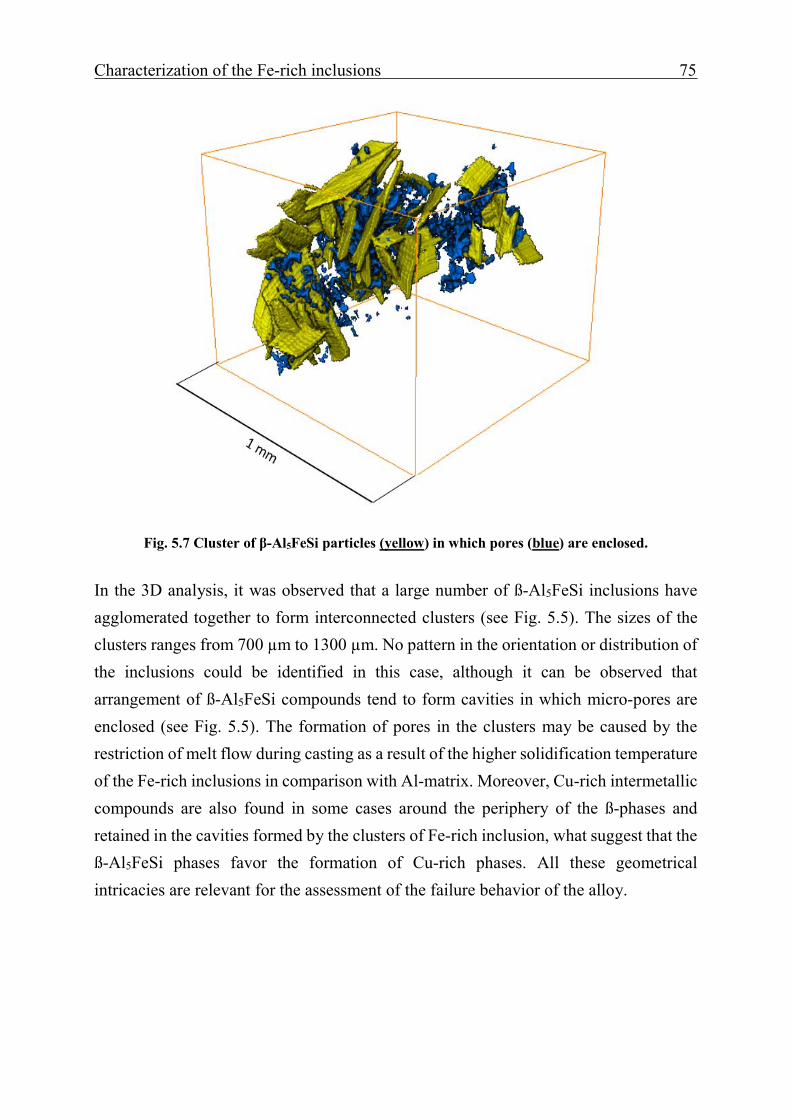
Characterization of the Fe-rich inclusions 75
Fig. 5.7 Cluster of β-Al5FeSi particles (yellow) in which pores (blue) are enclosed.
In the 3D analysis, it was observed that a large number of ß-Al5FeSi inclusions have agglomerated together to form interconnected clusters (see Fig. 5.5). The sizes of the clusters ranges from 700 µm to 1300 µm. No pattern in the orientation or distribution of the inclusions could be identified in this case, although it can be observed that arrangement of ß-Al5FeSi compounds tend to form cavities in which micro-pores are enclosed (see Fig. 5.5). The formation of pores in the clusters may be caused by the restriction of melt flow during casting as a result of the higher solidification temperature of the Fe-rich inclusions in comparison with Al-matrix. Moreover, Cu-rich intermetallic compounds are also found in some cases around the periphery of the ß-phases and retained in the cavities formed by the clusters of Fe-rich inclusion, what suggest that the ß-Al5FeSi phases favor the formation of Cu-rich phases. All these geometrical intricacies are relevant for the assessment of the failure behavior of the alloy.
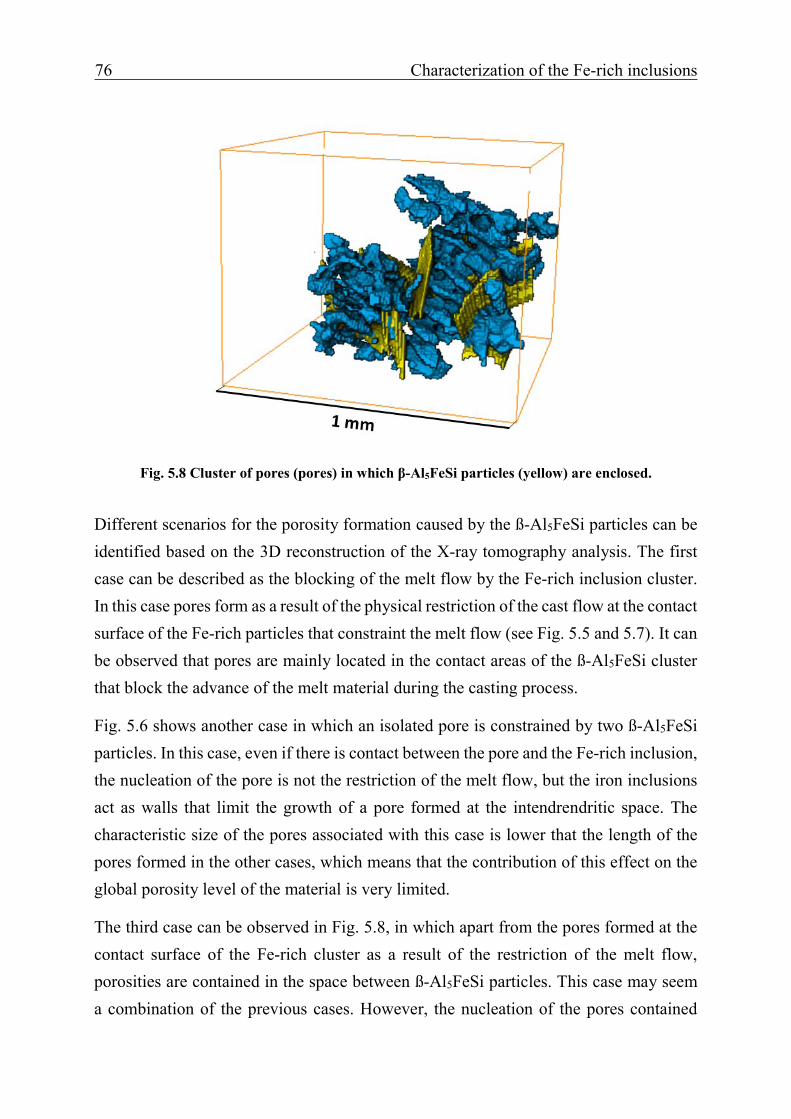
76 Characterization of the Fe-rich inclusions
Fig. 5.8 Cluster of pores (pores) in which β-Al5FeSi particles (yellow) are enclosed.
Different scenarios for the porosity formation caused by the ß-Al5FeSi particles can be identified based on the 3D reconstruction of the X-ray tomography analysis. The first case can be described as the blocking of the melt flow by the Fe-rich inclusion cluster. In this case pores form as a result of the physical restriction of the cast flow at the contact surface of the Fe-rich particles that constraint the melt flow (see Fig. 5.5 and 5.7). It can be observed that pores are mainly located in the contact areas of the ß-Al5FeSi cluster that block the advance of the melt material during the casting process.
Fig. 5.6 shows another case in which an isolated pore is constrained by two ß-Al5FeSi particles. In this case, even if there is contact between the pore and the Fe-rich inclusion, the nucleation of the pore is not the restriction of the melt flow, but the iron inclusions act as walls that limit the growth of a pore formed at the intendrendritic space. The characteristic size of the pores associated with this case is lower that the length of the pores formed in the other cases, which means that the contribution of this effect on the global porosity level of the material is very limited.
The third case can be observed in Fig. 5.8, in which apart from the pores formed at the contact surface of the Fe-rich cluster as a result of the restriction of the melt flow, porosities are contained in the space between ß-Al5FeSi particles. This case may seem a combination of the previous cases. However, the nucleation of the pores contained
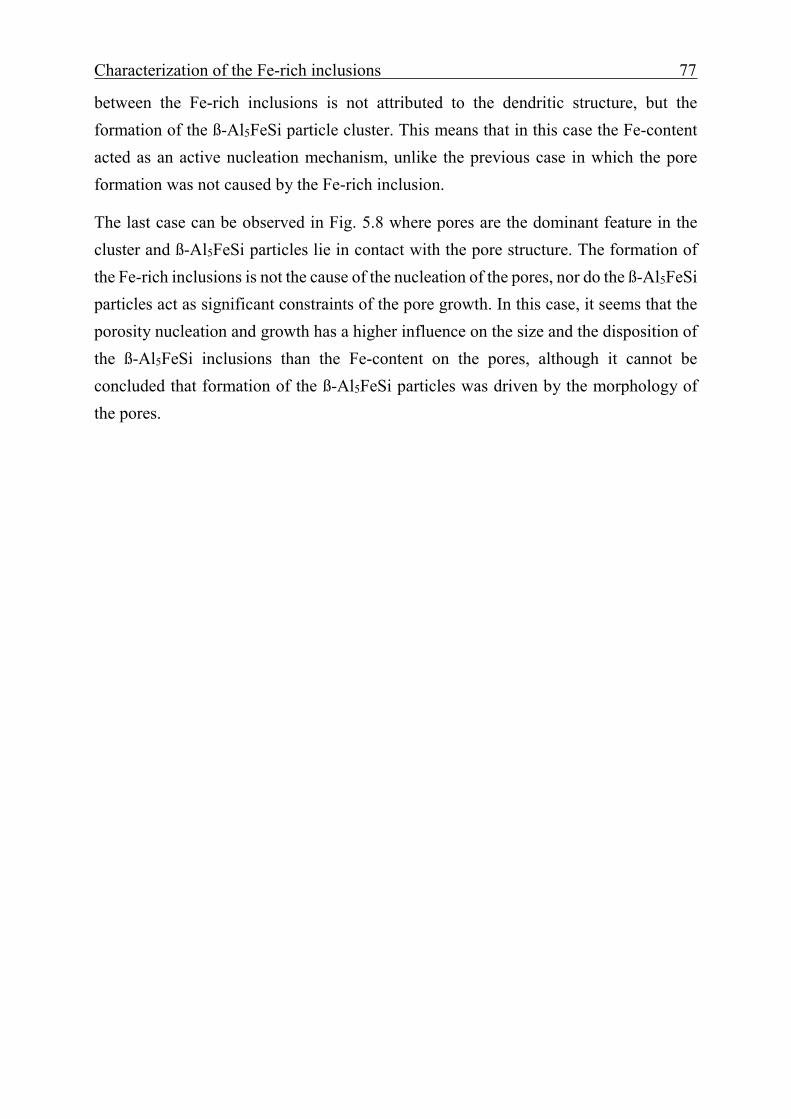
Characterization of the Fe-rich inclusions 77
between the Fe-rich inclusions is not attributed to the dendritic structure, but the formation of the ß-Al5FeSi particle cluster. This means that in this case the Fe-content acted as an active nucleation mechanism, unlike the previous case in which the pore formation was not caused by the Fe-rich inclusion.
The last case can be observed in Fig. 5.8 where pores are the dominant feature in the cluster and ß-Al5FeSi particles lie in contact with the pore structure. The formation of the Fe-rich inclusions is not the cause of the nucleation of the pores, nor do the ß-Al5FeSi particles act as significant constraints of the pore growth. In this case, it seems that the porosity nucleation and growth has a higher influence on the size and the disposition of the ß-Al5FeSi inclusions than the Fe-content on the pores, although it cannot be concluded that formation of the ß-Al5FeSi particles was driven by the morphology of the pores.
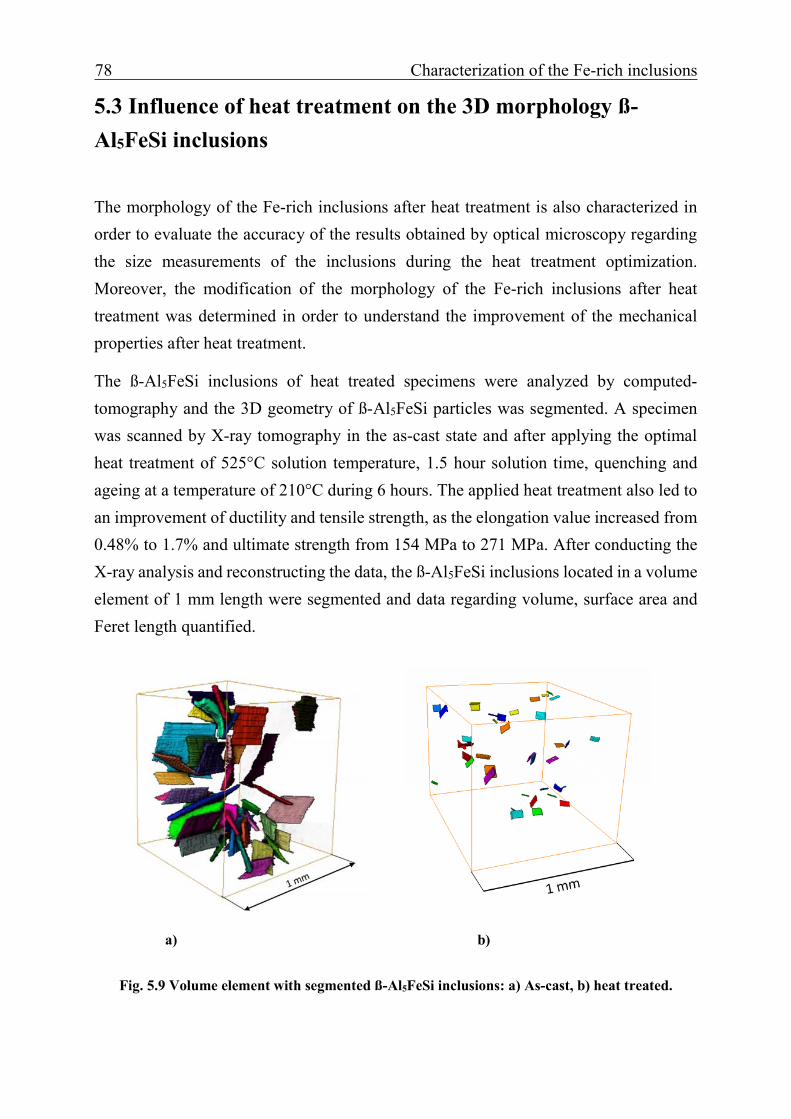
78 Characterization of the Fe-rich inclusions
5.3 Influence of heat treatment on the 3D morphology ß-Al5FeSi inclusions
The morphology of the Fe-rich inclusions after heat treatment is also characterized in order to evaluate the accuracy of the results obtained by optical microscopy regarding the size measurements of the inclusions during the heat treatment optimization. Moreover, the modification of the morphology of the Fe-rich inclusions after heat treatment was determined in order to understand the improvement of the mechanical properties after heat treatment.
The ß-Al5FeSi inclusions of heat treated specimens were analyzed by computed-tomography and the 3D geometry of ß-Al5FeSi particles was segmented. A specimen was scanned by X-ray tomography in the as-cast state and after applying the optimal heat treatment of 525°C solution temperature, 1.5 hour solution time, quenching and ageing at a temperature of 210°C during 6 hours. The applied heat treatment also led to an improvement of ductility and tensile strength, as the elongation value increased from 0.48% to 1.7% and ultimate strength from 154 MPa to 271 MPa. After conducting the X-ray analysis and reconstructing the data, the ß-Al5FeSi inclusions located in a volume element of 1 mm length were segmented and data regarding volume, surface area and Feret length quantified.
a) b)
Fig. 5.9 Volume element with segmented ß-Al5FeSi inclusions: a) As-cast, b) heat treated.

Characterization of the Fe-rich inclusions 79
The 3D analysis shows that applied heat treatments lead to a significant fragmentation and dissolution of the ß-phases as the volume fraction of these inclusions decreases from 7.89% to 1.22% and the average three-dimensional maximum length from 525 µm to 208 µm. Fig. 5.9 shows volume elements from an as-cast and heat-treated specimen with segmented ß-Al5FeSi compounds in which a substantial decrease of the concentration and length of the ß-intermetallics can be observed. Nevertheless, there are still numerous inclusions with rather complex shapes (see Fig. 5.10) which are not observed in the two-dimensional analysis.
Fig. 5.10. Segmented ß-Al5FeSi inclusions from the heat-treated material.
Moreover, the ß-Al5FeSi particles in 60 volume elements were segmented in the as cast as well as in the heat-treated specimen and the largest inclusion from each volume element was considered for the Largest Extreme Value distribution. Fig. 5.11 and Fig. 5.12 show the Largest Extreme Value distributions of the largest Fe-rich inclusions measured in the as-cast material and the heat-treated specimen by X-ray tomography. The probability density function f(x) of the standardized distribution is given in Eq. 5.1, where λ is the location parameter and δ the scale parameter.
𝑓𝑓(𝑥𝑥) = e−e−(x−λ)
𝛿𝛿 (Equation 5.1)
The Extreme Value Statistics description of the maximum defect size can be used to predict by extrapolation the largest defect size expected in a real part volumes [135]. Let l be the size of the largest defect in inspection and Vo be the inspection volume used for the sampling, then the characteristic largest defect x in a volume V is the defect size corresponding to a return period T defined in Eq. 5.2 and the size of the defect with return period T can be calculated as defined in Eq. 5.3.
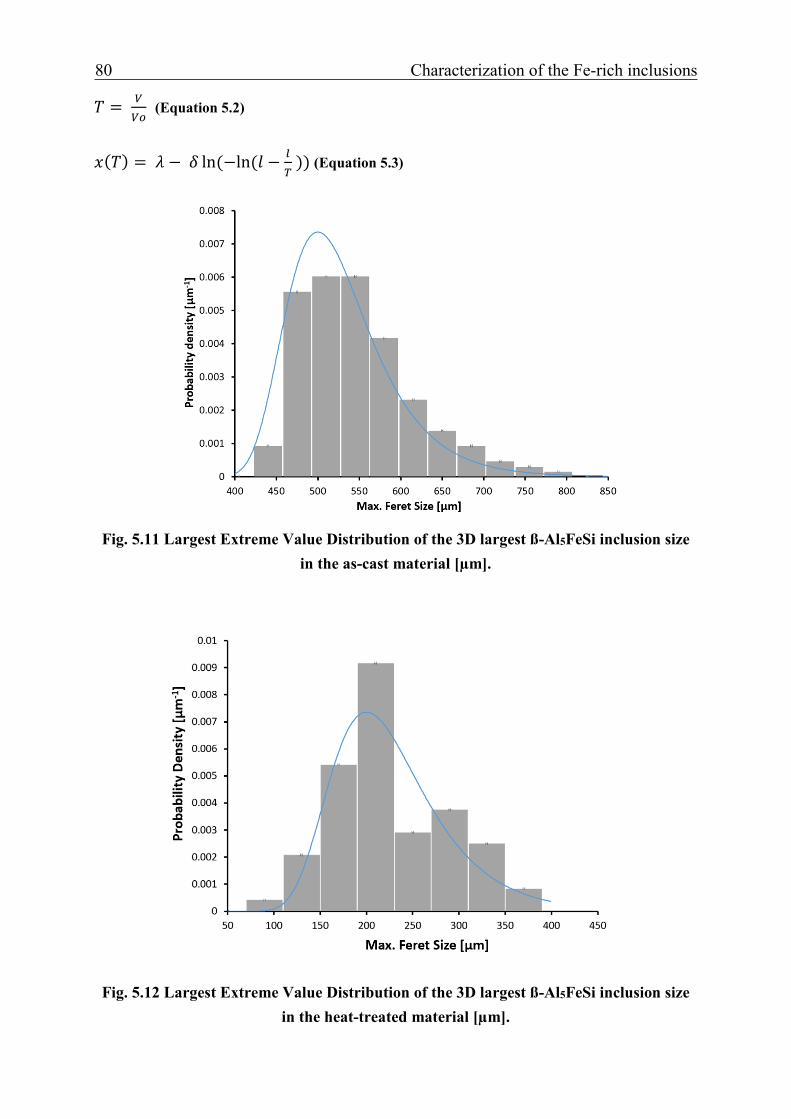
80 Characterization of the Fe-rich inclusions
𝑇𝑇 = 𝑉𝑉𝑉𝑉𝑜𝑜
(Equation 5.2)
𝑥𝑥(𝑇𝑇) = 𝜆𝜆 − 𝛿𝛿 ln(−ln (𝑙𝑙 − 𝑙𝑙𝑇𝑇
)) (Equation 5.3)
Fig. 5.11 Largest Extreme Value Distribution of the 3D largest ß-Al5FeSi inclusion size in the as-cast material [µm].
Fig. 5.12 Largest Extreme Value Distribution of the 3D largest ß-Al5FeSi inclusion size in the heat-treated material [µm].

Characterization of the Fe-rich inclusions 81
These observations confirm the results obtained from the previous analysis of the effect of heat treatment on the microstructure and the mechanical properties of the studied alloy. The applied optimal heat treatment leads to a high level of fragmentation and dissolution of the Fe-rich inclusions what increases the ductility and the ultimate strength of the alloy.
These results also reveal that three-dimensional non-destructive microstructural characterization methods such as X-ray tomography are required in order to accurately determine the effect of heat treatment on the microstructural features of the alloy
Furthermore, the quality and reliability control process should take into account the fact that commonly used methods as the two-dimensional analysis can lead to a significant under-estimation of the size and volume fraction of microstructural features such as the Fe-rich inclusions which have a significant influence on the mechanical properties the alloy (see Sec. 5.5).

82 Characterization of the Fe-rich inclusions
5.4 Simulation of the influence of the 3D morphology of the ß-Al5FeSi inclusions on the stress concentration factors
Finite Element (FE) simulations were carried out with the three-dimensional geometries obtained by computed-tomography in order to calculate the stress concentration factors under stress states and compare the detrimental effect of the iron-rich inclusions with the effect of shrinkage pores on the damage mechanism. The procedure used for this analysis is based on the method developed by Marcel Wicke in the University Kassel for the characterization of casting pores by microtomography and finite element analysis [131].
The largest identified ß-Al5FeSi inclusion with a volume of 0.00589 mm3 and Feret size of 1016 µm was segmented and exported to a commercial sofware (ABAQUS) in order to calculate the local stress concentration factors (Kt) (see Fig. 5.13). The exact procedure is described in Sec. 3.4.5.
Fig. 5.13 Finite Element Model of the simulated ß-Al5FeSi inclusions.
For the ß-Al5FeSi inclusion, the maximum Kt ranged between 1.74 and 3.46 for the different orientations, with an average value of 2.63. As it can be observed in Fig. 5.15-5.17, the peak stress concentrations were located on specific sites of the edge of the inclusion as the stress distribution varies all over the edge. For some orientations, the protuberances of the inclusions were found to be the sites with maximum stress concentrations (see Fig. 5.15-5.17), which indicates that the complex morphology of the Fe-rich ß-phases has a significant influence on the local stress concentrations.

Characterization of the Fe-rich inclusions 83
These values are significantly lower than the ones obtained for the complex shrinkage pores [131], what means that the shrinkage pores are the main crack initiation sites for the studied alloy and casting process in the absence of strong interaction between defects. The reason for this difference may be explained by the complex dendritic arms and holes of the shrinkage pores, which increase considerably the value of the stress concentration factors. However, the ß-Al5FeSi inclusions tend to form large complex interconnected clusters of inclusions, in which the interaction between these particles may generate higher stress concentrations and play an important role in the damage under monotonic load.
Fig. 5.14 Finite Element Model of the simulated ß-Al5FeSi inclusions embedded in a cylindric matrix representing the eutectic alloy.
Fig. 5.15. Finite Element Model with the location of the maximum Kt for different orientations.

84 Characterization of the Fe-rich inclusions
Fig. 5.16. Stress distribution in the simulated ß-Al5FeSi inclusion.
Fig. 5.17 Stress concentration factors (maximum and average values) for the ß-Al5FeSi inclusion.
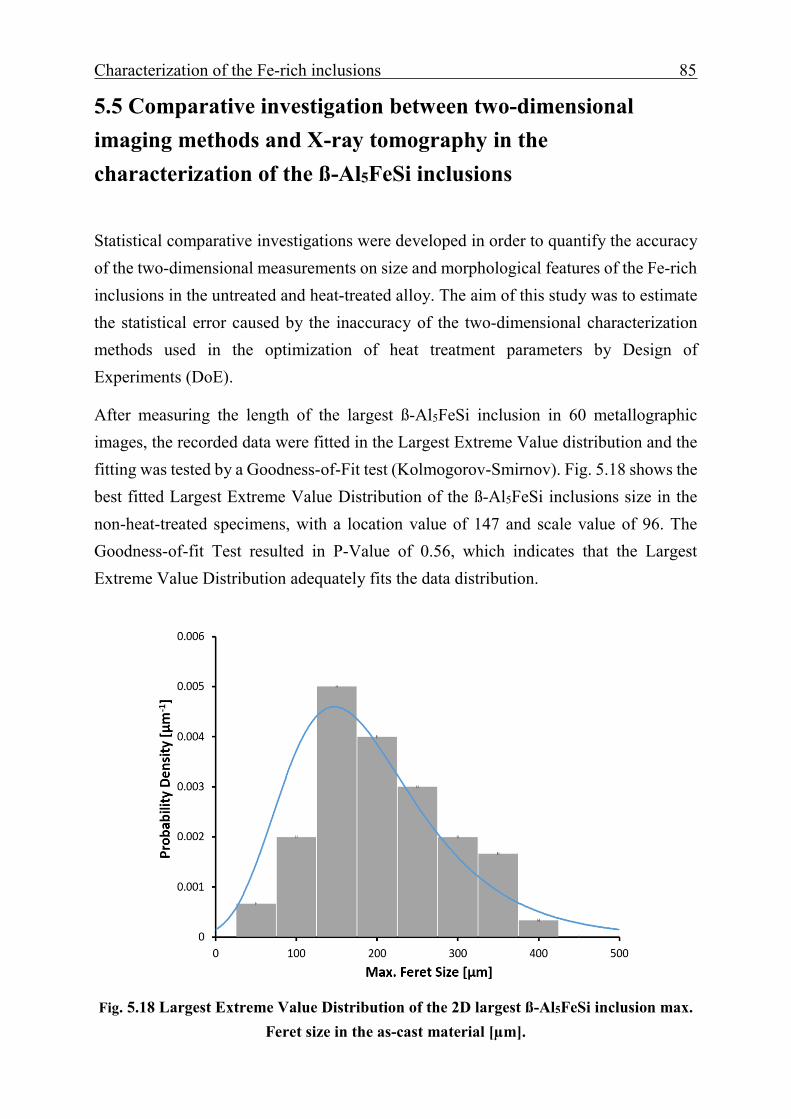
Characterization of the Fe-rich inclusions 85
5.5 Comparative investigation between two-dimensional imaging methods and X-ray tomography in the characterization of the ß-Al5FeSi inclusions
Statistical comparative investigations were developed in order to quantify the accuracy of the two-dimensional measurements on size and morphological features of the Fe-rich inclusions in the untreated and heat-treated alloy. The aim of this study was to estimate the statistical error caused by the inaccuracy of the two-dimensional characterization methods used in the optimization of heat treatment parameters by Design of Experiments (DoE).
After measuring the length of the largest ß-Al5FeSi inclusion in 60 metallographic images, the recorded data were fitted in the Largest Extreme Value distribution and the fitting was tested by a Goodness-of-Fit test (Kolmogorov-Smirnov). Fig. 5.18 shows the best fitted Largest Extreme Value Distribution of the ß-Al5FeSi inclusions size in the non-heat-treated specimens, with a location value of 147 and scale value of 96. The Goodness-of-fit Test resulted in P-Value of 0.56, which indicates that the Largest Extreme Value Distribution adequately fits the data distribution.
Fig. 5.18 Largest Extreme Value Distribution of the 2D largest ß-Al5FeSi inclusion max. Feret size in the as-cast material [µm].

86 Characterization of the Fe-rich inclusions
The same number of metallographic images were analyzed for the heat-treated samples and the data were likewise fitted in the Largest Extreme Value Distribution (see Fig. 5.19). In this case, the P-Value of the Goodness-of-fit test was significantly lower than the one in the previous fitting, although it was still higher than 0.05, fulfilling the 95% confidence requirement.
Fig. 5.19 Largest Extreme Value Distribution of the 2D largest ß-Al5FeSi inclusion max.
Feret size in the heat-treated material [µm].
The ß-Al5FeSi inclusions of 60 volume elements with a cross section of 1 mm were segmented and the data of volume, surface and size were recorded in order to characterize the 3D morphology of the inclusions. Fig. 5.20-5.22 show the correlation between size, volume and area of the segmented inclusions. A proportionality between surface and volume can be observed due to the plate-like form of the inclusion which apparently have a fairly constant thickness independently of the size. The maximum Feret size and volume, on the other hand, are correlated with a power function with an exponent of 0.36. All variables are highly correlated, and consequently, a single parameter can be used to characterize the size of the Fe-rich ß-phases.

Characterization of the Fe-rich inclusions 87
Fig. 5.20 Correlation between the size and area of the ß-Al5FeSi phases.
Fig. 5.21 Correlation between the size and volume of the ß-Al5FeSi phases.

88 Characterization of the Fe-rich inclusions
Fig. 5.22 Correlation between the volume and area of the ß-Al5FeSi phases.
The maximum size of each volume element was also identified and the data fitted were with the Largest Extreme Value distribution, which fulfilled the Goodness-of-fit test. It can be observed in Fig. 5.23 that the dispersion of the maximum size in the volume element is significantly reduced in comparison with the 2D analysis. The average value is 523 µm, considerably larger than the average maximum length from 2D metallographic analysis.
Fig. 5.24 shows the Largest Extreme Value distribution of the maximum length of the ß-Al5FeSi phases in the heat-treated specimens, with an average size of 208 µm. This value differs considerably from the average maximum length from the 2D metallographic analysis but also represents a significant reduction in comparison with the maximum length distribution of the ß-intermetallics in the as-cast specimens.

Characterization of the Fe-rich inclusions 89
Fig. 5.23 Largest Extreme Value Distribution of the 3D largest ß-Al5FeSi inclusion size in the as-cast material [µm].
Fig. 5.24 Largest Extreme Value Distribution of the 3D largest ß-Al5FeSi inclusion size in the heat-treated material [µm].
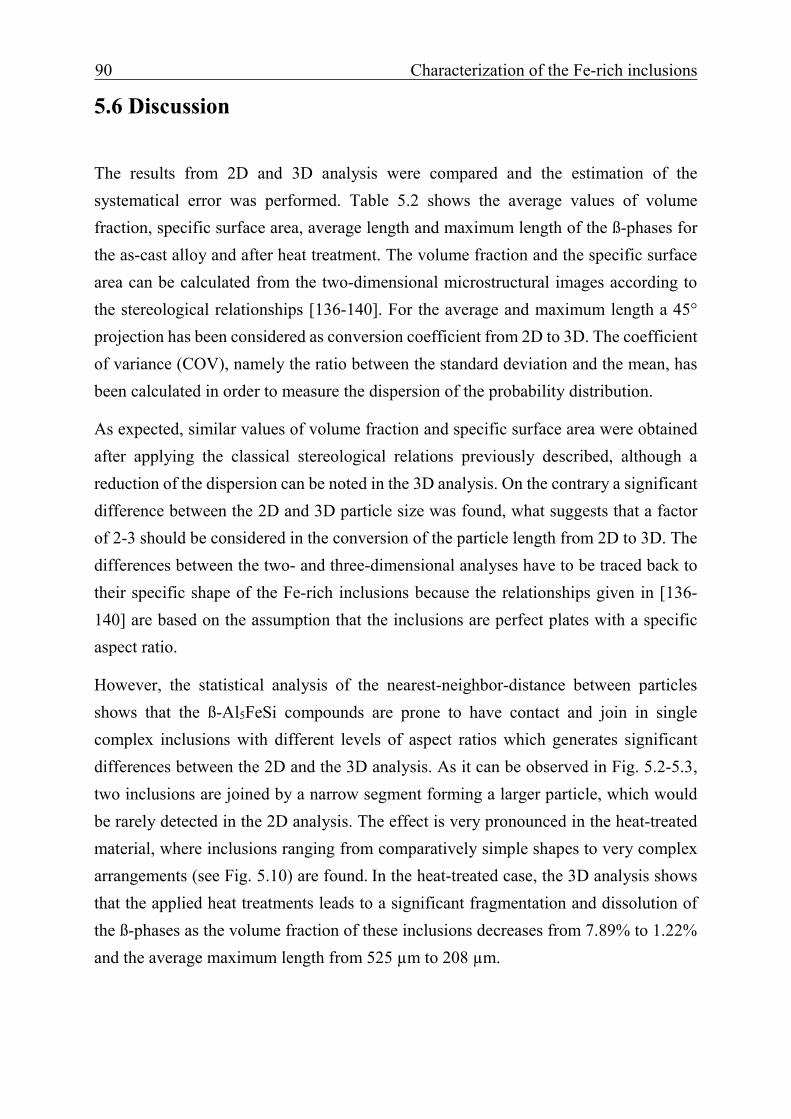
90 Characterization of the Fe-rich inclusions
5.6 Discussion
The results from 2D and 3D analysis were compared and the estimation of the systematical error was performed. Table 5.2 shows the average values of volume fraction, specific surface area, average length and maximum length of the ß-phases for the as-cast alloy and after heat treatment. The volume fraction and the specific surface area can be calculated from the two-dimensional microstructural images according to the stereological relationships [136-140]. For the average and maximum length a 45° projection has been considered as conversion coefficient from 2D to 3D. The coefficient of variance (COV), namely the ratio between the standard deviation and the mean, has been calculated in order to measure the dispersion of the probability distribution.
As expected, similar values of volume fraction and specific surface area were obtained after applying the classical stereological relations previously described, although a reduction of the dispersion can be noted in the 3D analysis. On the contrary a significant difference between the 2D and 3D particle size was found, what suggests that a factor of 2-3 should be considered in the conversion of the particle length from 2D to 3D. The differences between the two- and three-dimensional analyses have to be traced back to their specific shape of the Fe-rich inclusions because the relationships given in [136-140] are based on the assumption that the inclusions are perfect plates with a specific aspect ratio.
However, the statistical analysis of the nearest-neighbor-distance between particles shows that the ß-Al5FeSi compounds are prone to have contact and join in single complex inclusions with different levels of aspect ratios which generates significant differences between the 2D and the 3D analysis. As it can be observed in Fig. 5.2-5.3, two inclusions are joined by a narrow segment forming a larger particle, which would be rarely detected in the 2D analysis. The effect is very pronounced in the heat-treated material, where inclusions ranging from comparatively simple shapes to very complex arrangements (see Fig. 5.10) are found. In the heat-treated case, the 3D analysis shows that the applied heat treatments leads to a significant fragmentation and dissolution of the ß-phases as the volume fraction of these inclusions decreases from 7.89% to 1.22% and the average maximum length from 525 µm to 208 µm.

Characterization of the Fe-rich inclusions 91
Parameter
Analysis
Variables
Non heat-treated Heat-treated
Mean COV Mean COV
Volume Fraction [%]
2D
Area Fraction
6.5
0.41
1.8
0.76
3D
Volume Fraction
7.89
0.182
1.25
0.294
Specific Surface Area [µm-1]
2D 4/π LA 0.22 0.115 0.43 0.95
3D S/V 0.23 0.057 0.36 0.116
Length [µm]
2D L/sin (45°) 207 0.371 52.3 0.344
3D L 347 0.16 90.4 0.21
Max. Length [µm]
2D L/sin (45°) 268 0.447 92.9 0.443
3D
L
523
0.112
208.5
0.274
Table 5.2 Comparison of the 2D and 3D analysis of ß-Al5FeSi inclusions, average values and coefficients of variation (COV).
The high interconnectivity level of the ß-Al5FeSi compounds can lead to an underestimation of the maximum length of these particles, and as a consequence, their influence on the mechanical properties of the Fe-rich Al-Si-Cu alloys. Moreover, the agglomeration of the ß-Al5FeSi particles tend to enhance the formation of porosity and Cu-rich inclusions by restricting the melt flow during casting, which can promote the rapid failure of the material due to the high stress concentrations generated in the clusters. These observations are consistent with the results of Puncreobutr et al. who previously reported that the presence of a large fraction of ß-Al5FeSi strongly blocks the interdendritic channels and induces porosity formation as a result of permeability reduction [72].

92 Characterization of the Fe-rich inclusions
5.7 Conclusions
In this study the 3D morphology of ß-Al5FeSi inclusions and shrinkage pores from a Fe-rich Al-Si-Cu alloy were analyzed using X-ray tomography. The data obtained from micro-computed tomography were imported into a FE software tool and a pull-test was simulated in order to calculate the stress concentration factors caused by these casting defects. Furthermore, the influence of the heat treatment on the 3D size and morphology was analyzed and tensile tests were performed in order to compare the increase of the tensile strength and ductility after heat treatment. Based on the above results, the following conclusions may be drawn:
(1) Large plate-like ß-Al5FeSi inclusions were segmented from the data obtained by µ-CT. The maximum stress concentration factors obtained from the pull-test simulations ranged between 1.74 and 3.46 and were located on multiple sites of the edge and the protuberances of the inclusions.
(2) Agglomerations of ß-Al5FeSi inclusions in large clusters were observed, in which pores were in some cases enclosed as a consequence of permeability reduction during casting. In other cases, the ß-Al5FeSi inclusions were observed constraining the pore growth.
(3) The 3D observations of the heat-treated specimens revealed a significant fragmentation and dissolution of the ß-Al5FeSi particles. Elongation values increased from 0.48% to 1.7% and ultimate strength from 154 MPa to 271 MPa after applying heat treatment. Small ß-Al5FeSi phases with dissolved morphology were observed in the SEM fractographs.
(4) Significant differences between the results of the 2D and 3D analysis regarding average and maximum length of the ß-Al5FeSi inclusions were found both for the as-cast and heat-treated material. The analysis of the volume fraction and specific surface area presented similar values for the 2D and 3D quantifications.
(5) The 3D quantification of the ß-Al5FeSi phases indicates that there is a considerable reduction of volume fraction, average length and maximum length of the ß-phases for the heat-treated specimens.

3D characterization of the fracture mechanisms 93
6 Three-dimensional characterization of the fracture mechanisms of a Fe-rich Al-Si-Cu alloy

94 3D characterization of the fracture mechanisms
6.1 Tensile tests
6.1.1 Effect of the ß-Al5FeSi inclusions on the damage evolution under tensile loading
The damage evolution was studied by analyzing the fracture surfaces of the tensile specimens in order to understand the effect of the Fe-rich inclusions in the reduction of the ductility and strength of the alloy.
The fracture surfaces show the cleavage fracture of large plate-like ß-Al5FeSi inclusions that split through the middle together with eutectic silicon precipitates. It was shown in Sec. 4.3 that the damage process is characterized by fracture initiation at massive brittle Fe-rich inclusions that rupture through the middle. The cleavage fracture of a tensile specimen crack follows a specific transgranular plane that corresponds to the crystallographic plane of the ruptured flat surface in the Fe-rich inclusions (see Fig. 4.11).
Fig. 6.1 3D topography of the fracture surface from a tensile specimen (ultimate strength 215
MPa, fracture strain 0.95%).
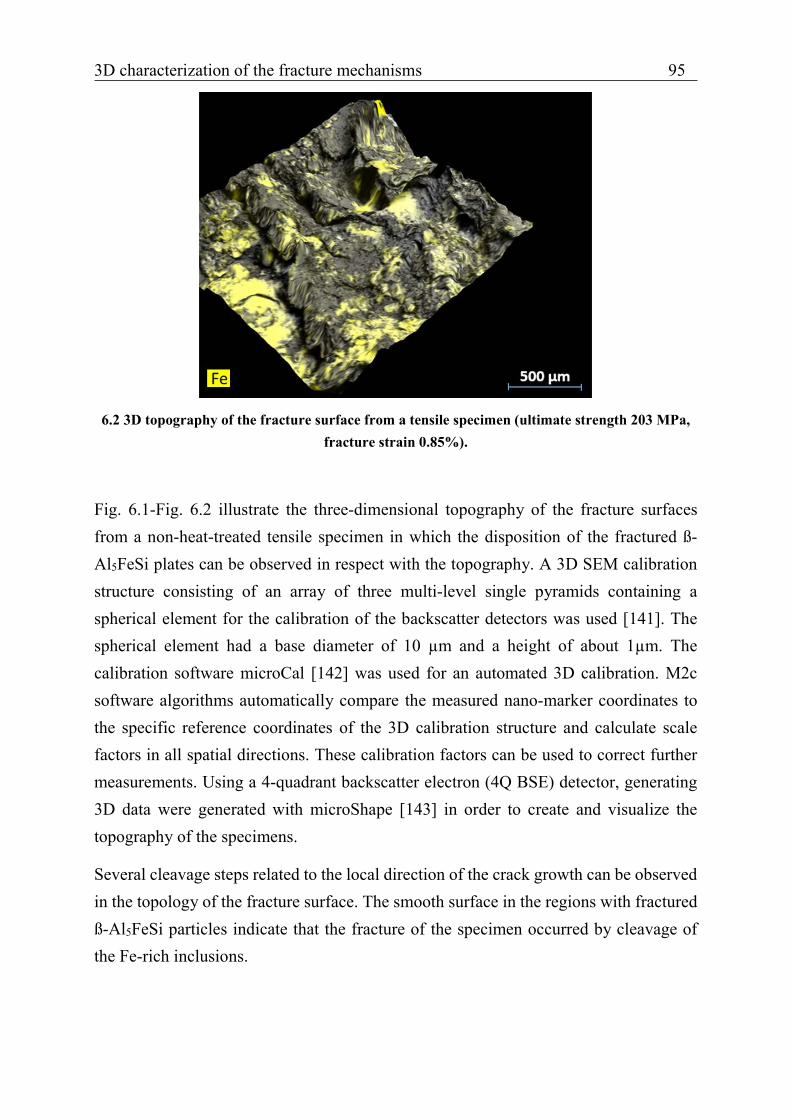
3D characterization of the fracture mechanisms 95
6.2 3D topography of the fracture surface from a tensile specimen (ultimate strength 203 MPa, fracture strain 0.85%).
Fig. 6.1-Fig. 6.2 illustrate the three-dimensional topography of the fracture surfaces from a non-heat-treated tensile specimen in which the disposition of the fractured ß-Al5FeSi plates can be observed in respect with the topography. A 3D SEM calibration structure consisting of an array of three multi-level single pyramids containing a spherical element for the calibration of the backscatter detectors was used [141]. The spherical element had a base diameter of 10 µm and a height of about 1µm. The calibration software microCal [142] was used for an automated 3D calibration. M2c software algorithms automatically compare the measured nano-marker coordinates to the specific reference coordinates of the 3D calibration structure and calculate scale factors in all spatial directions. These calibration factors can be used to correct further measurements. Using a 4-quadrant backscatter electron (4Q BSE) detector, generating 3D data were generated with microShape [143] in order to create and visualize the topography of the specimens.
Several cleavage steps related to the local direction of the crack growth can be observed in the topology of the fracture surface. The smooth surface in the regions with fractured ß-Al5FeSi particles indicate that the fracture of the specimen occurred by cleavage of the Fe-rich inclusions.

96 3D characterization of the fracture mechanisms
6.1.2 Effect of iron content under tensile loading
The influence of the Fe-content on the microstructure and mechanical properties of the studied Al-Si-Cu alloy was analyzed by micro-computed tomography and scanning electron microscopy. The iron content was systematically varied (see Table 6.1), the microstructure of the specimens was characterized and tensile tests were conducted.
Alloy Si Cu Mg Fe Zn Mn Al
A 12.96 1.52 0.68 0.6 0.48 0.17 bal.
B 12.87 1.64 0.58 1.37 0.47 0.23 bal.
C 12.99 1.8 0.43 1.85 0.51 0.3 bal.
D 12.62 1.45 0.51 2.28 0.45 0.26 bal.
Table 6.1 Chemical composition of the Al-Si-Cu alloy with different Fe-additions (wt. %).
The addition of Fe in the alloy caused an exponential increase in the size of the ß-Al5FeSi inclusions (see Fig. 6.3) that decreased the elongation at break and the ultimate strength of the alloy. Heat treatments also improved the mechanical properties of the modified alloy, although the effect diminished with increasing Fe content.
Fig. 6.3 shows the effect of the Fe content on the maximum Feret size of the ß-Al5FeSi inclusions, ultimate strength and elongation at break of the alloy before and after heat treatment. It can be observed that the average Feret length of the Fe-rich particles increased from around 150 µm to 360 µm when the Fe content was increased from 0.6% to 1.4%. The average Feret length of the ß-Al5FeSi inclusions in the alloy with 2% iron was approximately 390 µm, whereas a value around 760 µm was found in the alloy with a Fe content of 2.28%. The applied heat treatment significantly improved the mechanical properties of the alloy, especially the elongation at break. Nevertheless, the increase in the strength and ductility of the alloy becomes limited as the Fe content increase. The ultimate strength increased from the around 210 MPa to 255 MPa for the alloy with 0.6% Fe and 1.37% Fe content. In the alloy with 1.8% iron, the ultimate strength increased from 180 MPa to 210 MPa and from 150 MPa to 180 MPa with 2.3% Fe content.
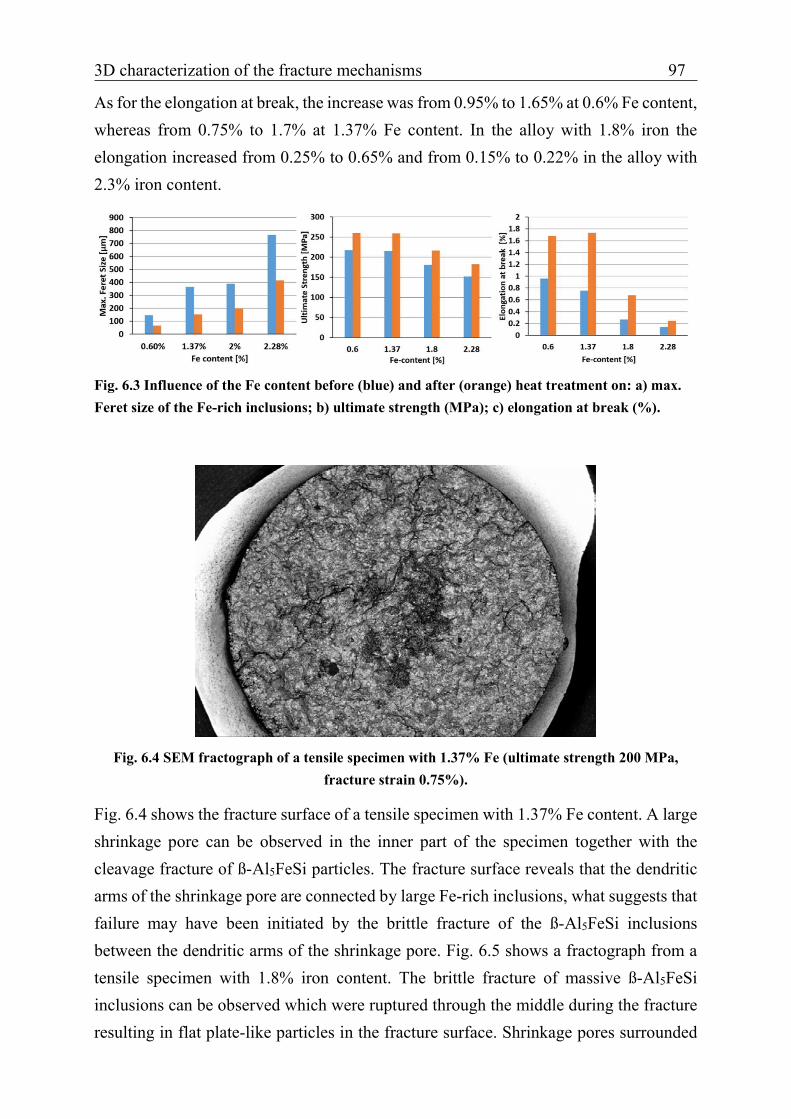
3D characterization of the fracture mechanisms 97
As for the elongation at break, the increase was from 0.95% to 1.65% at 0.6% Fe content, whereas from 0.75% to 1.7% at 1.37% Fe content. In the alloy with 1.8% iron the elongation increased from 0.25% to 0.65% and from 0.15% to 0.22% in the alloy with 2.3% iron content.
Fig. 6.3 Influence of the Fe content before (blue) and after (orange) heat treatment on: a) max. Feret size of the Fe-rich inclusions; b) ultimate strength (MPa); c) elongation at break (%).
Fig. 6.4 SEM fractograph of a tensile specimen with 1.37% Fe (ultimate strength 200 MPa,
fracture strain 0.75%).
Fig. 6.4 shows the fracture surface of a tensile specimen with 1.37% Fe content. A large shrinkage pore can be observed in the inner part of the specimen together with the cleavage fracture of ß-Al5FeSi particles. The fracture surface reveals that the dendritic arms of the shrinkage pore are connected by large Fe-rich inclusions, what suggests that failure may have been initiated by the brittle fracture of the ß-Al5FeSi inclusions between the dendritic arms of the shrinkage pore. Fig. 6.5 shows a fractograph from a tensile specimen with 1.8% iron content. The brittle fracture of massive ß-Al5FeSi inclusions can be observed which were ruptured through the middle during the fracture resulting in flat plate-like particles in the fracture surface. Shrinkage pores surrounded

98 3D characterization of the fracture mechanisms
by the massive Fe-rich inclusion can also be observed in the inner part of the specimen. Moreover, several large ß-Al5FeSi inclusions are located near the surface region.
Fig. 6.5 SEM fractograph of a tensile specimen with 1.8% Fe (ultimate strength 160 MPa, fracture strain 0.25%).
Fig. 6.6 SEM fractograph of a tensile specimen with 2.3% Fe (ultimate strength 150 MPa,
fracture strain 0.17%).
The fracture surface of a tensile specimen with 2.3% Fe presents similar massive fractured plate-like Fe-rich particles (see Fig. 6.6). A shrinkage pore is located in the inner part of the specimen and various inclusions can be observed in the surface region of the specimen. The failure of the specimen is characterized by the brittle cleavage fracture of the plate-like network of Fe-inclusions that split through the middle driving the local direction of the crack path.

3D characterization of the fracture mechanisms 99
Fig. 6.7 Cleavage fracture of a massive ß-Al5FeSi inclusion in the alloy with 2.3% Fe content (D) together with some Cu-rich particles (ultimate strength 160 MPa, fracture strain 0.25%).
The fracture surfaces of the tensile specimens where analyzed in SEM and the Fe-rich inclusions as well as the Cu-rich inclusions were identified by EDX. The fracture surface analysis shows the cleavage fracture of massive ß-Al5FeSi plates together with some fractured Cu-rich phases (see Fig. 6.7).
The fractured specimens were also used for the cross sectional analysis of the fracture surfaces. The observation of the cross sectional fracture surfaces also reveals the dominating fracture mechanism. Fig. 6.8 shows two fractured ß-Al5FeSi inclusions that have been split through the middle at the rupture of the specimen. The difference on the orientation of the broken plates causes the formation of sharp angles in the fracture surfaces.
Fig. 6.8 Cross section of the fractured specimen with 2.3% Fe content (ultimate strength 145 MPa, fracture strain 0.14%).
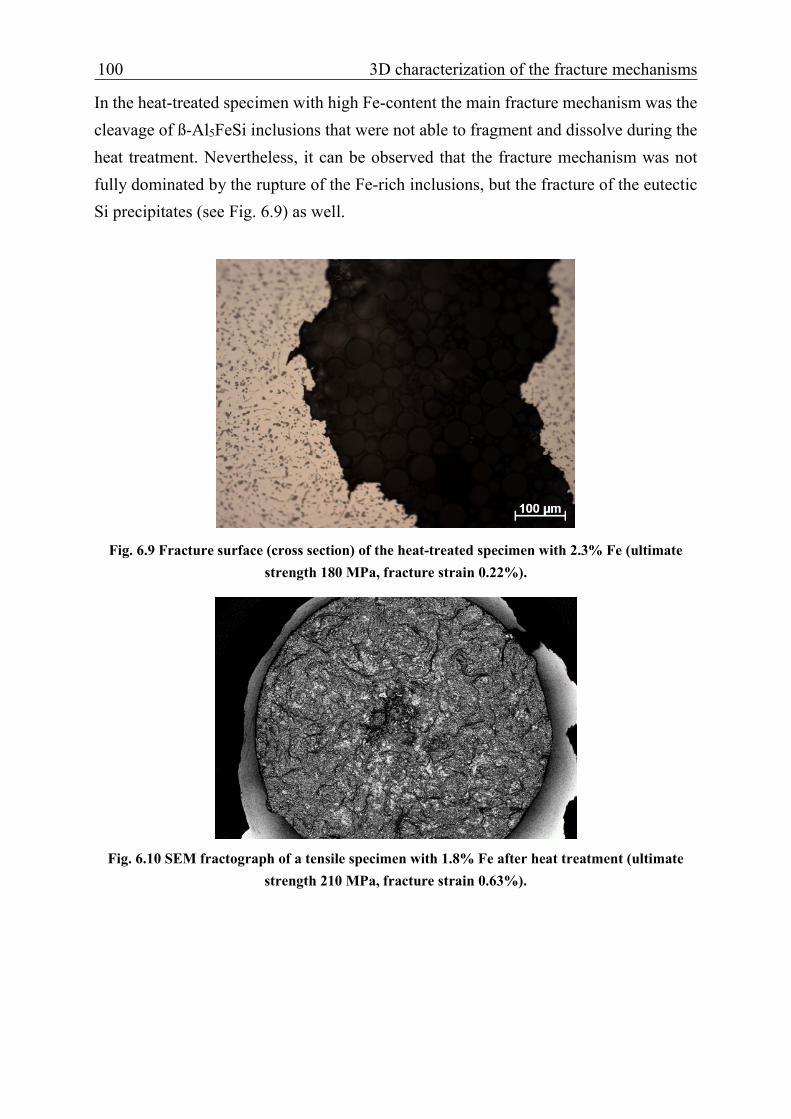
100 3D characterization of the fracture mechanisms
In the heat-treated specimen with high Fe-content the main fracture mechanism was the cleavage of ß-Al5FeSi inclusions that were not able to fragment and dissolve during the heat treatment. Nevertheless, it can be observed that the fracture mechanism was not fully dominated by the rupture of the Fe-rich inclusions, but the fracture of the eutectic Si precipitates (see Fig. 6.9) as well.
Fig. 6.9 Fracture surface (cross section) of the heat-treated specimen with 2.3% Fe (ultimate strength 180 MPa, fracture strain 0.22%).
Fig. 6.10 SEM fractograph of a tensile specimen with 1.8% Fe after heat treatment (ultimate
strength 210 MPa, fracture strain 0.63%).

3D characterization of the fracture mechanisms 101
a)
b)
Fig. 6.11 Volume elements with agglomerated ß-Al5FeSi particles forming an intermetallic
network: a) Gas and shrinkage pore retained; b) Individual particles segmented.
The Fe-rich inclusions from the alloy with 2.28% iron content were segmented together with the gas and shrinkage pores enclosed in the inclusion cluster. Fig. 6.11a shows a volume element in which the intermetallic network of ß-Al5FeSi particles can be observed as well as the gas and shrinkage pores retained in the particle network. The average three dimensional Feret length of the Fe-rich inclusions is 733 µm in the alloy with 2.28% Fe content. As for the volume fraction of pores, an average value of 3% was measured, a considerably higher value than in the alloy with 0.6% Fe content, which presented an average pore volume fraction of 0.47%. These results reveal that the addition of iron can significantly increase the volume fraction of pores as a result of the reduction of the alloy permeability in the casting process.

102 3D characterization of the fracture mechanisms
The modification in the morphology ß-Al5FeSi particles due to the addition of iron in the Al-Si-Cu alloy leads to an increase in the interconnectivity of the Fe-rich intermetallic structure. Consequently, a completely interconnected rigid network of ß-Al5FeSi particles is observed in the reconstructed data from X-ray tomography.
The increase in the interconnectivity is shown in Fig. 6.11b and it reveals that the decrease in the ductility of the alloy is caused by the high volume fraction of interconnected Fe-rich inclusions. The crack propagation mechanism can also be explained by the rupture of the ß-Al5FeSi particles driving the local direction of the crack propagation.

3D characterization of the fracture mechanisms 103
6.2 Fatigue tests
6.2.1 Fatigue behavior and damage mechanisms in the standard alloy
The fatigue behavior and the damage mechanisms of the studied standard Al-Si-Cu alloy were analyzed in the doctoral thesis of Martin Lütje in the Institute for Materials Engineering of the University of Kassel. In this work, the three-dimensional morphology of the shrinkage and gas pores was analyzed by micro-computed tomography and fatigue tests were conducted in order to study the influence of defects on the fatigue behavior of the standard alloy [73, 109, 111-112]. The fracture surfaces were analyzed by SEM as well as µ-CT and the different damage scenarios were classified based on the effect of defects on the crack initiation and propagation.
The results from this work reveal that the ß-Al5FeSi particles form large three-dimensional clusters, but they did not had a significant influence on crack initiation [109, 111]. These clusters are embedded flaws, as there are no iron inclusion in the surface or subsurface regions. No direct influence of the ß-Al5FeSi particles was observed in the SEM analysis of the fracture surfaces in the standard alloy. This is in agreement with the fact that a higher concentration of these particles was observed in the inner part of the specimen; and therefore they have a limited effect on the crack initiation.
Specimens containing shrinkage pores of moderate sizes failed by cracks initiated from gas pores at near surface locations [109, 112]. These specimens had the longest lifetimes including a substantial crack extension phase. Internal cracks were initiated from shrinkage pores in specimens containing only internal gas pores. Dramatic effects only occurred in case of giant shrinkage pores covering a substantial part of the cross section.
The mentioned study related this rather benign behavior of the shrinkage pores to the well-known fact that crack growth rates are very much reduced for internal flaws compared to surface flaws [112]. Furthermore, multiple crack initiation was observed in case of very large shrinkage pores. This is related to the fact that these pores contain several sites (mainly trailing edges and protuberances) which give rise to similar values of the stress concentration factor. This effect was studied by Finite Element simulation, in which the three-dimensional geometry of shrinkage pores with different morphologies obtained by µ-CT was exported into a Finite-Element software and the stress concentration factors were calculated for different pore orientations (see Fig. 6.12) [106, 108].

104 3D characterization of the fracture mechanisms
Fig. 6.12 Stress concentration factors (maximum and average values) for a typical shrinkage pore geometry; red dot: stress concentration site;”Sum_Orientation” corresponds to the number
of flaw orientations in which the pint of maximum stress was located at this particular point [109].
In the work of Lütje et al., it was reported that the interaction of gas pores and shrinkage pores has a rather detrimental effect on the lifetime [112]. This may be related to the fact that some gas pores had a rather irregular shape with values of the stress concentration factor in the range of shrinkage pores, i.e. internal cracks may be initiated simultaneously with those at shrinkage pores, and crack interaction/coalescence may be responsible for premature failure. Platelet-like β-iron inclusions were also present in the bulk material, but not in the near surface region. Even though they were found to occur in clusters, they did not play any role in the fatigue process.
The cross section of the fracture surfaces were analyzed by optimal microscopy in order to determine the influence of the particles present in the alloy on the crack propagation mechanism. Fig. 6.13 shows an example of the cross sectional fracture surface of a tensile specimen. It can be observed that a large cluster of ß-Al5FeSi inclusions is located close to the crack path, and that the crack path follows the eutectic Si precipitates without breaking the cluster of the β-phase inclusions. This is related to the fact that the preferred orientation of these inclusions is perpendicular to the crack path in this particular case. However, cleavage fracture of a ß-Al5FeSi particle can be observed in another area of the cross sectional fracture surface in the same fatigue specimen. Here, the plate-like morphology of the ß-Al5FeSi inclusion causes the kinking of the crack path at the edges of the particle.

3D characterization of the fracture mechanisms 105
Fig. 6.13 Crack path in the cross sectional fracture surface of a fatigue specimen.
Fig. 6.14-15 show the kinking of the crack path as a result of cleavage fracture of hard intermetallic particles. It can be observed that the ß-Al5FeSi platelets split right through the middle and drive the local direction of crack. The crack growths to the end of the ß-Al5FeSi platelets, until it reaches the aluminum matrix that allows the relaxation at the crack tip by local plastic flow due to its ductility. It can also be observed Cu-rich phases located parallel have a similar effect on the crack path.
Fig. 6.14 Cleavage fracture of a ß-Al5FeSi plate in the cross section of a fatigue specimen.
Fig. 6.16 shows the cross sectional fracture surface of a fatigue specimen in which the rupture of an entire ß-Al5FeSi occurred. It can be observed that the crack propagated breaking various Fe-rich particles belonging to the same cluster. In this case the particles also broke through the middle at different levels of the cluster. The connection of the ß-Al5FeSi plates in different planes leads to the kinking of the crack path. Besides the plate-like ß-Al5FeSi particles, broken Chinese-script α-Al15(Fe,Mn)3Si2 inclusions were

106 3D characterization of the fracture mechanisms
also observed in the crack path at the cross sectional fracture surface of the fatigue specimen (see Fig. 6.17).
Fig. 6.15 Cleavage fracture of ß-Al5FeSi plates in the cross section of a fatigue specimen.
Fig. 6.16 SEM cross sectional fractograph of a fatigue specimen with a broken ß-Al5FeSi cluster.

3D characterization of the fracture mechanisms 107
Fig. 6.17 Cleavage fracture of a Chinese-script like α-Al15(Fe,Mn)3Si2.
6.2.2 Increased iron content
Fig. 6.18 Statistical distributions of the fatigue cycles with 0.6% and 2.28% iron contents.
Fig. 6.18 shows the results of the fatigue tests conducted with cast specimens containing 0.6% and 2.28% iron. The large dispersion in the results is associated to the variation of
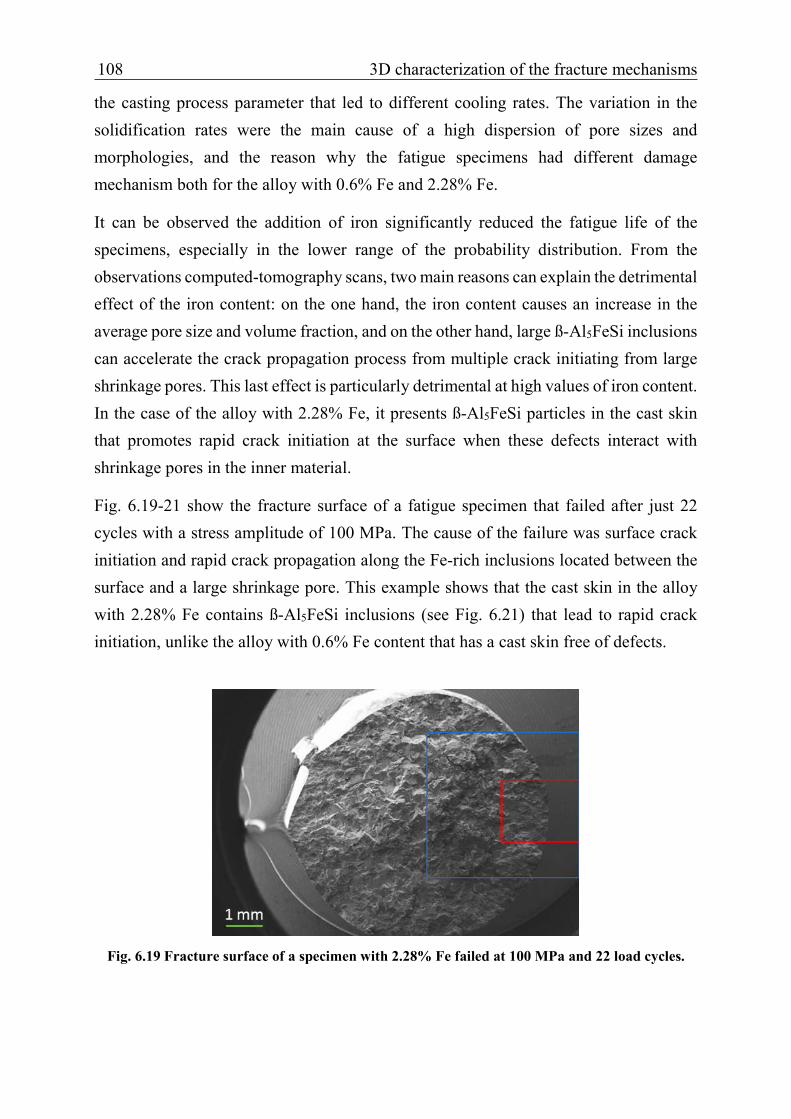
108 3D characterization of the fracture mechanisms
the casting process parameter that led to different cooling rates. The variation in the solidification rates were the main cause of a high dispersion of pore sizes and morphologies, and the reason why the fatigue specimens had different damage mechanism both for the alloy with 0.6% Fe and 2.28% Fe.
It can be observed the addition of iron significantly reduced the fatigue life of the specimens, especially in the lower range of the probability distribution. From the observations computed-tomography scans, two main reasons can explain the detrimental effect of the iron content: on the one hand, the iron content causes an increase in the average pore size and volume fraction, and on the other hand, large ß-Al5FeSi inclusions can accelerate the crack propagation process from multiple crack initiating from large shrinkage pores. This last effect is particularly detrimental at high values of iron content. In the case of the alloy with 2.28% Fe, it presents ß-Al5FeSi particles in the cast skin that promotes rapid crack initiation at the surface when these defects interact with shrinkage pores in the inner material.
Fig. 6.19-21 show the fracture surface of a fatigue specimen that failed after just 22 cycles with a stress amplitude of 100 MPa. The cause of the failure was surface crack initiation and rapid crack propagation along the Fe-rich inclusions located between the surface and a large shrinkage pore. This example shows that the cast skin in the alloy with 2.28% Fe contains ß-Al5FeSi inclusions (see Fig. 6.21) that lead to rapid crack initiation, unlike the alloy with 0.6% Fe content that has a cast skin free of defects.
Fig. 6.19 Fracture surface of a specimen with 2.28% Fe failed at 100 MPa and 22 load cycles.
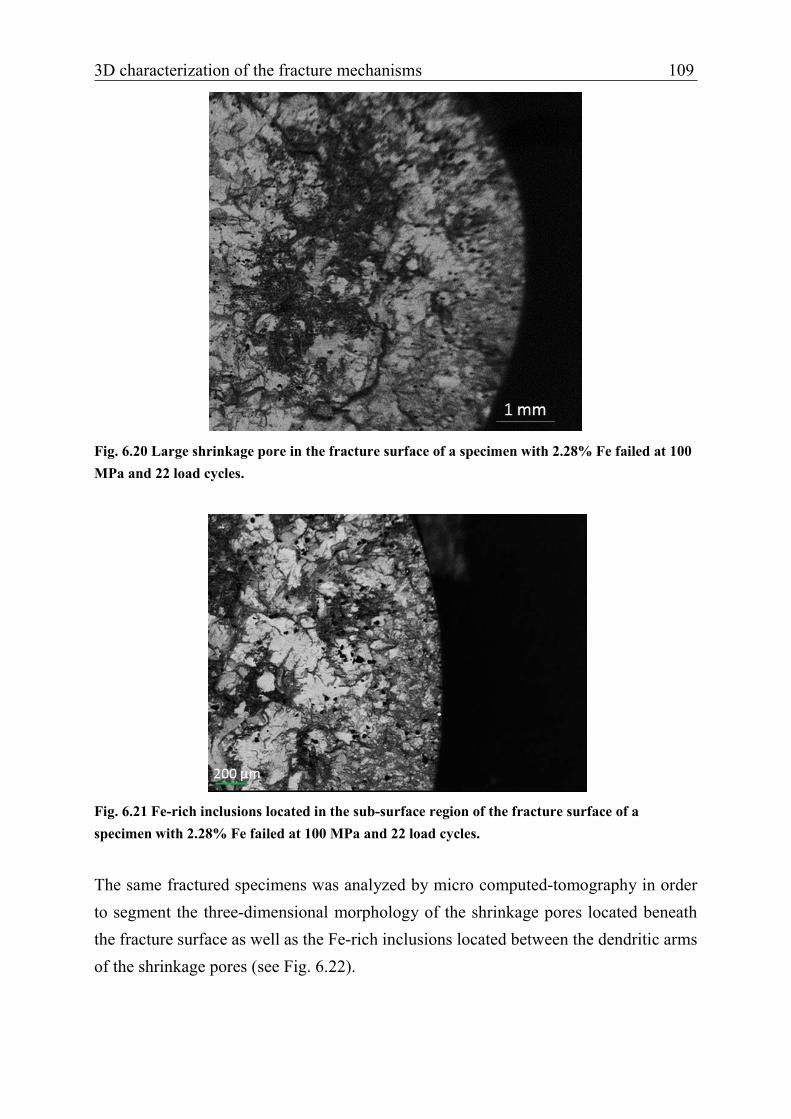
3D characterization of the fracture mechanisms 109
Fig. 6.20 Large shrinkage pore in the fracture surface of a specimen with 2.28% Fe failed at 100 MPa and 22 load cycles.
Fig. 6.21 Fe-rich inclusions located in the sub-surface region of the fracture surface of a specimen with 2.28% Fe failed at 100 MPa and 22 load cycles.
The same fractured specimens was analyzed by micro computed-tomography in order to segment the three-dimensional morphology of the shrinkage pores located beneath the fracture surface as well as the Fe-rich inclusions located between the dendritic arms of the shrinkage pores (see Fig. 6.22).

110 3D characterization of the fracture mechanisms
Fig. 6.23-24 show the high volume fraction and size of the shrinkage pores that interacted with the surface crack that caused the failure. It can be observed that the shrinkage pore has large ß-Al5FeSi particles between the dendritic arms in a zone near the fracture surface (see Fig. 6.24). This suggests apart from promoting rapid surface crack initiation due to the presence in the casting skin, the iron content also accelerates the crack propagation along the Fe-rich inclusions located between the dendritic arms.
Fig. 6.22 Tomographic reconstruction of the fracture surface from the specimen with 2.28% Fe failed at 100 MPa and 22 cycles.
Fig. 6.23 3D reconstruction of the shrinkage pores in the specimen failed at 100 MPa and 22 cycles. ß-Al5FeSi inclusions located between the dendritic arms of the shrinkage pores located in the fracture surface (orange sub-volume).
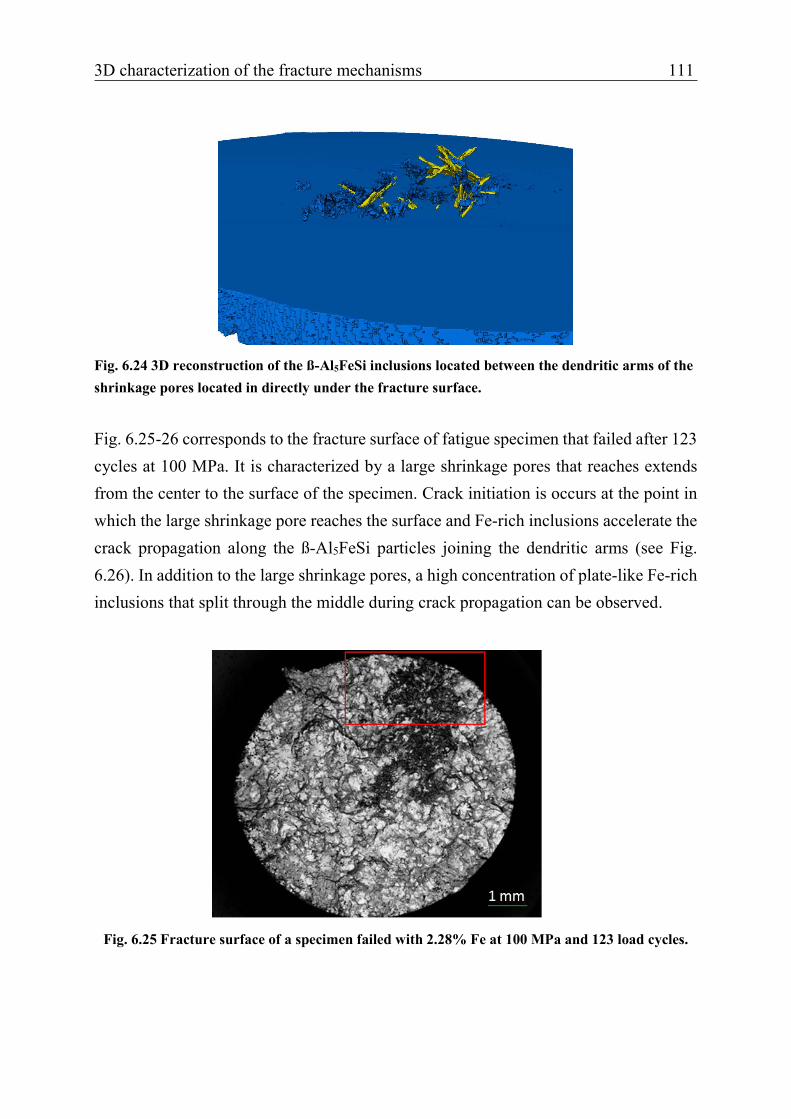
3D characterization of the fracture mechanisms 111
Fig. 6.24 3D reconstruction of the ß-Al5FeSi inclusions located between the dendritic arms of the shrinkage pores located in directly under the fracture surface.
Fig. 6.25-26 corresponds to the fracture surface of fatigue specimen that failed after 123 cycles at 100 MPa. It is characterized by a large shrinkage pores that reaches extends from the center to the surface of the specimen. Crack initiation is occurs at the point in which the large shrinkage pore reaches the surface and Fe-rich inclusions accelerate the crack propagation along the ß-Al5FeSi particles joining the dendritic arms (see Fig. 6.26). In addition to the large shrinkage pores, a high concentration of plate-like Fe-rich inclusions that split through the middle during crack propagation can be observed.
Fig. 6.25 Fracture surface of a specimen failed with 2.28% Fe at 100 MPa and 123 load cycles.

112 3D characterization of the fracture mechanisms
Fig. 6.26 Large shrinkage pore interacting with the surface in the specimen with 2.28% Fe failed
at 100 MPa and 123 load cycles.
Fig. 6.27 shows the fracture surface from a fatigue specimen with a fatigue life of 3,515 cycles at 100 MPa. Multiple cracks initiated from a Fe-rich inclusions located in the sub-surface region that interacted with a large cluster of shrinkage pores. During the propagating of these cracks, the coalescence of the cracks occurred, which accelerated the fracture of the specimen. The large number and size of the ß-Al5FeSi around the shrinkage pores were the main driving mechanism in the crack propagation process of the cracks initiating at multiple sites of the specimen.
Fig. 6.27 Large shrinkage pores interacting with the surface in the specimen with 2.28% Fe failed at 100 MPa and 3,515 load cycles.
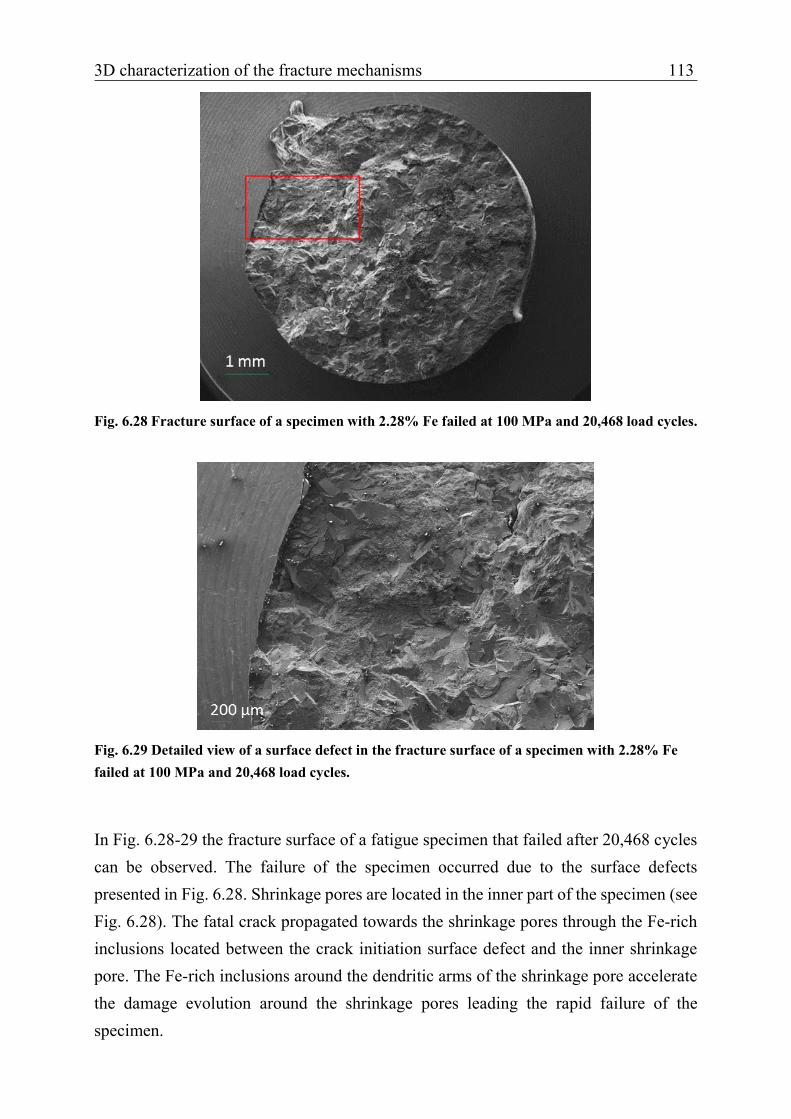
3D characterization of the fracture mechanisms 113
Fig. 6.28 Fracture surface of a specimen with 2.28% Fe failed at 100 MPa and 20,468 load cycles.
Fig. 6.29 Detailed view of a surface defect in the fracture surface of a specimen with 2.28% Fe failed at 100 MPa and 20,468 load cycles.
In Fig. 6.28-29 the fracture surface of a fatigue specimen that failed after 20,468 cycles can be observed. The failure of the specimen occurred due to the surface defects presented in Fig. 6.28. Shrinkage pores are located in the inner part of the specimen (see Fig. 6.28). The fatal crack propagated towards the shrinkage pores through the Fe-rich inclusions located between the crack initiation surface defect and the inner shrinkage pore. The Fe-rich inclusions around the dendritic arms of the shrinkage pore accelerate the damage evolution around the shrinkage pores leading the rapid failure of the specimen.
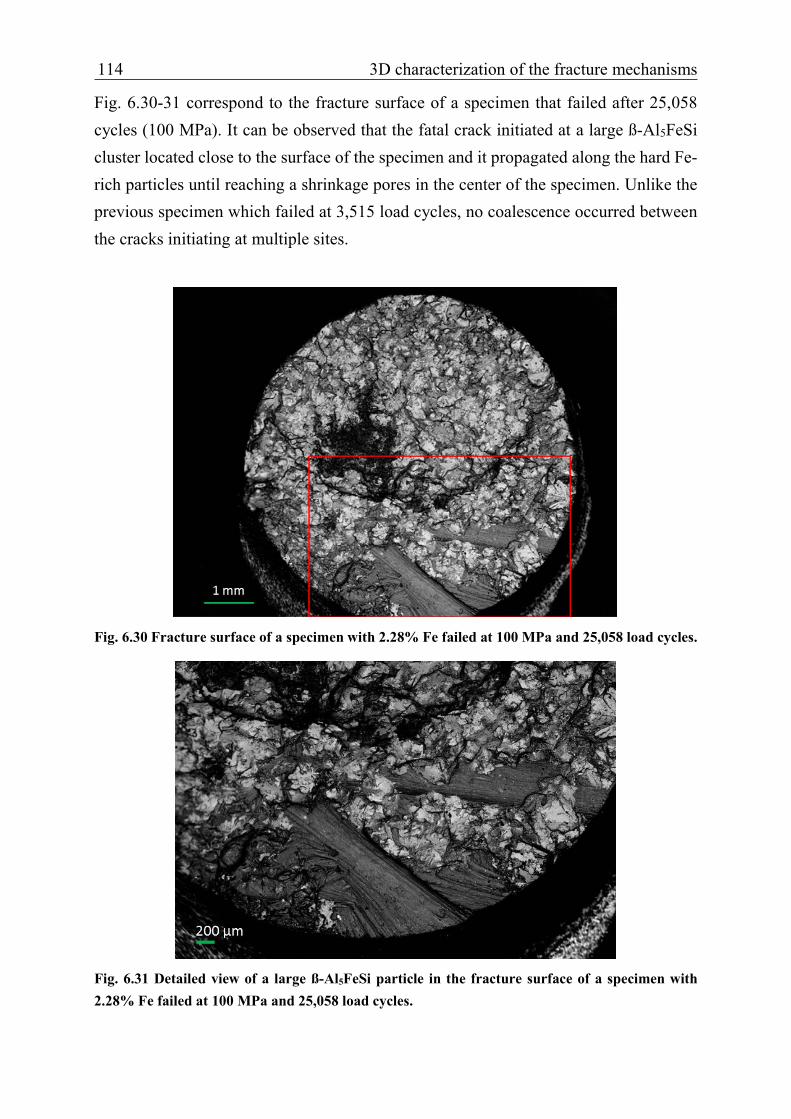
114 3D characterization of the fracture mechanisms
Fig. 6.30-31 correspond to the fracture surface of a specimen that failed after 25,058 cycles (100 MPa). It can be observed that the fatal crack initiated at a large ß-Al5FeSi cluster located close to the surface of the specimen and it propagated along the hard Fe-rich particles until reaching a shrinkage pores in the center of the specimen. Unlike the previous specimen which failed at 3,515 load cycles, no coalescence occurred between the cracks initiating at multiple sites.
Fig. 6.30 Fracture surface of a specimen with 2.28% Fe failed at 100 MPa and 25,058 load cycles.
Fig. 6.31 Detailed view of a large ß-Al5FeSi particle in the fracture surface of a specimen with 2.28% Fe failed at 100 MPa and 25,058 load cycles.
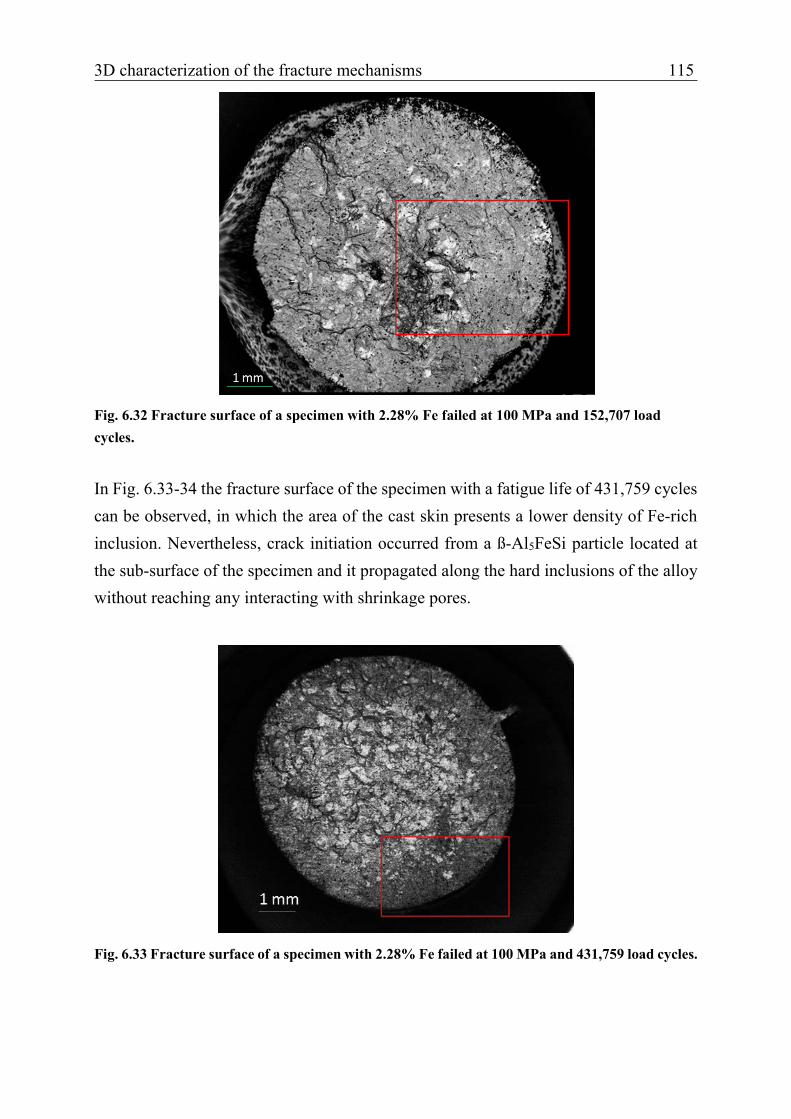
3D characterization of the fracture mechanisms 115
Fig. 6.32 Fracture surface of a specimen with 2.28% Fe failed at 100 MPa and 152,707 load cycles.
In Fig. 6.33-34 the fracture surface of the specimen with a fatigue life of 431,759 cycles can be observed, in which the area of the cast skin presents a lower density of Fe-rich inclusion. Nevertheless, crack initiation occurred from a ß-Al5FeSi particle located at the sub-surface of the specimen and it propagated along the hard inclusions of the alloy without reaching any interacting with shrinkage pores.
Fig. 6.33 Fracture surface of a specimen with 2.28% Fe failed at 100 MPa and 431,759 load cycles.
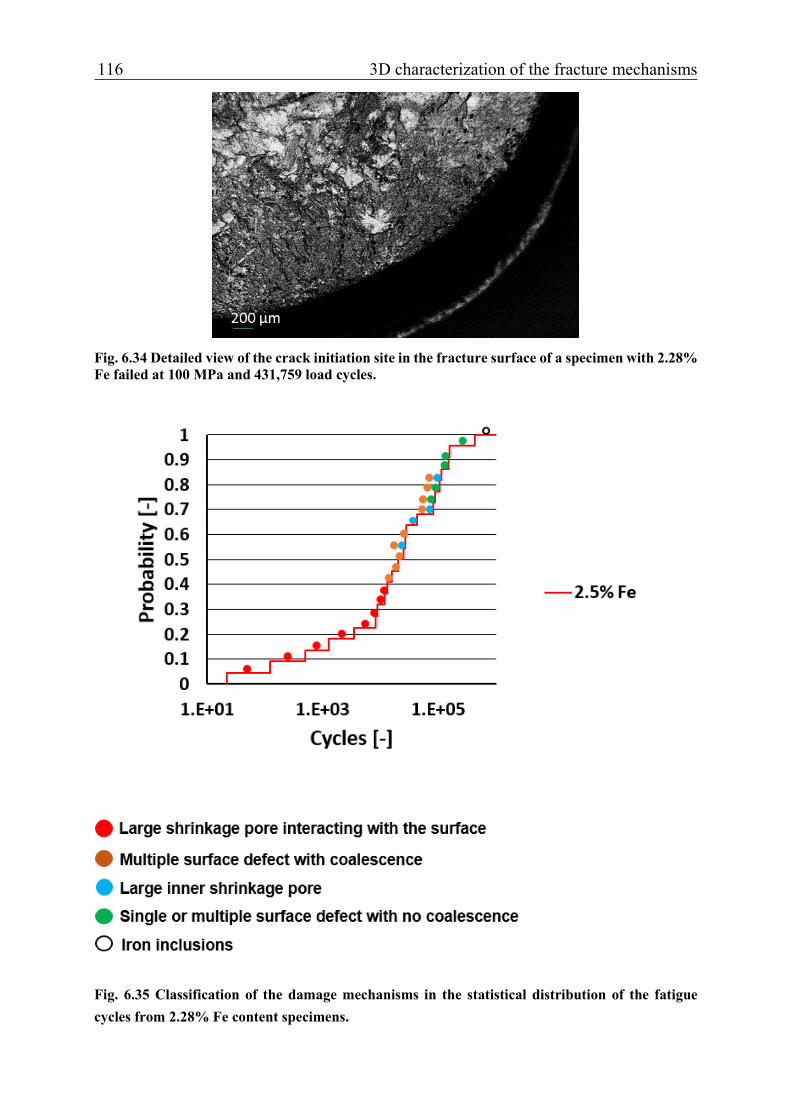
116 3D characterization of the fracture mechanisms
Fig. 6.34 Detailed view of the crack initiation site in the fracture surface of a specimen with 2.28% Fe failed at 100 MPa and 431,759 load cycles.
Fig. 6.35 Classification of the damage mechanisms in the statistical distribution of the fatigue cycles from 2.28% Fe content specimens.

3D characterization of the fracture mechanisms 117
The previous fracture surface present different characteristic damage mechanisms at different ranges in the probability distribution of the lifetime from the alloy with 2.28% Fe content. Based on the previous observations, the following damage mechanism classification can be established:
(1) The lowest range of the fatigue life distribution (see red spots in Fig. 6.35) is
characterized by fatigue specimens failing after very few cycles. In the fracture surfaces of these specimens large shrinkage pores interacting with the surface can be observed together with large Fe-rich inclusions joining the dendritic arms of the pores. In this scenario, rapid crack initiation occurs at the surface and crack grows at a high rate as a result of the rupture of the ß-Al5FeSi inclusions in the vicinity of the large shrinkage pore. This range of the probability distribution in the alloy with 2.28% Fe notably differs from the statistical distribution from the alloy with 0.6% Fe content since the cast skin in the alloy with low iron does not possess Fe-rich inclusions that would initiate cracks, nor a large intermetallic network of ß-Al5FeSi inclusions around the shrinkage pores.
(2) The middle-low range of the probability distribution (see orange spots in Fig. 6.35) corresponds to the fatigue specimens that fractured due to multiple crack initiation at Fe-rich inclusions located at the surface. After crack initiation, multiple cracks propagate coalescing into a fatal crack that drives the fracture of the specimen. This scenario does also notably differ from the alloy with 0.6% iron since, unlike the 2.28% Fe content alloy, multiple crack initiation at the surface does not occur in this alloy due to absence of significant defects in the cast skin. Even if this is the most characteristic fatigue damage scenario in this range of the statistical distribution, there are also some specimens that failed as a consequence of the large shrinkage pores in the inner part of the specimen (blue spots in Fig. 6.34).
(3) In the middle-high range of the fatigue life distribution (see green spots in Fig. 6.35) the fracture of most of the fatigue specimens occurred due to crack initiation at single surface defects without coalescence of multiple cracks. The main difference between the specimens in the middle-low and middle-high ranges of the fatigue life distribution is that in the middle-low range coalescence of multiple cracks initiating at the surface occurs, whereas in the middle-high range

118 3D characterization of the fracture mechanisms
single cracks propagate without coalescence. This reveals that the concentration of Fe-rich inclusions in the cast skin can significantly influence the fatigue life of Al-Si-Cu alloys with high iron content.
(4) The highest range in the probability distribution (see white spots in Fig. 6.35) is
characterized by specimens in which cracks do not initiate from Fe-rich inclusions at the surface. The number of cycles are similar to the cycles in the highest range of the probability distribution from the specimens with 0.6% iron. This means that high fatigue lives can be achieved in the alloy with 2.28% Fe content provided that the cast skin is free of Fe-rich inclusions that promote rapid crack initiation.

3D characterization of the fracture mechanisms 119
6.3 Discussion
The previous results provide new insights into the understanding of the fatigue behavior of a recycled Al-Si-Cu alloy and the mechanism of the evolution of the fatigue damage. The 3D characterization of the fracture surfaces by micro-computed tomography and scanning electron microscopy shows that shrinkage pores and interacting gas pores are the main crack initiation sites of the alloy, what is in good agreement with other studies in this field [13]. Nevertheless, the analysis of non-machined specimens reveal that the casting skin has a significant influence in the fatigue behavior, since it insulates the material from the air environment and promotes internal crack initiation. The ß-Al5FeSi play a moderate role in the evolution of damage due to the interaction of pores that drive the crack propagation. However, ß-Al5FeSi inclusions located parallel to the crack path can break by splitting through the middle and causing some kinking in the crack path. The cracks propagate through these ß-Al5FeSi particles until they reach the Al matrix, and stress relaxation occurs at the crack tip. The strain localizations at conveniently oriented hard eutectic Si has a similar effect on the crack path. These findings imply that the strain localizations at ß-Al5FeSi and eutectic Si precipitates could also drive the growth of other secondary microcracks initiated from shrinkage and gas pores and cause coalescence at an advanced stages of damage. Heat treatment did not affect the crack initiation mechanism since it is fully dominated by the interaction of shrinkage and gas pores, which remain after subjecting the specimens to heat treatment. However, the fragmentation and dissolution of the ß-Al5FeSi particles can alter the mechanism of the crack growth, particularly in the alloy with increased Fe content. This implies that there is a distinct effect of the Fe-content on the crack growth phase. However, this will not be seen in the lifetimes of fatigue specimens, as crack interaction of pore-initiated cracks competes with crack kinking caused by hard phases.

120 3D characterization of the fracture mechanisms
6.4 Conclusions
The influence of the Fe-content on the microstructure and mechanical properties of the studied Al-Si-Cu alloy was analyzed by micro-computed tomography and scanning electron microscopy:
(1) The size of the ß-Al5FeSi inclusions increased exponentially with the Fe-content, which caused a sharp drop of the ultimate strength and the ductility of the alloy.
(2) Heat treatment partially fragmented and dissolved the ß-Al5FeSi particles, leading to a significant improvement of the ultimate strength and the elongation of the alloy. However, the effect is limited in the alloy with high Fe-content.
The fatigue behaviour and damage mechanisms are studied in a secondary Al-Si-Cu alloy with high iron content. The fatigue damage evolution was analysed by micro-computed tomography and scanning electron microscopy. Based on the results, the following conclusions are drawn:
(1) The lowest range of the fatigue life probability distribution is characterized by fatigue specimens failing after very few cycles. In the fracture surfaces of these specimens large shrinkage pores interacting with the surface are observed together with large Fe-rich inclusions joining the dendritic arms of the pores. In this scenario, rapid crack initiation occurs at the surface and crack grows at a high rate as a result of the rupture of the ß-Al5FeSi inclusions in the surrounding of the large shrinkage pore.
(2) The middle range of the fatigue probability distribution is associated with specimens failing as a result of crack initiation at Fe-rich inclusions located at the surface. This scenario does also notably differ from the alloy with 0.6% iron since, unlike the 2.28% Fe content alloy, multiple crack initiation at the surface does not occur in this alloy due to absence of significant defects in the cast skin.
(3) The highest range in the probability distribution is characterized by specimens in which cracks do not initiate from Fe-rich inclusions at the surface. The number of cycles are similar to the cycles in the highest range of the probability distribution from the specimens with 0.6% iron. This implies that high fatigue lives can be achieved in the alloy with 2.28% Fe content provided that the cast skin is free of Fe-rich inclusions that promote rapid crack initiation.
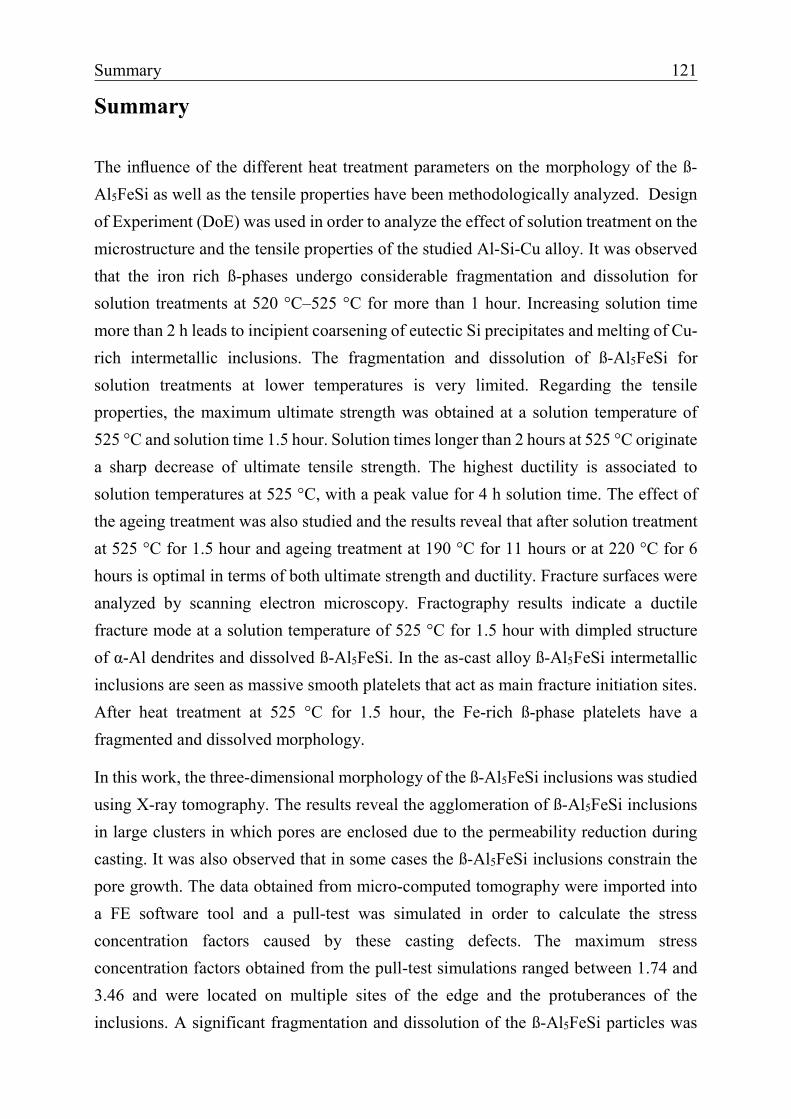
Summary 121
Summary
The influence of the different heat treatment parameters on the morphology of the ß-Al5FeSi as well as the tensile properties have been methodologically analyzed. Design of Experiment (DoE) was used in order to analyze the effect of solution treatment on the microstructure and the tensile properties of the studied Al-Si-Cu alloy. It was observed that the iron rich ß-phases undergo considerable fragmentation and dissolution for solution treatments at 520 °C–525 °C for more than 1 hour. Increasing solution time more than 2 h leads to incipient coarsening of eutectic Si precipitates and melting of Cu- rich intermetallic inclusions. The fragmentation and dissolution of ß-Al5FeSi for solution treatments at lower temperatures is very limited. Regarding the tensile properties, the maximum ultimate strength was obtained at a solution temperature of 525 °C and solution time 1.5 hour. Solution times longer than 2 hours at 525 °C originate a sharp decrease of ultimate tensile strength. The highest ductility is associated to solution temperatures at 525 °C, with a peak value for 4 h solution time. The effect of the ageing treatment was also studied and the results reveal that after solution treatment at 525 °C for 1.5 hour and ageing treatment at 190 °C for 11 hours or at 220 °C for 6 hours is optimal in terms of both ultimate strength and ductility. Fracture surfaces were analyzed by scanning electron microscopy. Fractography results indicate a ductile fracture mode at a solution temperature of 525 °C for 1.5 hour with dimpled structure of α-Al dendrites and dissolved ß-Al5FeSi. In the as-cast alloy ß-Al5FeSi intermetallic inclusions are seen as massive smooth platelets that act as main fracture initiation sites. After heat treatment at 525 °C for 1.5 hour, the Fe-rich ß-phase platelets have a fragmented and dissolved morphology.
In this work, the three-dimensional morphology of the ß-Al5FeSi inclusions was studied using X-ray tomography. The results reveal the agglomeration of ß-Al5FeSi inclusions in large clusters in which pores are enclosed due to the permeability reduction during casting. It was also observed that in some cases the ß-Al5FeSi inclusions constrain the pore growth. The data obtained from micro-computed tomography were imported into a FE software tool and a pull-test was simulated in order to calculate the stress concentration factors caused by these casting defects. The maximum stress concentration factors obtained from the pull-test simulations ranged between 1.74 and 3.46 and were located on multiple sites of the edge and the protuberances of the inclusions. A significant fragmentation and dissolution of the ß-Al5FeSi particles was

122 Summary
observed in the three-dimensional microstructure of the heat-treated specimens, in which elongation values increased from 0.48% to 1.7% and ultimate strength from 154 MPa to 271 MPa after applying heat treatment.
Significant differences were found between the results of the two-dimensional and three-dimensional analysis regarding average and maximum length of the ß-Al5FeSi inclusions were both for the as-cast and heat-treated material. At higher iron contents, the size of the ß-Al5FeSi inclusions increased exponentially ensuing reduction of ultimate strength and fracture strain. However, a significant improvement of the mechanical properties could still be obtained by the heat treatment described above, as long as the iron content did not exceed 1.37%.
The fatigue behaviour and damage mechanisms were studied in a secondary Al-Si-Cu alloy with high iron content (2.28% Fe). In the fracture surfaces of the specimens that failed after very few cycles large shrinkage pores interacting with the surface were observed together with large Fe-rich inclusions joining the dendritic arms of the pores. In this scenario, rapid crack initiation occurs at the surface and crack grows at a high rate as a result of the rupture of the ß-Al5FeSi inclusions in the surrounding of the large shrinkage pore. Crack initiation at Fe-rich inclusions located at the surface was the main damage mechanism in the specimens from the middle range of the fatigue probability distribution. In some cases multiple crack initiation at surface defects occurred, whereas in other cases the fatal crack initiated from a single surface defect. The highest range in the probability distribution is characterized by specimens in which cracks do not initiate from Fe-rich inclusions at the surface. The number of cycles are similar to the cycles in the highest range of the probability distribution from the specimens with low iron content. This implies that high fatigue lives can be achieved in the alloy with 2.28% Fe content provided that the cast skin is free of Fe-rich inclusions that promote rapid crack initiation.
The work describe above indicates that there is a potential for using secondary aluminium alloys in structural application provided that the following conditions are fulfilled: 1) a tailored heat treatment is applied along the lines described in this work. 2) Porosity is controlled by clearly defining the cooling rate in the casting process. Both conditions require that a quantitative analysis of the interaction of iron inclusions and porosity is performed for specific heat treatments. This analysis has to contain a certain amount of three-dimensional imaging of the defects in question, as they form intricate spatial networks which cannot be studied by conventional micrographs.

References 123
References
[1] Kaufman, J.G., Rooy, E.L. Aluminum alloy castings: properties, processes and applications (2004). ASM International.
[2] Lee, P.D., Lindley, T.C., Cheong, C.W.J., Davis, G.R. Elliott J. Proceedings of
COM (2003), Vancouver, BC, p. 457.
[3] Das, S.K., Green, J.A.S. Aluminum industry and climate change-Assessment and responses. JOM (2010), vol. 62, Issue 2, pp 27-31.
[4] EAA/OEA Recycling Division. Aluminum Recycling in Europe. European
Aluminum (2007), pp. 1-51.
[5] Gaustada, G., Olivetti, E., Kirchain, R. Improving aluminum recycling: A survey of sorting and impurity removal technologies. Resources, Conservation and Recycling (2012); 58, pp. 79– 87.
[6] Seifeddine, S., Johansson, S., Svensson, I. The Influence of Cooling Rate and
Manganese Content on the ß-Al5FeSi Phase Formation and Mechanical Properties of Al-Si–based Alloys. Materials Science and Engineering A (2008), vol. 490, pp. 385-390.
[7] Ashtari, P., Tezuka, H., Sato, T. Influence of Sr and Mn Additions on Intermetallic
Compound Morphologies in Al-Si-Cu-Fe Cast Alloys. Materials Transactions (2003); vol. 44; No. 12; pp. 2611-2616.
[8] Narayanan, L.A., Samuel, F.H., Gruzleski, J.E. Dissolution of Iron Intermetallics in
Al-Si Alloys through Nonequilibrium Heat Treatment. Metallurgical and Materials Transactions A (1995), vol. 26A, pp. 2161-2174.
[9] Maire, E., Withers, P. J. Quantitative X-ray tomography. International materials
reviews (2014), 59(1), pp. 1-43.
[10] Gruzleski, J.E., Closset, B.M. The treatment of liquid aluminum-silicon alloys. The American Foundrymen`s Society Inc. (1990), Des Plaines, Illinois, USA.
[11] Bekaert, F., Wettinck, E. Aluminium (1996), vol. 72, pp. 442-447.
[12] Nogita, K., Dahle, A. K. Effects of boron on eutectic modification of hypoeutectic
Al–Si alloys. Scripta Materialia (2003), vol. 48(3), pp. 307-313.
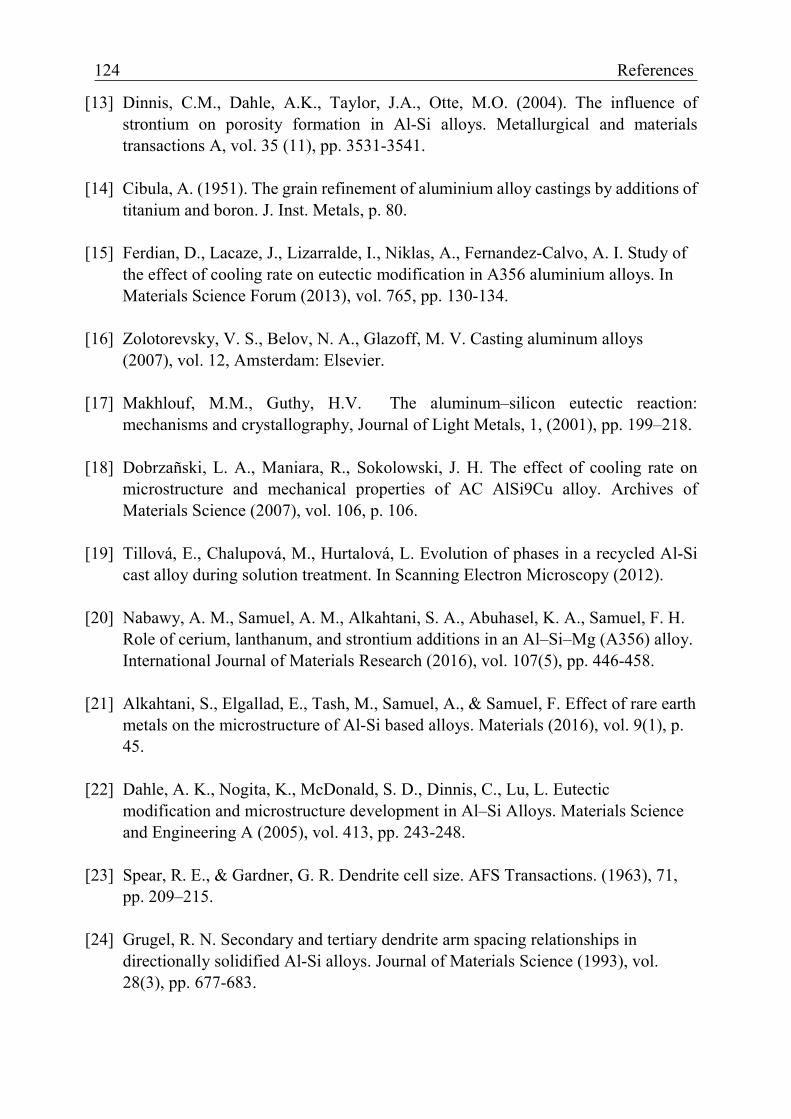
124 References
[13] Dinnis, C.M., Dahle, A.K., Taylor, J.A., Otte, M.O. (2004). The influence of strontium on porosity formation in Al-Si alloys. Metallurgical and materials transactions A, vol. 35 (11), pp. 3531-3541.
[14] Cibula, A. (1951). The grain refinement of aluminium alloy castings by additions of
titanium and boron. J. Inst. Metals, p. 80. [15] Ferdian, D., Lacaze, J., Lizarralde, I., Niklas, A., Fernandez-Calvo, A. I. Study of
the effect of cooling rate on eutectic modification in A356 aluminium alloys. In Materials Science Forum (2013), vol. 765, pp. 130-134.
[16] Zolotorevsky, V. S., Belov, N. A., Glazoff, M. V. Casting aluminum alloys
(2007), vol. 12, Amsterdam: Elsevier.
[17] Makhlouf, M.M., Guthy, H.V. The aluminum–silicon eutectic reaction: mechanisms and crystallography, Journal of Light Metals, 1, (2001), pp. 199–218.
[18] Dobrzañski, L. A., Maniara, R., Sokolowski, J. H. The effect of cooling rate on microstructure and mechanical properties of AC AlSi9Cu alloy. Archives of Materials Science (2007), vol. 106, p. 106.
[19] Tillová, E., Chalupová, M., Hurtalová, L. Evolution of phases in a recycled Al-Si cast alloy during solution treatment. In Scanning Electron Microscopy (2012).
[20] Nabawy, A. M., Samuel, A. M., Alkahtani, S. A., Abuhasel, K. A., Samuel, F. H. Role of cerium, lanthanum, and strontium additions in an Al–Si–Mg (A356) alloy. International Journal of Materials Research (2016), vol. 107(5), pp. 446-458.
[21] Alkahtani, S., Elgallad, E., Tash, M., Samuel, A., & Samuel, F. Effect of rare earth metals on the microstructure of Al-Si based alloys. Materials (2016), vol. 9(1), p. 45.
[22] Dahle, A. K., Nogita, K., McDonald, S. D., Dinnis, C., Lu, L. Eutectic modification and microstructure development in Al–Si Alloys. Materials Science and Engineering A (2005), vol. 413, pp. 243-248.
[23] Spear, R. E., & Gardner, G. R. Dendrite cell size. AFS Transactions. (1963), 71, pp. 209–215.
[24] Grugel, R. N. Secondary and tertiary dendrite arm spacing relationships in directionally solidified Al-Si alloys. Journal of Materials Science (1993), vol. 28(3), pp. 677-683.

References 125
[25] Ghosh, I., Das, S. K., Chakraborty, N. An artificial neural network model to characterize porosity defects during solidification of A356 aluminum alloy. Neural Computing and Applications (2014), vol. 25(3-4), pp. 653-662.
[26] Hosseini, V. A., Shabestari, S. G.; Gholizadeh, R. Study on the effect of cooling rate on the solidification parameters, microstructure, and mechanical properties of LM13 alloy using cooling curve thermal analysis technique. Materials & Design (2013), vol. 50, pp. 7-14.
[27] Steinbach, S., Ratke, L. The effect of rotating magnetic fields on the microstructure of directionally solidified Al–Si–Mg alloys. Materials Science and Engineering A (2005), vol. 413, pp. 200-204.
[28] Seifeddine, S., Sjölander, E., Bogdanoff, T. On the role of copper and cooling rates on the microstructure, defect formations and mechanical properties of Al-Si-Mg alloys. Materials Sciences and Applications (2013), vol. 4(03), p. 171.
[29] Shabestari, S. G. The effect of iron and manganese on the formation of intermetallic compounds in aluminum-silicon alloys. Materials Science and Engineering A (2004), 383, pp. 289-298.
[30] Tillová, E., Chalupová, M., Hurtalová, L. Evolution of phases in a recycled Al-Si
cast alloy during solution treatment. In Scanning Electron Microscopy (2012).
[31] Samuel, A. M., Samuel, F. H., Villeneuve, C., Doty, H. W., Valtierra, S. Effect of trace elements on β-Al5FeSi characteristics, porosity and tensile properties of Al-Si-Cu (319) cast alloys. International Journal of Cast Metals Research (2001), vol. 14(2), pp. 97-120.
[32] Samuel, F. H., Samuel, A. M., Ouellet, P., Doty, H. W. Effect of Mg and Sr
additions on the formation of intermetallics in Al-6 wt pct Si-3.5 wt pct Cu-(0.45) to (0.8) wt pct Fe 319-type alloys. Metallurgical and Materials Transactions A (1998), vol. 29(12), pp. 2871-2884.
[33] Zhang, B., Chen, W., & Poirier, D. R. (2000). Effect of solidification cooling rate on the fatigue life of A356. 2-T6 cast aluminium alloy. Fatigue and Fracture of Engineering Materials and Structures, vol. 23(5), pp. 417-423.
[34] Y. Shimizu, Y. Awano, M. Nakamura, in: Paper presented at 96th Casting
Congress 1992, Milwaukee, WI, AFS, pp. 92-135.
[35] Schleg, F. P. Technology of metal casting (2003), Chicago: American Foundrymen's Society.
126 References
[36] Wang, Q. G., Apelian, D., Lados, D. A. Fatigue behavior of A356/357 aluminum cast alloys. Part II–Effect of microstructural constituents. Journal of Light Metals (2001), vol. 1(1), pp. 85–97.
[37] Wang, L., Limodin, N., El Bartali, A., Witz, J. F., Seghir, R., Buffiere, J. Y., Charkaluk, E. Influence of pores on crack initiation in monotonic tensile and cyclic loadings in lost foam casting A319 alloy by using 3D in-situ analysis. Materials Science and Engineering A (2016), vol. 673, pp. 362-372.
[38] Fallböhmer, P., Rodrı́guez, C. A., Özel, T., & Altan, T. High-speed machining of cast iron and alloy steels for die and mold manufacturing. Journal of Materials Processing Technology (2000), vol. 98(1), pp. 104-115.
[39] Velluvakkandi, N. (2009). Developing an effective die cooling technique (Doctoral dissertation, Auckland University of Technology).
[40] Geffroy, P. M., Lakehal, M., Goñi, J., Beaugnon, E., Heintz, J. M., Silvain, J. F. Thermal and mechanical behavior of Al-Si alloy cast using magnetic molding and lost foam processes. Metallurgical and Materials Transactions A (2006), vol. 37(2), pp. 441-447.
[41] Hosseini, V. A., Shabestari, S. G., Gholizadeh, R. Study on the effect of cooling rate on the solidification parameters, microstructure, and mechanical properties of LM13 alloy using cooling curve thermal analysis technique. Materials & Design (2013), vol. 50, pp. 7-14.
[42] Butler, W. A. High-Pressure Die Casting. ASM handbook: Casting (2008), vol 15. United States of American: ASM International, Materials Park, OH: ASM International.
[43] Kaye, A, Street, A. Die Casting Metallurgy (1982), London UK, Butterworths
Scientific.
[44] Vinarcik, E. J. 2003. High integrity die casting processes, New York, Wiley.
[45] Upton, B. Pressure die casting. Pt.1, Metals, machines, furnaces. Headinton Hill Hall (1982), Oxford OX30BW, England, Pergamon Press Ltd.
[46] Butler, B. Die casting handbook Rosemont. IL: North American Die Casting
Association (2001), North American Die Casting Association.
[47] Gunasegaram, D. R., Givord, M., O'Donnell, R., Finnin, B. Improved quality and reduced cost through ATM high pressure die casting. Die casting engineer (2008), vol. 52(1), pp. 42-47.
References 127
[48] Thirugnanam, M. Modern High Pressure Die-Casting Processes for Aluminium
Castings. Indian Foundry Journal (2013), vol. 59(7), pp. 36-41.
[49] Apelian, D. High integrity aluminum die casting. Alloys, processes, & melt preparation. Rosemount, IL: North American Die Casting Association (2004), North American Die Casting Association.
[50] Sheshradri, M.R., Ramachandran, A. Casting fluidity and fluidity of aluminium and its alloys. Modern Casting (1965), vol. 21, pp. 110-122.
[51] Wang, L., Makhlouf, M., Apelian, D. Aluminium die casting alloys: alloy composition, microstructure, and properties-performnce relationships. Inter. Mater. Rev. (1995), vol. 40, pp. 225-252.
[52] Li, C., Liu, X., Wu, Y. Refinement and modification performance of Al–P master alloy on primary Mg2Si in Al–Mg–Si alloys. Journal of Alloys and Compounds (2008), vol. 465(1–2), pp. 145-150.
[53] Campbell, J. Castings. Butterworth-Heimann Ltd. (1991), Oxford.
[54] Flemings, M.C. Solidification Processing. McGraw-Hill Inc (1974), London.
[55] Eskin, D.G., Suyitno, Katgerman, L. Progress in Materials Science (2004), vol.49, pp. 629-711.
[56] Dobatkin, V. I. Continuous casting and casting properties of alloys. Oborongiz (1948), Moscow.
[57] Ohno, M., Sato, H. Macrosegregation simulation model based on Lattice-Boltzmann method with high computational efficiency. International Journal of Heat and Mass Transfer (2018), vol. 127, pp. 561-570.
[58] Bacaicoa, I., Lütje, M., Sälzer, P. Umbach, C. Brückner-Foit, A. Heim, H. P., Middendorf, B. Comparative investigation of two-dimensional imaging methods and X-ray tomography in the characterization of microstructure. Materials Testing (2017), vol. 59(10), pp. 829-836.
[59] Khadivinassab, H., Maijer, D. M., Cockcroft, S. L. Characterization of
macrosegregation in eutectic alloys. Materials Characterization (2017), vol. 129, pp. 319-322.
[60] Flemings, M. C., Niyama, E, Taylor, H.F. Fluidity of Aluminium alloys. An experimental and qualitative evaluation, AFS Trans. (1961), vol. 69, pp. 566-576.

128 References
[61] Sheshradri, M.R., Ramachandran, A. Casting fluidity and fluidity of aluminium
and its alloys, Modern Casting (1965), vol. 21, pp. 110-122.
[62] Gowri, S., Samuel, F.H. Effect of alloying elements on the solidification characteristics and microstructure of Al-Si-Cu-Mg-Fe 380 alloy, Metall. Trans. A (1994), vol. 25, pp. 437-448.
[63] Dahle, A.K., Bæckerund, L., Arnberg, L. Castability of Aluminim foundry alloys (1997), Final report for AFS.
[64] Rooy, E.L. Metals Handbook 9th Ed. (1988), Castings, ASM, vol. 15, pp. 743-770.
[65] Wang, L., Makhlouf, M., Apelian, D. Aluminium die casting alloys: alloy composition, microstructure, and properties-performnce relationships, Inter. Mater. Rev. (1995), vol.40, pp. 225-252.
[66] Mbuya T.O., Odera, B.O., Nganga. Influence of iron on castability and properties
of aluminum silicon alloys: literature review, Int. Jour. of Cast Met. Res. (2003), vol. 16, n.5, pp .451-465.
[67] Taylor, J. A. The effect of iron in Al-Si casting alloys. In 35th Australian foundry
institute national conference (2004), Adelaide, South Australia, vol. 31, pp. 148-157.
[68] Dinnis, C.M., Taylor, J.A., Dahle, A.K. Mater Sci Eng A (2006), vol. 425, pp.
[69] Roy, N., Samuel, A. M., Samuel, F. H. Porosity formation in AI-9 Wt pct Si-3 Wt
pct Cu alloy systems: Metallographic observations. Metallurgical and Materials transactions A (1996), vol. 27(2), pp. 415-429.
[70] Iwahori, H., Takamiya, H., Yonekura, Y. Yamamoto, M. Nakamura. Imono
(1988), vol. 60, pp. 590-595.
[71] Otte, M.O., McDonald, S.D., Taylor, J.A., StJohn, D.H., Schneider, W. AFS Trans. (1999), vol. 107, pp. 471-478.
[72] Puncreobutr, C., Phillion, A. B., Fife, J. L., Rockett, P., Horsfield, A. P., Lee, P. D.
In situ quantification of the nucleation and growth of Fe-rich intermetallics during Al alloy solidification. Acta Materialia (2014), vol. 79, pp. 292-303.
References 129
[73] Bacaicoa, I., Luetje, M., Wicke, M., Geisert, A., Zeismann, F., Fehlbier, M., Brueckner-Foit, A. 3D Morphology of Al5FeSi inclusions in high Fe-content Al-Si-Cu Alloys. Procedia Structural Integrity (2016), vol. 2, pp. 2269-2276.
[74] Bacaicoa, I., Wicke, M., Luetje, M., Zeismann, F., Brueckner-Foit, A., Geisert, A., Fehlbier, M. Characterization of casting defects in a Fe-rich Al-Si-Cu alloy by microtomography and finite element analysis. Engineering Fracture Mechanics (2017), vol. 183, pp. 159-169.
[75] Lu, S. Z., Hellawell, A. The mechanism of silicon modification in aluminum-silicon alloys: impurity induced twinning. Metallurgical Transactions A (1987), vol. 18(10), pp. 1721-1733.
[76] Hogan, L. M., Song, H. Aluminium grain structures in Al-Si eutectic alloys. Acta Metallurgica (1987), vol. 35(3), pp. 677-680.
[77] Dahle, A. K., Nogita, K., McDonald, S. D., Dinnis, C., Lu, L. Eutectic modification and microstructure development in Al–Si Alloys. Materials Science and Engineering A (2005), vol. 413, pp. 243-248.
[78] Ferdian, D., Lacaze, J., Lizarralde, I., Niklas, A., Fernandez-Calvo, A. I. Study of the effect of cooling rate on eutectic modification in A356 aluminium alloys. Materials Science Forum, vol. 765, pp. 130-134.
[79] Narayanan, L. A., Samuel, F. H., Gruzleski, J. E. Dissolution of iron intermetallics in Al-Si alloys through nonequilibrium heat treatment. Metallurgical and Materials Transactions A (1995), vol. 26(8), pp. 2161-2174.
[80] Yie, S. N., Lee, S. L., Lin, Y. H., Lin, J. C. Mechanical properties of Al-11% Si casting alloys containing trace Be and Sr. Materials transactions (1999)., JIM, vol. 40(4), pp. 294-300.
[81] Dehmas, M., Valdés, R., Lafont, M. C., Lacaze, J., Viguier, B. Identification of intermetallic precipitates formed during re-solidification of brazed aluminium alloys. Scripta materialia (2006), vol. 55(2), pp. 191-194.
[82] Choi, Y. S., Lee, J. S., Kim, W. T., Ra, H. Y. Solidification behavior of Al-Si-Fe alloys and phase transformation of metastable intermetallic compound by heat treatment. Journal of Materials Science (1999), vol. 34(9), pp. 2163-2168.
[83] Kral, M. V. A crystallographic identification of intermetallic phases in Al–Si alloys. Materials Letter (2005), vol. 59(18), pp. 2271-2276.
130 References
[84] Stein, F., Vogel, S.C., Eumann, M., Palm, M. Determination of the crystal structure of the ɛ-phase in the Fe–al system by high-temperature neutron diffraction. Intermetallics (2010), vol. 18, pp. 150-156.
[85] Shabestari, S. G., Gruzleski, J. E. Gravity segregation of complex intermetallic compounds in liquid aluminum-silicon alloys. Metallurgical and Materials Transactions A (1995), vol. 26(4), pp. 999-1006.
[86] Yu, J. M., Wanderka, N., Rack, A., Daudin, R., Boller, E., Markötter, H., Banhart, J. Formation of intermetallic δ phase in Al-10Si-0.3 Fe alloy investigated by in-situ 4D X-ray synchrotron tomography. Acta Materialia (2017), vol. 129, pp. 194-202.
[87] Samuel, A. M., Gauthier, J., Samuel, F. H. Microstructural aspects of the dissolution and melting of Al 2 Cu phase in Al-Si alloys during solution heat treatment. Metallurgical and Materials Transactions A (1996), vol. 27(7), pp.1785-1798.
[88] Li, Z., Samuel, A. M., Samuel, F. H., Ravindran, C., Valtierra, S. Effect of alloying elements on the segregation and dissolution of CuAl2 phase in Al-Si-Cu 319 alloys. Journal of materials science (2003), vol. 38(6), pp. 1203-1218.
[89] Lasa, L., Rodriguez-Ibabe, J. M. Characterization of the dissolution of the Al2Cu phase in two Al–Si–Cu–Mg casting alloys using calorimetry. Materials Characterization (2002), vol. 48(5), pp. 371-378.
[90] Moustafa, M. A., Samuel, F. H., Doty, H. W. Effect of solution heat treatment and additives on the microstructure of Al-Si (A413. 1) automotive alloys. Journal of Materials Science (2003), vol. 38(22), pp. 4507-4522.
[91] Mohamed, A. M. A.; Samuel, F. H. A review on the heat treatment of Al-Si-Cu/Mg casting alloys. In Heat Treatment-Conventional and Novel Applications (2012).
[92] Hilbrans, H. Nichteisenmetalle. In: Bargel, H.-J.; Schulze, G.: Werkstoffkunde - Mit 85 Tabellen, 9., bearb. Aufl., Springer, Berlin, Heidelberg, 2005.
[93] Kammer, C. Aluminium-Taschenbuch. 16. Aluminium-Verl., Düsseldorf (2009), ISBN 3870172924.
[94] Maire, E., Withers, P. J. Quantitative X-ray tomography. International materials reviews (2014), vol. 59(1), pp. 1-43.

References 131
[95] Buffiere, J. Y., Maire, E., Cloetens, P., Lormand, G., Fougeres, R. Characterization of internal damage in a MMCp using X-ray synchrotron phase contrast microtomography. Acta materialia (1999), vol. 47(5), pp. 1613-1625.
[96] Babout, L., Maire, E., Fougeres, R. Damage initiation in model metallic materials: X-ray tomography and modelling. Acta Materialia (2004), vol. 52(8), pp. 2475-2487.
[97] Borbély, A., Kenesei, P., Biermann, H. Estimation of the effective properties of particle-reinforced metal–matrix composites from microtomographic reconstructions. Acta materialia (2006), vol. 54(10), pp. 2735-2744.
[98] Watson, I. G., Forster, M. F., Lee, P. D., Dashwood, R. J., Hamilton, R. W., Chirazi, A. Investigation of the clustering behaviour of titanium diboride particles in aluminium. Composites Part A: Applied Science and Manufacturing (2005), vol. 36(9), pp. 1177-1187.
[99] Toda, H., Hidaka, T., Kobayashi, M., Uesugi, K., Takeuchi, A., Horikawa, K. Growth behavior of hydrogen micropores in aluminum alloys during high-temperature exposure. Acta Materialia (2009), vol. 57(7), pp. 2277-2290.
[100] Landron, C., Maire, E., Adrien, J., Bouaziz, O., Di Michiel, M., Cloetens, P., & Suhonen, H. Resolution effect on the study of ductile damage using synchrotron X-ray tomography. Nuclear Instruments and Methods in Physics Research Section B: Beam Interactions with Materials and Atoms (2012), vol. 284, pp. 15-18.
[101] Maire, E., Grenier, J. C., Daniel, D., Baldacci, A., Klöcker, H., Bigot, A.
Quantitative 3D characterization of intermetallic phases in an Al–Mg industrial alloy by X-ray microtomography. Scripta materialia (2006), vol. 55(2), pp. 123-126.
[102] Dezecot, S., Buffiere, J. Y., Koster, A., Maurel, V., Szmytka, F., Charkaluk, E., Witz, J. F. In situ 3D characterization of high temperature fatigue damage mechanisms in a cast aluminum alloy using synchrotron X-ray tomography. Scripta Materialia (2016), vol. 113, pp. 254-258.
[103] Paganin, D., Mayo, S. C., Gureyev, T. E., Miller, P. R., & Wilkins, S. W. Simultaneous phase and amplitude extraction from a single defocused image of a homogeneous object. Journal of microscopy (2002), 206(1), 33-40.
[104] Lak M., Neraudeau D., Nel A., Cloetens P., Perrichot V. and Tafforeau P.. Phase contrast X-ray synchrotron imaging: opening access to fossil inclusions in opaque amber, Microsc. Microanal. (2008), vol. 14, (3), pp. 251–259.
132 References
[105] D. Penney, A., McNeil, D. I., Green, R., Bradley, Y. M., Marusik, P. J. Withers,
R. F. Preziosi. A new species of anapid spider (Araneae: Araneoidea, Anapidae) in Eocene Baltic amber, imaged using phase contrast X-ray computed micro-tomography, Zootaxa (2011), vol. 2742, pp. 60–66.
[106] Rios, C. T., Caram, R., Bolfarini, C., Botta, F. W. J., Kiminami, C. S. Intermetallic compounds in the Al-Si-Cu system. Acta microscopia (2003), vol. 12, pp. 77-82.
[107] Greer, A. L., Cooper, P. S., Meredith, M. W., Schneider, W., Schumacher, P., Spittle, J. A., Tronche, A. Grain refinement of aluminium alloys by inoculation. Advanced Engineering Materials (2003), vol. 5(1‐2), pp. 81-91.
[108] Tronche, A., Gloria, D., Gruzleski, J. E. A general grain size determination
technique for Al-Si casting alloys. International Journal of Cast Metals Research (1999), vol. 11(4), pp. 211-218.
[109] Luetje, M., Wicke, M., Bacaicoa, I., Brueckner-Foit, A., Geisert, A., Fehlbier, M. 3D characterization of fatigue damage mechanisms in a cast aluminum alloy using X-ray tomography. International Journal of Fatigue (2017), vol. 103, pp. 363-370.
[110] Bacaicoa, I., Dwivedi, P. K., Luetje, M., Zeismann, F., Brueckner-Foit, A., Geisert, A., Fehlbier, M. Effect of non-equilibrium heat treatments on microstructure and tensile properties of an Al-Si-Cu alloy. Materials Science and Engineering A (2016), vol. 673, pp. 562-571.
[111] Brueckner-Foit, A., Bacaicoa, I., Luetje, M.; Wicke, M.; Geisert, A.; Fehlbier, M. 3D characterization of the fracture mechanisms of a Fe-rich Al-Si-Cu alloy. In MATEC Web of Conferences (2018), vol. 165, p. 04006.
[112] Brueckner-Foit, A., Luetje, M., Wicke, M., Bacaicoa, I., Geisert, A., Fehlbier, M. On the role of internal defects in the fatigue damage process of a cast Al-Si-Cu alloy. International Journal of Fatigue (2018), vol. 116, pp. 562-571.
[113] MAGMA Gießereitechnologie Gmbh. MAGMASOFT. http://magmasoft.de.
[114] DIN 50125:2009-07. Prüfung metallischer Werkstoffe – Zugproben. 4. Formen, Maße und Bezeichnung, 4.6 Zugprobe Form E.
[115] Serrano-Munoz, I., Buffiere, J. Y., Verdu, C., Gaillard, Y., Mu, P., Nadot, Y. Influence of surface and internal casting defects on the fatigue behaviour of
References 133
A357-T6 cast aluminium alloy. International Journal of Fatigue (2016), vol. 82, pp. 361-370.
[116] Serrano-Munoz, I., Buffiere, J. Y., Verdu, C., Gaillard, Y., Mu, P., & Nadot, Y.
Influence of surface and internal casting defects on the fatigue behaviour of A357-T6 cast aluminium alloy. International Journal of Fatigue (2016), vol. 82, pp. 361-370.
[117] Serrano-Munoz, I., Buffiere, J. Y., Mokso, R., Verdu, C., Nadot, Y. Location,
location & size: defects close to surfaces dominate fatigue crack initiation. Scientific reports (2017), vol. 7, p. 45239.
[118] Altair Hyperworks. Click2Cast. http.//click2cast.com.
[119] Zhang, D.L.; Zheng, L. The quench sensitivity of cast Al-7Si-0.4Mg alloy. Metallurgical and Materials Transactions A (1996); vol. 27A; pp. 3983-3991.
[120] Osten, J., Milkereit, B., Schick, C., Kessler, O. Dissolution and Precipitation Behaviour during Continuous Heating of Al–Mg–Si Alloys in a Wide Range of Heating Rates. Materials (2015); vol. 8; pp. 2830-2848.
[121] Microcut Silicon Carbide. Buehler. http://buehler.com/grinding-polishing.php.
[122] AutoMet 250. Buehler. http://buehler.com/grinding-polishing.php.
[123] ZEISS Axioplan. Carl Zeiss AG. https://www.micro-shop.zeiss.com/.
[124] ZEISS AxioVision SE64 Rel. 4.8. Carl Zeiss AG. https://www.micro-shop.zeiss.com.
[125] Schneider, C. A., Rasband, W. S., Eliceiri, K. W. NIH Image to ImageJ: 25 years of image analysis. Nature methods (2012), vol. 9(7), p. 671.
[126] ZEISS Ultra Plus. Carl Zeiss AG. http://zeiss.de/mikroskopie/produkte/rasterelektronenmikroskope/ultra-materials.html#ultra-plus.
[127] ESPRIT 2 Software. Bruker Corporation. https://www.bruker.com/products/x-ray-diffraction-and-elemental-analysis/eds-wds-ebsd-sem-micro-xrf-and-sem-micro-ct/esprit-2.html.
[128] ZEISS Xradia Versa 520. Carl Zeiss AG. https://www.zeiss.com/microscopy/us/products/x-ray-microscopy/xradia-downloads.html

134 References
[129] FEI Company. Avizo 3D Software 9.1/9.2. https://www.fei.com/software/avizo-
release-notes/.
[130] 3D Systems. Geomagic Studio 2014. http://3dsystems.com.
[131] Wicke, M., Luetje, M., Bacaicoa, I., Brueckner-Foit, A. Characterization of casting pores in Fe-rich Al-Si-Cu alloys by microtomography and finite element analysis. Procedia Structural Integrity (2016), vol. 2, pp. 2643-2649.
[132] Dassault Systemes. Abaqus. https://www.3ds.com/es/productos-y-servicios/simulia/productos/abaqus/.
[133] Yi, J.Z., Gao, Y.X., Lee, P.D., Lindley, T.C. Effect of Fe-content on fatigue crack initiation and propagation in a cast-alumium-silicon alloy (A356-T6). Mater. Sci. Eng. A (2004), vol. 286, pp. 396-407.
[134] Montgomery, D. C. (2017). Design and analysis of experiments. John wiley & sons.
[135] Nicoletto, G., Anzelotti, G., Konecna, R. X-ray Computed Tomography vs. Metallography for Pore Sizing and Fatigue of Cast Al-alloys (2010). Procedia Engineering 2, pp. 547-554.
[136] De Hoff, R.T. Stereological Characterization of Plates and Platelet Growth. Metallurgical Transactions A (1948), vol. 10A.
[137] Elias, H. Proceedings of the Second International Congress for Stereology
(1967), Chicago.
[138] Vogel, H. J., Babel, U. Experimental relationship between the morphological pore-size distribution and the soil water-retention characteristic. In Developments in Soil Science (1993), vol. 22, pp. 591-600.
[139] Toramaru, A. Measurement of bubble size distributions in vesiculated rocks with
implications for quantitative estimation of eruption processes. Journal of Volcanology and Geothermal Research (1990), vol. 43(1-4), pp. 71-90.
[140] Sahagian, D. L., Proussevitch, A. A. 3D particle size distributions from 2D
observations: stereology for natural applications. Journal of Volcanology and Geothermal Research (1998), vol. 84(3-4), pp. 173-196.
[141] SPM data MMC-80-4BSD. M2C, point electronic GmbH, http://www.m2c-calibration.de/.

References 135
[142] microCal. m2c, point electronic GmbH, http://www.m2c-calibration.de/.
[143] microShape. m2c, point electronic GmbH, http://www.m2c-calibration.de/.
136 Appendix
Appendix 1 List of publications
[1] Bacaicoa, I., Dwivedi, P. K., Luetje, M., Zeismann, F., Brueckner-
Foit, A., Geisert, A., Fehlbier, M. Effect of non-equilibrium heat treatments on microstructure and tensile properties of an Al-Si-Cu alloy. Materials Science and Engineering A (2016), vol. 673, pp. 562-571.
[2] Bacaicoa, I., Luetje, M., Wicke, M., Geisert, A., Zeismann, F.,
Fehlbier, M., Brueckner-Foit, A. 3D Morphology of Al5FeSi inclusions in high Fe-content Al-Si-Cu Alloys. Procedia Structural Integrity (2016), vol. 2, pp. 2269-2276.
[3] Bacaicoa, I., Wicke, M., Luetje, M., Zeismann, F., Brueckner-Foit,
A., Geisert, A., Fehlbier, M. Characterization of casting defects in a Fe-rich Al-Si-Cu alloy by microtomography and finite element analysis. Engineering Fracture Mechanics (2017), vol. 183, pp. 159-169.
[4] Bacaicoa, I., Lütje, M., Sälzer, P., Umbach, C., Brückner-Foit, A.,
Heim, H. P., Middendorf, B. Comparative investigation of two-dimensional imaging methods and X-ray tomography in the characterization of microstructure. Materials Testing (2017), vol. 59(10), pp. 829-836.
[5] Brueckner-Foit, A., Bacaicoa, I., Luetje, M., Wicke, M., Geisert, A.,
Fehlbier, M. 3D characterization of the fracture mechanisms of a Fe-rich Al-Si-Cu alloy. In MATEC Web of Conferences (2018), vol. 165, p. 04006.

137