Embed Size (px)
Citation preview
E
Ya
b
a
ARRAA
KCCIAP
1
biftsrtiior[
csft6
0d
Electrochimica Acta 56 (2011) 1752–1760
Contents lists available at ScienceDirect
Electrochimica Acta
journa l homepage: www.e lsev ier .com/ locate /e lec tac ta
ffect of H2S on the CO2 corrosion of carbon steel in acidic solutions
oon-Seok Choia,∗, Srdjan Nesica, Shiun Lingb
Institute for Corrosion and Multiphase Technology, Department of Chemical and Biomolecular Engineering, Ohio University, 342 West State Street, Athens, OH 45701, USAExxonMobil Research and Engineering Company, 1545 Route 22 East, Annandale, NJ 08801, USA
r t i c l e i n f o
rticle history:eceived 30 June 2010eceived in revised form 13 August 2010ccepted 14 August 2010vailable online 20 August 2010
eywords:O2/H2S corrosionarbon steel
a b s t r a c t
The objective of this study is to evaluate the effect of low-level hydrogen sulfide (H2S) on carbon diox-ide (CO2) corrosion of carbon steel in acidic solutions, and to investigate the mechanism of iron sulfidescale formation in CO2/H2S environments. Corrosion tests were conducted using 1018 carbon steel in1 wt.% NaCl solution (25 ◦C) at pH of 3 and 4, and under atmospheric pressure. The test solution wassaturated with flowing gases that change with increasing time from CO2 (stage 1) to CO2/100 ppm H2S(stage 2) and back to CO2 (stage 3). Corrosion rate and behavior were investigated using linear polar-ization resistance (LPR) technique. Electrochemical impedance spectroscopy (EIS) and potentiodynamictests were performed at the end of each stage. The morphology and compositions of surface corrosion
ron sulfidecid solutionsrecipitation
products were analyzed using scanning electron microscopy (SEM)/energy dispersive spectroscopy (EDS)and X-ray photoelectron spectroscopy (XPS). The results showed that the addition of 100 ppm H2S to CO2
induced rapid reduction in the corrosion rate at both pHs 3 and 4. This H2S inhibition effect is attributedto the formation of thin FeS film (tarnish) on the steel surface that suppressed the anodic dissolutionreaction. The study results suggested that the precipitation of iron sulfide as well as iron carbonate filmis possible in the acidic solutions due to the local supersaturation in regions immediately above the steel
rovid
surface, and these films p. Introduction
The number of sour (CO2 + H2S containing) oil and gas fieldseing produced worldwide is increasing, as sweet (CO2 contain-
ng) fields are being depleted, and higher oil prices made it possibleor profitable development of sour oil and gas fields. A concern inhe production and transportation sour oil and gas is the corro-ion caused by the acid gases CO2 and H2S. Even though corrosionesistant alloys (CRA) has long been available as a material selec-ion option that mitigates CO2 and H2S corrosion, carbon steel isn general more cost-effective for oil and gas facilities and hence,s the most widely used material option [1]. The internal corrosionf carbon steel pipeline in the presence of CO2 and H2S was firstlyecognized in the 1940s and has been investigated for over 60 years2].
Several studies have shown that the presence of H2S could eitherause an acceleration or an inhibition of the corrosion of carbon
teel, depending on the partial pressure of H2S. It was reportedrom early studies that at H2S concentrations below 690 Pa, a pro-ective iron sulfide film formed. At H2S concentrations greater than90 Pa, a non-protective film formed [3–5]. More recently, Ma et al.∗ Corresponding author. Tel.: +1 740 593 9944.E-mail address: [email protected] (Y.-S. Choi).
013-4686/$ – see front matter © 2010 Elsevier Ltd. All rights reserved.oi:10.1016/j.electacta.2010.08.049
e corrosion protection in the acidic solutions.© 2010 Elsevier Ltd. All rights reserved.
claimed that H2S provides a strong inhibition under certain specialconditions that have lower H2S concentration (≤0.04 mmol dm−3),pH value of 3–5, and longer immersion time (≥2 h) [6]. Abelev et al.also reported that 5 ppm of H2S concentration have an inhibitingeffect on corrosion in the presence of CO2 [7]. Even though there isno absolute criterion for the H2S concentration that provides inhi-bition, it has been suggested that the inhibition effect is related tothe formation of iron sulfide with different crystal structures, suchas amorphous ferrous sulfide, mackinawite, cubic ferrous sulfide,smythite, greigite, pyrrhotite, troilite, and pyrite [8–12].
However, there is no clear understanding of the nature of thesurface layer formed in CO2/H2S environments as well as their pro-tective properties in acidic solutions when the concentration of H2Sis too low to cause a concern of the surface layer cracking or blis-tering. The objective of this study is to evaluate the effect of verylow-level H2S on CO2 corrosion of carbon steel in acidic solutions,and to investigate the mechanism of the iron sulfide layer formationin CO2/H2S environments.
2. Experimental
The specimens were made of carbon steel (AISI C1018) that has achemical composition of 0.21% C, 0.05% Mn, 0.09% P, 0.05% S, 0.38%Si and balance Fe. The specimen shape was of a cylindrical geom-etry, 1.3 cm in diameter and 1.3 cm in height, and would have its
Y.-S. Choi et al. / Electrochimica A
oft
tceocstttw2va
mtrCeltLlr
j
c
TT
Fig. 1. Schematics of the test apparatus.
uter surface exposed to solution during testing. The specimen sur-ace was grounded to a 600 grit finish using silicon carbide paper,hen cleaned with isopropyl alcohol in an ultrasonic bath and dried.
The corrosion tests were carried out in a 2 L glass cell which con-ained a rotating cylinder working electrode, a reference electrodeonsisted of a glass capillary probe connected to a saturated Ag/AgCllectrode, and a platinum wire counter electrode. The schematicf this experimental setup is shown in Fig. 1. All the tests wereonducted in 1 wt.% NaCl solutions at room temperature and atmo-pheric pressure. Gas mass-flow controllers were used to controlhe flow rates of CO2 and H2S to the test cell, as well as to obtainhe desired H2S concentration. These gases were mixed by flowinghrough a mixer before injecting into the test cell. Before specimenas inserted into the solution, the solution was purged with CO2 forh in order to deoxygenate, then with pH adjusted to the desiredalue by adding a deoxygenated HCl solution or NaHCO3 solutions appropriate.
Table 1 shows the test conditions, and Fig. 2 shows the experi-ental procedures. This test procedure was designed to investigate
he effect of H2S on the corrosion of carbon steel in CO2 envi-onments; the environment was changed from CO2 (stage 1) toO2/100 ppm H2S (stage 2) and then back to CO2 (stage 3). Duringxperiment, instantaneous corrosion rates were monitored withinear polarization resistance (LPR) measurements made at regularime intervals. Using the polarization resistance (Rp) obtained fromPR measurements, the corrosion current density (jcorr) was calcu-ated using Eq. (1) [13], and the resulting jcorr yields the corrosionate using Eq. (2) [14]:
corr = B = ˇa × ˇc (1)
Rp 2.3× Rp × (ˇa + ˇc)orrosion rate (mm/year) = 0.00327× jcorr (�A/cm2)× EW
density (g/cm3)(2)
able 1est conditions.
Parameter Description
Material C1018 carbon steelRotation speed 1000 rpmSolution Deionized water with 1 wt.% NaClTemperature 25 ◦CTotal pressure 0.1 MPaCO2 partial pressure 0.097 MPaH2S concentration 100 ppm (0.01 kPa)pH 3, 4
cta 56 (2011) 1752–1760 1753
where ˇa is the anodic Tafel constant, ˇc is the cathodic Tafel con-stant, 0.00327 is a constant factor used for dimension and timeconversion factor, and EW is the equivalent weight in grams. In thepresent study, different B values were applied to each stage. ForCO2 environments (stages 1 and 3), 0.026 V was used as B value,whereas 0.013 V was used for CO2/H2S environment (stage 2).
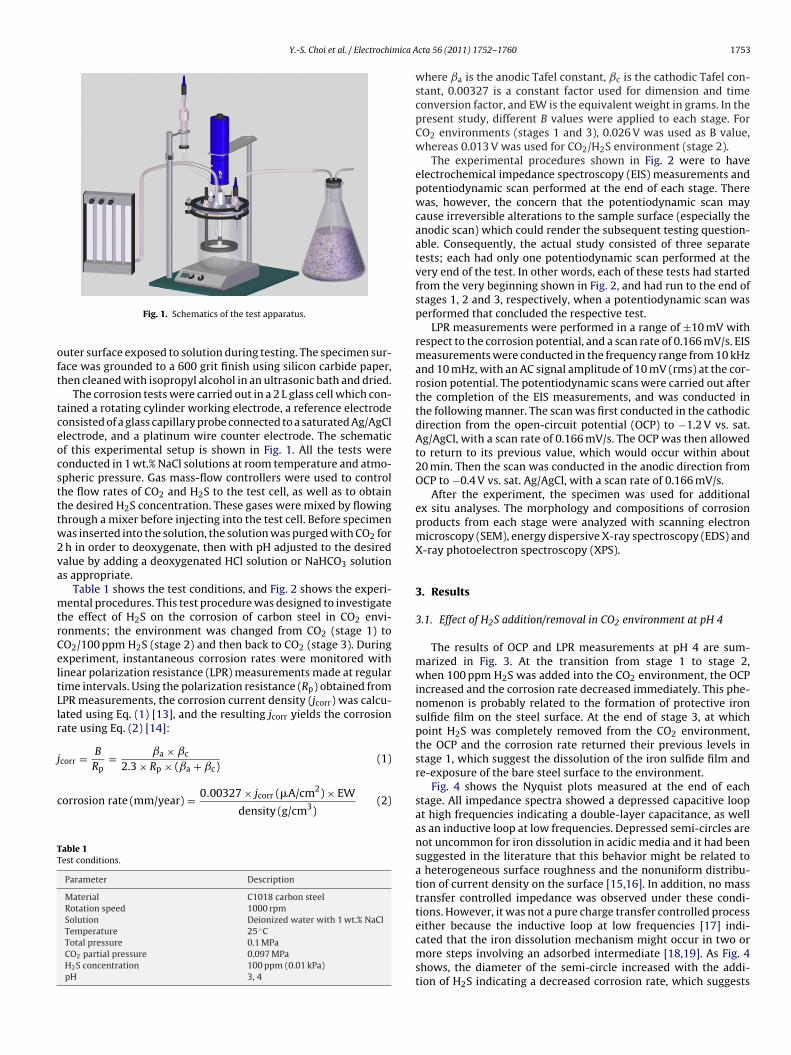
The experimental procedures shown in Fig. 2 were to haveelectrochemical impedance spectroscopy (EIS) measurements andpotentiodynamic scan performed at the end of each stage. Therewas, however, the concern that the potentiodynamic scan maycause irreversible alterations to the sample surface (especially theanodic scan) which could render the subsequent testing question-able. Consequently, the actual study consisted of three separatetests; each had only one potentiodynamic scan performed at thevery end of the test. In other words, each of these tests had startedfrom the very beginning shown in Fig. 2, and had run to the end ofstages 1, 2 and 3, respectively, when a potentiodynamic scan wasperformed that concluded the respective test.
LPR measurements were performed in a range of ±10 mV withrespect to the corrosion potential, and a scan rate of 0.166 mV/s. EISmeasurements were conducted in the frequency range from 10 kHzand 10 mHz, with an AC signal amplitude of 10 mV (rms) at the cor-rosion potential. The potentiodynamic scans were carried out afterthe completion of the EIS measurements, and was conducted inthe following manner. The scan was first conducted in the cathodicdirection from the open-circuit potential (OCP) to −1.2 V vs. sat.Ag/AgCl, with a scan rate of 0.166 mV/s. The OCP was then allowedto return to its previous value, which would occur within about20 min. Then the scan was conducted in the anodic direction fromOCP to −0.4 V vs. sat. Ag/AgCl, with a scan rate of 0.166 mV/s.
After the experiment, the specimen was used for additionalex situ analyses. The morphology and compositions of corrosionproducts from each stage were analyzed with scanning electronmicroscopy (SEM), energy dispersive X-ray spectroscopy (EDS) andX-ray photoelectron spectroscopy (XPS).
3. Results
3.1. Effect of H2S addition/removal in CO2 environment at pH 4
The results of OCP and LPR measurements at pH 4 are sum-marized in Fig. 3. At the transition from stage 1 to stage 2,when 100 ppm H2S was added into the CO2 environment, the OCPincreased and the corrosion rate decreased immediately. This phe-nomenon is probably related to the formation of protective ironsulfide film on the steel surface. At the end of stage 3, at whichpoint H2S was completely removed from the CO2 environment,the OCP and the corrosion rate returned their previous levels instage 1, which suggest the dissolution of the iron sulfide film andre-exposure of the bare steel surface to the environment.
Fig. 4 shows the Nyquist plots measured at the end of eachstage. All impedance spectra showed a depressed capacitive loopat high frequencies indicating a double-layer capacitance, as wellas an inductive loop at low frequencies. Depressed semi-circles arenot uncommon for iron dissolution in acidic media and it had beensuggested in the literature that this behavior might be related toa heterogeneous surface roughness and the nonuniform distribu-tion of current density on the surface [15,16]. In addition, no masstransfer controlled impedance was observed under these condi-tions. However, it was not a pure charge transfer controlled process
either because the inductive loop at low frequencies [17] indi-cated that the iron dissolution mechanism might occur in two ormore steps involving an adsorbed intermediate [18,19]. As Fig. 4shows, the diameter of the semi-circle increased with the addi-tion of H2S indicating a decreased corrosion rate, which suggests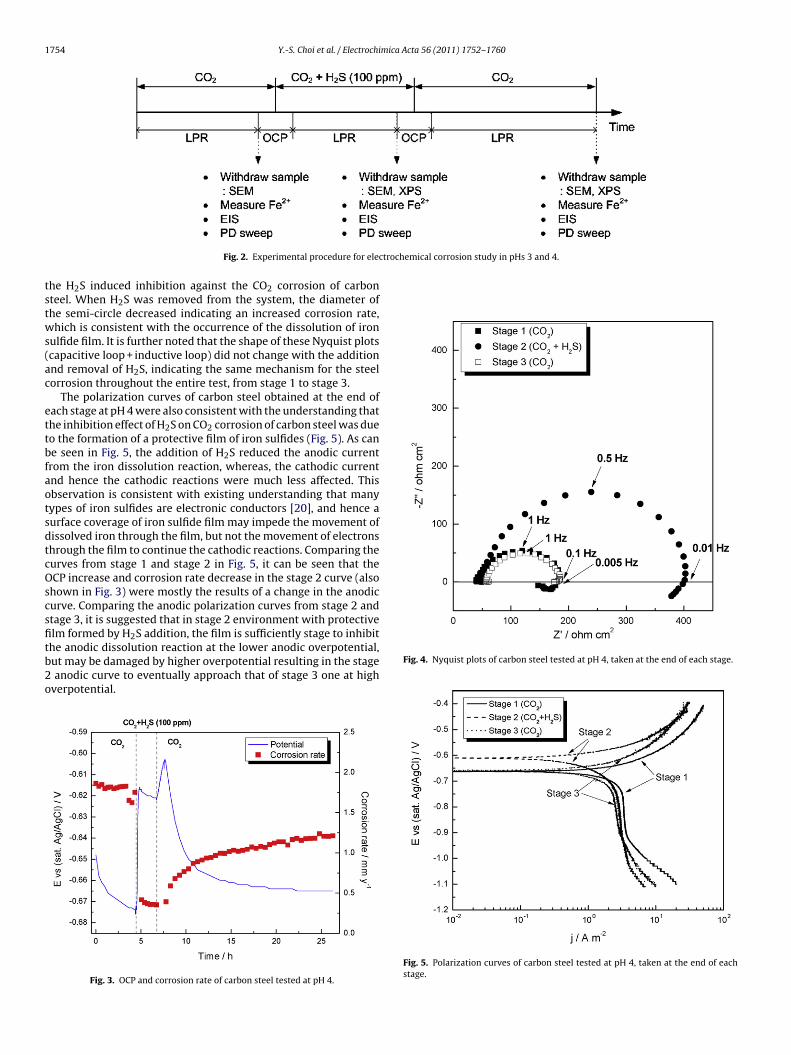
1754 Y.-S. Choi et al. / Electrochimica Acta 56 (2011) 1752–1760
trochemical corrosion study in pHs 3 and 4.
tstws(ac
ettbfaotsdtcOscsfitb2o
Fig. 2. Experimental procedure for elec
he H2S induced inhibition against the CO2 corrosion of carbonteel. When H2S was removed from the system, the diameter ofhe semi-circle decreased indicating an increased corrosion rate,hich is consistent with the occurrence of the dissolution of iron
ulfide film. It is further noted that the shape of these Nyquist plotscapacitive loop + inductive loop) did not change with the additionnd removal of H2S, indicating the same mechanism for the steelorrosion throughout the entire test, from stage 1 to stage 3.
The polarization curves of carbon steel obtained at the end ofach stage at pH 4 were also consistent with the understanding thathe inhibition effect of H2S on CO2 corrosion of carbon steel was dueo the formation of a protective film of iron sulfides (Fig. 5). As cane seen in Fig. 5, the addition of H2S reduced the anodic currentrom the iron dissolution reaction, whereas, the cathodic currentnd hence the cathodic reactions were much less affected. Thisbservation is consistent with existing understanding that manyypes of iron sulfides are electronic conductors [20], and hence aurface coverage of iron sulfide film may impede the movement ofissolved iron through the film, but not the movement of electronshrough the film to continue the cathodic reactions. Comparing theurves from stage 1 and stage 2 in Fig. 5, it can be seen that theCP increase and corrosion rate decrease in the stage 2 curve (also
hown in Fig. 3) were mostly the results of a change in the anodicurve. Comparing the anodic polarization curves from stage 2 andtage 3, it is suggested that in stage 2 environment with protective
lm formed by H2S addition, the film is sufficiently stage to inhibithe anodic dissolution reaction at the lower anodic overpotential,ut may be damaged by higher overpotential resulting in the stageanodic curve to eventually approach that of stage 3 one at highverpotential.
Fig. 3. OCP and corrosion rate of carbon steel tested at pH 4.
Fig. 4. Nyquist plots of carbon steel tested at pH 4, taken at the end of each stage.
Fig. 5. Polarization curves of carbon steel tested at pH 4, taken at the end of eachstage.
Y.-S. Choi et al. / Electrochimica Acta 56 (2011) 1752–1760 1755
Fs
ldsisE
3
atb
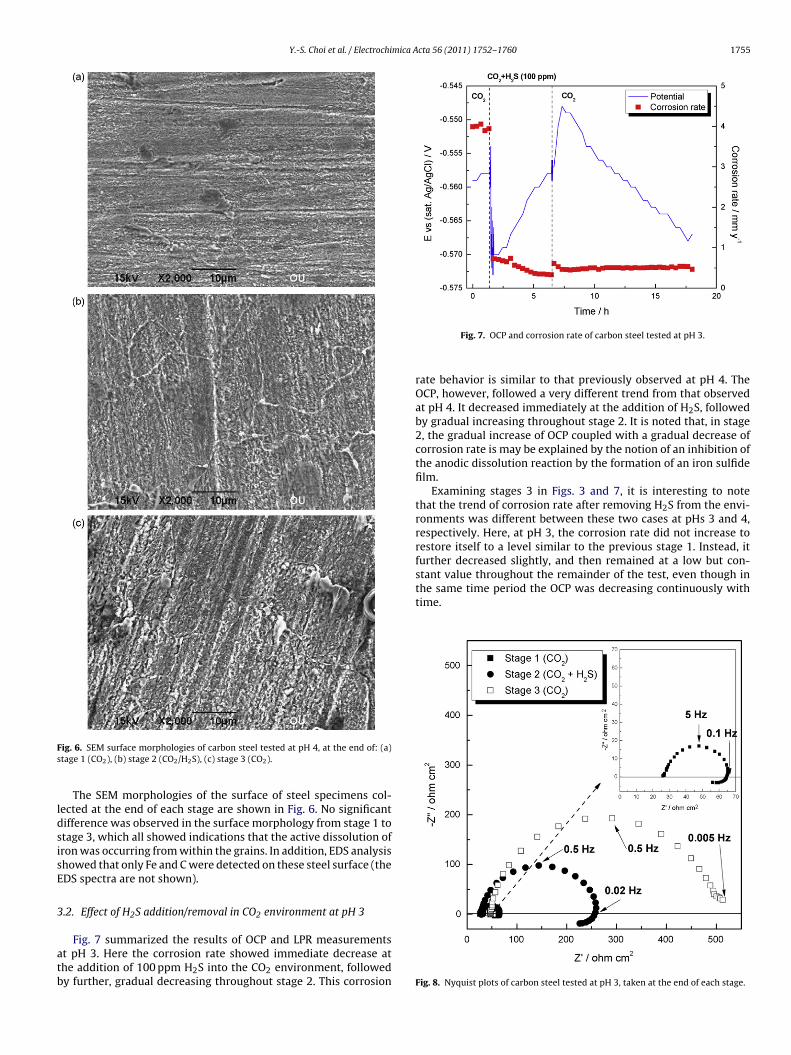
stant value throughout the remainder of the test, even though inthe same time period the OCP was decreasing continuously withtime.
ig. 6. SEM surface morphologies of carbon steel tested at pH 4, at the end of: (a)tage 1 (CO2), (b) stage 2 (CO2/H2S), (c) stage 3 (CO2).
The SEM morphologies of the surface of steel specimens col-ected at the end of each stage are shown in Fig. 6. No significantifference was observed in the surface morphology from stage 1 totage 3, which all showed indications that the active dissolution ofron was occurring from within the grains. In addition, EDS analysishowed that only Fe and C were detected on these steel surface (theDS spectra are not shown).
.2. Effect of H2S addition/removal in CO2 environment at pH 3
Fig. 7 summarized the results of OCP and LPR measurementst pH 3. Here the corrosion rate showed immediate decrease athe addition of 100 ppm H2S into the CO2 environment, followedy further, gradual decreasing throughout stage 2. This corrosion
Fig. 7. OCP and corrosion rate of carbon steel tested at pH 3.
rate behavior is similar to that previously observed at pH 4. TheOCP, however, followed a very different trend from that observedat pH 4. It decreased immediately at the addition of H2S, followedby gradual increasing throughout stage 2. It is noted that, in stage2, the gradual increase of OCP coupled with a gradual decrease ofcorrosion rate is may be explained by the notion of an inhibition ofthe anodic dissolution reaction by the formation of an iron sulfidefilm.
Examining stages 3 in Figs. 3 and 7, it is interesting to notethat the trend of corrosion rate after removing H2S from the envi-ronments was different between these two cases at pHs 3 and 4,respectively. Here, at pH 3, the corrosion rate did not increase torestore itself to a level similar to the previous stage 1. Instead, itfurther decreased slightly, and then remained at a low but con-
Fig. 8. Nyquist plots of carbon steel tested at pH 3, taken at the end of each stage.
1756 Y.-S. Choi et al. / Electrochimica Acta 56 (2011) 1752–1760
Fs
Tdttt1tcsdwtw
sitltctttt
fipds
4
siorfcrs
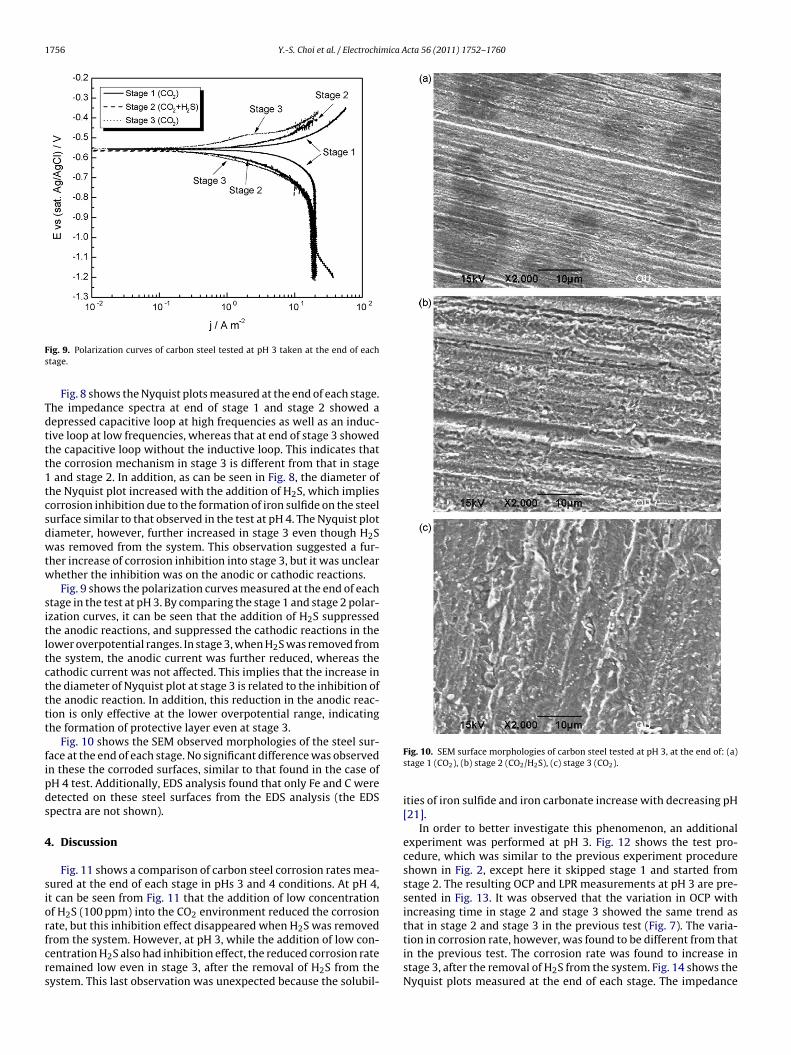
ig. 9. Polarization curves of carbon steel tested at pH 3 taken at the end of eachtage.
Fig. 8 shows the Nyquist plots measured at the end of each stage.he impedance spectra at end of stage 1 and stage 2 showed aepressed capacitive loop at high frequencies as well as an induc-ive loop at low frequencies, whereas that at end of stage 3 showedhe capacitive loop without the inductive loop. This indicates thathe corrosion mechanism in stage 3 is different from that in stageand stage 2. In addition, as can be seen in Fig. 8, the diameter of
he Nyquist plot increased with the addition of H2S, which impliesorrosion inhibition due to the formation of iron sulfide on the steelurface similar to that observed in the test at pH 4. The Nyquist plotiameter, however, further increased in stage 3 even though H2Sas removed from the system. This observation suggested a fur-
her increase of corrosion inhibition into stage 3, but it was unclearhether the inhibition was on the anodic or cathodic reactions.
Fig. 9 shows the polarization curves measured at the end of eachtage in the test at pH 3. By comparing the stage 1 and stage 2 polar-zation curves, it can be seen that the addition of H2S suppressedhe anodic reactions, and suppressed the cathodic reactions in theower overpotential ranges. In stage 3, when H2S was removed fromhe system, the anodic current was further reduced, whereas theathodic current was not affected. This implies that the increase inhe diameter of Nyquist plot at stage 3 is related to the inhibition ofhe anodic reaction. In addition, this reduction in the anodic reac-ion is only effective at the lower overpotential range, indicatinghe formation of protective layer even at stage 3.
Fig. 10 shows the SEM observed morphologies of the steel sur-ace at the end of each stage. No significant difference was observedn these the corroded surfaces, similar to that found in the case ofH 4 test. Additionally, EDS analysis found that only Fe and C wereetected on these steel surfaces from the EDS analysis (the EDSpectra are not shown).
. Discussion
Fig. 11 shows a comparison of carbon steel corrosion rates mea-ured at the end of each stage in pHs 3 and 4 conditions. At pH 4,t can be seen from Fig. 11 that the addition of low concentrationf H2S (100 ppm) into the CO2 environment reduced the corrosion
ate, but this inhibition effect disappeared when H2S was removedrom the system. However, at pH 3, while the addition of low con-entration H2S also had inhibition effect, the reduced corrosion rateemained low even in stage 3, after the removal of H2S from theystem. This last observation was unexpected because the solubil-Fig. 10. SEM surface morphologies of carbon steel tested at pH 3, at the end of: (a)stage 1 (CO2), (b) stage 2 (CO2/H2S), (c) stage 3 (CO2).
ities of iron sulfide and iron carbonate increase with decreasing pH[21].
In order to better investigate this phenomenon, an additionalexperiment was performed at pH 3. Fig. 12 shows the test pro-cedure, which was similar to the previous experiment procedureshown in Fig. 2, except here it skipped stage 1 and started fromstage 2. The resulting OCP and LPR measurements at pH 3 are pre-sented in Fig. 13. It was observed that the variation in OCP withincreasing time in stage 2 and stage 3 showed the same trend asthat in stage 2 and stage 3 in the previous test (Fig. 7). The varia-
tion in corrosion rate, however, was found to be different from thatin the previous test. The corrosion rate was found to increase instage 3, after the removal of H2S from the system. Fig. 14 shows theNyquist plots measured at the end of each stage. The impedance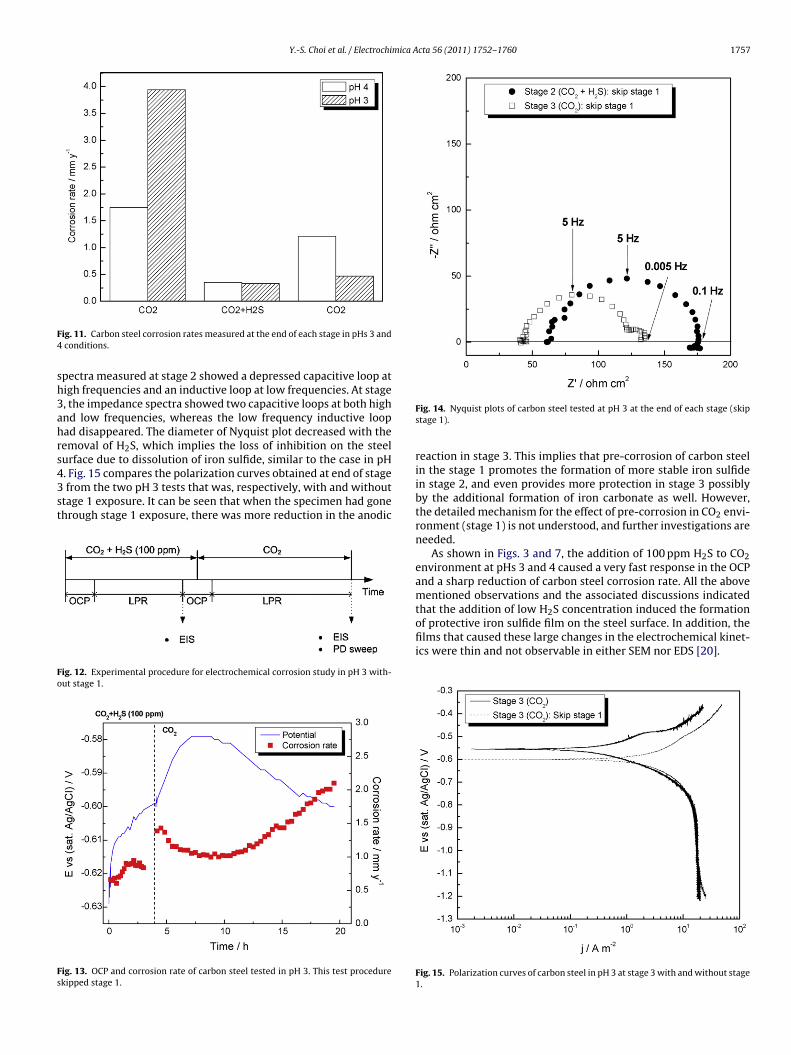
Y.-S. Choi et al. / Electrochimica Acta 56 (2011) 1752–1760 1757
F4
sh3ahrs43st
Fo
Fs
ig. 11. Carbon steel corrosion rates measured at the end of each stage in pHs 3 andconditions.
pectra measured at stage 2 showed a depressed capacitive loop atigh frequencies and an inductive loop at low frequencies. At stage, the impedance spectra showed two capacitive loops at both highnd low frequencies, whereas the low frequency inductive loopad disappeared. The diameter of Nyquist plot decreased with theemoval of H2S, which implies the loss of inhibition on the steelurface due to dissolution of iron sulfide, similar to the case in pH
. Fig. 15 compares the polarization curves obtained at end of stagefrom the two pH 3 tests that was, respectively, with and withouttage 1 exposure. It can be seen that when the specimen had gonehrough stage 1 exposure, there was more reduction in the anodic
ig. 12. Experimental procedure for electrochemical corrosion study in pH 3 with-ut stage 1.
ig. 13. OCP and corrosion rate of carbon steel tested in pH 3. This test procedurekipped stage 1.
Fig. 14. Nyquist plots of carbon steel tested at pH 3 at the end of each stage (skipstage 1).
reaction in stage 3. This implies that pre-corrosion of carbon steelin the stage 1 promotes the formation of more stable iron sulfidein stage 2, and even provides more protection in stage 3 possiblyby the additional formation of iron carbonate as well. However,the detailed mechanism for the effect of pre-corrosion in CO2 envi-ronment (stage 1) is not understood, and further investigations areneeded.
As shown in Figs. 3 and 7, the addition of 100 ppm H2S to CO2environment at pHs 3 and 4 caused a very fast response in the OCPand a sharp reduction of carbon steel corrosion rate. All the abovementioned observations and the associated discussions indicated
that the addition of low H2S concentration induced the formationof protective iron sulfide film on the steel surface. In addition, thefilms that caused these large changes in the electrochemical kinet-ics were thin and not observable in either SEM nor EDS [20].Fig. 15. Polarization curves of carbon steel in pH 3 at stage 3 with and without stage1.
1 mica Acta 56 (2011) 1752–1760
toudsas
l
H
s
H
H
bt
ciactste(
S
wrt
umwd
K
wd
cFttFrtprbmchcfats
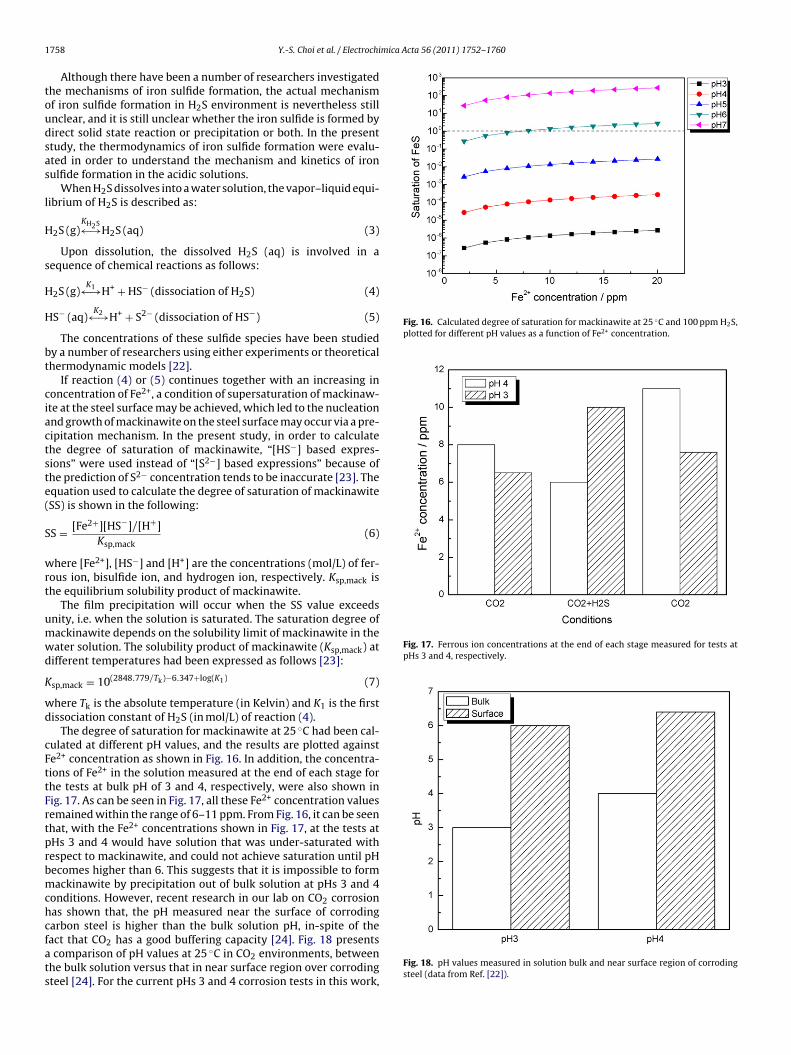
Fig. 16. Calculated degree of saturation for mackinawite at 25 ◦C and 100 ppm H2S,plotted for different pH values as a function of Fe2+ concentration.
Fig. 17. Ferrous ion concentrations at the end of each stage measured for tests atpHs 3 and 4, respectively.
758 Y.-S. Choi et al. / Electrochi
Although there have been a number of researchers investigatedhe mechanisms of iron sulfide formation, the actual mechanismf iron sulfide formation in H2S environment is nevertheless stillnclear, and it is still unclear whether the iron sulfide is formed byirect solid state reaction or precipitation or both. In the presenttudy, the thermodynamics of iron sulfide formation were evalu-ted in order to understand the mechanism and kinetics of ironulfide formation in the acidic solutions.
When H2S dissolves into a water solution, the vapor–liquid equi-ibrium of H2S is described as:
2S (g)KH2S←→H2S (aq) (3)
Upon dissolution, the dissolved H2S (aq) is involved in aequence of chemical reactions as follows:
2S (g)K1←→H+ +HS− (dissociation of H2S) (4)
S− (aq)K2←→H+ + S2− (dissociation of HS−) (5)
The concentrations of these sulfide species have been studiedy a number of researchers using either experiments or theoreticalhermodynamic models [22].
If reaction (4) or (5) continues together with an increasing inoncentration of Fe2+, a condition of supersaturation of mackinaw-te at the steel surface may be achieved, which led to the nucleationnd growth of mackinawite on the steel surface may occur via a pre-ipitation mechanism. In the present study, in order to calculatehe degree of saturation of mackinawite, “[HS−] based expres-ions” were used instead of “[S2−] based expressions” because ofhe prediction of S2− concentration tends to be inaccurate [23]. Thequation used to calculate the degree of saturation of mackinawiteSS) is shown in the following:
S = [Fe2+][HS−]/[H+]Ksp,mack
(6)
here [Fe2+], [HS−] and [H+] are the concentrations (mol/L) of fer-ous ion, bisulfide ion, and hydrogen ion, respectively. Ksp,mack ishe equilibrium solubility product of mackinawite.
The film precipitation will occur when the SS value exceedsnity, i.e. when the solution is saturated. The saturation degree ofackinawite depends on the solubility limit of mackinawite in theater solution. The solubility product of mackinawite (Ksp,mack) atifferent temperatures had been expressed as follows [23]:
sp,mack = 10(2848.779/Tk)−6.347+log(K1) (7)
here Tk is the absolute temperature (in Kelvin) and K1 is the firstissociation constant of H2S (in mol/L) of reaction (4).
The degree of saturation for mackinawite at 25 ◦C had been cal-ulated at different pH values, and the results are plotted againste2+ concentration as shown in Fig. 16. In addition, the concentra-ions of Fe2+ in the solution measured at the end of each stage forhe tests at bulk pH of 3 and 4, respectively, were also shown inig. 17. As can be seen in Fig. 17, all these Fe2+ concentration valuesemained within the range of 6–11 ppm. From Fig. 16, it can be seenhat, with the Fe2+ concentrations shown in Fig. 17, at the tests atHs 3 and 4 would have solution that was under-saturated withespect to mackinawite, and could not achieve saturation until pHecomes higher than 6. This suggests that it is impossible to formackinawite by precipitation out of bulk solution at pHs 3 and 4
onditions. However, recent research in our lab on CO2 corrosionas shown that, the pH measured near the surface of corroding
arbon steel is higher than the bulk solution pH, in-spite of theact that CO2 has a good buffering capacity [24]. Fig. 18 presentscomparison of pH values at 25 ◦C in CO2 environments, betweenhe bulk solution versus that in near surface region over corrodingteel [24]. For the current pHs 3 and 4 corrosion tests in this work,
Fig. 18. pH values measured in solution bulk and near surface region of corrodingsteel (data from Ref. [22]).
Y.-S. Choi et al. / Electrochimica Acta 56 (2011) 1752–1760 1759
Table 2Solubility limits of iron sulfides and iron carbonate (siderite) at room temperature.
Phase log(Ksp) (mol L−1) at 25 ◦C
Amorphous FeS −2.95Mackinawite −3.6
shmrudotcioascbt
Fig. 19. Calculated degree of saturation for iron sulfides and iron carbonate at 25 ◦C,2+
Pyrrhotite −5.19Troilite −5.31Siderite −10.89
imilar surface pH values (≈6) were measured and was found to beigher than the bulk solution pH value. This finding indicates thatore alkaline local water chemistry can be present in near surface
egion during CO2 corrosion. Thus, immediately over a steel surfacendergoing corrosion, it is possible to generate a local alkaline con-ition that favors the precipitation of iron sulfide or iron carbonaten the steel surface. In order to verify the possibility of precipita-ion, the degree of saturation of various iron sulfides as well as ironarbonate at 25 ◦C, pH 6 was calculated, and the results are plottedn Fig. 19 as a function of Fe2+ concentration. The solubility limitsf iron sulfides and iron carbonate at 25 ◦C used in the calculationre shown in Table 2 [25,26]. As shown in Fig. 19, the 25 ◦C, pH 6
olution would be saturated for most of iron sulfides and for ironarbonate. This finding suggests that in an acidic solution, it is possi-le to have a surface pH that causes local saturation and thus enablehe formation of iron sulfides and iron carbonate film on steel sur-100 ppm H2S and pH 6, plotted as a function of Fe concentration.
Fig. 20. XPS spectra of carbon steel from pH 3 solution at the end of stage 3: (a) S 2p, (b) C 1s, (c) O 1s, (d) Fe 2p.

1 mica A
fiasts
pplaIXtrtfAe(aafaBioa
5
tc
tw
[[[
[[
[[
[[[[[[[[[[
760 Y.-S. Choi et al. / Electrochi
ace via precipitation. It is further noted that the above discussionndicates that it is also possible for the iron sulfide to form in ancidic solution via the solid state reaction mechanism, because theame favorable alkaline pH in near surface region may also serveo stabilize any surface iron sulfide that might have formed via theolid state mechanisms.
Although the above theoretical calculation demonstrated theossibility of forming iron sulfide in the acidic solutions, in theresent study, no sulfur was detected in the EDS analysis. It seems
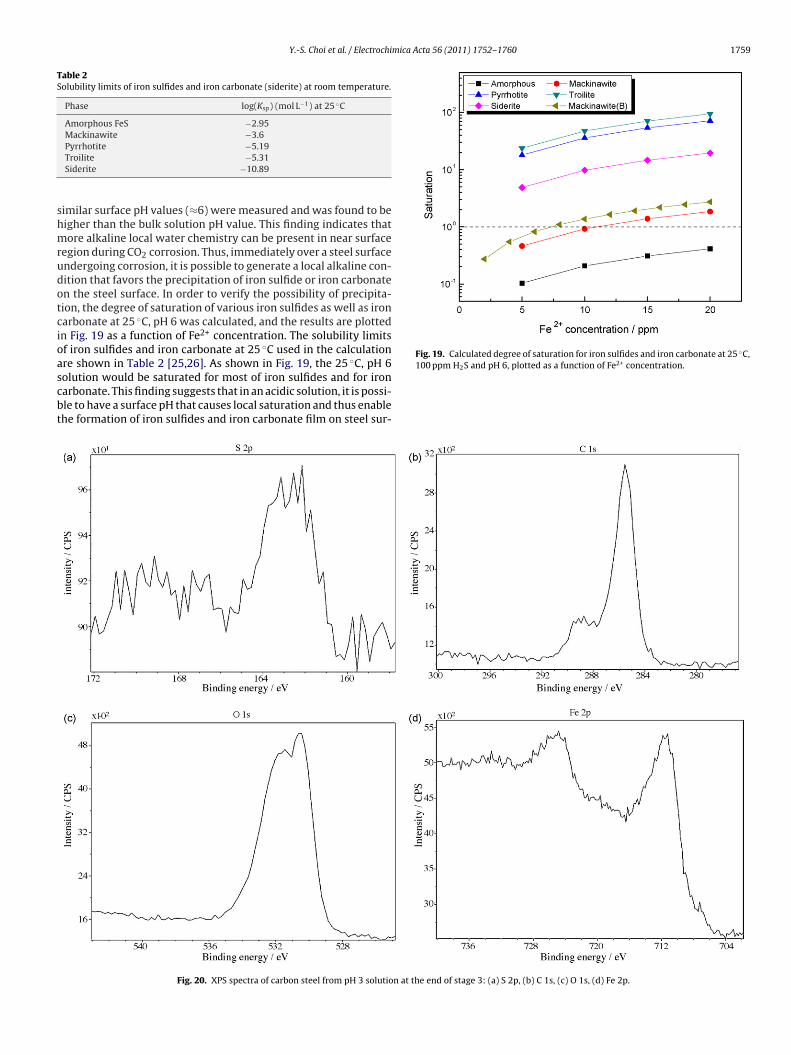
ikely that the iron sulfide films formed in stage 2 when H2S wasdded were too thin to be detected in SEM and EDS analyses.n order to confirm the presence of iron sulfide on steel surface,PS analysis was performed on samples that had been exposed
o different stages and pHs. As an example, Fig. 20 shows theesults of XPS analyses of carbon steel surface from pH 3 solu-ion at the end of stage 3. Similar XPS spectra had been obtainedrom other samples at the end of stages 2 and 3 in both pHs used.s expected, S 2p3/2 peak was found (Fig. 20(a)) and its bindingnergy is consistent with that of iron sulfide [27]. In addition, C 1s≈289 eV) and O 1s (≈532 eV) peaks were also detected (Fig. 20(b)nd (c)) which were consistent with the presence of iron carbon-te [28,29]. The presence of iron sulfide and iron carbonate wereurther evidenced in the detection of Fe 2p3/2 peak (Fig. 20(d))t binding energies of ≈707 eV and 711 eV, respectively [27,28].ased on this result, it was thus confirmed that iron sulfide and
ron carbonate had precipitated on the steel surface to provide thebserved corrosion protection, in-spite of the bulk solution beencidic.
. Conclusions
The addition of H2S (100 ppm) into CO2 environments reduced
he corrosion rate of carbon steel at pHs 3 and 4 (under-saturatedonditions).The inhibition effect of H2S on the CO2 corrosion is attributed tohe formation of thin iron sulfide film (tarnish) on the steel surface,hich suppressed the anodic dissolution reaction.
[
[
[
cta 56 (2011) 1752–1760
The precipitation of iron sulfide and iron carbonate in acidicsolution is possible due to local saturation and alkaline conditionson steel surface, and these precipitations provides corrosion pro-tection in the acidic solutions.
References
[1] M. Bonis, M. Girgis, K. Goerz, R. MacDonald, CORROSION/2006, Paper No. 06122,2006.
[2] S.N. Smith, M. Joosten, CORROSION/2006, Paper No. 06115, 2006.[3] E.C. Greco, W.B. Wright, Corrosion 18 (1962) 119t.[4] J.B. Sardisco, W.B. Wright, E.C. Greco, Corrosion 19 (1963) 354t.[5] J.B. Sardisco, R.E. Pitts, Corrosion 21 (1965) 245.[6] H. Ma, X. Cheng, G. Li, S. Chen, Z. Quan, S. Zhao, L. Niu, Corros. Sci. 42 (2000)
1669.[7] E. Abelev, T.A. Ramanarayanan, S.L. Bernasek, J. Electrochem. Soc. 156 (2009)
C331.[8] W. Sun, S. Nesic, S. Papavinasan, Corrosion 64 (2008) 586.[9] R.A. Berner, Am. J. Sci. 265 (1967) 773.10] P. Taylor, Am. Mineral. 65 (1980) 1026.11] J.S. Smith, J.D.A. Miller, Br. Corros. J. 10 (1975) 136.12] D.W. Shoesmith, P. Taylor, M.G. Bailey, D.G. Owen, J. Electrochem. Soc. 125
(1980) 1007.13] M. Stern, A.L. Geary, J. Electrochem. Soc. 104 (1957) 56.14] S.W. Dean, Handbook on Corrosion Testing and Evaluation, John Wiley, New
York, 1971, p. 171.15] E. McCafferty, Corros. Sci. 39 (1997) 243.16] D.D. MacDonald, M.C.H. Mckubre, J.O.M. Bockris, B.E. Conway, R.E. White (Eds.),
Modern Aspects of Electrochemistry, vol.14, Plenum Press, New York, 1982, p.61.
17] K.J. Lee, S. Nesic, CORROSION/2006, Paper No. 06417, 2006.18] M. Keddam, O.R. Mattos, H. Takenouti, J. Electrochem. Soc. 128 (1981) 257.19] M. Keddam, O.R. Mattos, H. Takenouti, J. Electrochem. Soc. 128 (1981) 266.20] K. Videm, J. Kvarekvål, Corrosion 51 (1995) 260.21] L.G. Benning, R.T. Wilkin, H.L. Barnes, Chemical Geology, 167, 2000, p. 25.22] W. Sun, Ph.D. Diss., Ohio University, 2006.23] W. Sun, S. Nesic, D. Young, R.C. Woollam, Ind. Eng. Chem. Res. 47 (2008) 1738.24] J. Han, B.N. Brown, D. Young, S. Nesic, J. Appl. Electrochem. 40 (2010) 683.25] A. Criaud, C. Fouillac, B. Marty, Geothermics 18 (1989) 711.26] W. Sun, S. Nesic, R.C. Woollam, Corros. Sci. 51 (2009) 1273.
27] M. Mullet, S. Boursiquot, M. Abdelmoula, J.-M. Génin, J.-J. Ehrhardt, Geochim.Cosmochim. Acta 66 (2002) 829.28] D.A. Lopez, W.H. Schreiner, S.R. de Sanchez, S.N. Simison, Appl. Surf. Sci. 207
(2003) 69.29] D.A. Lopez, W.H. Schreiner, S.R. de Sanchez, S.N. Simison, Appl. Surf. Sci. 236
(2004) 77.


![GLOBAL ENGINEERING SCIENCE AND RESEARCHES ... PDF/Archive-2017/September-2017/4.pdfCorrosion, either sweet corrosion generated by CO2 or sour corrosion generated by H2S [1], is realized](https://img.pdfslide.us/doc/110x75/5ea485d0d14d764427400ad4/global-engineering-science-and-researches-pdfarchive-2017september-20174pdf.jpg)