Embed Size (px)
Citation preview

EFFECT OF GROWTH DAYS ON BIOACTIVE COMPOUNDS OF
WHEATGRASS POWDER (Triticum aestivum) AND SENSORY
PARAMETERS
by
Sarju Baral
Department of Nutrition and Dietetics
Central Campus of Technology
Institute of Science and Technology
Tribhuvan University, Nepal
2018

ii
Effect of Growth Days on Bioactive Compounds of Wheatgrass Powder
(Triticum aestivum) and Sensory Parameters
A dissertation submitted to the department of Nutrition and Dietetics, Central Campus of
Technology, Tribhuvan University, in the partial fulfillment of the requirements for the
degree of B.Sc. Nutrition & Dietetics.
by
Sarju Baral
Symbol no: 80100
Regd. No: 5-2-8-75-2013
Department of Nutrition and Dietetics
Central Campus of Technology
Institute of Science and Technology
Tribhuvan University, Nepal
July, 2018

iii
Tribhuvan University
Institute of Science and Technology
Department of Nutrition and Dietetics
Central Campus of Technology, Dharan
Approval Letter
This dissertation entitled Effect of Growth Days on Bioactive Compounds of Wheatgrass
Powder (Triticum Aestivum) and Sensory Parameters presented by Sarju Baral has been
accepted as the partial fulfillment of the requirements for the B.Sc. degree in Nutrition
and Dietetics.
Dissertation Committee
1. Head of Department ……………………………………..
(Mr. Dambar Bahadur Khadka, Asst. Prof.)
2. External Examiner ……………………………………..
(Prof. Dr. Surendra Bahadur Katwal)
3. Supervisor ………………………………………
(Mr. Yadav KC, Lecturer)
4. Internal Examiner ………………………………………
(Mr. Kabindra Bhattarai, Teaching Assistant)
Date: July, 2018

iv
Acknowledgement
Its a genuine pleasure to express my deep sense of thanks and gratitude to my guide Mr.
Yadav K.C. (Lecturer, Central Campus of Technology), Dharan for his support, words of
encouragement, constructive recommendation and also for giving a long period of time
during this research.
I am very much indebted to Prof. Dr. Dhan Bahadur Karki (Campus Chief, Central
Campus of Technology) and Mr. Dambar Bahadur Khadka (Department Head, Nutrition and
Dietetics), for providing all the necessary facilities for my thesis. I am really grateful to Mr.
Arjun Ghimire (Assistant Professor, Central Campus of Technology) for his valuable
suggestion throughout this research.
I am very thankful to all my friends, especially Anuradha, Rojina, Nuna, Naveena, Manoj,
Garima, Brishty and Sadikshya. Also I want to use this chance to thank all the laboratory
staffs, library staffs and respected teachers who helped me a lot in completion of my
dissertation.
Last but not the least, I would like to thank my parents for supporting me spiritually
throughout my life.
My sense of gratitude to everyone who directly or indirectly supported me during my
research activitiy.
Date of submission: July, 2018
……………………………….
(Sarju Baral)

v
Abstract
Bioactive compounds of wheatgrass powder (Triticum aestivum) was determined at different
stages of growth. Wheatgrass was grown by planting germinated wheat seeds and harvesting
on 6th, 7th, 8th, 9th and 10th days manually. Wheatgrass was then subjected to cabinet drying
(50°C, 5hr) and powdered separately. The crude extracts of samples were prepared using
80% of methanol using maceration technique for analysis of bioactive compounds. Sensory
analysis of samples was carried out by group of semi-trained panelists. Experimental data
was analyzed using software Genstat 12th Edition.
Growth of wheatgrass had significant impact on bioactive compounds and sensory
characteristics. Total phenol, flavonoid and antioxidant activity of wheatgrass was found to
increase with growth from 318.07±0.65 mgGAE/g, 105.7±33.29 mgQE/g, 80.48±1.27% on
6th day to 454.7±2.84 mgGAE/g, 429.4±66.06 mgQE/g, 93.09±0.63% on 10th day
respectively. Tannin content of wheatgrass decreased significantly with growth from
10.24±1.04 mgGAE/g on 6th day to 2.077±0.01 mgGAE/g on 10th day. Chlorophyll content
first increased with growth from 10.86±0.09 mg/g on 6th day to 14.27±0.06 mg/g on 8th day
and decreased as 9.39±0.10 mg/g and 7.12±0.07 mg/g on 9th and 10th day respectively.
Analysis of bioactive compounds and sensory attributes concluded wheatgrass of 10th day as
superior sample among other samples.

vi
Contents
Approval Letter ......................................................................................................................... iii
Acknowledgement ..................................................................................................................... iv
Abstract ....................................................................................................................................... v
List of Tables .............................................................................................................................. x
List of Figures .......................................................................................................................... xii
List of Abbreviations .............................................................................................................. xiii
1. Introduction ....................................................................................................................... 1-3
1.1 General Introduction .................................................................................................... 1
1.2 Statement of the problem ............................................................................................. 2
1.3 Objectives of the study................................................................................................. 3
1.3.1 General objective ............................................................................................ 3
1.3.2 Specific objective ............................................................................................ 3
1.4 Significance of the study .............................................................................................. 3
1.5 Limitations of the study ............................................................................................... 3
2. Literature review ............................................................................................................ 4-22
2.1 Wheatgrass ................................................................................................................... 4
2.2 History on consumption of wheatgrass ........................................................................ 4
2.3 Nutritional aspect of wheatgrass .................................................................................. 5
2.4 Germination ................................................................................................................. 6
2.4.1 Effect of germination on nutrient content ....................................................... 6
2.5 Drying .......................................................................................................................... 7

vii
2.6 Chlorophyll .................................................................................................................. 9
2.6.1 Chlorophyll and wheatgrass ......................................................................... 10
2.7 Phytochemicals .......................................................................................................... 10
2.7.1 Classification of phytochemicals .................................................................. 11
2.7.2 Antioxidant and its activity ........................................................................... 16
2.7.3 Extraction of phytochemicals ....................................................................... 18
2.7.4 Factors affecting phytochemicals ................................................................. 20
3. Materials and methods ................................................................................................. 23-30
3.1 Raw materials............................................................................................................. 23
3.2 Identification of seed .................................................................................................. 23
3.3 Collection and preparation of sample ........................................................................ 23
3.4 Qualitative analysis for Phytochemical ..................................................................... 26
3.4.1 Phenols and tannins ...................................................................................... 26
3.4.2 Flavonoids..................................................................................................... 26
3.4.3 Saponins ........................................................................................................ 26
3.4.4 Glycosides ..................................................................................................... 26
3.4.5 Steroid ........................................................................................................... 27
3.4.6 Terpenoids .................................................................................................. 27
3.5 Quantitative analysis of phytochemicals ................................................................... 27
3.5.1 Determination of total phenol ....................................................................... 27
3.5.2 Determination of flavonoid ........................................................................... 27
3.5.3 Determination of tannins .............................................................................. 28
3.5.4 Determination of chlorophyll ....................................................................... 28

viii
3.5.5 Determination of DPPH radical scavenging activity .................................... 28
3.5.6 Sensory analysis ............................................................................................ 29
3.5.7 Optimization of wheatgrass powder ............................................................. 29
3.5.8 Statistical analysis ......................................................................................... 30
4. Results and discussion .................................................................................................. 31-44
4.1 Determination of germination capacity and pH value ............................................... 31
4.2 Qualitative analysis for phytochemical ...................................................................... 31
4.3 Quantitative analysis of phytochemicals ................................................................... 32
4.3.1 Effect of growth days on total phenol content .............................................. 32
4.3.2 Effect of growth days on flavonoid content ................................................. 33
4.3.3 Effect of growth days on tannin content ....................................................... 34
4.3.4 Effect of growth days on DPPH radical scavenging activity ....................... 35
4.3.5 Effect of growth days on chlorophyll content .............................................. 37
4.4 Sensory evaluation ..................................................................................................... 38
4.4.1 Color ............................................................................................................. 38
4.4.2 Flavor ............................................................................................................ 39
4.4.3 Taste .............................................................................................................. 40
4.4.4 After taste ...................................................................................................... 41
4.4.5 Overall acceptability ..................................................................................... 42
4.4.6 Optimization of study ................................................................................... 43
5. Conclusions and recommendations ............................................................................. 45-46
5.1 Conclusion ................................................................................................................. 45
5.2 Recommendations ..................................................................................................... 45

ix
6. Summary .............................................................................................................................. 47
References ............................................................................................................................ 48
Appendices ........................................................................................................................... 56
Color plates .......................................................................................................................... 71

x
List of Tables
Table No. Title Page No.
2.1 Bioactive Phytochemicals in Medicinal Plants 11
2.2 Major classes of phenolic compounds in plants 12
3.3
Phytochemicals parameters
29
3.4
Sensory parameters
29
4.1 Qualitative analysis for phytochemicals 31
4.2 Optimized goals for treatment (phytochemicals analysis) 44
4.3 Optimized goals for treatment (sensory) 44
B.1
List of chemicals used
57
B.2
List of equipment used
58
C.1
Nutritional composition of wheatgrass (Triticum aestivum)
59
C.2
Dry amount of extract
59
C.3
Absorbance reading (100 fold dilution)
59
C.4
Absorbance reading (100 fold dilution)
60
C.5
Temperature and Relative Humidity during germination of wheat
60
C.6
Quantitative analysis of phytochemicals in wheatgrass
61
C.7
Average sensory score
61
E.1
One way ANOVA(no blocking) for total phenol content 65
E.2
Least significant differences of means (5% level) for total phenol
content
65
E.3 One way ANOVA(no blocking for flavonoid content 65

xi
E.4 Least significant differences of means (5% level) for
flavonoid content
65
E.5 One way ANOVA(no blocking) for tannin content 66
E.6
Least significant differences of means (5% level) for tannin
content
66
E.7 One way ANOVA(no blocking) for DPPH radical scavenging
activity
66
E.8
Least significant differences of means (5% level) for DPPH
radical scavenging activity
66
E.9
One way ANOVA(no blocking) for chlorophyll
67
E.10
Least significant differences of means (5% level) for chlorophyll
67
E.11
One way ANOVA(no blocking) for color
67
E. 12
Least significant differences of means (5% level) for color
67
E.13
One way ANOVA(no blocking) for flavor
68
E.14
Least significant differences of means (5% level) for flavor
68
E.15
One way ANOVA(no blocking) for taste
68
E.16
Least significant differences of means (5% level) for taste
69
E.17
One way ANOVA(no blocking) for after taste
69
E.18
Least significant differences of means (5% level) for after taste
69
E.19
One way ANOVA(no blocking) for overall acceptability
70
E.20
Least significant differences of means (5% level) for overall
acceptability
70

List of Figures
Fig No. Title Page No.
2.1 Cabinet dryer 8
2.2 Pathway for degradation of chlorophyll 9
2.4 Basic structure of flavonoid 13
2.5 Reaction of DPPH-free radical with an antioxidant 18
3.1 Flow diagram of wheatgrass production and analysis 25
4.1
Effect of growth days on total phenol content
32
4.2
Effect of growth days on flavonoid content
34
4.3
Effect of growth days on tannin content
35
4.4
Effect of growth days on DPPH radical scavenging activity
36
4.5
Effect of growth days on chlorophyll content
37
4.6 Mean sensory score for color 39
4.7 Mean sensory score for flavor 40
4.8 Mean sensory score for taste 41
4.9 Mean sensory score for after taste 42
4.10 Mean sensory score for overall acceptability 43
D1 Gallic acid standard curve 62
D2 Quercetin standard curve 63
D3 Tannin standard curve 64

xiii
List of Abbreviations
Abbreviation Full Form
NSA Non-starch polysaccharides
SFE Supercritical fluid extraction
ROS Reactive oxygen species
TPC Total phenol content
TFC Total flavonoid content
GAE Gallic acid equivalent
QE Quercetin Equivalent
L.S.D
Least Significant Difference

PART I
Introduction
1.1 General Introduction
Herbal medicine is still the mainstay of about 75% of the world population, especially in the
under developed and developing countries, for primary health care because of better cultural
acceptability, better compatibility with the human body and lesser side effects. However, in
the last few years there has been a major increase in their use in the developed world. In
Germany and France, many herbs and herbal extracts are used as prescription drugs (Desai,
2005). In the developing countries, many low-income families rely on a simple diet which
mainly consist of staple food crops such as wheat, maize and rice that are poor sources of
various nutrients and minerals. To provide a wholesome nutrition for a healthy and
rejuvenating body, green foods could be very useful in providing nutrient like vitamin,
proteins, minerals and antioxidants which are researched for numerous health benefits in
USA, East Asian countries and Central Europe (Singhlal et al., 2012). Medicinal plants have
a promising future because there are about half million plants around the world and most of
their medicinal activities have not been investigate yet and their medical activities could be
decisive in the treatment of present or future studies (Singh, 2015).
Cereal grasses such as wheat, oat, barley and brown rice are most familiar cereal grasses
and also one of the “functional foods” that is gaining recognition as a potential nutritional
product which has medical and health benefits (Chaturvedi et al., 2013). Wheat is the third
important cereal crop of Nepal after rice and maize both in area and production (Thapa,
2010). Wheat (Triticum aestivum) germinated over a period of time is called as a wheatgrass,
belonging to family: Gramineae (Poaceae). Triticum is a genus of annual and biennial
grasses, yielding various types of wheat, native to south west Asia and the Mediterranean
region (Verma et al., 2012).
Wheatgrass is a humble weed that is a power house of nutrients and vitamins for the body.
During germination, vitamins, minerals, and phenolic compounds including flavonoids are
synthesized in wheat sprouts reach the maximum antioxidant potential (Aydos et al., 2011).
Wheatgrass supplement is available commercially in liquid, powdered or concentrated forms,
depending on the supplier and can be consumed on its own, or mixed with fruit juices
(Chauhan, 2014). Availability of wheatgrass in powder form has proven to be very

2
convenient and effective. Wheat grass powder retains all important nutrients of wheatgrass
and having higher quantity of dietary fiber, cost effective and higher shelf life than wheat
grass juice. Wheat grass powder can be easily included in the daily life of average age group
which can definitely increase their vitamins, minerals and antioxidants intake and in return it
will protect the body from degenerative diseases (Singh and Singh, 2016).
1.2 Statement of the problem
Wheatgrass is a food prepared from the cotyledons of the common wheat plant, Triticum
aestivum. It is sold either as juice or powder concentrate. Diet occupies an important place
during sickness and healthy condition. Our body has the inbuilt ability to heal itself if
provided proper nutrition, environment and exercise. Wheatgrass is renowned for its
therapeutic value since ancient times. The beneficial nutrients naturally obtained from
wheatgrass helps to promote health and healing (Jain and Jain, 2014).
Cereal sprouts and microgreens (known as wheatgrass) may represent a valid alternative
in human feeding. Normally sprouts are used as components of salads, although it has been
proposed that dried sprout power could be blended in certain proportion with conventional
flours in order to increase the nutritional value of flours and derivatives without changing
people’s feeding behaviors. On the other hand, wheatgrass is often used to extract drinking
juice with several expected benefits (Benincasa et al., 2014).
The modern medicines are very efficient in curing diseases but they produce a number of
side effects. On the contrary, the crude drugs are somewhat less efficient than modern
medicines, but they are relatively free from side effects which made the traditional system of
medicine to create the competition to modern day medicine (Ashok, 2011). Wheatgrass is
easy to cultivate at home level but health benefits of wheatgrass is still unknown to mankind.
Growing wheatgrass for daily availability to consume in fresh form is difficult and tedious
task, thus most of the people do not prefer to use the wheatgrass. So, in order to ease its
adaptation, the enmass growing and drying can be done to make available the wheatgrass to
the common people. Wheatgrass in powder form is a method for preserving the wheatgrass
nutrients with long shelf life and use of wheatgrass powder is more convenient than
wheatgrass juice. Therefore, it is necessary to learn about its functional value and to use it as
a medicinal drug.

3
1.3 Objectives of the study
1.3.1 General objective
The general objective of the work was to study the effect of growth days on bioactive
compounds of wheatgrass powder (Triticum aestivum) and their sensory attributes.
1.3.2 Specific objective
a) To grow wheatgrass.
b) To prepare wheatgrass powder.
c) To prepare the methanolic extract of wheatgrass powder.
d) To study the effect of growth days on bioactive compounds of wheatgrass
powder.
e) To evaluate the antioxidant activity of the extract of sample.
f) To evaluate the sensory parameters of samples.
1.4 Significance of the study
Wheat (Triticum aestivum) has a crucial role on human diet in most countries. Many
epidemiological studies have proposed that adding whole grain and whole grain products to
the diet has a protective contribution against chronic diseases. Following germination of
wheat for 6-10 days, sprouts formed are called wheatgrass. Changes during germination and
sprouting lead the plants to synthesize compounds like vitamins, antioxidants or phenolics.
The most important active component in wheatgrass is chlorophyll that is known to have an
active role for the inhibition of the metabolic activation of carcinogens (Akbas et al., 2017).
At present, wheatgrass is quickly becoming one of the most widely used supplemental
health foods and is available in many health food stores as fresh produce, tablets,
supplemental health foods, frozen juice and powder. In developing countries like Nepal,
introduction of wheatgrass can be very effective as people here mostly rely on herbal
medicine rather than modern drugs due to their higher cost and limited access. Therefore, this
study is preliminary effort towards finding the bioactive compounds present in wheatgrass
powder to enhance its consumption.
1.5 Limitations of the study
a) Single extraction technique was used to prepare the extract.

PART II
Literature review
2.1 Wheatgrass
Wheatgrass, (Triticum speices) a cereal grass of the Gramineae (Poaceae) family, is the
world’s largest edible grain cereal-grass crop. Wheatgrass refers to the young grass of the
common wheat plant (Mujoriya, 2011).Wheat has been a food crop for mankind since the
beginning of agriculture. Wheat has been appreciated as a source of carbohydrates and
proteins (albeit poor in some essential amino acids, especially lysine) but also contributes a
significant proportion of fibre, minerals and antioxidant compounds such as phenolic acids
and tocols, to the human diet (Hidalgo et al., 2016; Ward et al., 2008). For over fifty years,
researchers have known that the cereal plant, at this young green stage, is many times richer
in the levels of vitamins, minerals and proteins as compared to seed kernel, or grain products
of the mature cereal plant. The young germinated plant is a factory of enzyme and growth
activity. In the early stages of growth they store large amounts of vitamins and proteins in the
young blades. After jointing stage, the nutrition level in the leaves drops rapidly while the
fiber content increases rapidly. Agriculturally, important species of Triticum include –
Triticum asetivum, Triticum durum and Triticum dicoccum (Desai, 2005).
2.2 History on consumption of wheatgrass
Wheatgrass can be traced back in history over 5000 years, to ancient Egypt and perhaps even
early Mesopotamian civilizations. It is purported that ancient Egyptians found sacred the
young leafy blades of wheat and prized them for their positive affect on their health and
vitality.
More recently, the consumption of wheatgrass in the Western world began in the 1930s as
a result of experiments by Charles F. Schnabel and his attempts to popularize the plant.
Schnabel, an agricultural chemist, conducted his first experiments with young grasses in
1930, when he used fresh cut grass in an attempt to nurse dying chickens back to health. The
hen not only recovered, but they produced eggs at a higher rate than healthy hens.
Encouraged by his results, he began drying and powdering grass for his family and neighbors
to supplement their diets. The following year, Schnabel reproduced his experiment and
achieved the same results. Hens consuming rations supplemented with grass doubled their

5
egg production. Schnabel started promoting his discovery to feed mills, chemist and the food
industry. Two large corporations, Quaker Oats and American Diaries Inc., invested millions
of dollars in further research, development and production of products for animals and
humans. By 1940s, cans of Schnabel’s powdered grass were on sale in major drug stores
throughout the United States and Canada. Sometime during the 1940’s a lady by the name of
Ann Wigmore healed herself of cancer from the weeds she found in vacant lots in Boston.
She began a study of natural healing modalities and with the help of a friend, Dr. Earp
Thomas, she found that there are 4700 varieties of grass in the world and all are good for
man. With the help of her pets, she arrived at the conclusion that wheatgrass was the best, or
the medicinal grass (Seymour, 2015).
At present, the wheatgrass is available in the form of products such as health supplements
(powders, extracts) and medicines (tablets). These are not so much popular since they are
consumed only by people in poor health conditions (Singhlal et al., 2012). Nowadays,
wheatgrass juice is consumed by people in different areas of Nepal.
2.3 Nutritional aspect of wheatgrass
Wheatgrass is a humble weed that is a powerhouse of nutrients and vitamins for the human
body. Triticum aestivum, freshly juiced or dried into powder are fit both for animal and
human consumption. Both provide chlorophyll, amino acids, minerals, vitamins and
enzymes. In the form of fresh juice, it has high concentrations of chlorophyll, active enzymes,
vitamins and other nutrients.
Wheatgrass juice has chlorophyll that neutralizes infections, heals wounds, overcomes
inflammations and gets rid of parasitic infections. The three most important effects of
wheatgrass on the human body are: blood purification, liver detoxification and colon
cleansing. This is because wheat grass is the richest source of vitamins A, B, C, E and K,
calcium, potassium, iron, magnesium, sodium, sulphur and 17 forms of amino acids.
Wheatgrass is high in oxygen like all green plants that contain chlorophyll. The brain and all
body tissues function at an optimal level in high-oxygenated environment. The pH (hydrogen
molecules) value of human blood and wheatgrass both is about 7.4 (alkaline) and therefore
quickly absorbed in the blood and is highly beneficial. Wheatgrass juice is found to be great
for blood disorders of all kinds (Mujoriya, 2011).

6
2.4 Germination
In plant life cycle, seed germination is an important development phase, playing a critical role
in seedling establishment and overall adaptation. The ability of a species to germinate rapidly
under a broad range of environmental conditions has been regarded as a critical traits for
invasive species (Ye and Wen, 2017). Germination is a complex process causing physical,
chemical and structural changes in grains, has been identified as an inexpensive and effective
technology for improving cereal quality. The germination process is characterized by the
growth of the embryo of the grain, manifested by the rootlets growth and increase in the
length of the shoot (acrospire), with the concomitant modification of the contents of the
endosperm (Senhofa et al., 2016).
2.4.1 Effect of germination on nutrient content
Germination of cereals has been used for centuries to soften kernel structure, to increase
nutritional content and availability, to decrease the content of antinutritive compounds, and to
add new flavours without knowing the biochemistry behind these phenomena (Norja et al.,
2004).
Germination of grain commences with the uptake of water. Once germination is initiated,
the predominant endosperm reserves, starch, cell wall, and storage proteins, are mobilized by
the action of hydrolytic enzymes, which are synthesized in the aleurone layer and in the
scutellum and secreted into the starchy endosperm of germinating grains (Lu et al., 1998;
Shaik et al., 2014). During germination, endogenous enzymes of cereal grains are activated
and some major substances such as starch and protein undergo degradation to small
molecules. For example, a significant decrease in starch content is found during germination
of rice. Furthermore, some functional compounds can be enriched, meanwhile some anti-
nutrition factors, such as phytic acid, is degraded during germination. Current studies
indicated germination enriched β-aminobutyric acid in brown rice (Oryza sativa), wheat and
foxtail millet (Setaria italic). Germinated cereal grains show higher total phenolic content
and antioxidant activity than those of un-germinated rice, wheat and oat. The germination
process improves the nutritional quality of cereal. During the process of germination,
significant changes in the biochemical, nutritional, and sensory characteristics of cereals
occur due to degradation of reserve materials as used for respiration and synthesis of new cell
constituents for developing embryo in the seed (Danisova et al., 1995; Sharma et al., 2016).

7
Germination is reported to improve the nutritive value of pulses, particularly in the level of
vitamins such as riboflavin, niacin, choline, biotin and ascorbic acid. Besides, it brings
biochemical changes such as converting more indigestible carbohydrates into digestible and
absorbable forms. Furthermore, the germination process reduces or eliminates most of the
antinutrients, such as phytates, tannins, oxalates, etc., present in the legumes and also renders
the sprouted legumes comparatively safe and delicious. The activities of enzymes such as
amylase, protease, phytase, etc., are increased during germination that helps in digestion of
complex biomacromolecules into simpler absorbable forms such as individual sugars, simple
peptides and amino acids (Chaudhary et al., 2014).
As compared to un-germinated seed, germinated seeds contain high protein, low
unsaturated fatty acids, low carbohydrate and mineral content (Narsih, 2012; Sharma et al.,
2016). Alpha-amylase enzyme plays an important role in native starch granule degradation,
and its expression is controlled by both gibberellin and sugar demand/ starvation. Sugar on
carbon starvation activates alpha-amylase promoter (Lu et al., 1998; Shaik et al., 2014). As a
result, during germination amylases are produced and partial breakdown of starch into simple
sugars occurs (Chesworth et al., 1998). Intense biochemical processes during the grain
activation (the first stage of germination); as a result, grain biological value increases. The
content of vitamins B2, E and niacin, total sugar, dietary fibre and glucosamine increase;
vitamin C is synthesized, and the content of irreplaceable amino acids is increased during the
process of protein hydrolysis (Senhofa et al., 2016).
2.5 Drying
Drying is an ancient technique of food preservation and for extension of shelf-life of foods.
Drying or dehydration is, by definition, the heat and mass transfer process for removal of
water by application of heat, from a solid or liquid food, with the purpose of obtaining a solid
product sufficiently low in water content. Where removal of water takes place by virtue of a
difference in osmotic pressure and not by evaporation. The main objectives of dehydration
are: Preservation as a result of lowering of water activity; low transport and storage cost as a
reduction in weight and volume; transformation of food to a form more convenient to store,
package, transport and use, e.g. transformation of liquids such as milk or coffee extract, to a
dry powder that can be reconstituted to the original form by addition of water (Kumar et al.,
2015). Drying rate depends on external parameters like solar radiations, ambient temperature,

8
wind velocity, relative humidity and internal parameters like initial moisture content, type of
crop, crop absorptivity, and mass of product per unit exposed area (Shahdev, 2014).
Drying removes the moisture from the food so bacteria, yeast and mold cannot grow and
spoil the food. Drying also slows down the action of enzymes (naturally occurring substances
which cause foods to ripen), but does not inactivate them (Ramya et al., 2018). In today food
market dried foods play an important role in the food supply chain. Dried foods are tasty,
nutritious, light weight, easy to prepare, easy to store and use. The energy input is less than
what is needed to freeze or can, and the storage space is minimal compared with that needed
for canning jars and freeze containers. Morever, the nutritional value of food is minimally
affected by drying.
2.5.1 Cabinet drying
Cabinet drier consist of an insulated cabinet fitted with shallow mesh or perforated trays,
each of which carries a thin layer of food. Hot air is circulated through the cabinet tray. A
system of duct and baffles is used to direct air, over and/or through each tray, to promote
uniform air distribution either horizontally between the trays of food materials or vertically
through the trays and food. Air heaters may be direct gas burners, steam coil exchangers or
electrical resistance heaters. The air is blown past the heaters and thus heated air is used for
drying. It is relatively cheap to build and maintain, flexible in design, and produces variable
product quality due to relatively poor control. It is used singly or in groups, mainly for small-
scale production (1-20 ton/day) of dried fruits and vegetables (Fellows, 2000).
Fig. 2.1 Cabinet Dryer
9
2.6 Chlorophyll
Chlorophyll is a green pigment found in most plants, and its name is derived from the Greek
chloros (green) and phyllon (leaf) (Levent, 2011). Leaf chlorophyll concentration is an
important parameter that is regularly measured as an indicator of chloroplast content,
photosynthetic mechanism and of plant metabolism. Chlorophyll is an antioxidant
compounds which are present and stored in the chloroplast of green leaf plants and mainly it
is present in the green are of leaves, stems, flowers and roots. However the chlorophyll
production is mainly depended on penetration of sun light and it is the main source of energy
for plant (Kamble et al., 2015).
There are few different forms of chlorophyll. Chlorophyll a, greenish- yellow in solution,
is the primary photosynthetic pigment in green plants for the transfer of light energy to a
chemical acceptor. Chlorophyll b, blue- green in solution, found in higher plants and green
algae with Chlorophyll a. Chlorophyll c, is also an accessory pigment found with Chlorophyll
a in brown algae and diatoms. Chlorophyll d, together with Chlorophyll a, is in some red
algae. All forms of chlorophyll are oil- soluble (Levent, 2011).
Fig. 2.2 Pathways for the degradation of chlorophyll
Acid
Mg+2
Acid
Acid
Phytol Pheophorbides
(Brown)
Mg+2
Strong acid
Chlorophyllase
Acid
Mg+2
Chlorophylls
(Green)
Pheophytins
(Olive green)
Chlorophyllides
(Bright green)
O2
O2
O2
Chlorins, purpurins
(Colorless products)

10
2.6.1 Chlorophyll and wheatgrass
The wheatgrass juice is a source of the alkaline elements, prophylactic and curative elements.
It also supplements proteins, carbohydrates and fat. The lacteal substances found it in are
considered to be an effective element and the only remedy for curing cancer. Chlorophyll, the
most important element of the wheatgrass is contained in the cells called chloroplasts.
Chloroplasts produce nutritious elements with the help of sunshine. The chemical formation
of the wheatgrass juice has a striking similarity with the chemical formation of the human
blood. The pH factor of the human blood is 7.4. The pH factor of the wheatgrass juice is also
7.4 that is the reason why it is quickly absorbed in the blood (Mujoriya, 2011). Wheatgrass
juice contains crude chlorophyll and can be taken orally and as colon implant without side
effects. Science has proven that chlorophyll arrests growth and development of unfriendly
bacteria. Chlorophyll is antibacterial and can be used inside and outside the body as a natural
healer. Chlorophyll can be extracted from many plants, but wheatgrass is superior because it
has been found to have over 100 elements needed by man (Sowjanya et al., 2015).
2.7 Phytochemicals
The “phyto” of the word phytochemicals is derived from the Greek word phyto, which means
plant. Therefore, phytochemicals are plant chemicals. Phytochemicals are defined as
bioactive non nutrient plant compounds in fruits, vegetables, grains and other plant foods that
have been linked to reducing the major chronic diseases. It is estimated that >5000 individual
phytochemicals have been identified in fruits, vegetables, and grains, but a large percentage
still remain unknown and need to be identified (Liu, 2018).
These compounds are known as secondary plant metabolites and have biological
properties such as antioxidant activity, antimicrobial effect, modulation of detoxification
enzymes, stimulation of the immune system, decrease of platelet aggregation and modulation
of hormone metabolism and anticancer property. It is well known that plants produce these
chemicals to protect themselves, but recent researches demonstrate that many phytochemicals
can also protect human against diseases (Altiok, 2010). Bioactive and disease preventing
phytochemicals present in plant are shown below in Table 2.1.

11
Table 2.1 Bioactive Phytochemicals in Medicinal Plants
Classification Main Group of Elements Biological Function
Non-starch
polysaccharides
Cellulose, hemicellulose,
gums, mucilages, pectins,
lignins
Water holding capacity, delay in
nutrient absorption, binding toxins and
bile acids.
Antibacterial &
Antifungal
Terpenoids, alkaloids,
phenolics
Inhibitors of micro-organisms, reduce
the risk of fungal infection.
Antioxidants Polyphenolic
compounds,flavonoids,
carotenoids, tocopherols,
ascorbic acid
Oxygen free radical quenching,
inhibition of lipid peroxidation
Anticancer Carotenoids,
polyphenols,curcumine,
flavonoids
Inhibitors of tumor, inhibited
development of lung cancer, anti-
metastatic activity
Detoxifying
Agents
Reductive acids, tocopherols,
phenols, indoles, aromatic
isothiocyanates, coumarins,
flavones, carotenoids,
retinoids, cyanates,
phytosterols
Inhibitors of procarcinogen activation,
inducers of drug binding of
carcinogens, inhibitors of
tumourogenesis
Other Alkaloids, terpenoids, volatile
flavor compounds, biogenic
amines
Neuropharmacological agents, anti-
oxidants, cancer chemoprevention
Source: (Saxena et al., 2013)
2.7.1 Classification of phytochemicals
The exact classification of phytochemicals could have not been performed so far, because of
the wide variety of them. In recent year phytochemicals are classified as primary or
secondary constituents, depending on their role in plant metabolism. Primary constituents
include the common sugars, amino acids, proteins, purines and pyrimidine of nucleic acids,
12
chlorophylls etc. Secondary constituents are the remaining plant chemicals such as alkaloids,
terpenes, flavonoids, steroids, curcumines, saponins, phenolic, flavonoids and glucoside
(Saxena et al., 2013).
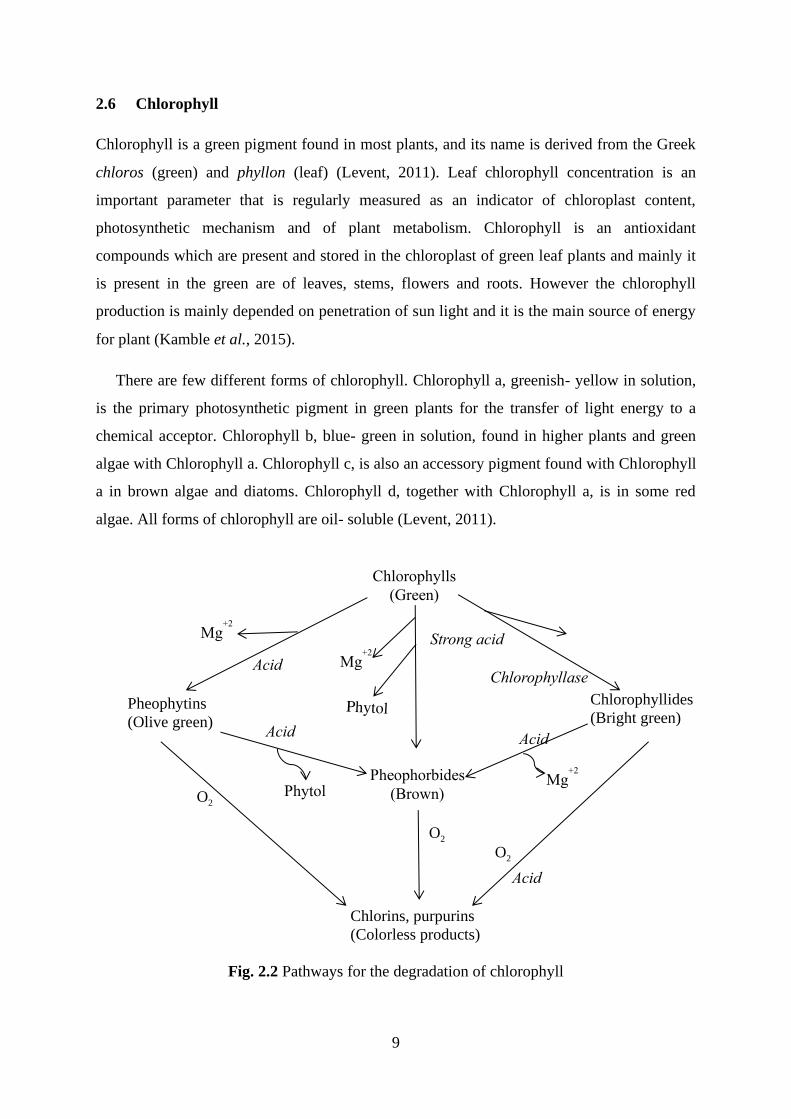
2.7.1.1 Phenolic
Phenolic phytochemicals are the largest category of phytochemicals and the most widely
distributed in the plant kingdom. Phenolic are hydroxyl group (-OH) containing class of
chemical compounds where the (-OH) bonded directly to an aromatic hydrocarbon group
(Altiok, 2010).Based on the numbers of carbon atoms present in its structure, phenolic are
categorized as Table 2.2
Table 2.2 Major classes of phenolic compounds in plants
S.N. No of carbon atom Basic skeleton Class
1 6 C6 Simple phenols Benzoquinones
2 7 C6-C1 Phenolic acids
3 8 C6-C2 Acetophenones Tyrosine derivatives
4 9 C6-C3 Hydroxycinnamic acid, Coumarins
5 10 C6-C4 Naphthoquinones
6 13 C6-C1-C6 Xanthones
7 14 C6-C2-C6 Stilbenes
8 15 C6-C3-C6 Flavonoids
9 18 (C6-C3)2 Lignans
10 30 (C6-C3-C6)2 Bioflavonoids
11 N (C6-C3-C6)n Condensed tannins
Source: (Altiok, 2010)

13
2.7.1.1.1 Activity of phenolic acids
Phenolic compounds are famous group of secondary metabolites with wide pharmacological
activities. Phenolic acid compounds and functions have been the subject of a great number of
agricultural, biological, chemical and medicinal studies. Phenolic compounds in many plants
are polymerized into larger molecules such as the proanthcyanidins (PA; condensed tannins)
and lignins. Moreover, phenolic acids may arise in food plants as glycosides or esters with
other natural compounds such as sterols, alcohols, glucosides and hydroxyfatty acids. Varied
biological activities of phenolic acids were reported. Increases bile secretion, reduces blood
cholesterol and lipid levels and antimicrobial activity against some strains of bacteria such as
staphylococcus aureus are some of biological activities of phenolic acids. Phenolic acid
possesses diverse biological activities, for instance, antiulcer, anti- inflammatory, antioxidant,
cytotoxic and antitumor, antispasmodic and antidepressant activities (Saxena et al., 2013).
2.7.1.2 Flavonoids
Flavonoids are secondary metabolites abundantly widespread throughout the plant kingdom.
The major sources of flavonoids are fruit products (e.g. citrus fruits, rosehip, apricot, cherry,
grapes, black currant, bilberry, apple), vegetables (e.g. onion, green pepper, broccoli, tomato,
spinach), beverages (red wine, coffee, tea), cocoa bean, soy products and herbs. They are
found in all plant tissues, where they are present inside the cells or on the surfaces of different
plant organs (Viskupicova et al., 2008). They have several important functions in plants, such
as providing protection against harmful UV radiation or plant pigmentation. In addition they
have antioxidant, antiviral and antibacterial properties (Kozłowska and Węgierek, 2014).
Fig. 2.3 Basic structure of flavonoid
3
1
2
4 5
6
A C
O
B
7
8 1’
2’
3’
4’
5’
6’

14
They can occur both in free form (aglycones) and as glycosides, and differ in their
substituents (type, number and positions) and in their insaturation. The most common classes
are the flavones, flavonols, flavanones, catechins, isoflavones and anthocyanidins, which
accounts for around 80% of flavonoids. All flavonoids share a basic C6-C3-C6 phenyl-
benzopyran backbone. The position of the phenyl ring relative to the benzopyran moiety
allows a broad separation of these compounds into flavonoids (2-phenyl benzopyrans),
isoflavonoids (3-phenyl-benzopyrans) and neoflavonoids (4-phenyl-benzopyrans). Division
into further groups is made on the basis of the central ring oxidation and on the presence of
specific hydroxyl groups. Most common flavonoids are flavones (with C2-C3 double bond
and C4-oxo function), flavonols (flavones with a 3-OH group) and flavonnes (flavone
analogues but with a C2-C3 single bond), and abundant isoflavonoids include isoflavones
(the analogue of flavones). 4-arylcoumarin (a neoflavonoid with a C3-C4 double bond) and
its reduced form, 3,4-dihydro-4-arylcoumarin, are the major neoflavonoids. Other natural
compounds, such as chalcones and aurones also possess the C6-C3-C6 backbone, and are
henceforth included in the general group of flavonoids (Pinheiro and Justino, 2012).
2.7.1.2.1 Biological activity of flavonoids
Flavonoids have gained recent attention because of their broad biological and
pharmacological activities. Flavonoids have been reported to exert multiple biological
property including antimicrobial, cytotoxicity, anti-inflammatory as well as antitumor
activities but the best-described property of almost every group of flavonoids is their capacity
to act as powerful antioxidants which can protect the human body from free radicals and
reactive oxygen species. The capacity of flavonoids to act as antioxidants depends upon their
molecular structure. The position of hydroxyl groups and other features in the chemical
structure of flavonoids are important for their antioxidant and free radical scavenging
activities. On the other hand flavonoids such as luteolin and cathechins, are better
antioxidants than the nutrients antioxidants such as vitamin C, vitamin E and β-carotene.
Flavonoids have been stated to possess many useful properties, containing anti-inflammatory
activity, enzyme inhibition, antimicrobial activity, oestrogenic activity, anti-allergic activity,
antioxidant activity, vascular activity and cytotoxic antitumor activity (Tapas et al., 2008).
Flavonoids constitute a wide range of substances that play important role in protecting
biological systems against the harmful effects of oxidative processes on macromolecules,
such as carbohydrates, proteins, lipids and DNA (Atmani et al., 2009).

15
2.7.1.3 Tannins
Tannins are astringent, bitter plant polyphenols that either bind and precipitate or shrink
proteins. The term tannin refers to the use of tannins in tanning animal hides into leather.
However, the term is widely applied to any large polyphenolic compound containing
sufficient hydroxyls and other suitable groups (such as carboxyls) to form strong complexes
with proteins and other macromolecules. Tannins have molecular weights ranging from 500
to over 3000. Tannins are found shapeless yellowish or light brown masses like powder,
flakes or sponge. Tannins are found in all plants and in all climates all over the world. Lower
plants such as algae, fungi and mosses do not contain much tannin. The percentage of tannins
present in the plants, however varies. Tannins are usually found in large quantities in bark of
trees where they act as a barrier for micro-organisms and protect the tree (Upadhyaya and
Ashok, 2012).
Tannins are divided into hydrolysable tannins and condensed tannins. Hydrolysable
tannins, upon hydrolysis, produce Gallic acid and ellagic acid and depending on the type of
acid produced, the hydrolysable tannins are called Gallo tannins or egallitannins. On heating,
they form pyrogallic acid. Tannins are used as antiseptic and this activity is due to presence
of the phenolic group. Common examples of hydrolysable tannins include theaflavins (from
tea), daidezein, genistein and glycitein (Doughari, 2012).
2.7.1.3.1 Activity of tannins
The tannin-containing plant extracts are used as astringents, against diarrhea, as diuretics,
against stomach and duodenal tumors (Bruyne et al., 1999) and as anti-inflammatory,
antiseptic, antioxidant and hemostatic pharmaceuticals (Dolara et al., 2005). In medicine,
especially in Asian (Japanese and Chinese) natural healing, the tannin-containing plant
extracts are used as astringents, against diarrhea, as diuretics, against stomach and duodenal
tumors, and as anti-inflammatory, antiseptic, antioxidant and haemostatic pharmaceuticals.
Tannins are used in the dyestuff industry as caustic for cationic dyes (tannin dyes), and also
in the production of inks, and also in the production of inks (iron gallate ink). In the food
industry tannins are used to clarify wine, beer and fruit juices. Other industrial uses of tannins
include textile dyes, as antioxidants in the fruit juice, beer and wine industries, and as
coagulants in rubber production. Recently tannins have attracted scientific interest, especially
due to the increased incidence of deadly illnesses such as AIDS and various cancers. The
16
search for new lead compounds for the development of novel pharmaceuticals has become
increasingly important, especially as the biological action of tannin-containing plant extracts
has been well documented (Saxena et al., 2013).
2.7.2 Antioxidant and its activity
Antioxidants may be defined as substances that, when present in food, delay, control, or
inhibit oxidation and deterioration of food quality. In the body, antioxidants reduce the risk of
degenerative diseases arising from oxidative stress (Halliwell, 1999). Antioxidants are
compound capable to either delay or inhibit the oxidation process which under the influence
of atmospheric oxygen or reactive oxygen species. They are used for the stabilization of
polymeric products, of petrochemicals, foodstuffs, cosmetics and pharmaceuticals.
Antioxidants are involved in the defense mechanism of the organism against the pathologies
associated to the attack of free radicals (Pisoschi and Negulescu, 2011). Antioxidants are
compounds that protect cells against the damaging effects of reactive oxygen species
otherwise called, free radicals such as singlet oxygen, superoxide anion, peroxyl radicals,
hydroxyl radicals and peroxynitrite which results in oxidative stress leading to cellular
damage. Natural antioxidants play a key role in health maintenance and prevention of the
chronic and degenerative diseases such as atherosclerosis, cardiac and cerebral ischema,
carcinogenesis, neurodegenerative disorders, diabetic pregnancy, rheumatic disorder, DNA
damage and ageing (Doughari et al., 2009).
Antioxidants exert their activity by scavenging the ‘free-oxygen radicals’ thereby giving
rise to a fairly ‘stable radical’. Free radicals generated in the body can be removed by the
body’s own natural antioxidant defenses such as glutathione or catalases. Therefore, this
deficiency had to be compensated by making use of natural exogenous antioxidants, such as
vitamin C, flavones, beta-carotene and natural products in plants. Plants contain a wide
variety of free radicals scavenging molecules including phenols, flavonoids, vitamins,
terpenoids that are rich in antioxidant activity. Many plants, citrus fruits and leafy vegetables
are the source of ascorbic acid, vitamin E, carotenoids, flavanols and phenolics which possess
the ability to scavenge the free radicals in human body. Significant antioxidant properties
have been recorded in phytochemicals that are necessary for the reduction in occurrence of
many diseases (Omojate et al., 2014).

17
Antioxidant activity is the total capacity of antioxidants for eliminating free radicals in the
cell and in food. It has been mentioned the antioxidant activity of plants might be due to their
phenolic compounds (Cook and Samman, 1996). Flavonoids are a group of polyphenolic
compounds with known properties which include free radical scavenging, inhibition of
hydrolytic and oxidative enzymes and anti-inflammatory action. Some evidence suggests that
the biological actions of these compounds are related to their antioxidant activity (Gryglewski
et al., 1987).
Polyphenols are excellent antioxidants due to 3,4 dihydroxy group in their B ring and the
galloyl ester in the C ring of flavonoids (Chen and Chu, 2006). Tocopherols have their own
antioxidant activity, including hydrogen atom transfer at 6- hydroxyl group on the chroman
ring and scavenging of singlet oxygen and other reactive species (Korus and Lisiewska,
2011). The antioxidant activity of ascorbic acid is based on hydrogen atom donation to lipid
radicals, quenching of singlet oxygen and the removal of molecular oxygen (Lee et al., 2004).
Chen and Chu (2006) reported that flavonoids have the most potent antioxidant activity
because their chemical structure contains an O-diphenolic group, a 2-3 double bond
conjugated with 4-oxo function and hydroxyl groups in the position 3 and 5. Flavonoids
effectively scavange hydroxyl and peroxyl radicals, form complexes with metals and inhibit
metal initiating lipid oxidation. The antioxidant activity of phenolic acid also depend on the
number of orientation of hydroxyl groups relative to the electron withdrawing CO2H,
CH2CO2H, or (CH)2CO2CH functional groups (Rice-Evans and Miller, 1996).
A rapid, simple and inexpensive method to measure antioxidant capacity of food involves
the use of the free radical, 2, 2-Diphenyl-1- picrylhydrazyl (DPPH) which is widely used to
test the ability of compounds to act as free radical scavengers or hydrogen donors and to
evaluate antioxidant activity. The DPPH assay method is based on the reduction of DPPH, a
stable free radical. The free DPPH radical with an odd electron gives absorbance (purple
color) at 517nm. When the antioxidants in plant extract react with DPPH, it is reduced to
DPPH-H and results in decolorization to yellow color with respect to the number of electrons
captured. The color absorbance corresponds inversely to the radical scavenging activity of the
sample extract.
The scavenging of DPPH by radical scavengers can be summarized as:

18
DPPH • + FE DPPH – H + A• (1)
DPPH + A• DPPH – A (2)
A• + A• A – A (3)
Where FE is a scavenger of the extract and A• is a radical. The newly formed radical (A•)
can mainly follow radical-radical interaction to render stable molecules, via radical
disproportionate, collision of radicals with abstraction of an atom by one radical from another
equations (Chandra and Goyal, 2014).
2, 2-diphenyl-1-picrylhydrazyl 2, 2-diphenyl-1-picrylhydrazine
Fig. 2.4 Reaction of DPPH-free radical with an antioxidant
2.7.3 Extraction of phytochemicals
Extraction is the separation of medicinally active portions of plant or animal tissues from the
inactive or inert components by using selective solvents in standard extraction procedures.
The products so obtained from plants are relatively impure liquids, semisolids or powders
intended only for oral or external use. The purpose of standardized extraction procedures for
crude drugs (medicinal plant parts) is to attain the therapeutically desired portions and to
eliminate unwanted material by treatment with a selective solvent known as menstrum. The
extract thus obtained, after standardization, may be used as medicinal agent as such in the
form of tinctures or fluid extracts or further processed to be incorporated in any dosage form
such as tablets and capsules. These products contains complex mixture of many medicinal
plant metabolites, such as alkaloids, glycosides, terpenoids, flavonoids and lignans (Handa,
2008). The general techniques of medicinal plant extraction include maceration, infusion,
percolation, digestion decoction, hot continuous extraction (Soxhlet), aqueous-alcoholic
N
N
’
N
O
O2N
N
O
+ AH N
H
N
N
O O2N
N
O
+ A

19
extraction by fermentation, countercurrent extraction, microwave-assisted extraction,
ultrasound extraction (sonication), supercritical fluid extraction (Tiwari et al., 2011).
Maceration
Maceration is a technique used in wine making and has been adopted and widely used in
medicinal plants research. It involves soaking plant materials (coarse or powdered) in a
stoppered container with a polar solvent and allowed to stand at chilled temperature for a
period of two to three days (Handa, 2008). This process is intended to soften and break the
plant cell wall to release the soluble phytochemicals. After two to three days, the mixture is
pressed or strained by filtration. The choice of solvents will determine the type of compound
extracted from the samples (Azwanida, 2015). However, maceration have been suggested by
(Vongsak et al., 2013) as more applicable, convenient and less costly method compared to
other modern extraction methods since all these extraction methods resulted in crude extracts
containing a mixture of metabolites having almost similar recovery of phytochemicals. This
particular fact suggests that preparation of crude extract through modern technology, which is
rather complex and time consuming is not necessary if proper preparation and extraction are
done (Azwanida, 2015).
Supercritical fluid extraction (SFE)
Supercritical Fluid Extraction (SFE) involves use of gases, usually CO2, and compressing
them into a dense liquid. This liquid is then pumped through a cylinder containing the
material to be extracted. From there, the extract-laden liquid is pumped into a separation
chamber where the extract is separated from the gas and the gas is recovered for re-use.
Solvent properties of CO2 can be manipulated and adjusted by varying the pressure and
temperature. The advantages of SFE are, no solvent residues left in it as CO2 evaporates
completely (Patil and Shettigar, 2010).
Infusion
It is a dilute solution of the readily soluble components of the crude drugs. Fresh infusions
are prepared by macerating the solids for a short period of time with either cold or boiling
water (Cathrine and Banu, 2015).

20
Digestion
This is a kind of maceration in which gentle heat is applied during the maceration extraction
process. It is used when moderately elevated temperature is not objectionable and the solvent
efficiency of the menstrum is thereby increased (Cathrine and Banu, 2015).
Soxlet extraction
Soxhlet extraction is only required where the desired compound has a limited solubility in a
solvent, and the impurity is insoluble in that solvent. If the desired compound has a high
solubility in a solvent then a simple filtration can be used to separate the compound from the
insoluble substance. The advantage of this system is that instead of many portions of warm
solvent being passed through the sample, just one batch of solvent is recycled. This method
cannot be used for thermolabile compounds as prolonged heating may lead to degradation of
compounds (Nikhal et al., 2010).
2.7.4 Factors affecting phytochemicals
Production of phytochemicals in plants is affected by many pre- and post-harvest factors
including farming practices, environmental factors (microclimate, location, growing season,
soil type and nutrients), plant maturity, post-harvest storage and processing, but genetics is
the primary factor among all (Li et al., 2012).
Genetic and environment
Genetics has the greatest effect on the production of plant secondary metabolites (Tsao et al.,
2006) . Mineral composition, soil type, temperature, light and water content are among the
frequently reported factors that affect the total phytochemical contents in plants (Rao and
Rao, 2007) (Hansen et al., 2010).
Post-harvest Storage and Processing Conditions
Changes in both the quality and phytochemical composition of plants can occur rapidly
depending on postharvest handling such as storage and processing conditions (Rodriguez-
Amaya, 2003). The two major chemical changes causing the deterioration are lipid oxidation
and non-enzymatic browning during storage and food processing, which can lead to altered
color and flavor. Lipid oxidation is influenced by light, oxygen, temperature, the presence of
catalysts, such as transition metals iron and copper, and water activity. Non-enzymatic

21
browning occurs easily during the storage of dried and concentrated foods. Different
phytochemicals are affected by these factors differently. Carotenoids are very sensitive to
heat, and can incur significant losses during different vegetable processing steps (Zhang and
Hamauzu, 2004).
The main cause of carotenoid degradation in foods is oxidation. Flavonoids and other
phenolic compounds are relatively stable at high temperature and over long storage (Vallejo
et al., 2003). Phenolic in plants exist in both free and conjugated forms. Post-harvest loss of
phenolic is mainly due to enzymatic oxidation by polyphenol oxidase and peroxidases (Jones,
2007).
Post -harvest Storage Conditions
Post-harvest storage may affect the composition of some phytochemicals in plants; however,
the degree of the effect depends largely on the storage conditions. Metabolism of the
phytochemicals begins right after harvest, and it can involve complex biochemical reactions
during transportation and post-harvest storage. These reactions can lead to significant
changes in plant attributes (taste, smell, appearance and texture), and the health promoting
phytochemicals, such as those with strong antioxidant activities (Michalczyk et al., 2009).
Storage temperature, atmosphere gas composition and use of chemicals are major factors that
influence the quantity and quality of phytochemicals (Li et al., 2012).
Lower temperature can slow the deterioration of phytochemicals. Opposed to lower
temperature, high temperature also brings a significant change in total phenolic, flavonoid,
tannin content and antioxidant activity compared with its fresh form. However their
concentration may vary according to the drying methods used and the duration of exposure to
hot air (Michalczyk et al., 2009). Exposure to high temperature leads to discharge of phenolic
compounds through disintegration of cellular constituents which then results in the migration
of components, leading to losses by leakage or breakdown by various chemical reactions
involving enzymes, light and oxygen as well as (Davey et al., 2002)
Food Processing Conditions
Plant foods are processed to meet different consumer requirements. Generally, processed
products have lower nutritional values than their respective fresh commodities mainly due to
the loss of nutrients during processing (Muftugil, 1986). Industrial processing e.g., blanching,

22
canning, sterilizing and freezing, as well as various cooking methods e.g., boiling, steaming
and microwaving, of fruits and vegetables can affect the content and composition of nutrients
including phytochemicals, normally leading to reduced availability of these compounds
(Podsedek, 2007; Podsedek et al., 2008). Studies have shown that blanching leads to reduced
content of vitamins, carotenoids and phenolic compounds, which are relatively labile to heat
treatments (Prochaska et al., 2000).
PART III
Materials and methods
3.1 Raw materials
The plant under study during the research was wheatgrass (Triticum aestivum).
3.2 Identification of seed
Wheat seeds to be germinated were identified as Triticum aestivum in Botanical lab at Central
Campus of Technology, Dharan.
3.3 Collection and preparation of sample
Collection and preparation of sample for analysis includes following steps:
Analysis of germination capacity
Wheat seeds (Triticum aestivum) were brought from the local market of Dharan. Random
samples of seeds were taken and placed in moist filter paper in covered petri dish. A
temperature of 30°c for 16 hours and 20°c for 8 hours was maintained and germination
capacity of wheat seeds was calculated as below (Ffolliot and Thames, 1983):
Germination capacity (%) = (N0/N)*100
Where,
N0= No. of healthy, well developed full seeds
N= Total number of seeds in sample
Germination of wheat
Germination of wheat seeds was done in the month of November/ December at Dharan.
Growing of wheatgrass included soaking wheat seed in water overnight and germinating
them for 24 hours, by tying in muslin cloth and spreading them over the soil, avoiding
overlapping of the seeds. The growing area was covered with 50% green shade net so as to
provide natural air flow and avoid direct sunlight. Regular watering was done and when
required during the growing period (Pardeshi et al., 2013). pH of soil was determined by
24
method as described by (Jackson, 1958). Wheatgrass was successfully grown at temperature
of 24°C to 26°C with average temperature of 24.8°C and relative humidity of 61% to 71%
with average of 64.9% as shown in Appendix C.5.
Drying and grinding of tender wheatgrass
The wheatgrass of 6th, 7th, 8th, 9th and 10th were harvested manually on respective days for
drying. Those wheatgrass were subjected to cabinet drying (50°C, 5hr). Dried wheatgrass was
powdered in grinder and thus five different samples were prepared for analysis.
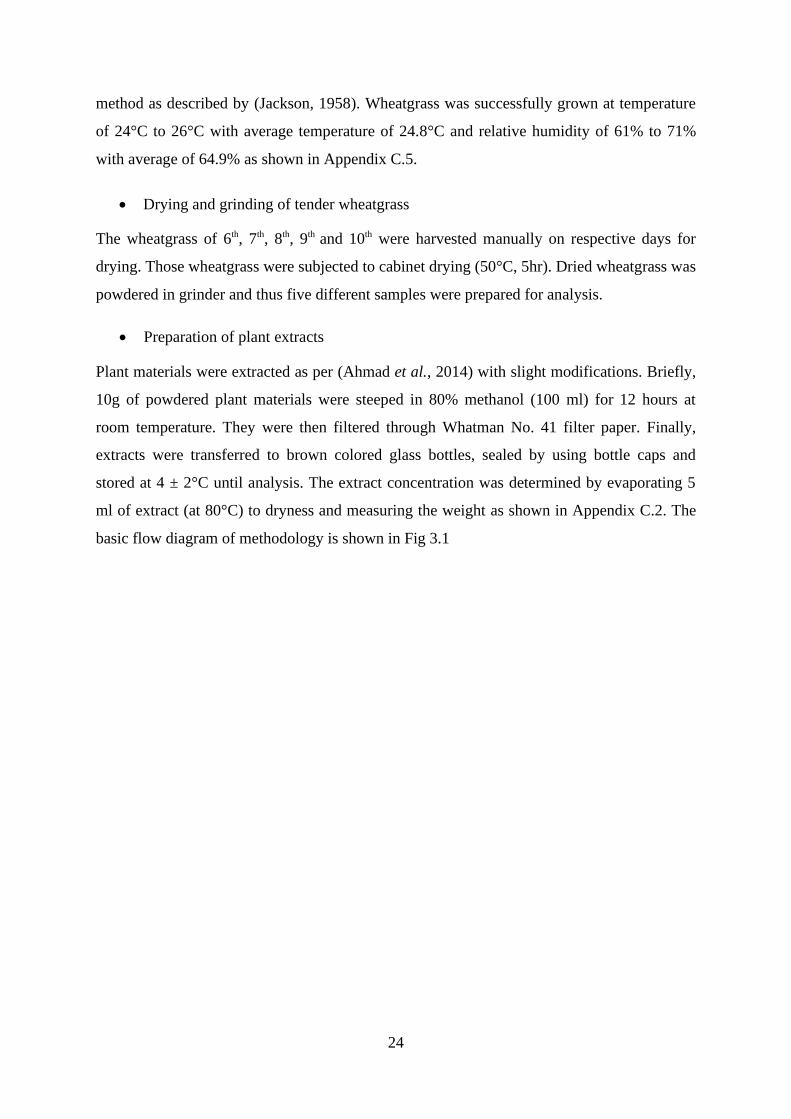
Preparation of plant extracts
Plant materials were extracted as per (Ahmad et al., 2014) with slight modifications. Briefly,
10g of powdered plant materials were steeped in 80% methanol (100 ml) for 12 hours at
room temperature. They were then filtered through Whatman No. 41 filter paper. Finally,
extracts were transferred to brown colored glass bottles, sealed by using bottle caps and
stored at 4 ± 2°C until analysis. The extract concentration was determined by evaporating 5
ml of extract (at 80°C) to dryness and measuring the weight as shown in Appendix C.2. The
basic flow diagram of methodology is shown in Fig 3.1

25
Wheat seeds
Washing
Sorting and grading
Soaking overnight
Sprouting for 24 hours in muslin cloth
Spreading over soil avoiding direct sunlight and watering regularly
Harvesting in 6th, 7th, 8th, 9th and 10th day
Cabinet drying (50°C, 5hr)
Powdered in grinder
Stored in polythene bags
Analysis
Phytochemical properties Sensory attributes
Fig 3.1 Flow diagram of wheatgrass production and analysis
Phenol
Flavonoid
Tannin
Chlorophyll
Antioxidant activity
DPPH radical scavenging activity
Color
Flavor
Taste
After taste
Overall acceptability

26
3.4 Qualitative analysis for Phytochemical
The phytochemical contents of extracts were analyzed by using the following standard
methods (Jaradat et al., 2015).
3.4.1 Phenols and tannins
Two milliliter of 2% solution of FeCl3 mixed with crude extract. Black or blue-green color
indicated the presence of tannins and phenols.
3.4.2 Flavonoids
Shinoda test: Pieces of magnesium ribbon and HCl concentrated were mixed with
crude plant extract after few minutes pink colored scarlet appeared that indicated the
presence of flavonoids.
Alkaline reagent test: 2 ml of 2% NaOH solution was mixed with plant crude extract,
intensive yellow color was formed, which turned into colorless when added 2 drops of
dilute HCl to solution, this result indicated the presence of flavonoids.
3.4.3 Saponins
Five milliliter of distilled water was added to crude plant extract in a test tube and it was
shaken vigorously. The foam formation indicated the presence of saponins.
3.4.4 Glycosides
Liebermann’s test: 2 ml of acetic acid and 2 ml of chloroform mixed with entire plant
crude extract. The mixture was then cooled and added H2SO4 concentrated, green
color indicated the entity of aglycone steroidal part of glycosides.
Salkowski’s test: H2SO4 concentrated (about 2 ml) was added to the entire plant crude
extract. A reddish brown color produced indicated the entity of steroidal aglycone part
of the glycoside.
Keller-kilani test: A mixture of acetic acid glacial (2 ml) with 2 drops of 2% FeCl3
solution was added to the plant extract and H2SO4 concentrated. A brown ring
produced between the layers which indicated the entity of cardiac steroidal
glycosides.

27
3.4.5 Steroid
Two milliliter of chloroform and concentrated H2SO4 were mixed with the entire plant crude
extract. In the lower chloroform layer produced red color that indicated the presence of
steroids. Another test was performed by mixing 2 ml of each of acetic acid with H2SO4
concentrated and crude extract with 2 ml of chloroform. Green color indicated the entity of
steroids.
3.4.6 Terpenoids
Two milliliter of chloroform was mixed with the plant extract and evaporated on the water
path then boiled with 2 ml of H2SO4 concentrated. A grey color produced indicated the entity
of terpenoids.
3.5 Quantitative analysis of phytochemicals
3.5.1 Determination of total phenol
Total phenolic content (TPC) in the plant methanolic and ethanolic extracts was determined
using spectrophotometric method (Jaradat et al., 2015)with some modifications. The reaction
mixture was prepared by mixing 0.5 ml of plant extract solution, 2.5 ml of 10% Folin
Ciocalteu’s reagent dissolved in water and 2.5 ml of 7.5% of Na2CO3 aqueous solution. The
samples were thereafter incubated in a thermostat at 45 ºC for 45 min. The absorbance was
determined using spectrophotometer at wave length = 765 nm. The samples were prepared in
triplicate for each analysis and the mean value of absorbance was obtained. The same
procedure was repeated for the standard solution of gallic acid and the calibration line was
constructed. Based on the measured absorbance, the concentration of gallic acid equivalent
expressed in terms of (mg of GA/g of extract).
3.5.2 Determination of flavonoid
Total flavonoid content was determined using a modified aluminium chloride assay method
as described by (Barek and Hasmadi, 2015).2 ml of solution was pipette out in a test tube in
which 0.2 ml of 5% Sodium Nitrate (NaNO3) was mixed and stand for 5 minutes. 0.2 ml
Aluminium Chloride (AlCl3) was pipetted out, mixed in the tube and allowed to stand for 5
minute. This followed addition of 2 ml of 1N Sodium Hydroxide (NaOH) in the tube and
finally volume was made up to 5ml. The absorbance was measured after 15 minutes at 510nm
against a reagent blank. The test result was correlated with standard curve of Quercetin (20,

28
40, 60, 80, 100µg/ml) and the total flavonoid content is expressed as mg quercetin
equivalents(QE) (Barek and Hasmadi, 2015).
3.5.3 Determination of tannins
Tannin was determined by Folin-ciocalteu method. About 0.1 ml of the sample extracts
added to volumetric flask(10ml) containing 7.5 ml distilled water and 0.5 ml folin-ciocalteu
reagent,1 ml 35%Na2Co3 solution and dilute to 10 ml distilled water. The mixture is shaken
well and kept at room temperature for 30min. A set of reference standard solution of Gallic
acid (20, 40, 60, 80, 100µg/ml) are prepared in same manner as described earlier. Absorbance
for test and standard solution are measured against blank at 725nm with an UV/visible
spectrophotometer. The tannin content is expressed in terms of mg of GAE/g of extract
(Mythili et al., 2014).
3.5.4 Determination of chlorophyll
Total chlorophyll content in wheatgrass sample is determined as per (Rai, 2006).
Chl a, mg/g tissue = 12.7(A663) -2.69(A645) × V/1000×W
Chl b, mg/g tissue = 22.9(A663) -4.68(A645) × V/1000×W
Total chlorophyll, mg/g tissue = Chl a + Chl b (calculated above)
Where, A = absorbance at specific wavelengths
V = final volume of chlorophyll extract
W = fresh weight of tissue extracted
3.5.5 Determination of DPPH radical scavenging activity
DPPH free radical scavenging activities (antioxidant activities) of extracts were determined
by method described by (Vignoli et al., 2011)with slight variation. Different dilutions of the
extracts were made using 80% methanol. Then 1 ml of the extract was mixed with 2 ml of 0.1
mM DPPH solution. The absorbance was read at 517 nm after 30 min incubation in the dark.
Finally, percentage scavenging activity was determined using following equation:
% scavenging activity = (Ac-As) × 100 /Ac

29
3.5.6 Sensory analysis
Sensory analysis of the wheatgrass powder were analysed as similar to tea testing procedure
developed by TRA (Tea Research Association), Assam. 2.8 gm of tea samples were weighed
and they were kept in a cup. 140 ml hot water was added and covered with lid. It was left for
5 minutes. The brew was then transferred to the bowl and the infusion was taken out in the
lid. Brew was evaluated for sensory attributes (color, flavor, taste, after taste and overall
acceptability) by semi-trained panelists using 9 point hedonic scale.
3.5.7 Optimization of wheatgrass powder
Wheatgrass harvested on 6 to 10 days were powdered and sensory evaluation was carried out
in Central Campus of Technology, Dharan by 10 semi trained panelists as per 9 point hedonic
ratings to optimize color, flavor, taste, after taste and overall acceptability. Criteria for
optimization of wheatgrass powder are shown in Table 3.3 and Table 3.4
Table 3.3 Phytochemicals parameters
Parameters Goals
TPC Maximize
TFC Maximize
Tannins Minimize
Antioxidant activity Maximize
Chlorophyll Maximize
Table 3.4 Sensory parameters
Parameters Goals
Color Maximize
Flavor Maximize
Taste Maximize
After taste Maximize
Overall acceptance Maximize

30
3.5.8 Statistical analysis
Analysis was carried out in triplicate. Statistical calculations were performed in Microsoft
office Excel 2010. All the data obtained in this experiment were analyzed for significance by
Analysis of Variance (ANOVA) using statistical software Genstat Release 12.1 (Discovery
Edition 12 developed by VSN International Limited). From this, means were compared using
Fischer’s protected LSD (Least Significant Difference) at 5% level of significance.

Part IV
Results and discussion
A common variety of wheat (Triticum aestivum) was collected from the local market of
Dharan for phytochemical analysis. Fresh wheatgrass of 6th, 7th, 8th, 9th and 10th day were
harvested respectively and subjected to drying to analyse their phytochemical composition.
4.1 Determination of germination capacity and pH value
Eighteen among twenty wheat seeds were germinated during analysis. So, germination
capacity of wheat seeds was found to be 90%. pH value of soil was found to be 7.3.
4.2 Qualitative analysis for phytochemical
During the experimental work, the methanolic extract of wheatgrass shown to have the
total phenol, total flavonoid, tannins and antioxidant activity as shown in Table 4.1
Table 4.1 Qualitative analysis for phytochemicals
Test Result
Phenols +ve
Tannins +ve
Flavonoids +ve
Glycosides +ve
Terpenoids +ve
Steroids +ve
Saponins -ve
Plus (+) =positive test; minus (-) =negative test
Similar result for phytochemical analysis of wheatgrass was obtained by (Suriyavathana et
al., 2016). The qualitative phytochemical analysis results explored the presence of a wide
range of phytochemical constituents which signifies the wheatgrass as a valuable
therapeutic natural source to compact dreadful infectious diseases.

32
4.3 Quantitative analysis of phytochemicals
Qualitative analysis of phytochemicals was carried out for total phenol content, flavonoids,
tannins, DPPH radical scavenging activity and chlorophyll. The statistically analysis
showed significant difference among all five samples at 5% level of significance. The
result of analysis of quantitative phytochemical analysis is shown in Appendix C.6.
4.3.1 Effect of growth days on total phenol content
The statistical analysis showed significant difference (p<0.05) in all five samples. Total
phenol content in wheatgrass powder of 6th day was found to be 318.07 mg/g which
increased as 367.42 mg/g, 385.55 mg/g, 409.49 mg/g, 454.68 mg/g on 7th, 8th, 9th and 10th
days respectively. Similar observation made by (Kulkarni et al., 2006) also showed
increase in phenol content of wheatgrass with growth. The effect of growth days on total
phenol content of wheatgrass is shown below in Fig. 4.1
Fig. 4.1 Effect of growth days on total phenol content
The majority of phenolic acids in wheat is represented by bound phenolic compounds,
as either hydroxycinnamic acid or hydrobenzoic acid derivatives, all involved in the
a
b c
d
e
0
50
100
150
200
250
300
350
400
450
500
A B C D E
Tota
l P
hen
ol
Conte
nt
(mgG
AE
/g)
Sample

33
composition of the cell wall. The common phenolic acids found in whole grains include
ferulic acid, vanillic acid, caffeic acid, syringic acid and p-coumaric acid. Among these,
ferulic acid appears to be predominant, especially in its bound form, and is stated to be a
major contributor to antioxidant activity. The amount of phenolic compounds in whole
grains is influenced by cultivar and environmental conditions during the filling, post-
harvest storage and germination (Benincasa et al., 2014). During the germination process,
the ferulic acid accumulates due to the phenolic biosynthesis and polyphenolic compounds
bound to cell walls (Hung et al., 2011). (Rattanapon et al., 2017) reports increase in bound
phenolic content at seedling stage due to enzymes involved in the phenylpropanoid
pathway and degradation of the cell wall polysaccharides and proteins leading to release of
bound phenolics. Moreover, (Randhir et al., 2004) also reported that the total phenolic
content of green mung decreased during germination. It pointed that an increasing and
decreasing of phenolics depended on plant variety, germination or seedling time, priming
condition and planting condition and so on.
4.3.2 Effect of growth days on flavonoid content
Flavonoid content of wheatgrass was also found to be increased with growth as 105.72
mg/g, 192.04 mg/g. 285.04 mg/g, 353.68 mg/g and 429.42 mg/g on 6th, 7th, 8th, 9th and 10th
days respectively. Statistical analysis showed significant difference (p<0.05) between
wheatgrass of 6th, 7th and 8th day but no significant difference (p>0.05) in 8th, 9th and 10th
day sample. (Kulkarni et al., 2006) also showed increase in flavonoid content of
wheatgrass with growth. The effect of growth days on flavonoid content of wheatgrass is
shown below in Fig. 4.2

34
Fig. 4.2 Effect of growth days on flavonoid content
During germination, vitamins, minerals and phenolic compounds including flavonoids
are synthesized in wheat sprouts, and wheat sprouts reach the maximum antioxidant
potential (Suriyavathana et al., 2016). Moreover, during seedling growth, L-phenylalanine
is transformed to cinnamic acid under the catalysis of phenylalanine ammonialyase (PAL).
Thereafter, many phenolic compounds are synthesized to be flavonoids, tannins, lignins,
and other compounds (Xu et al., 2015). Moreover, phenylalanine, ammonialyase (PAL)
could be enhanced during germination. Increase on flavonoid content on germination was
attributed to the biochemical metabolism of seeds during germination, which might
produce some secondary plant metabolites such as anthocyanins and flavonoids (Uchegbu
and Ndidi, 2015).
4.3.3 Effect of growth days on tannin content
Tannin content of wheatgrass decreased with growth. Statistical analysis showed
significant difference (p<0.05) between wheatgrass of 7th, 8th, 9th and 10th days but
wheatgrass of 6th and 7th day were not significantly different (p>0.05). Tannin content of 6th
day was found to be high with value 10.24 mg/g. Likewise, tannin content of 7th, 8th, 9th and
a
b
c
cd
d
0
100
200
300
400
500
600
A B C D E
Fla
vonoid
conte
nt
(mgQ
E/g
)
Sample

35
10th day were found to be 9.20 mg/g, 6.77 mg/g, 4.79 mg/g and 2.07 mg/g respectively. (de
Almeida et al., 2014) also reported decrease in tannin content on germination of sorghum
subjected drying. The effect of growth days on tannin content of wheatgrass is shown
below in Fig. 4.3
Fig. 4.3 Effect of growth days on tannin content
(Megat Rusydi and Azrina, 2012) found that non-germinated peanut and soybean had
the highest tannin content compared to germinated peanut and soybean. The observed
reduction in tannin content after germination was a result of formation of hydrophobic
association of tannins with seed proteins and enzymes. In addition loss of tannins during
germination also may be due to leaching of tannins into the water (Shimelis and Rakshit,
2007) and binding of polyphenols with other organic substances such as carbohydrate or
protein(Saharan et al., 2002).
4.3.4 Effect of growth days on DPPH radical scavenging activity
Antioxidant activity of wheatgrass also increased with growth. Statistical analysis also
showed significant difference (p<0.05) on antioxidant activity of five different sample.
Antioxidant capacity increased from 80.48% on 6th day to 84.38%, 87.38%, 90.39% and
d d
c
b
a
0
2
4
6
8
10
12
A B C D E
Tan
nin
co
nte
nt
(GA
Em
g/g
)
Sample

36
93.09% on 7th, 8th, 9th and 10th days respectively. (Kulkarni et al., 2006) reported increase in
antioxidant activity as a function of growth under different conditions.(Agrawal et al.,
2015) observed 9-10 inches of wheatgrass has richest nutrients and antioxidants and is best
to obtain for consumption. The effect of growth days on DPPH radical scavenging activity
of wheatgrass is shown below in Fig. 4.4
Fig. 4.4 Effect of growth days on DPPH radical scavenging activity
Recently it was shown that during germination, some biologically active compounds
were synthesized in the wheat sprouts (Calzuola et al., 2004; Mancinelli et al., 1998).
(Yang et al., 2001)also concluded that wheat sprouts reached the maximum potential after
7 days of plant growth. Increase in vitamins, ferulic acid and vanillic acid content with
increase in germination period results in increase in antioxidant potential (Dey et al.,
2006). (Ghumman et al., 2017) concluded higher radical scavenging capacity of wheat
may be attributed to its high chlorophyll content. Study in lead tree seeds by (Suryanti et
al., 2016) suggests that germination is a good way to enhance the antioxidant properties
and increase the phenolic compounds, β-carotene, ascorbic acid and α-tocopherol contents.
a
b
c
d
e
70
75
80
85
90
95
A B C D E
DP
PH
rad
ical
sca
ven
gin
g a
ctiv
ity (
%)
Sample

37
4.3.5 Effect of growth days on chlorophyll content
With growth, chlorophyll content of wheatgrass increased significantly upto day 8 and then
consequently decreased on day 9 and day 10 respectively. The obtained chlorophyll
content from this study was 10.86 mg/g, 11.49 mg/g, 14.72 mg/g, 9.39 mg/g and 7.12 mg/g
for day 6th, 7th, 8th, 9th and 10th respectively. Statistical analysis showed significant
difference (p<0.05) between all these samples.(Murali et al., 2016) concluded that the 8th
day wheatgrass harvest had high chlorophyll content and hence is the appropriate day for
wheatgrass consumption due to its close structural similarity of Hemoglobin of blood.
Value obtained for 10th day wheatgrass was similar to observation made by (Jain and Jain,
2014) on wheatgrass of same day. Chlorophyll content of wheatgrass powder was
10.27mg/2g. The effect of growth days on chlorophyll content of wheatgrass powder is
shown in Fig. 4.5
Fig. 4.5 Effect of growth days on chlorophyll content
Aging of leaves involves degradation of proteins, chlorophylls, nucleic acids, membranes
and subsequent transport of some of the degradation products to other parts of the plant.
Yellowing of leaves due to chlorophyll degradation is the most obvious symptom (Fang et
al., 1998). (Kamble et al., 2015) carried out research in chlorophyll content of young
c d
e
b
a
0
2
4
6
8
10
12
14
16
A B C D E
Conce
ntr
atio
n (
mg/g
)
Sample

38
leaves and adult leaves. Some plants showed high chlorophyll content in young whereas
some showed high chlorophyll content in adult plants. Reason for high chlorophyll content
in adult plants was attributed to maturity of plants and for young plants was attributed to
micronutrient deficiency of soil e.g. Fe deficiency or less penetration of sunlight. Changes
in chlorophyll content can occur as a result of nutrient deficiencies, exposure to
environmental stresses and certain herbicides, and differences in irradiance during plant
growth.
4.4 Sensory evaluation
Sensory evaluation was carried out for color, flavor, taste, mouth feel and overall
acceptability by semi trained panelists using 9 point hedonic scale. The statistical analysis
(two way ANOVA no blocking) was done. ANOVA was carried out using LSD at 5%
level of significance. There was significant difference for most of the sensory attributes
viz., color, flavor, taste, after taste and overall acceptability at P<0.05. The result of the
sensory evaluation is shown in Appendix C.7.
4.4.1 Color
Mean sensory score for color of sample A, B, C, D and E were found to be 7.5, 7.5, 8.1,
6.2 and 5.4 respectively. LSD showed that sample A and B were not significantly different
while other sample while other sample B and C, C and D, D and E were significantly
different from each other at 5% level of significance. Sample E had lowest mean score
whereas sample C had highest mean score. So, sample C was superior than other on the
basis of color from statistical analysis.

39
Fig.4.6 Mean sensory score for color
The values in the figure are the mean sensory score for color. Values on top of the bar
bearing similar alphabet are not significantly different at 5% level of significance. Vertical
error bar represent standard deviation of scores.
The primary pigments imparting color in fruits and vegetables are fat soluble
chlorophylls (green) and carotenoids (yellow, orange and red) and the water soluble
anthocyanins (red, blue), flavonoids (yellow) and betalains (red) (Barrett et al., 2010).
(Hortensteiner and Krautler, 2011) says chlorophyll degradation massively occurs during
leaf senescence or fruit ripening as a response of many biotic and abiotic responses. This
reason may be attributed to inferiority in color of sample D and E.
4.4.2 Flavor
Mean sensory score for flavor for sample A, B, C, D and E were found to be 5.9, 6.6, 6.7,
8.0 and 7.4 respectively. LSD showed that sample A and B, C and D, D and E were
significantly different whereas sample B and C were not significantly different at 5% level
of significance. Sample D had highest mean score and sample A had lowest. From all
among samples, sample D was found to be superior in terms of flavor.
c c
d
b
a
0
1
2
3
4
5
6
7
8
9
A B C D E
Mea
n s
enso
ry s
core
Sample

40
Fig.4.7 Mean sensory score for flavor
The values in the figure are the mean sensory score for flavor. Values on the top of bar
bearing similar alphabet are not significantly different at 5% level of significance. Vertical
error bar represent standard deviation of scores.
The germination process is well known to intensify both color and flavor of grain
products. The kilning (drying) step is especially important in the formation of different
kinds of flavors and color of germinated grain products(Fayle and Gerrard, 2002).
4.4.3 Taste
Mean sensory score for taste for sample A, B, C, D and E were found to be 5.9, 6.3, 6.8,
8.2 and 8 respectively. LSD showed no significant difference between sample A and B and
significant difference between B and C, C and D, D and E but no significant difference
between sample B and C at 5% level of significance. Sample D was found to be superior in
terms of taste compared to other samples.
a
b b
d
c
0
1
2
3
4
5
6
7
8
9
10
A B C D E
Mea
n s
enso
ry s
core
Sample

41
Fig.4.8 Mean sensory score for taste
The values in the figure are the mean sensory score for taste. Values on the top of bar
bearing similar alphabet are not significantly different at 5% level of significance. Vertical
error bar represent standard deviation of scores. The reason for sample D to be superior
may be its maturity.
4.4.4 After taste
Mean sensory score for after taste for sample A, B, C, D and E were found to be 5.7, 6.3,
6.9, 7.2 and 8.2 respectively. LSD showed significant difference between A and B, B and
C, D and E where no significant difference was found between sample C and D at 5% level
of significance. Sample E was found to be superior in terms of taste while sample A was
found to be inferior.
a a
b
c c
0
1
2
3
4
5
6
7
8
9
10
A B C D E
Mea
n s
enso
ry s
core
Sample

42
Fig.4.9 Mean sensory score for after taste
The values in the figure are the mean sensory score for after taste. Values on the top of bar
bearing similar alphabet are not significantly different at 5% level of significance. Vertical
error bar represent standard deviation of scores.
4.4.5 Overall acceptability
Mean sensory score for overall acceptability sample A, B, C, D and E were found to be 6,
6.4, 7.1, 7.4 and 8.2 respectively. LSD showed significant difference between samples B
and C, D and E but no significant difference between samples A and B, C and D. Samples
E was found to be superior considering overall acceptability.
a
b
c c
d
0
1
2
3
4
5
6
7
8
9
10
A B C D E
Mea
n s
enso
ry s
core
Sample

43
Fig.4.10 Mean sensory score for overall acceptability
The values in the figure are the mean sensory score for overall acceptability. Values on the
top of bar bearing similar alphabet are not significantly different at 5% level of
significance. Vertical error bar represent standard deviation of scores.
Overall acceptability is the reflection of other sensory attributes. On the basis of color,
flavor, taste, after taste sample D and E were most liked by panelists. Statistical analysis
showed higher acceptability for sample E.
4.4.6 Optimization of study
As regard with the phytochemicals analysis and sensory scores, the optimization study is
carried out as given below.
a a
b b
c
0
1
2
3
4
5
6
7
8
9
10
A B C D E
Mea
n s
enso
ry s
core
Sample

44
Table 4.2 Optimized goals for treatment (phytochemical analysis)
Parameters Optimized treatment
TPC E
TFC D=E
Tannins E
Antioxidant activity E
Chlorophyll C
Table 4.3 Optimized goals for treatment (sensory)
Parameters Optimized treatment
Color C
Flavor D
Taste D=E
After taste E
Overall acceptance E
From the study of different parameter, sample E had superior sensory characteristics.
Similarly, in terms of phytochemicals analysis sample E was found to be superior. So it
can be concluded that sample E i.e. wheatgrass of day 10 is superior than any other
samples in terms of both sensory and phytochemicals analysis.

Part V
Conclusions and recommendations
5.1 Conclusion
The effect of growth days on bioactive compounds of wheatgrass powder (Triticum
aestivum) and their sensory attributes was studied. Based on this research following
conclusion can be drawn.
a) Methanolic extract of wheatgrass powder showed presence of total phenols,
flavonoids, tannins, antioxidant activity and chlorophyll
b) Total phenol content of wheatgrass powder increased from 318.1 GAEmg/g on 6th day
to 454.7 GAEmg/g on 10th day.
c) Flavonoid content of wheatgrass powder increased from 105.7 QEmg/g to 429.4 mg/g
10th day.
d) Tannin content of wheatgrass powder decreased with growth from 10.24 mg/g on 6th
day to 2.077 mg/g on 10th day.
e) Antioxidant activity of wheatgrass powder was found to be 80.48% on 6th day which
increased respectively to 93.09% on 10th day.
f) Chlorophyll content of wheatgrass powder increased from 10.86 mg/g on 6th day to
14.27mg/g on 8th day and then decreased to 7.12 mg/g on 10th day.
g) Growth of wheatgrass showed significant impact on phytochemical and sensory
attributes.
h) Wheatgrass of 10th day was found to be superior in terms of phytochemical and
sensory attributes among other samples.
5.2 Recommendations
The plant studied in this work is on high demand because of its nutritional value and
traditional uses. Thus, following suggestions are recommended for future work in the field of
wheatgrass.
a) Effect of processing on phytochemical composition of wheatgrass can be studied.
b) Response of wheatgrass powder on blood sugar level of human body can be
studied.

46
c) As phytochemical composition was increasing, further research on wheatgrass
above 10th day can be done.
d) Preparation and quality evaluation of wheatgrass incorporated product can be
performed.

Part VI
Summary
Wheatgrass, (Triticum speices) a cereal grass of the Gramineae (Poaceae) family, is the
world’s largest edible grain cereal-grass crop. Wheat (Triticum aestivum) germinated over a
period of time is called as a wheat grass (Nepalese tongue – Jamara). Triticum is a genus of
annual and biennial grasses, yielding various types of wheat, native to south west Asia and
the Mediterranean region. Agriculturally, important species of Triticum include – Triticum
asetivum, Triticum durum and Triticum dicoccum. Among them, Triticum aestivum was
brought from the local market of Dharan.
Wheat (Triticum aestivum) seeds were soaked overnight, germinated for 12 hours on
muslin cloth and spreaded over the soil avoiding direct sunlight. After plantation, wheatgrass
was harvested manually on 6th, 7th, 8th, 9th and 10th day separately. Harvested wheatgrass was
subjected to cabinet drying (50°C, 5hr) and then powdered in a grinder to get the required
sample. Crude extract of samples were prepared using 80% methanol through maceration
technique. Phytochemicals screening of the methanol extract of the sample showed the
presence of total phenol content, flavonoid, tannin, glycosides, terpenoids, steroids and
saponins. Phytochemicals and sensory analysis of wheatgrass powder of 6th, 7th, 8th, 9th and
10th days was carried out.
Total phenol content, flavonoid and DPPH radical scavenging activity of wheatgrass
increased significantly (p<0.05) with growth to 454.7 mgGAE/g, 429.4 mgQE/g and 93.09%
on 10thday. Tannin content decreased significantly (p<0.05) to 2.077 mgGAE/g. Chlorophyll
content increased with growth upto 8th day to 14.27 mg/g and then decreased on day 9 and
day 10 respectively. Wheatgrass harvested on day 10 was found superior in terms of both
phytochemicals and sensory attributes. The composition of phytochemicals varies widely
with several factors like the stage of maturity, variety, climatic conditions, part of the plant
analyzed, post-harvest handling, processing, and storage.
Wheatgrass is known as complete nourishment and is promoted to treat a number of
conditions. So, it is better to include wheatgrass in regular diet in any form like juice, powder,
etc. to prevent chronic diseases.

48
References
Agrawal, A., Gupta, E. and Chaturvedi, R. (2015). Determination of Minerals and
Antioxidant Activities at Different Levels of Jointing Stage in Juice of Wheat Grass -
The Green Wonder. International journal of pure & applied bioscience. 3 (2), 311-
316.
Ahmad, W., Khan, I., Khan, M. A., Ahmad, M., Subhan, F. and Karim, N. (2014). Evaluation
of antidiabetic and antihyperlipidemic activity of Artemisia indica linn (aeriel parts)
in streptozotocin induced diabetic rats. J. Ethnopharmacology. 151, 618-623.
Akbas, E., Kilercioglu, M., Onder, O. N., Koker, A., Soyler, B. and Oztop, M. H. (2017).
Wheatgrass juice to wheat grass powder: Encapsulation, physical and chemical
characterization. Journal of Functional Foods. 28, 19-27.
Altiok, E. (2010). Recovery of phytochemicals(having antimicrobial and antioxidant
characteristics) from local plants. Thesis. Graduate School of Engineering and
Sciences of Izmir Institute of Technology, Izmir.
Ashok, S. A. (2011). Phytochemical and pharmacological screening of wheatgrass juice
(Triticum aestivum L.). International Journal of Pharmaceutical Sciences Review and
Research. 9 (1), 159-164.
Atmani, D., Chaher, N., Atmani, D., Berboucha, M., Debbache, N. and Boudaoud, H. (2009).
Flavonoids in Human Health: From Structure to Biological Activity. Current nutrition
and food science. 5 (4), 225-237.
Aydos, O. S., Avci, A., Ozkan, T., Karadag, A., Gurleyik, E., Altinok, B. and Sunguroglu, A.
(2011). Antiproliferative, apoptotic and antioxidant activities of wheatgrass (Triticum
aestivum L.) extract on CML (K562) cell line. Turk J Med Sci. 41 (4), 657-663.
Azwanida, N. (2015). A review on the extraction methods used in medicinal plants, principle,
strength and limitation. J. Med. and Aromatic plants. . 4, 196-198.
Barek, M. L. and Hasmadi, M. (2015). Effect of different drying methods on phytochemicals
and antioxidant properties of unfermented and fermented teas from Sabah Snake
Grass (Clinacanthus nutans Lind.) leaves. Int. Food Research Journal 22 (2), 661-
670.
Barrett, D. M., Beaulieu, J. C. and Shewfelt, R. (2010). Color, Flavor, Texture, and
Nutritional Quality of Fresh-Cut Fruits and Vegetables: Desirable Levels,
Instrumental and Sensory Measurement, and the Effects of Processing. Critical
Reviews in Food Science and Nutrition. 50, 369-389.
Benincasa, P., Galieni, A., Manetta, C. A., Pace, R., Guiducci, M., Pisante, M. and Stagnari,
F. (2014). Phenolic compounds in grains, sprouts and wheatgrass of hulled and non-
hulled wheat species. J Sci Food Agric. 1-9.
Bruyne, T. D., Pieters, L., Deelstra, H. and Vlietinck, A. (1999). Condensed vegetables
tannins: biodiversity in structure and biological activities. Biochemical Systematics
and Ecology. 27, 445-459.

49
Calzuola, I., Valeria, M. and Gianfranceschi, G. L. (2004). Synthesis of antioxidants in wheat
sprouts. Journal of agricultural and foof chemistry. 52, 5201-5206.
Cathrine, L. and Banu, K. S. (2015). General Techniques Involved in Phytochemical Analysis
. International Journal of Advanced Research in Chemical Science. 2 (4), 25-32.
Chandra, S. T. and Goyal, A. (2014). Antioxidant activity by DPPH radical scavenging
method Americ. J. Ethnomed. 1, 244-249.
Chaturvedi, N., Sharma, P. and Rohtagi, S. (2013). Preliminary Phytochemical, Nutritional
Potential of cereal Grass Powder Based Products for Effective Management of
Diabetes. International journal of advances in pharmacy, biology and chemistry. 2
(1), 234-240.
Chaudhary, R., Oluyemisi, A. E., Shrestha, A. K. and Adhikari, B. M. (2014). Effect of
germination on biochemical and nutritional quality of Kwati. Journal of food
processing and preservation. 39, 1509-1517.
Chauhan, M. (2014). A pilot study on wheat grass juice for its phytochemical, nutritional and
therapeutic potential on chronic diseases. International journal of chemical studies. 2
(4), 27-34.
Chen, C. and Chu, S. C. (2006). Effect of orign and fermentation time on the antioxidants
activities of kombucha. J. Food Chem. 3, 2619-2623.
Chesworth, J. M., Stuchbury, T. and Scaife, J. R. (1998). An Introduction to Agricultural
Biochemistry. Chapman & Hall. 341-342.
Cook, N. C. and Samman, S. (1996). Flavonoids- chemistry, metabolism, cardioprotective
effects and dietary sources. J. Nutri Biochem. 7, 66-76.
Danisova, C., Holotnakova, E., Hozova, B. and Buchtova, V. (1995). Effect of germination
on a range of nutrients of selected grains and legumes. Acta Alimentaria. 3, 287-298.
Davey, M. W., Van-Montagu, M., Inze, D., Sanmartin, M. and Kanellis, A. (2002). Plant L-
ascorbic acid: Chemistry, function, metabolism, bioavailability and effects of
processing. J Sci Food Agric. 80, 825-860.
de Almeida, T. T., da Rosa, S. D. V. F., Oliveira, J. A., Oliveira, A. S., da Silva, A. A. and
Pereira, D. S. (2014). Influence of tannin on sorghum seed germination. International
research journals. 5 (6), 136-142.
Desai, T. R. (2005). Investigation Into The Mechanism Of Action And Effects Of Triticum
Aestivum (Wheat) Grass. Doctor of philoshopy in pharmacology Thesis. Saurashtra
Univ., India.
Dey, S., Sarkar, R., Ghosh, P., Khatun, R., Ghorai, K. and Choudury, R. (2006). Effect of
Wheat grass Juice in supportive care of terminally ill cancer patients- A tertiary
cancer centre Experience from India. Journal of Clinical Oncology. 18, 8634.
Dolara, P., Luceri, C. D., Filippo, C., Femia, A., Giovannelli, L. and Carderni, G. (2005). Red
wine polyphenols influence carcinogenesis, intestinal microflora, oxidative damage

50
and gene expression profiles of colonic mucosa in F344 rats. J. Mutation Res. 591,
237-246.
Doughari, J. H. (2012). Phytochemicals: Extraction Methods, Basic Structures and Mode of
Action as Potential Chemotherapeutic Agents. In: "Phytochemicals - A Global
Perspective of Their Role in Nutrition and Health". (V. Rao, Ed.). Nigeria. InTech.
Doughari, J. H., Human, I. S., Bennade, S. and Ndakidemi, P. A. (2009). Phytochemicals as
chemotherapeutic agents and antioxidants: Possible solution to the control of
antibiotic resistant verocytotoxin producing bacteria. Journal of Medicinal Plants
Research. 3 (11), 839-848.
Fang, Z., Bouwkamp, J. C. and T., S. (1998). Chlorophyllase activities and chlorophyll
degradation during leaf senescence in non-yellowing mutant and wild type of
Phaseolus vulgaris L. Journal of Experimental Botany. 49 (320), 503-510.
Fayle, S. E. and Gerrard, J. A. (2002). The millard reaction. The royal society of chemistry,
Cambridge, U.K., 120.
Fellows, P. J. (2000). "Food processing technology: Principles and practice" (2 ed.). Wood
Head Publ, Ltd. Cambridge, England.
Ffolliot, P. F. and Thames, J. L. (1983). "Collection, handling, storage and pre-treatment of
Prosopis seeds in Latin America" (1986 ed.). FAO. Tucson, Arizona, USA.
Ghumman, A., Singh, A. and Kaur, A. (2017). Chemical, nutritional and phenolic
composition of wheatgrass and pulse shoots. International Journal of Food Science
and Technology. 1-9.
Gryglewski, R. J., Korbut, R. and Robak, J. (1987). On the mechanism of antithrombotic
action of flavonoids. Biochem Pharma. 36 (3), 317-322.
Halliwell, B. (1999). Food-derived antioxidants. Evaluating their importance in food and in
vivo. Food Sci and Agri Chem. 18, 1-29.
Handa, S., Khanija, S., Longo, G. and Rakesh, D. . (2008). ""Extraction Technologies for
Medicinal and Aromatic plants"." (1st ed. ed.). United Nations Industrial
Development Organization. . Italy.
Hansen, M., Bengtsson, G. B., Borge, G. I., Berge, L. and Wold, A. B. (2010). Red cabbage,
a vegetable rich in health-related glucosinolates. 867, 61-65.
Hidalgo, A., Scuppa, S. and Brandolini, A. (2016). Technological quality and chemical
composition of puffed grains from einkorn (Triticum monococcum L. subsp.
monococcum) and bread wheat (Triticum aestivum L. subsp. aestivum). LWT - Food
Science and Technology. 68, 541-548.
Hortensteiner, S. and Krautler, B. (2011). Chlorophyll breakdown in higher plants.
Biochimica et Biophysica Acta. 977-988.
Hung, P. V., Hatcher, D. W. and Barker, W. (2011). Phenolic acid composition of sprouted
wheats by ultra-performance liquid chromatography (UPLC) and their antioxidant
activities. Food chemistry. 126, 1896-1901.
51
Jackson, M. L. (1958). "Soil Chemical Analysis". Prentice Hall Inc. Englewood Cliffs.
Jain, N. and Jain, B. (2014). Nutritional composition, phytochemical analysis and product
development from green food Triticum aestivum. Indian Journal of ancient medicine
and yoga. 7 (1), 23-27.
Jaradat, N., Hussen, F. and Ali, A. A. (2015). Preliminary Phytochemical Screening,
Quantitative Estimation of Total Flavonoids, Total Phenols and Antioxidant Activity
of Ephedra alata Decne. J. Mater. Environ. Sci. 6 (6), 1771-1778.
Jones, R. B. (2007). Effects of postharvest handling conditions and cooking on anthocyanin,
lycopene, and glucosinolate content and bioavailability in fruits and vegetables. J.
Crop Hortic. Sci. 35, 219-227.
Kamble, P. N., Giri, S. P., Mane, R. S. and Tiwana, A. (2015). Estimation of Chlorophyll
Content in Young and Adult Leaves of Some Selected Plants Universal Journal of
Environmental Research and Technology 5(6), 306-310.
Korus, A. and Lisiewska, Z. (2011). Effect of preliminary processing and method of
preservation on the content of selected antioxidative compounds in kale (Brassica
oleracea L. var. acephala) leaves. Food Chem. 129, 149-154.
Kozłowska, A. and Węgierek, D. S. (2014). Flavonoids- Food sources and health benefits.
National Institute of Public Health. 65 (2), 79-85.
Kulkarni, S. D., Tilak, J. C., Acharya, R., Rajurkar, S., Devasagayam, T. P. A. and Reddy, A.
V. R. (2006). Evaluation of the antioxidant activity of wheatgrass (Triticum aestivum
L.) as a function of growth under different conditions. Phytother. Res. 20, 218-227.
Kumar, Y., Tiwari, S. and Belorkar, A. S. (2015). Drying: An Excellent Method for Food
Preservation. International journal of engineering studies and technical approach. 1
(8), 1-17.
Lee, J., Koo, N. and and Min, D. B. (2004). Reactive oxygen species, aging and antioxidant
nutraceuticals. Compreh Review Food Sci and Safety. 3, 21-33.
Levent, A. (2011). Chlorophyll: Structural Properties, Health Benefits and Its Occurrence in
Virgin Olive Oils. Academic food journal. 9 (2), 26-27.
Li, H., Tsao, R. and Deng, Z. (2012). Factors affecting the antioxidant potential and health
benefits of plant foods. Can. J. Plant Sci. 92, 1101-1111.
Liu, R. H. (2018). Potential Synergy of Phytochemicals in Cancer Prevention: Mechanism of
Action. International Research Conference on Food, Nutrition, and Cancer. 3479-
3485.
Lu, C. A., Lim, E. K. and Yu, S. M. (1998). Sugar response sequence in the rice promoter of
alpha-amylase gene serves as transcriptional enhancer. Journal of Biological
Chemistry. 273 (17), 10120-10131.
Mancinelli, L., Marsili, V. and Gianfranceschi, G. (1998). Presence of biologically active
substances in the wheat bud. Gastroenterol Int. 11, 50-51.

52
Megat Rusydi, M. R. and Azrina, A. (2012). Effect of germination on total phenolic, tannin
and phytic acid contents in soy bean and peanut. International Food Research
Journal. 19 (2), 673-677.
Michalczyk, M., Macura, R. and Matuszak, I. (2009). The effect of air-drying, freezedrying
and storage on the quality and antioxidant activity of some selected berries. J Food
Proc Pres 33, 11-21.
Muftugil, N. (1986). Effect of different types of blanching on the color and the ascorbic acid
and chlorophyll contents of green beans. J. of Food Processing and Preservation 10,
69-76.
Mujoriya, R. (2011). A study on wheat grass and its Nutritional value. Food science and
quality management. 2, 1-8.
Murali, M., Archa, M. R., Akhil, S. A., Liji, R. S., Kumar, S. S., Nair, A. M. and Kumar, N.
S. (2016). Preliminary phytochemical analysis of wheat grass leaf extracts.
International Journal of Pharmaceutical Sciences Review and Research. 40 (1), 307-
312.
Mythili, K., Reddy, C. U., Chamundeeswari, D. and Manna, P. K. (2014). Determination of
Total Phenol, Alkaloid, Flavonoid and Tannin in Different Extracts of Calanthe
Triplicata. J. of pharmacognsoy and phytochemistr 2(2), 40-44.
Narsih, H. Y. (2012). The study of germination and soaking time to improve nutritional
quality of sorghum seed. International Food Research Journal. 19 (4), 1429-1432.
Nikhal, S. B., Dambe, P. A., Ghongade, D. B. and Goupale, D. C. (2010). Hydroalcoholic
extraction of Mangifera indica (leaves) by Soxhletion. . International Journal of
Pharmaceutical Sciences. 2 (1), 30-32.
Norja, A. K., Wilhelmson, A. and Poutanen, K. (2004). Germination: a means to improve the
functionality of oat. Agricultural and Food Science. 13, 100-112.
Omojate, G. C., Enwa, F. Q., Jewo , A. O. and Eze, C. O. (2014). Mechanisms of
Antimicrobial Actions of Phytochemicals against Enteric Pathogens – A Review.
Journal of Pharmaceutical, Chemical and Biological Sciences. 2 (2), 77-85.
Pardeshi, I. L., Burbade, R. G. and Khod, R. N. (2013). Cost effective drying for high quality
tender wheatgrass powder. Journal of Food Research and Technology |. 1 (1), 1-10.
Patil, P. S. and Shettigar, R. (2010). An advancement of analytical techniques in herbal
research. J Adv Sci Res. 1 (1), 8-14.
Pinheiro, P. F. and Justino, G. C. (2012). "Structural Analysis of Flavonoids and Related
Compounds – A Review of Spectroscopic Applications". In Tech.
Pisoschi, A. M. and Negulescu, G. P. (2011). Methods for Total Antioxidant Activity
Determination: A Review. Biochemistry & Analytical Biochemistry. 1 (1), 1-10.
Podsedek, A. (2007). Natural antioxidants and antioxidant capacity of Brassica vegetables: A
review. LWT-Food Sci. Technol. 40, 1-11.
53
Podsedek, A., Sosnowska, D., Redzynia, M. and Koziolkiewicz, M. (2008). Effect of
domestic cooking on the red cabbage hydrophilic antioxidants. Int. J. Food Sci.
Technol. 43, 1770-1777.
Prochaska, L. J., Nguyen, X. T., Donat, N. and Piekutowski, W. V. (2000). Effects of food
processing on the thermodynamic and nutritive value of foods: literature and database
survey. Med. Hypotheses. 54, 254-262.
Rai, B. (2006). Natural Pigments in food:Chlorophyll. In: "Essentials of Food Chemistry".).
pp. 154-156. Dharan, Nepal.
Ramya, P., Bhasker, V., Saraswathi, D., Santhosh, K., Mounika, G. and Maloo, S. (2018).
Study on drying characteristics of vegetables. International Journal of Academic
Research and Development 3(2), 949-954.
Randhir, R., Lin, Y. and Shetty, K. (2004). Stimulation of phenolics, antioxidant and
antimicrobial activities in dark germinated mung bean sprouts in response to peptide
and phytochemical elicitors. Process Biochemistry. 39 (5), 637-646.
Rao, A. V. and Rao, L. G. (2007). Carotenoids and human health. Pharmacol. Pharmacol.
Res. 55, 207-216.
Rattanapon, R., Siripongvutikorn, S., Usawakesmanee, W. and Thongraung, C. (2017).
Changes of nutritional value, bioactive compounds and antioxidant activity of primed
white rice, Chainat 1, during seedling. International Food Research Journal. 24 (6),
2563-2571.
Rice-Evans, C. A. and Miller, N. J. (1996). Structure-antioxidant activity relationship of
flavonoids and phenolic acids. Free Radical Bioand Med. 20, 933-956.
Rodriguez-Amaya, D. B. (2003). "Food carotenoids: analysis, composition and alterations
during storage and processing of foods" (35-37 ed.). Vol. 56. Forum Nutr.
Saharan, K., Khetarpaul, N. and Bishnoi, S. (2002). Antinutrients and protein digestibility of
Faba bean and Rice bean as affected by soaking, dehulling and germination. Journal
of Food Science and Technology 39, 418-422.
Saxena, M., Saxena, J., Nema, R. and Singh, D. (2013). Phytochemistry of Medicinal Plants
J. of Pharmacognosy and Phytochem. 1 (6), 168-182.
Senhofa, S., Ķince, T., Galoburda, R., Cinkmanis, I., Sabovics, M. and Sturite, L. (2016).
Effects of germination on chemical composition of hull-less spring cereals. Research
for rural development. 1, 91-97.
Seymour, K. (2015). The neutraceutical garden: The grains & legumes component. 1-11.
Shahdev, R. K. (2014). Open sun and greenhouse drying of agricultural and food products: A
review. International journal of engineering research and technology. 3 (3), 1053-
1066.
Shaik, S. S., Carciofi, M., Martens, H. J., Hebelstrup, K. H. and Blennow, A. (2014). Starch
Bioengineering Affects Cereal Grain Germination and Seedling Establishment.
Journal of Experimental Botany. 65 (9), 2257-2270.

54
Sharma, S., Saxena, D. C. and Riar, C. S. (2016). Analysing the effect of germination on
phenolics, dietary fibres, minerals and γ-amino butyric acid contents of barnyard
millet (Echinochloa frumentaceae). Food Bioscience. 13 (1), 60-68.
Shimelis, E. A. and Rakshit, S. K. (2007). Effect of processing on antinutrients and in vitro
protein digestibility of kidney bean (Phaseolus vulgaris L.) varieties grown in East
Africa. Food Chemistry. 103, 161-172.
Singh, P. and Singh, S. (2016). Development of Wheat Grass Powder Prepared by Different
Drying Processes. International journal of health sciences and research. 6 (6), 291-
292.
Singh, R. (2015). Medicinal plants: a review. Journal of plant sciences. 3 (1-1), 50-55.
Singhlal, A., Kumari, S., Singh, R. R., Kumar, S. and Rajendran, N. (2012). Wheatgrass: An
alternative household nutritional food security. International research journal of
pharmacy. 3 (7), 246-250.
Sowjanya, K. D., Hariprasath, K., Nalini, G. R., Veenaeesh, P. and Ravichandra, S. (2015).
Wheat Grass Juice - Triticum aestivum Linn’ a therapeutic tool in pharmaceutical
research, an overview. International Journal of Pharmacy and Pharmaceutical
Research. 3 (3), 112-121.
Suriyavathana, M., Roopavathi, I. and Vijayan, V. (2016). Phytochemical characterization of
Triticum aestivum (Wheatgrass). Journal of Pharmacognosy and Phytochemistry. 5
(1), 283-286.
Suryanti, V., Marliyana, S. D. and Putri, H. E. (2016). Effect of germination on antioxidant
activity, total phenolics, β-carotene, ascorbic acid and α-tocopherol contents of lead
tree sprouts (Leucaena leucocephala (lmk.) de Wit). International Food Research
Journal. 23 (1), 167-172.
Tapas, A. R., Sakarkar, D. M. and Kakde, R. B. (2008). Flavonoids as nutraceuticals: A
review. Tropical J. of Pharm Res. 7 (3), 1089-1099
Thapa, B. K. (2010). On-farm management and quality assessment of farmers’ saved wheat
seed in the western Terai, Nepal. Agronomy Journal of Nepal. 1, 50-60.
Tiwari, P., Kumar, B., Kaur, H. and Kaur, G. (2011). Phytochemical screening and
Extraction: A Review Internationale Pharmaceutica Sciencia. 1 (1), 98-106.
Tsao, R., Khanizadeh, S. and Dale, A. (2006). Designer fruits and vegetables with enriched
phytochemicals for human health. Can. J. Plant Sci. 86: 773 786. . 86, 773-786.
Uchegbu, N. N. and Ndidi, A. F. (2015). Effect of germination on proximate, available
phenol and flavonoid content, and antioxidant activities of African yam bean
(Sphenostylis stenocarpa) International Journal of Nutrition and Food Engineering. 9
(1), 106-109.
Upadhyaya, K. and Ashok, P. A. (2012). Tannins are Astringent. Journal of Pharmacognosy
and Phytochemistry. 1 (3), 45-50.

55
Vallejo, F., Tomas-Barberan, F. A. and Garcia-Viguera, C. (2003). Phenolic compound
contents in edible parts of broccoli inflorescences after domestic cooking. J. Sci. Food
Agric. 83, 1511-1516.
Verma, P., Singh, N. and Pandey, B. R. (2012). Therapeutic Potential of Organic Triticum
aestivum Linn. (Wheat Grass) in Prevention and Treatment of Chronic Diseases: An
Overview. International Journal of Pharmaceutical Sciences and Drug Research. 4
(1), 10-14.
Vignoli, J. A., Bassoli, D. G. and Benassi, M. T. (2011). Antioxidant activity, polyphenols,
caffeine and melanoidins in soluble coffee: The influence of processing conditions
and raw material. . Food Chem. 124, 863-868.
Viskupicova, J., Ondrejovic, M. and Sturdik, E. (2008). Bioavailability and metabolism of
flavonoids. Journal of Food and Nutrition Research 47 (4), 151-162.
Vongsak, B., Mangmool, S. and and Sithisarn, P. (2013). Maximizing total phenolics, total
flavonoids contents and antioxidant activity of Moringa oleifera Leaf extract by the
appropriate extraction method. . Ind. Crops and Pdt. 44, 566-571.
Ward, J. L., Poutanen, K., Gebruers, K., Piironen, V., Lampi, A. M. and Nystrom, L. (2008).
The health grain cereal diversity screen: concept, results, and prospects. Journal of
Agricultural and Food Chemistry. 56 (21), 9699-9709.
Xu, Z., Zhang, G., Gao, Y., Huang, X., Zou, Y. and Yang, T. (2015). Effects of germination
on the nutritional properties, phenolic profiles, and antioxidant activities of
buckwheat. Journal of Food Science. 80 (5), 1-9.
Yang, F., Basu, T. K. and Ooraikul, B. (2001). Studies on germination conditions and
antioxidant content of wheatgrass. Int J Food Sci Nutr. 52, 319-330.
Ye, J. and Wen, B. (2017). Seed germination in relation to the invasiveness inspiny amaranth
and edible amaranth in Xishuangbanna, SWChina. 1-15.
Zhang, D. and Hamauzu, Y. (2004). Phenolics, ascorbic acid, carotenoids and antioxidant
activity of broccoli and their changes during conventional and microwave cooking.
Food Chem. 88, 503-509.

56
Appendices
Appendix A
SPECIMEN CARD FOR SENSORY EVALUTION
Hedonic rating test
Name of the panelist ………………….
Date ………………………..
Name of the product : Wheatgrass powder
Dear panelist, you have 5 sample of wheatgrass powder. Please taste the sample and score
how much you prefer the each one. Please give point for your degree of preference for each
parameter as shown below using the scale given.
Parameter A B C D
Color
Flavor
Taste
After taste
Overall
acceptability
Give points as follows:
Like extremely 9 Like slightly 6 Dislike moderately 3
Like very much 8 Neither like nor dislike 5 Dislike very much 2
Like moderately 7 Dislike slightly 4 Dislike extremely 1
Comment(if any)…………………………………………………………
Signature…………………

57
Appendix B
Table B.1 List of chemicals used
Chemicals Supplier/Manufacturer Other specifications
Sodium hydroxide (NaOH) Thermo fisher Scientific India Pvt.
Ltd.
Pellets, AR grade, 98%
Hydrochloric acid (HCl) Thermo Electron LLS India Pvt.
Ltd.
36%, LR grade
Sulphuric acid (H2SO4) Thermo fisher Scientific India Pvt.
Ltd.
97%, LR grade
Petroleum ether Merck life Pvt. Ltd. B.P. 60℃-80℃
Sodium Carbonate
(Na2CO3)
Qualigens fine chemicals 99.5%, LR grade
Methanol Merck life science Pvt. Ltd 99% Liquid
Sodium nitrate(NaNO3) Thermo Fischer scientific India,
Pvt. Ltd
98%
Aluminium chloride(AlCl3) S.D fine-chem Ltd 98% hygroscopic
Ferric chloride(FeCl3) Thermo Fischer scientific India,
Pvt. Ltd
96% anhydrous
Chloroform Merck life science Pvt. Ltd 99% Liquid
Folin-ciocalteu’s reagent Thermo Fischer scientific India,
Pvt. Ltd
Liquid
Acetic acid Thermo Fischer scientific India,
Pvt. Ltd
99% Liquid
Gallic acid - 99.5%
DPPH Himedia laboratories(India) Pvt.
Ltd
Amorphous

58
Table B.2 List of equipment used
S.N Physical apparatus Specification
1. Electric balance Phoenix instrument, 620g
2. Spectrophotometer Labtronics, India
3. Hot air oven Victolab, India
4. Incubator Victolab, India
5. Knives: Stainless steel knives were used for the purpose of cutting
6. Micropipette, pipette
7. Thermometer
8. Measuring cylinder
9. Refrigerator
10. Grinder
11. Glasswares (Beaker, Volumetric flask, Conical flask, Burette, Petri dish, Porcelain basin,
etc.)

59
Appendix C
Table C.1 Nutritional composition of wheatgrass (Triticum aestivum)
Basic Nutrients Minerals Vitamins
Calories: 21.0cal Iron: 0.61 mg Vitamin C: 3.64 mg
Water: 95 g Magnesium: 24 mg Vitamin A: 427 mg
Fat: 0.06 g Potassium: 147 mg Vitamin B1: 0.08mg
Carbohydrates: 2.0 g Zinc: 0.33 mg Vitamin B2: 0.13 mg
Dietary fiber: <0.1g Calcium: 24.2 mg Vitamin B3: 0.011 mg
Choline: 92.4 mg Selenium: <1ppm Vitamin B5:6.0 mg
Glucose: 0.80 g Phosphorous: 75.2 mg Vitamin B6:0.2 mg
Chlorophyll: 42.2 mg Sodium: 10.3 mg Vitamin B12: <1mcg
Source: (Sowjanya et al., 2015)
Table C.2 Dry amount of extract
Samples Day 6 Day 7 Day 8 Day 9 Day 10
Dry matter in 10ml (mg) 0.181 0.154 0.177 0.182 0.158
Table C.3 Absorbance reading (100 fold dilution)
Samples Abs for TPC Abs for TFC Abs for tannins
Day 6 0.464, 0.466. 0.465 0.002, 0.001, 0.001 0.009, 0.009, 0.008
Day 7 0.456, 0.458, 0.456 0.003, 0.002, 0.002 0.008, 0.007, 0.007
Day 8 0.556, 0.554, 0.555 0.004, 0.005, 0.004 0.007, 0.007, 0.006
Day 9 0.609, 0.606, 0.609 0.005, 0.006, 0.006 0.006, 0.005, 0.006
Day 10 0.581, 0.588, 0.587 0.005, 0.006, 0.007 0.005, 0.004, 0.004

60
Table C.4 Absorbance reading (100 fold dilution)
Samples Abs for AOA Abs for chl at 645 nm Abs for chl at 663 nm
Day 6 0.022, 0.02, 0.023 0.253, 0.254, 0.256 0.401, 0.404, 0.410
Day 7 0.017, 0.018, 0.017 0.280, 0.283, 0.282 0.410, 0.406, 0.401
Day 8 0.015, 0.013, 0.014 0.309, 0.311, 0.313 0.572, 0.577, 0.573
Day 9 0.010, 0.011, 0.011 0.238, 0233, 0.239 0.315, 0.320, 0.325
Day 10 0.009, 0.008, 0.006 0.151, 0.149, 0.157 0.294, 0.292, 0.289
Table C.5 Temperature and Relative Humidity during germination of wheat
Sample Room temperature (°C) Water temperature (°C) Relative Humidity (%)
Day 1 24.5 24.4 71
Day 2 24.5 24.9 68
Day 3 23.5 24.3 65
Day 4 24.5 25.1 69
Day 5 25.5 25.6 62
Day 6 24.9 24.3 62
Day 7 25.5 25.2 62
Day 8 25.5 24.8 64
Day 9 24.9 24.9 61
Day 10 25.1 24.9 65
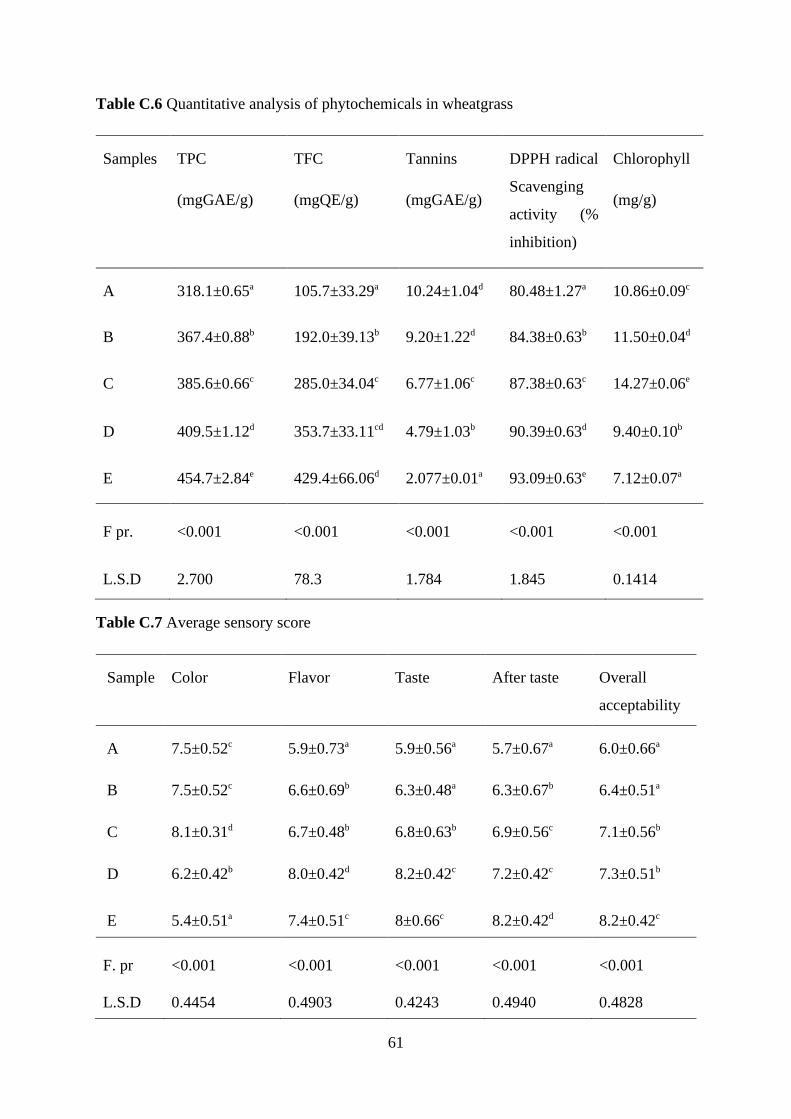
61
Table C.6 Quantitative analysis of phytochemicals in wheatgrass
Samples TPC
(mgGAE/g)
TFC
(mgQE/g)
Tannins
(mgGAE/g)
DPPH radical
Scavenging
activity (%
inhibition)
Chlorophyll
(mg/g)
A 318.1±0.65a 105.7±33.29a 10.24±1.04d 80.48±1.27a 10.86±0.09c
B 367.4±0.88b 192.0±39.13b 9.20±1.22d 84.38±0.63b 11.50±0.04d
C 385.6±0.66c 285.0±34.04c 6.77±1.06c 87.38±0.63c 14.27±0.06e
D 409.5±1.12d 353.7±33.11cd 4.79±1.03b 90.39±0.63d 9.40±0.10b
E 454.7±2.84e 429.4±66.06d 2.077±0.01a 93.09±0.63e 7.12±0.07a
F pr.
<0.001
<0.001
<0.001
<0.001
<0.001
L.S.D
2.700
78.3
1.784
1.845
0.1414
Table C.7 Average sensory score
Sample Color Flavor Taste After taste Overall
acceptability
A 7.5±0.52c 5.9±0.73a 5.9±0.56a 5.7±0.67a 6.0±0.66a
B 7.5±0.52c 6.6±0.69b 6.3±0.48a 6.3±0.67b 6.4±0.51a
C 8.1±0.31d 6.7±0.48b 6.8±0.63b 6.9±0.56c 7.1±0.56b
D 6.2±0.42b 8.0±0.42d 8.2±0.42c 7.2±0.42c 7.3±0.51b
E
5.4±0.51a
7.4±0.51c
8±0.66c
8.2±0.42d
8.2±0.42c
F. pr
<0.001
<0.001
<0.001
<0.001
<0.001
L.S.D
0.4454
0.4903
0.4243
0.4940
0.4828

62
Appendix D
Standard curve of Gallic acid for phenol
Fig D.1 Gallic acid standard curve
y = 8.4333x - 0.0205
R² = 0.9902
0
0.1
0.2
0.3
0.4
0.5
0.6
0.7
0.8
0.9
1
0 0.02 0.04 0.06 0.08 0.1 0.12
Abso
rban
ce
Concentration µg/ml
abs
Linear (abs)

63
Standard curve of quercetin for flavonoid
Fig D.2 Quercetin standard curve
y = 0.0958x - 0.0005
R² = 0.9749
0
0.002
0.004
0.006
0.008
0.01
0.012
0 0.02 0.04 0.06 0.08 0.1 0.12
Abso
rban
ce
Concentration µg/ml
abs
Linear (abs)

64
Standard curve of Gallic acid for tannin
Fig D.3 Tannin standard curve
y = 3.0564x + 0.003
R² = 0.9482
0
0.05
0.1
0.15
0.2
0.25
0.3
0.35
0 0.02 0.04 0.06 0.08 0.1 0.12
Abso
rban
ce
Concentration (µg/ml)
abs Linear (abs)

65
Appendix E
Table E.1 One way ANOVA(no blocking) for total phenol content
Source of variation d.f. s.s. m.s. v.r. F pr.
Sample 4 30671.831 7667.958 3480.44 <.001
Residual 10 22.032 2.203
Total 14 30693.862
Table E.2 Least significant differences of means (5% level) for total phenol content
Table Rep d. f. L.S.D.
Sample 3 10 2.7
Table E.3 One way ANOVA(no blocking) for Flavonoid content
Source of variation d.f. s.s. m.s. v.r. F pr.
Sample 4 196970 49243 26.59 <.001
Residual 10 18521 1852
Total 14 215492
Table E.4 Least significant differences of means (5% level) for flavonoid content
Table Rep d. f. L.S.D
Sample 3 10 78.3

66
Table E.5 One way ANOVA(no blocking) for Tannin content
Source of variation d.f. s.s. m.s. v.r. F pr.
Sample 4 131.4563 32.8641 34.16 <.001
Residual 10 9.6202 0.9620
Total 14 141.0765
Table E.6 Least significant differences of means (5% level) for tannin content
Table Rep d. f. L.S.D
Sample 3 10 1.784
Table E.7 One way ANOVA(no blocking) for DPPH radical scavenging activity
Source of variation d.f. s.s. m.s. v.r. F pr.
Sample 4 219.3545 54.8386 92.14 <.001
Residual 10 5.9519 0.5952
Total 14 225.3064
Table E.8 Least significant differences of means (5% level) for DPPH radical scavenging
activity
Table Rep d. f. L.S.D.
Sample 3 10 1.845

67
Table E.9 One way ANOVA(no blocking) for Chlorophyll
Source of variation d.f. s.s. m.s. v.r. F pr.
Sample 4 43.0240 10.7560 11.23 <.001
Residual 10 9.5767 0.9577
Total 14 52.6008
Table E.10 Least significant differences of means (5% level) for Chlorophyll
Table Rep d. f. L.S.D.
Sample 3 10 0.1414
Table E.11 Two way ANOVA(no blocking) for Color
Source of variation d.f. s.s. m.s. v.r. F pr.
Sample 4 48.9200 12.2300 50.72 <.001
Panelist 9 1.2200 0.1356 0.56 0.818
Residual 36 8.6800 0.2411
Total 49 58.8200
Table E.12 Least significant differences of means (5% level) for color
Table Rep d.f. L.S.D
Sample 10 36 0.4454
Panelist 5 36 0.6298

68
Table E.13 Two way ANOVA(no blocking) for Flavor
Source of variation d.f. s.s. m.s. v.r. F pr.
Sample 4 25.8800 6.4700 22.14 <.001
Panelist 9 7.2800 0.8089 2.77 0.014
Residual 36 10.5200 0.2922
Total 49 43.6800
Table E.14 Least significant differences of means (5% level) for flavor
Table Rep d.f. L.S.D
Sample 10 36 0.4903
Panelist 5 36 0.6934
Table E.15 Two way ANOVA(no blocking) for Taste
Source of variation d.f. s.s. m.s. v.r. F pr.
Sample 4 41.7200 10.4300 47.65 <.001
Panelist 9 6.3200 0.7022 3.21 0.006
Residual 36 7.8800 0.2189
Total 49 55.9200

69
Table E.16 Least significant differences of means (5% level) for taste
Table Rep d.f. L.S.D
Sample 10 36 0.4243
Panelist 5 36 0.6001
Table E.17 Two way ANOVA(no blocking) for After taste
Source of variation d.f. s.s. m.s. v.r. F pr.
Sample 4 35.7200 8.9300 30.10 <.001
Panelist 9 3.6200 0.4022 1.36 0.244
Residual 36 10.6800 0.2967
Total 49 50.0200
Table E.18 Least significant differences of means (5% level) for After taste
Table Rep d.f. L.S.D
Sample 10 36 0.4940
Panelist 5 36 0.6986

70
Table E.19 Two way ANOVA (no blocking) for overall acceptability
Source of variation d.f. s.s. m.s. v.r. F pr.
Sample 4 29.00 7.2500 25.59 <.001
Panelist 9 2.80 0.3111 1.10 0.389
Residual 36 10.20 0.2833
Total 49 42.00
Table E.20 Least significant differences of means (5% level) for overall acceptability
Table Rep d.f. L.S.D
Sample 10 36 0.4940
Panelist 5 36 0.6986

71
Color plates
P1 Growing of wheatgrass P2 Wheatgrass powder
P3: Absorbance reading P4: Sensory analysis