Embed Size (px)
Citation preview
International Journal of Computer Applications (0975 – 8887)
Volume 116 – No. 9, April 2015
1
Effect of Glottal Excitation Interchange in Hindi and
Dogri Languages
Sonika Mahajan Deptt of ECE, NITTTR
Chandigarh, India
Rajesh Mehra Deptt of ECE, NITTTR
Chandigarh, India
Parveen K. Lehana Department of Electronics University of Jammu, India
ABSTRACT
Voice acoustics is an active area of research which studies
speaking voice and has gain popularity due to rapid
advancements in digital signal processing. The shape of
glottal excitation and the vocal tract may be speaker and
language dependent. The objective of this paper is to study the
effect of glottal excitation interchange on the quality and
intelligibility in Hindi and Dogri languages. For this,
recordings of six speakers (3 males and 3 females) were
carried out in Dogri and Hindi languages. Cardinal vowels
(/a/, /i/, /u/) were extracted from recordings of each speaker.
Investigations were carried out by interchanging the glottal
excitations corresponding to the vowels in the two languages
for each speaker. The analysis of the results showed that
interchange of excitation does not provide satisfactory quality
of the synthesized speech in terms of identity and clarity of
speech. Further, the synthesized speech is perceived as it was
spoken in the original language. It was also observed that if
any two of the parameters (excitation, gain, vocal tract LPC
coefficients) are interchanged, the accent of the original
language also changes. It means that minimum two of the
three parameters are necessary to interchange for modifying
the accent of the language under consideration.
General Terms
Speech production, Linear predictive coding, LPC,
Synthesizer
Keywords
LPC Component, vocal tract parameters, glottal source, glottal
gain
1. INTRODUCTION Speech is one of the most dominating and natural means of
communication to express thoughts, ideas, and emotions
among individuals [1]. Speech is a complicated signal,
naturally produced by human beings, because various
processes are involved in the generation of speech signal.
Because of the involvement of several complicated processes,
verbal communication may be modified extensively in terms
of accent, pronunciation, articulation, nasality, pitch, volume,
and speed [2]. Various anatomical articulators work in a
synchronized manner for generating the meaningful speech.
Slight variations in the movement of tongue, can directly
affect the speech produced [3]. It is common to think of
speech as involving two separate processes. The first one
produces an initial sound called the excitation and the other
one modifies it further due to change of the configuration of
the vocal tract, which works as a filter. Speech is a sensation
of air pressure vibrations produced by air exhaled from the
lungs, modulated by the glottal cords, and filtered by the vocal
tract. Speech has a rich and multilayered temporal spectral
content encoding expression, accent, speaker identity, gender
and age of the speaker. Speech may be broadly divided in to
voiced and unvoiced segments. Voiced segments are produced
because of the vibrations of the vocal folds. If the vocal folds
do not vibrate, unvoiced segments in the speech are produced.
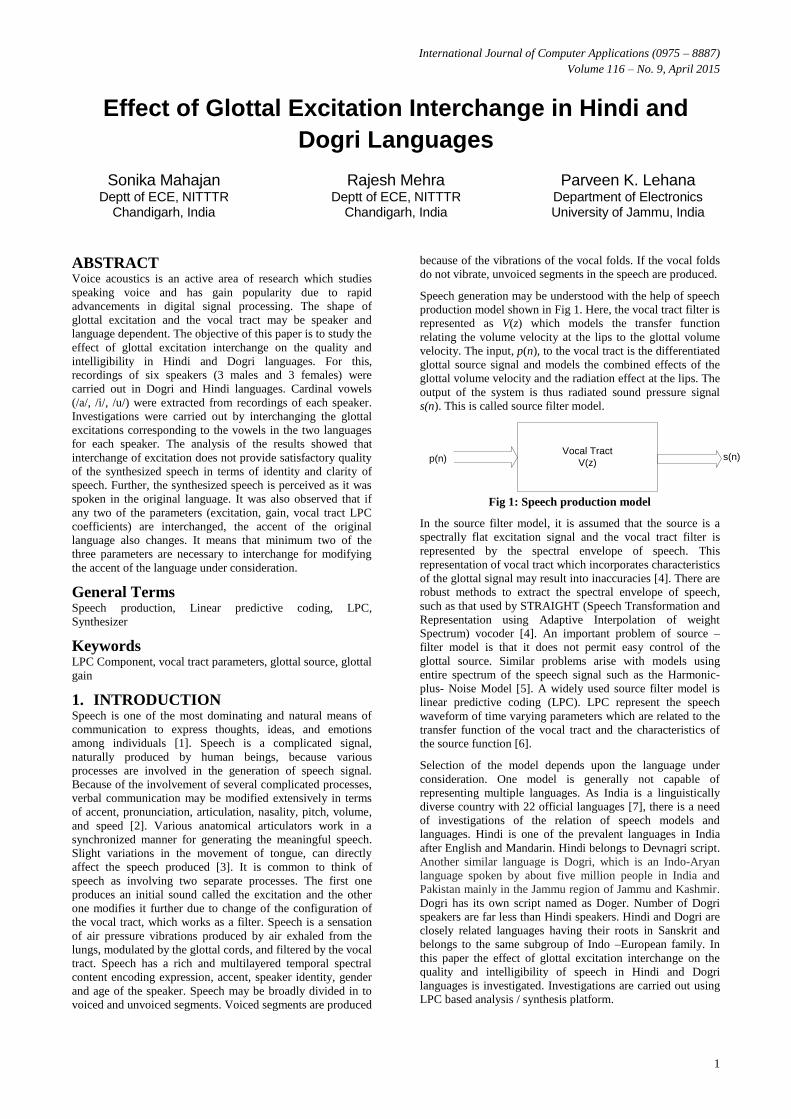
Speech generation may be understood with the help of speech
production model shown in Fig 1. Here, the vocal tract filter is
represented as V(z) which models the transfer function
relating the volume velocity at the lips to the glottal volume
velocity. The input, p(n), to the vocal tract is the differentiated
glottal source signal and models the combined effects of the
glottal volume velocity and the radiation effect at the lips. The
output of the system is thus radiated sound pressure signal
s(n). This is called source filter model.
Vocal Tract
V(z)p(n) s(n)
Fig 1: Speech production model
In the source filter model, it is assumed that the source is a
spectrally flat excitation signal and the vocal tract filter is
represented by the spectral envelope of speech. This
representation of vocal tract which incorporates characteristics
of the glottal signal may result into inaccuracies [4]. There are
robust methods to extract the spectral envelope of speech,
such as that used by STRAIGHT (Speech Transformation and
Representation using Adaptive Interpolation of weight
Spectrum) vocoder [4]. An important problem of source –
filter model is that it does not permit easy control of the
glottal source. Similar problems arise with models using
entire spectrum of the speech signal such as the Harmonic-
plus- Noise Model [5]. A widely used source filter model is
linear predictive coding (LPC). LPC represent the speech
waveform of time varying parameters which are related to the
transfer function of the vocal tract and the characteristics of
the source function [6].
Selection of the model depends upon the language under
consideration. One model is generally not capable of
representing multiple languages. As India is a linguistically
diverse country with 22 official languages [7], there is a need
of investigations of the relation of speech models and
languages. Hindi is one of the prevalent languages in India
after English and Mandarin. Hindi belongs to Devnagri script.
Another similar language is Dogri, which is an Indo-Aryan
language spoken by about five million people in India and
Pakistan mainly in the Jammu region of Jammu and Kashmir.
Dogri has its own script named as Doger. Number of Dogri
speakers are far less than Hindi speakers. Hindi and Dogri are
closely related languages having their roots in Sanskrit and
belongs to the same subgroup of Indo –European family. In
this paper the effect of glottal excitation interchange on the
quality and intelligibility of speech in Hindi and Dogri
languages is investigated. Investigations are carried out using
LPC based analysis / synthesis platform.

International Journal of Computer Applications (0975 – 8887)
Volume 116 – No. 9, April 2015
2
2. LINEAR PREDICTIVE CODING Linear predictive coding (LPC) is widely used in speech
synthesis and is capable of producing synthetic speech of high
quality. LPC provides extremely accurate estimates of speech
parameters. It is used for the extraction of the spectral
envelope of speech in compact form [8]. The basic idea of
LPC is that the current speech sample may be approximated
as a linear combination of
few past samples [9] [10].
(i)
where ρ is called the order and αk’s the LPC coefficients.
Fig. 2: Block diagram of an LPC synthesizer
A LPC based speech synthesizer is shown in Fig 2. The time
varying all-pole digital filter, H(z), is excited by periodic
pulses for voiced speech and by white noise for unvoiced
speech. The output of the filter H(z) after appropriate digital
to analog conversion and low pass filtering constitutes the
synthetic speech signal. The predictor coefficients (αk’s) are
determined by minimizing the sum of squared differences
between the actual speech samples and the linearly predicted.
3. METHODOLOGY For the analysis and synthesis of the speech signal, speech of
six speakers (3 males and 3 females) was recorded for
sentences written in Hindi and Dogri languages at 16 kHz
sampling frequency and 16 bit quantization in an acoustically
treated room using Sony ICD-AX-412 digital flash memory
voice recorder. The speakers were able to speak fluently both
Hindi and Dogri languages. Further, the speakers belonged to
same age group. After recording, the speech was segmented
manually and vowels (/a/, /i/, /u/) were extracted and
investigations were conducted using four experiments.
Experiment I was conducted for Hindi without any parameter
modification. Similarly, Experiment II was conducted using
Dogri without parameter modification.In Experiment III,
glottal excitation was interchanged with excitation extracted
from Dogri vowels. In Experiment IV, glottal excitation was
interchanged with excitation from Hindi.
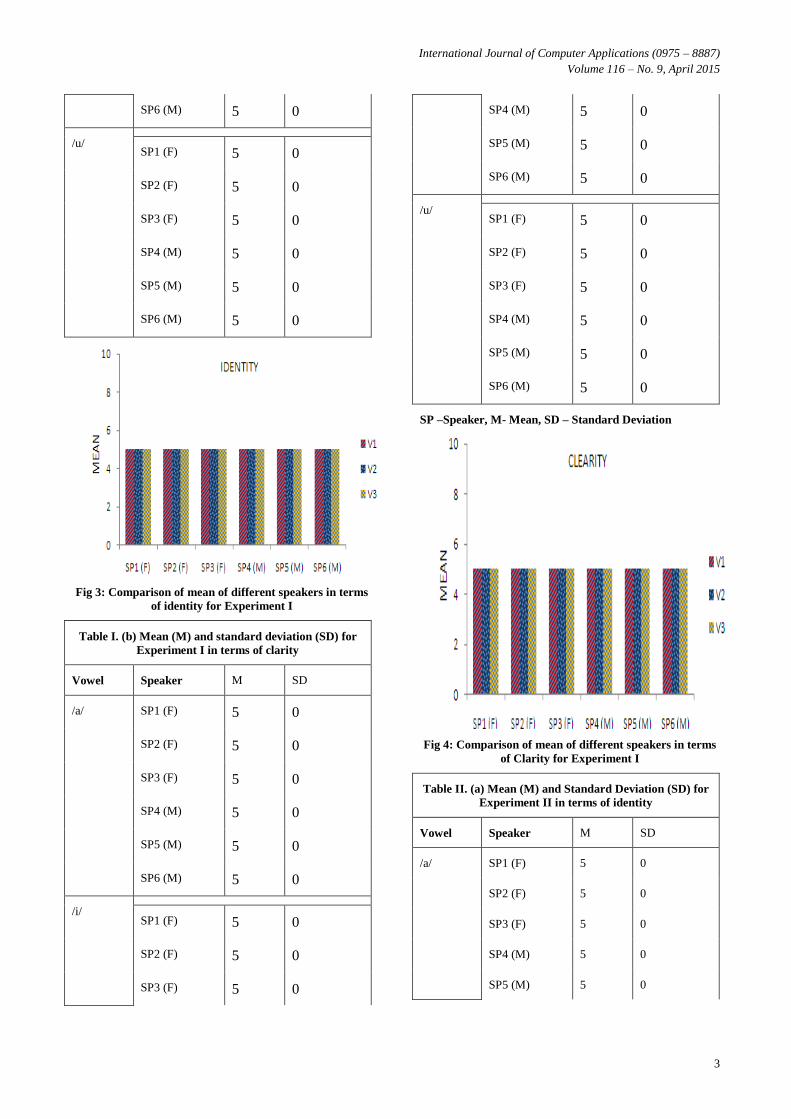
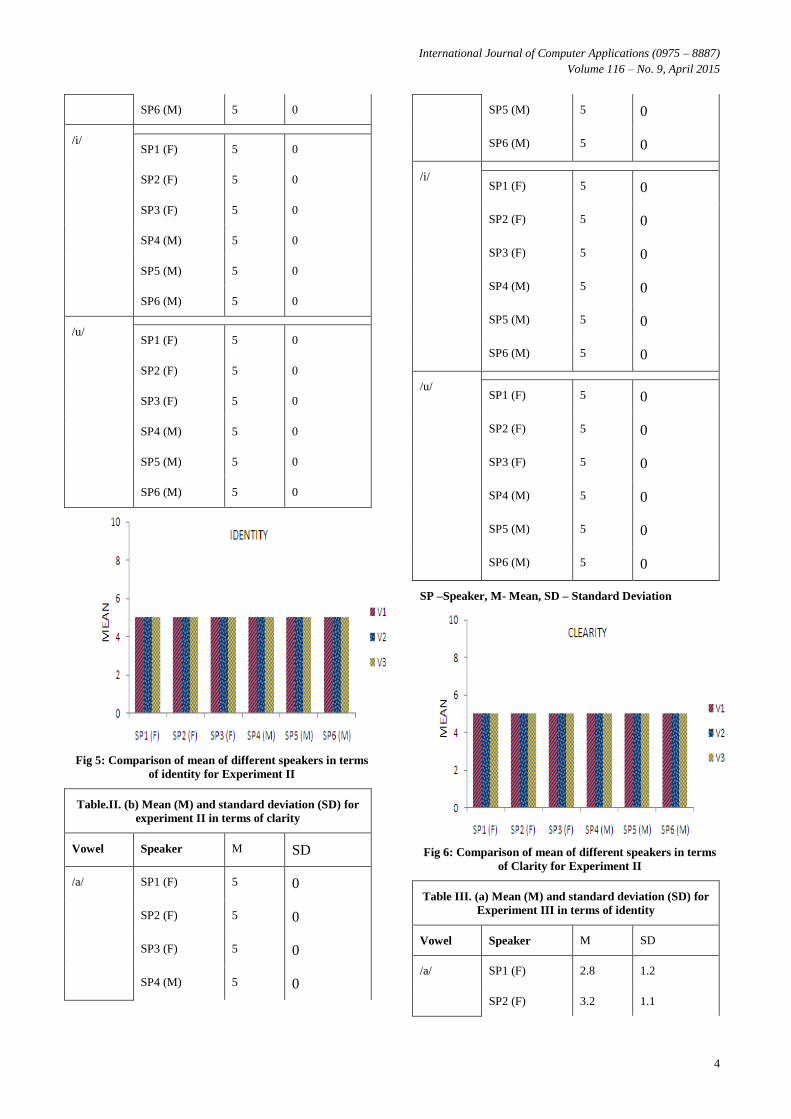
4. RESULTS AND DISCUSSIONS Identity and clarity of each speaker for Experiments I is
shown in Table I(a) and Table I(b) respectively. Similarly
Identity and Clarity of each speaker for Experiments II is
shown in Table II(a) and Table II(b) respectively. Identity and
Clarity of each speaker for Experiments III is shown in Table
III(a) and Table III(b) respectively. Identity and Clarity of
each speaker for Experiments IV is shown in Table IV(a) and
Table IV(b) respectively. All of these experiments are
conducted separately for each of the three vowels (/a/, /i/, /u/).
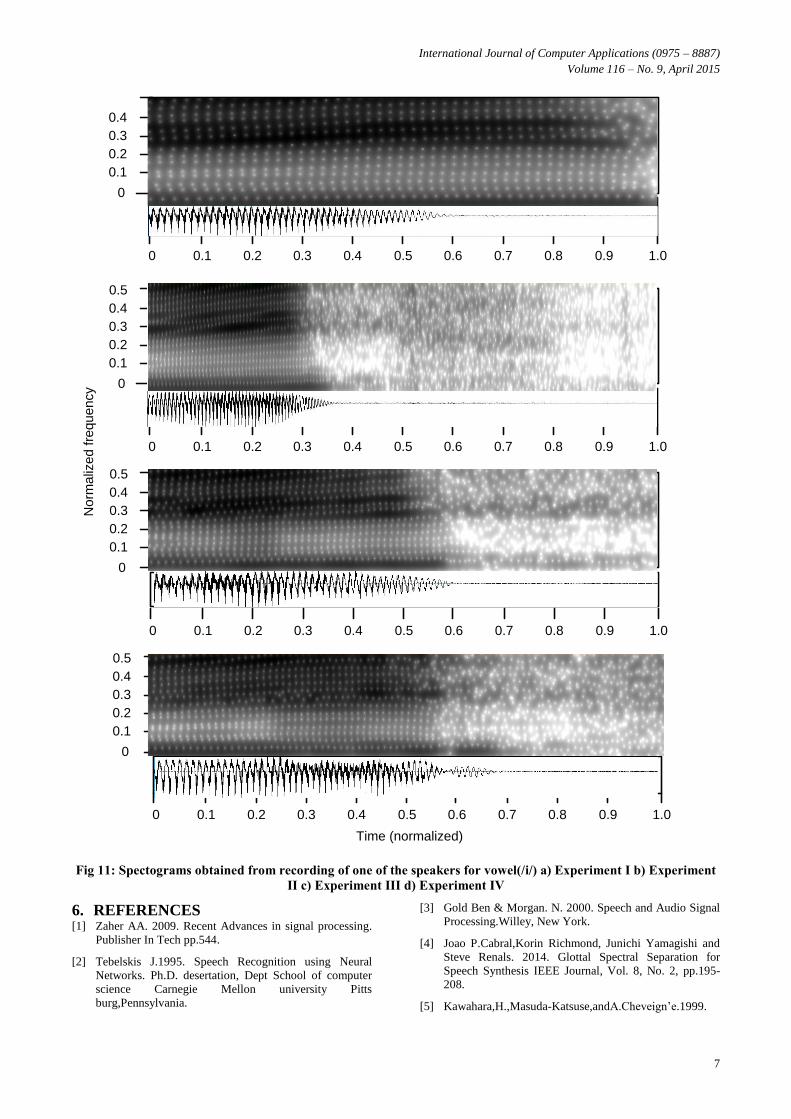
Histograms and spectrograms are also shown corresponding
to these Experiments, for each of the three vowels. Mean (M)
and Standard Deviation (SD) values are calculated using the
observations of six listeners. It can be seen from the Mean
values of Table I(a), Table I(b), Table II(a), Table II(b) that
the clarity and identity of all the speakers is almost same as
the original voice of the speakers. It can be seen from the
Mean values of Table III(a), Table III(b), Table IV(a), Table
IV(b), where glottal excitation is interchanged in Hindi and
Dogri, that both the identity and clarity results of speakers are
poor and unsatisfactory as in comparison with Experiments I
and II. Similar observations can be done from the histograms.
5. CONCLUSION The investigations were carried out to study the effect of
glottal excitation interchange in Hindi and Dogri languages on
the intelligibility and quality of the synthesized speech for
three cardinal vowels using four experiments. The analysis of
the results showed that LPC is able to synthesize Hindi and
Dogri vowels with high quality, Table IV (b) Mean (M) and
standard deviation (SD) values for experiment 4 in terms of
clarity if the parameters are not modified. Interchange of
excitation result in degradation of the quality and
intelligibility. It was also observed that introduction of accent
requires atleast two parameters interchange.
Table I (a) Mean (M) and standard deviation (SD) for
Experiment I in terms of identity
Vowel Speaker M SD
/a/ SP1 (F) 5 0
SP2 (F) 5 0
SP3 (F) 5 0
SP4 (M) 5 0
SP5 (M) 5 0
SP6 (M) 5 0
/i/ SP1 (F) 5 0
SP2 (F) 5 0
SP3 (F) 5 0
SP4 (M) 5 0
SP5 (M) 5 0
1
( ) ( )k
k
s n s n k
x
Pitch
Period
Impulse
Train
Generator
Random
Noise
Generator
Voiced/
Unvoiced
Switch
Time-
Varying
Digital Filter
G
U(n)
H(z)
S(n)
Vocal
Tract
International Journal of Computer Applications (0975 – 8887)
Volume 116 – No. 9, April 2015
3
SP6 (M) 5 0
/u/ SP1 (F) 5 0
SP2 (F) 5 0
SP3 (F) 5 0
SP4 (M) 5 0
SP5 (M) 5 0
SP6 (M) 5 0
Fig 3: Comparison of mean of different speakers in terms
of identity for Experiment I
Table I. (b) Mean (M) and standard deviation (SD) for
Experiment I in terms of clarity
Vowel Speaker M SD
/a/ SP1 (F) 5 0
SP2 (F) 5 0
SP3 (F) 5 0
SP4 (M) 5 0
SP5 (M) 5 0
SP6 (M) 5 0
/i/ SP1 (F) 5 0
SP2 (F) 5 0
SP3 (F) 5 0
SP4 (M) 5 0
SP5 (M) 5 0
SP6 (M) 5 0
/u/ SP1 (F) 5 0
SP2 (F) 5 0
SP3 (F) 5 0
SP4 (M) 5 0
SP5 (M) 5 0
SP6 (M) 5 0
SP –Speaker, M- Mean, SD – Standard Deviation
Fig 4: Comparison of mean of different speakers in terms
of Clarity for Experiment I
Table II. (a) Mean (M) and Standard Deviation (SD) for
Experiment II in terms of identity
Vowel Speaker M SD
/a/ SP1 (F) 5 0
SP2 (F) 5 0
SP3 (F) 5 0
SP4 (M) 5 0
SP5 (M) 5 0
International Journal of Computer Applications (0975 – 8887)
Volume 116 – No. 9, April 2015
4
SP6 (M) 5 0
/i/ SP1 (F) 5 0
SP2 (F) 5 0
SP3 (F) 5 0
SP4 (M) 5 0
SP5 (M) 5 0
SP6 (M) 5 0
/u/ SP1 (F) 5 0
SP2 (F) 5 0
SP3 (F) 5 0
SP4 (M) 5 0
SP5 (M) 5 0
SP6 (M) 5 0
Fig 5: Comparison of mean of different speakers in terms
of identity for Experiment II
Table.II. (b) Mean (M) and standard deviation (SD) for
experiment II in terms of clarity
Vowel Speaker M SD
/a/ SP1 (F) 5 0
SP2 (F) 5 0
SP3 (F) 5 0
SP4 (M) 5 0
SP5 (M) 5 0
SP6 (M) 5 0
/i/ SP1 (F) 5 0
SP2 (F) 5 0
SP3 (F) 5 0
SP4 (M) 5 0
SP5 (M) 5 0
SP6 (M) 5 0
/u/ SP1 (F) 5 0
SP2 (F) 5 0
SP3 (F) 5 0
SP4 (M) 5 0
SP5 (M) 5 0
SP6 (M) 5 0
SP –Speaker, M- Mean, SD – Standard Deviation
Fig 6: Comparison of mean of different speakers in terms
of Clarity for Experiment II
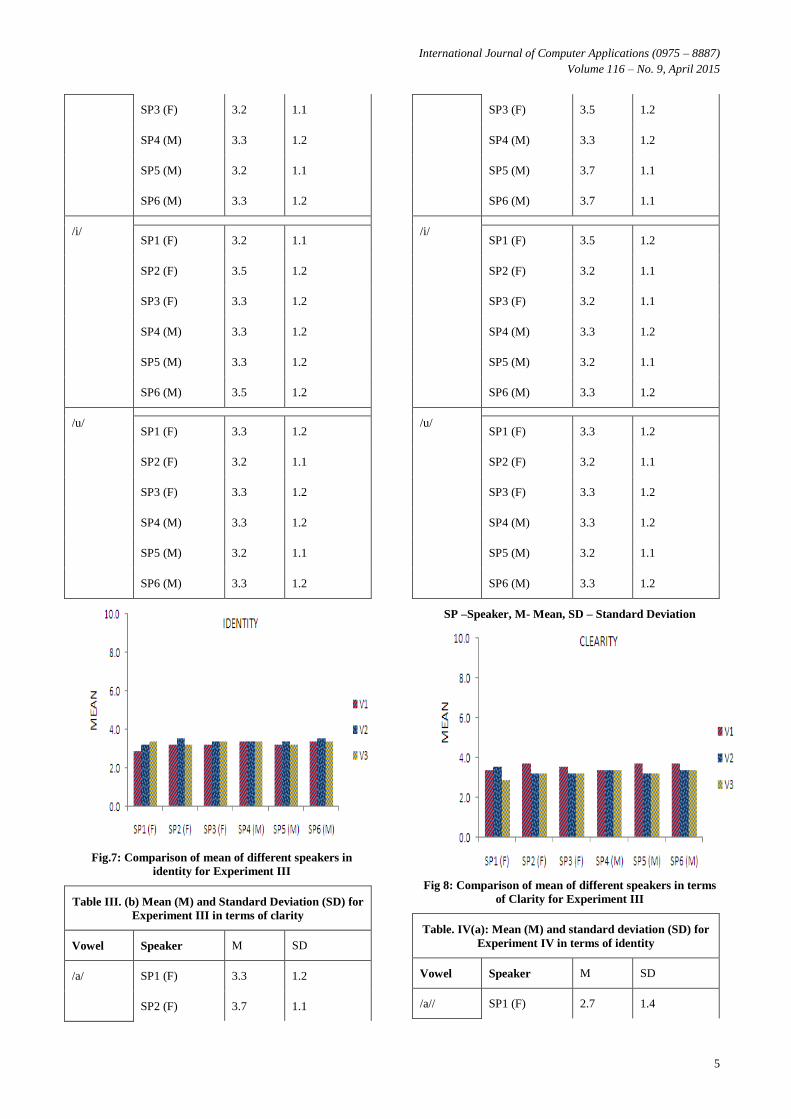
Table III. (a) Mean (M) and standard deviation (SD) for
Experiment III in terms of identity
Vowel Speaker M SD
/a/ SP1 (F) 2.8 1.2
SP2 (F) 3.2 1.1
International Journal of Computer Applications (0975 – 8887)
Volume 116 – No. 9, April 2015
5
SP3 (F) 3.2 1.1
SP4 (M) 3.3 1.2
SP5 (M) 3.2 1.1
SP6 (M) 3.3 1.2
/i/ SP1 (F) 3.2 1.1
SP2 (F) 3.5 1.2
SP3 (F) 3.3 1.2
SP4 (M) 3.3 1.2
SP5 (M) 3.3 1.2
SP6 (M) 3.5 1.2
/u/ SP1 (F) 3.3 1.2
SP2 (F) 3.2 1.1
SP3 (F) 3.3 1.2
SP4 (M) 3.3 1.2
SP5 (M) 3.2 1.1
SP6 (M) 3.3 1.2
Fig.7: Comparison of mean of different speakers in
identity for Experiment III
Table III. (b) Mean (M) and Standard Deviation (SD) for
Experiment III in terms of clarity
Vowel Speaker M SD
/a/ SP1 (F) 3.3 1.2
SP2 (F) 3.7 1.1
SP3 (F) 3.5 1.2
SP4 (M) 3.3 1.2
SP5 (M) 3.7 1.1
SP6 (M) 3.7 1.1
/i/ SP1 (F) 3.5 1.2
SP2 (F) 3.2 1.1
SP3 (F) 3.2 1.1
SP4 (M) 3.3 1.2
SP5 (M) 3.2 1.1
SP6 (M) 3.3 1.2
/u/ SP1 (F) 3.3 1.2
SP2 (F) 3.2 1.1
SP3 (F) 3.3 1.2
SP4 (M) 3.3 1.2
SP5 (M) 3.2 1.1
SP6 (M) 3.3 1.2
SP –Speaker, M- Mean, SD – Standard Deviation
Fig 8: Comparison of mean of different speakers in terms
of Clarity for Experiment III
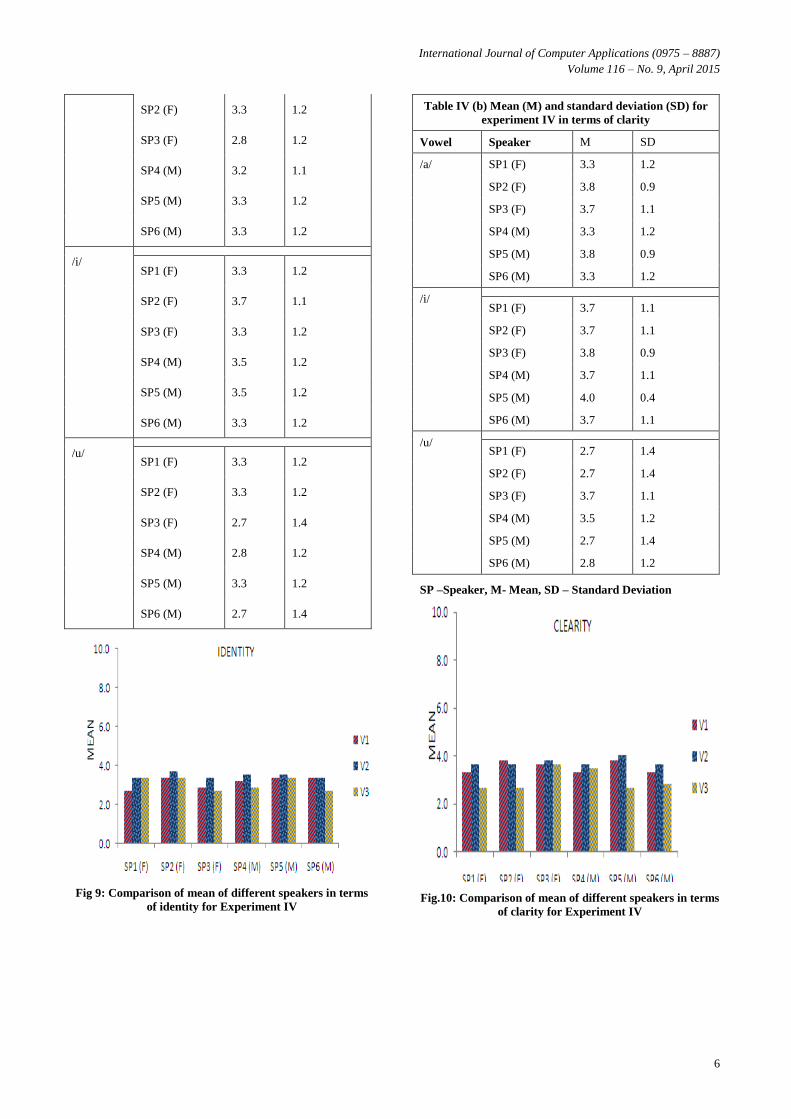
Table. IV(a): Mean (M) and standard deviation (SD) for
Experiment IV in terms of identity
Vowel Speaker M SD
/a// SP1 (F) 2.7 1.4
International Journal of Computer Applications (0975 – 8887)
Volume 116 – No. 9, April 2015
6
SP2 (F) 3.3 1.2
SP3 (F) 2.8 1.2
SP4 (M) 3.2 1.1
SP5 (M) 3.3 1.2
SP6 (M) 3.3 1.2
/i/ SP1 (F) 3.3 1.2
SP2 (F) 3.7 1.1
SP3 (F) 3.3 1.2
SP4 (M) 3.5 1.2
SP5 (M) 3.5 1.2
SP6 (M) 3.3 1.2
/u/ SP1 (F) 3.3 1.2
SP2 (F) 3.3 1.2
SP3 (F) 2.7 1.4
SP4 (M) 2.8 1.2
SP5 (M) 3.3 1.2
SP6 (M) 2.7 1.4
Fig 9: Comparison of mean of different speakers in terms
of identity for Experiment IV
Table IV (b) Mean (M) and standard deviation (SD) for
experiment IV in terms of clarity
Vowel Speaker M SD
/a/ SP1 (F) 3.3 1.2
SP2 (F) 3.8 0.9
SP3 (F) 3.7 1.1
SP4 (M) 3.3 1.2
SP5 (M) 3.8 0.9
SP6 (M) 3.3 1.2
/i/ SP1 (F) 3.7 1.1
SP2 (F) 3.7 1.1
SP3 (F) 3.8 0.9
SP4 (M) 3.7 1.1
SP5 (M) 4.0 0.4
SP6 (M) 3.7 1.1
/u/ SP1 (F) 2.7 1.4
SP2 (F) 2.7 1.4
SP3 (F) 3.7 1.1
SP4 (M) 3.5 1.2
SP5 (M) 2.7 1.4
SP6 (M) 2.8 1.2
SP –Speaker, M- Mean, SD – Standard Deviation
Fig.10: Comparison of mean of different speakers in terms
of clarity for Experiment IV
International Journal of Computer Applications (0975 – 8887)
Volume 116 – No. 9, April 2015
7
0 0.1 0.2 0.3 0.4 0.5 0.6 0.7 0.8 0.9 1.0
0
0.1
0.2
0.3
0.4
0 0.1 0.2 0.3 0.4 0.5 0.6 0.7 0.8 0.9 1.0
0
0.1
0.2
0.3
0.4
0.5
0 0.1 0.2 0.3 0.4 0.5 0.6 0.7 0.8 0.9 1.0
0
0.1
0.2
0.3
0.4
0.5
0 0.1 0.2 0.3 0.4 0.5 0.6 0.7 0.8 0.9 1.0
0
0.1
0.2
0.3
0.4
0.5
Time (normalized)
No
rma
lize
d fre
qu
en
cy
Fig 11: Spectograms obtained from recording of one of the speakers for vowel(/i/) a) Experiment I b) Experiment
II c) Experiment III d) Experiment IV
6. REFERENCES [1] Zaher AA. 2009. Recent Advances in signal processing.
Publisher In Tech pp.544.
[2] Tebelskis J.1995. Speech Recognition using Neural
Networks. Ph.D. desertation, Dept School of computer
science Carnegie Mellon university Pitts
burg,Pennsylvania.
[3] Gold Ben & Morgan. N. 2000. Speech and Audio Signal
Processing.Willey, New York.
[4] Joao P.Cabral,Korin Richmond, Junichi Yamagishi and
Steve Renals. 2014. Glottal Spectral Separation for
Speech Synthesis IEEE Journal, Vol. 8, No. 2, pp.195-
208.
[5] Kawahara,H.,Masuda-Katsuse,andA.Cheveign’e.1999.
International Journal of Computer Applications (0975 – 8887)
Volume 116 – No. 9, April 2015
8
Restructuring speech representations using a pitch –
adaptive time- frequency smoothing and an
instantaneous-frequency-based F0 Extraction :Possible
role of a repetitive structure in sounds Speech
Commun.,vol.27, no. 3-4, pp.187-207.
[6] Rulph Chassaing and Donald Reay. 2008. Digital Signal
Processing and Applications with C6713 and C6416
DSK, 2ndEdition Wiley Inter Science Pub, London,
IEEE PRESS.
[7] Dubey Preeti Pathania Shashi & Devanand. 2011.
Comparative study Hindi and Dogri languages with
regard to machine translation language in India. Vol.11,
pp.298-309.
[8] Padmini Rajput & ParveenLehana. 2013. Investigations
of the Distributions of Phonemic Durations in Hindi and
Dogri.IJNLC Vol. 2, No.1, pp. 17-30.
[9] Ananthapadmanabha T.V. and B.Yegnarayanana. 1979.
Epoch extraction from linear prediction residual for
identification of closed glottis interval. IEEE
Transactions on Acoustics, Speech, and Signal
Processing, 27(4):309-319.
[10] Comeliu Octavian DUMITRU, Inge GAVAT. 2006.A
Comparative Study of Feature Extraction Methods
Applied to Continuous Speech Recognition in Romanian
language.48thInternational Symposium, Zadar,Croatia.
IJCATM : www.ijcaonline.org