Embed Size (px)
Citation preview
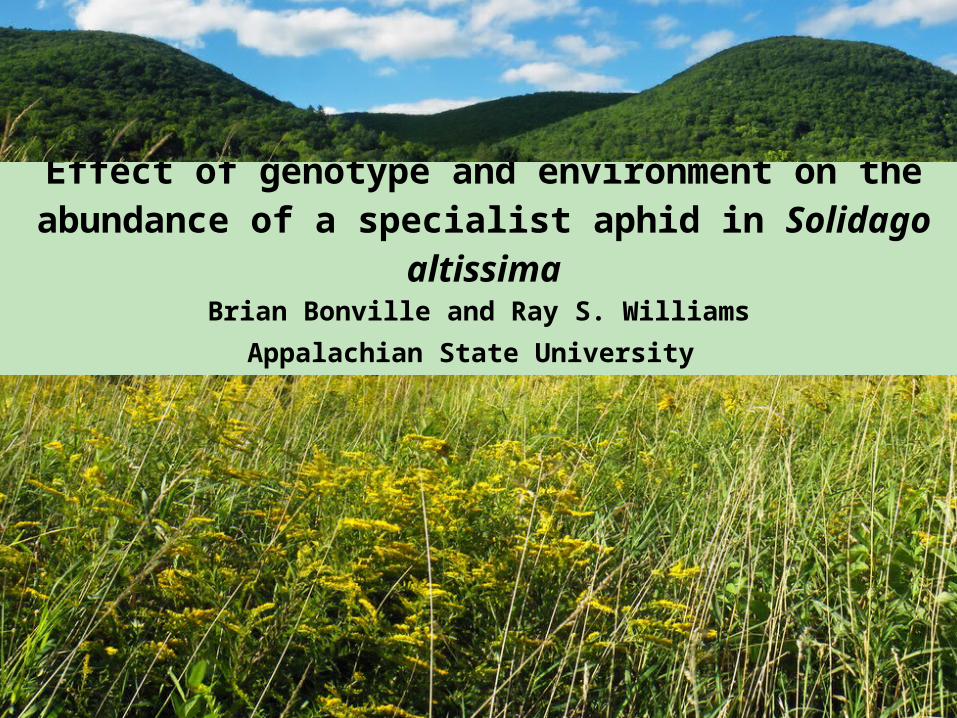
Effect of genotype and environment on the abundance of a specialist aphid in Solidago altissima
Brian Bonville and Ray S. WilliamsAppalachian State University
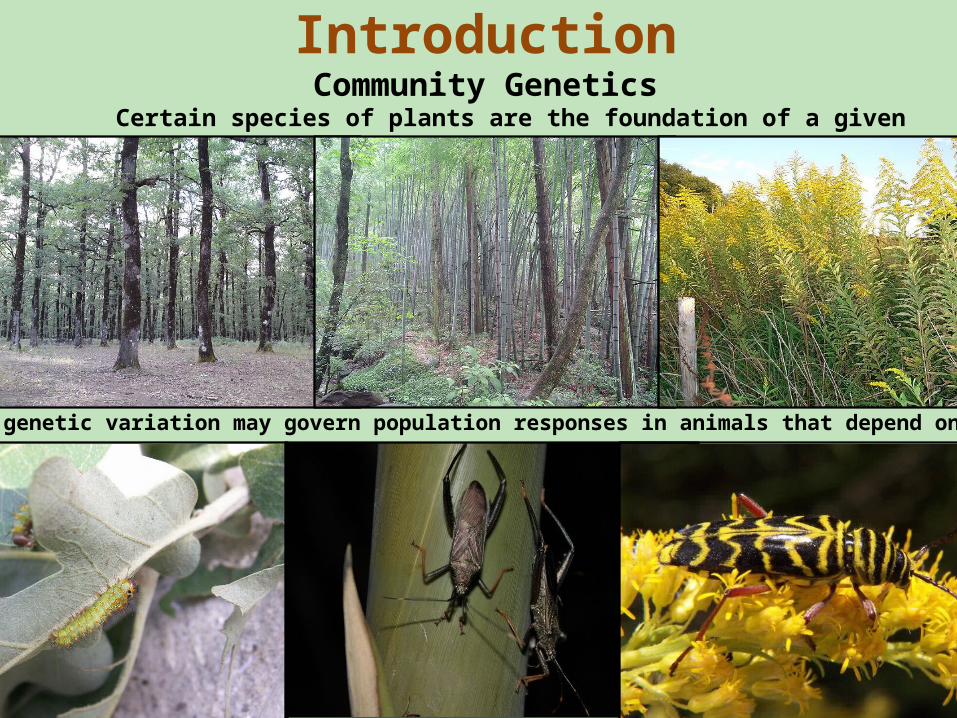
Certain species of plants are the foundation of a given ecosystem
Their genetic variation may govern population responses in animals that depend on them
IntroductionCommunity Genetics
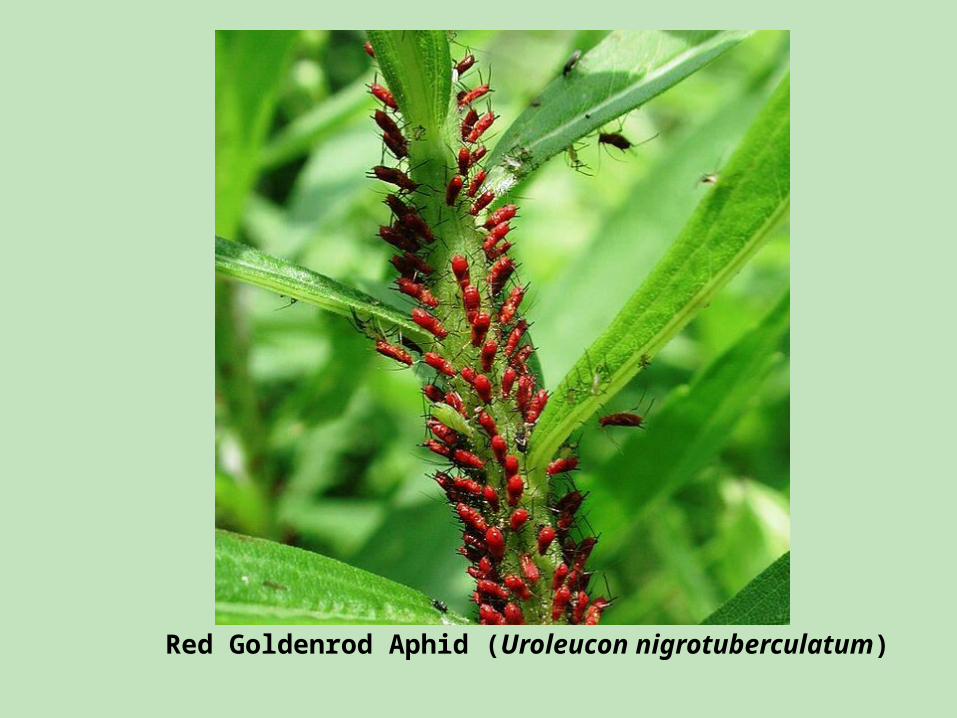
Red Goldenrod Aphid (Uroleucon nigrotuberculatum)
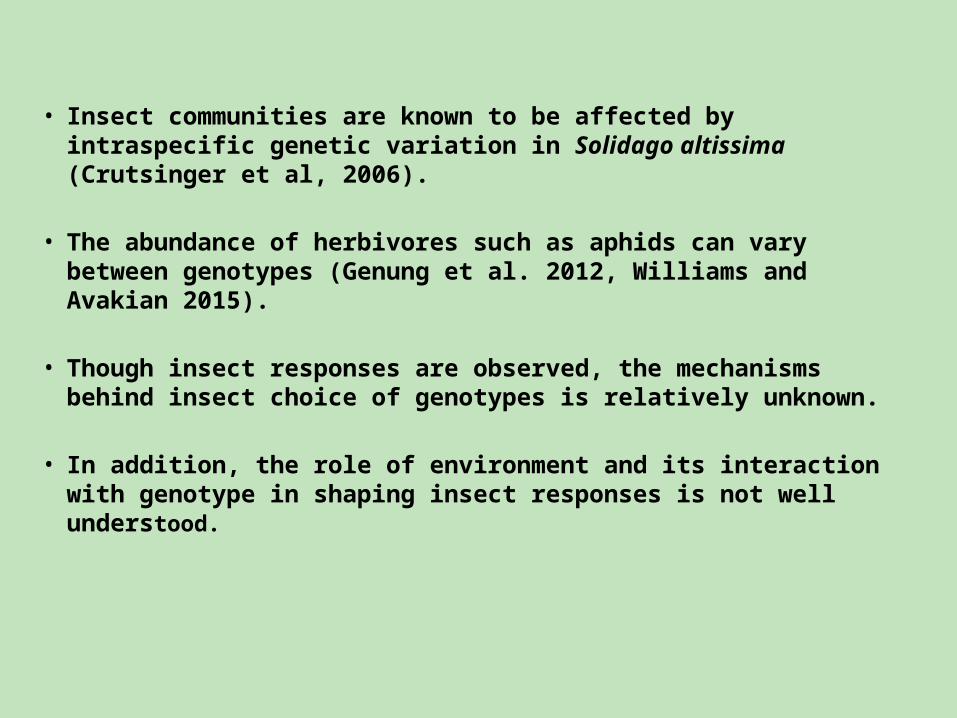
• Insect communities are known to be affected by intraspecific genetic variation in Solidago altissima (Crutsinger et al, 2006).
• The abundance of herbivores such as aphids can vary between genotypes (Genung et al. 2012, Williams and Avakian 2015).
• Though insect responses are observed, the mechanisms behind insect choice of genotypes is relatively unknown.
• In addition, the role of environment and its interaction with genotype in shaping insect responses is not well understood.
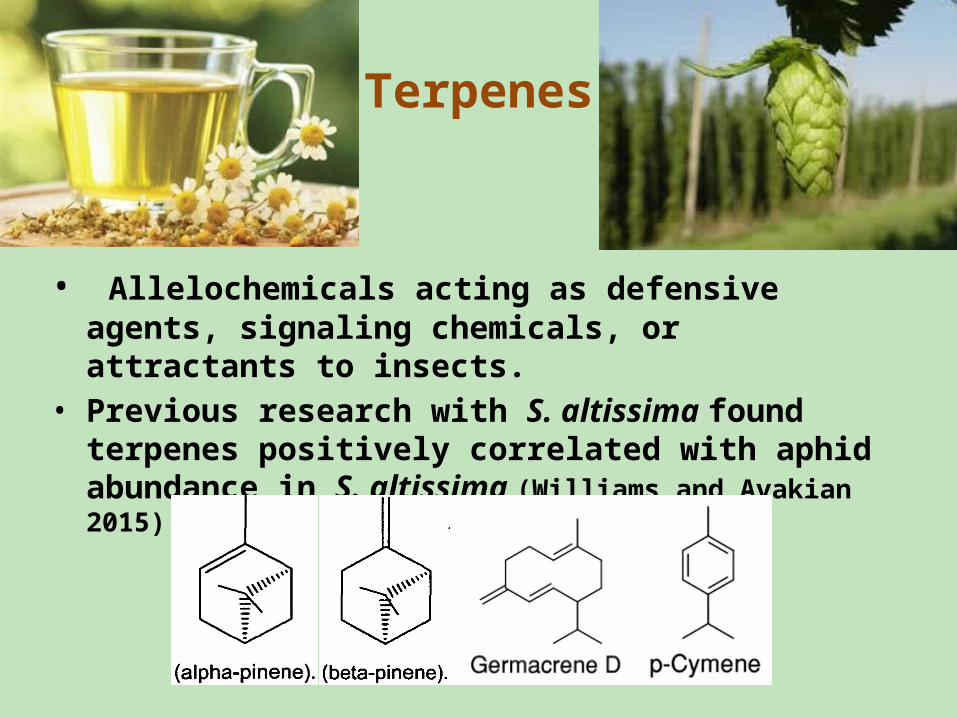
Terpenes
• Allelochemicals acting as defensive agents, signaling chemicals, or attractants to insects.
• Previous research with S. altissima found terpenes positively correlated with aphid abundance in S. altissima (Williams and Avakian 2015).
Objectives
• Investigate the effects of genotype (G) and environment (E) and GXE on Uroleucon nigrotuberculatum abundance on S. altissima by the addition of nitrogen and phosphorous to soil.
• To examine the effects of G, E, and GXE on terpenes.
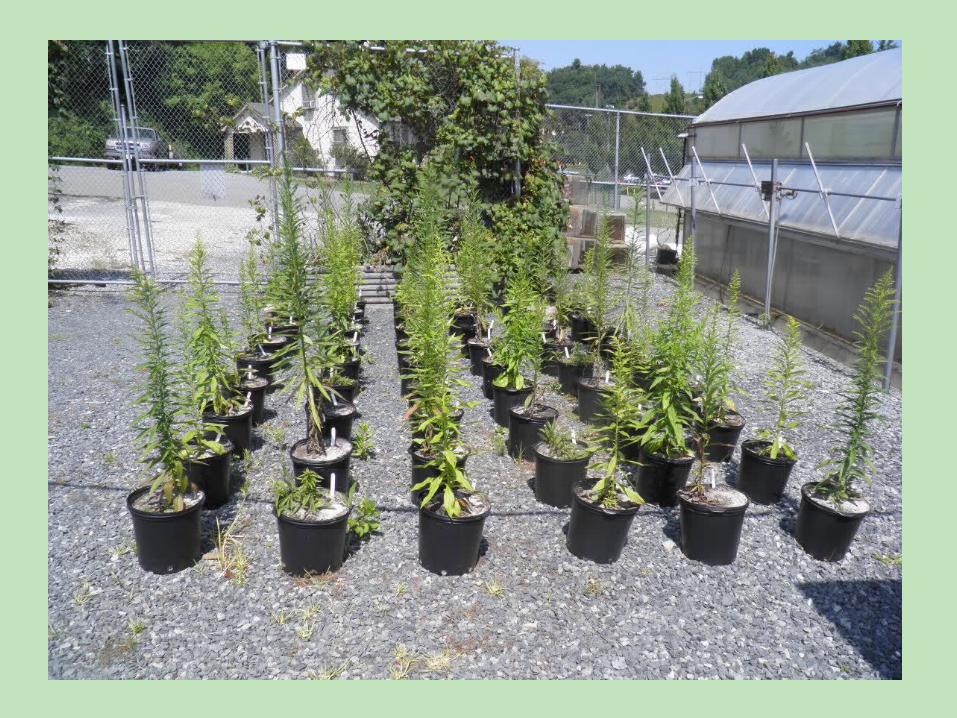
• In May 2014, six genotypes of tall goldenrod were planted in a common garden design.
• Plants were administered either nitrogen, phosphorous or no nutrients (control). There were three replicates of each treatment. Plants were spaced 0.33m apart.
• The total of 54 plants were broken into three blocks.
• Aphids colonized the plants naturally.
Methods
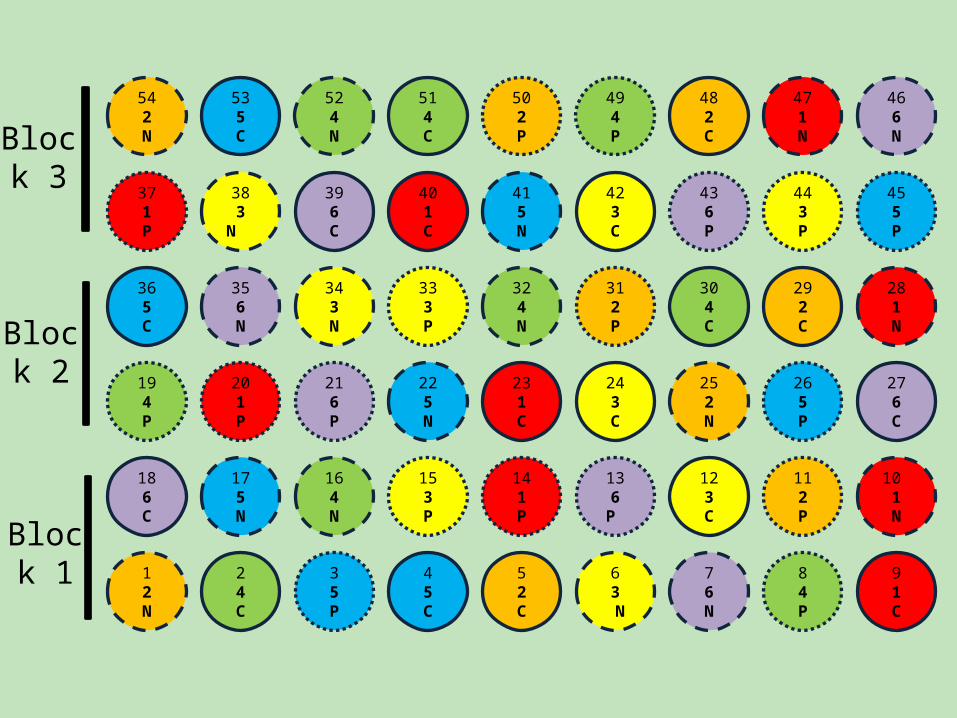
Block 1
Block 3
Block 2
542N
371P
365C
194P
186C
12N
24C
175N
201P
356N
383
N
535C
524N
343N
216P
164N
35P
45C
153P
225N
333P
401C
324N
231C
52C
136P
141P
396C
514C
502P
415N
494P
423C
482C
436P
443P
471N
292C
304C
312P
243C
252N
265P
123C
112P
63 N
76N
84P
466N
455P
281N
276C
10 1N
91C
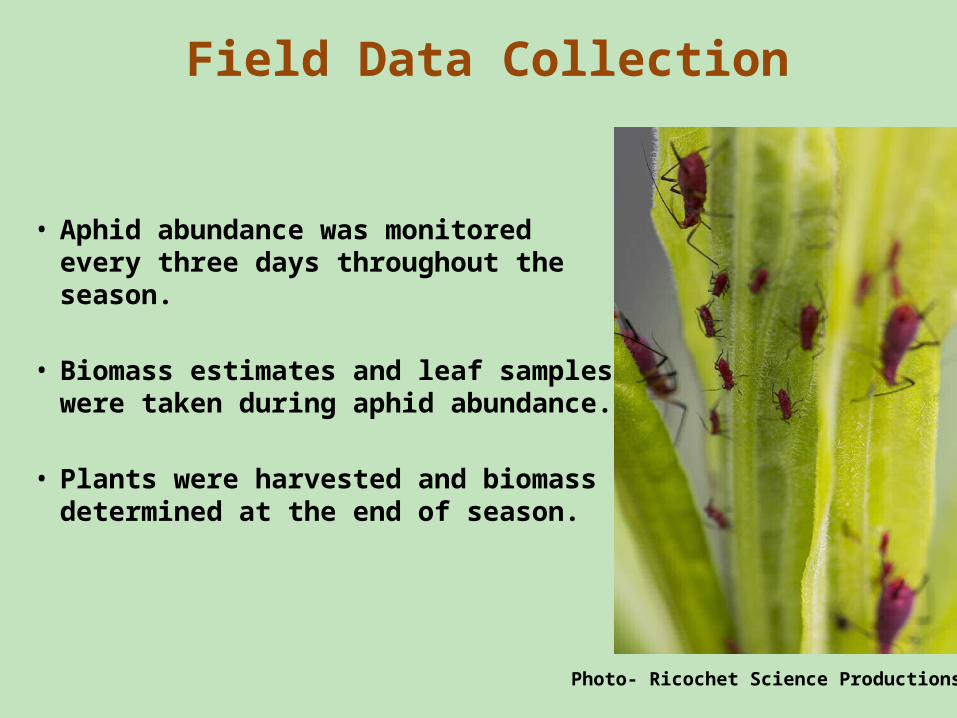
Field Data Collection
• Aphid abundance was monitored every three days throughout the season.
• Biomass estimates and leaf samples were taken during aphid abundance.
• Plants were harvested and biomass determined at the end of season.
Photo- Ricochet Science Productions
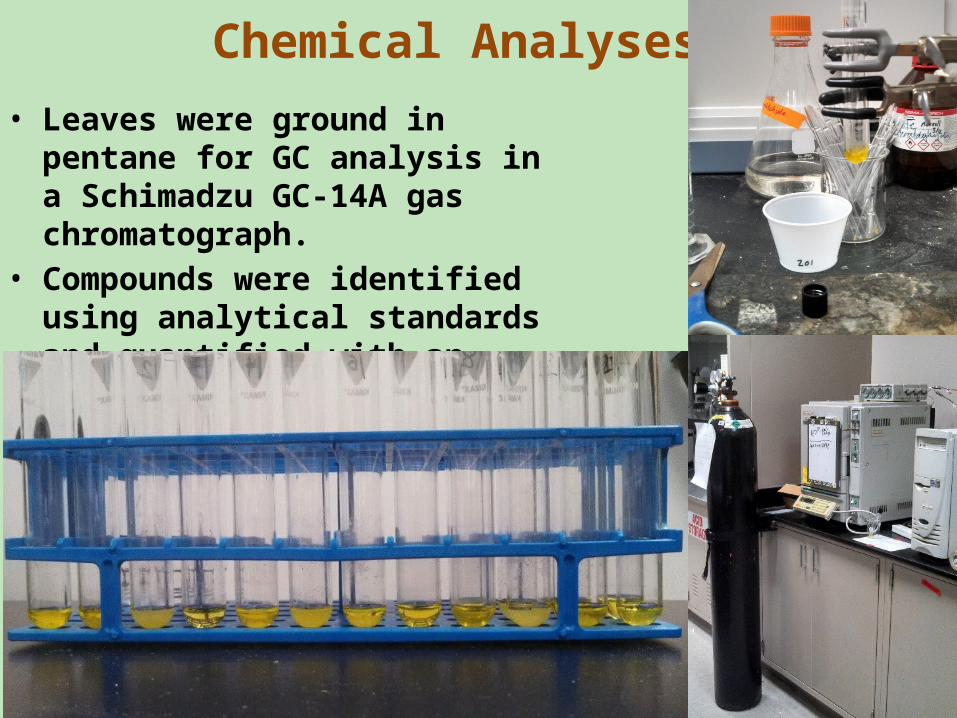
Chemical Analyses
• Leaves were ground in pentane for GC analysis in a Schimadzu GC-14A gas chromatograph.
• Compounds were identified using analytical standards and quantified with an internal standard.
Statistical Analyses
• Two-way ANOVA with repeated measures (SAS 9.4) was used to test for effects of genotype (G), nutrient treatment (E), and G XE interaction on aphid abundance, terpene concentration and plant biomass.
Results where 0.05 < P < 0.1 reported as marginally significant.
Results
Day
4 8 12 16 24 28 32 36 44 48 52 56 64 68 72 76 84 88 920 20 40 60 80
To
tal a
phid
s
0
500
1000
1500
2000
2500
3000
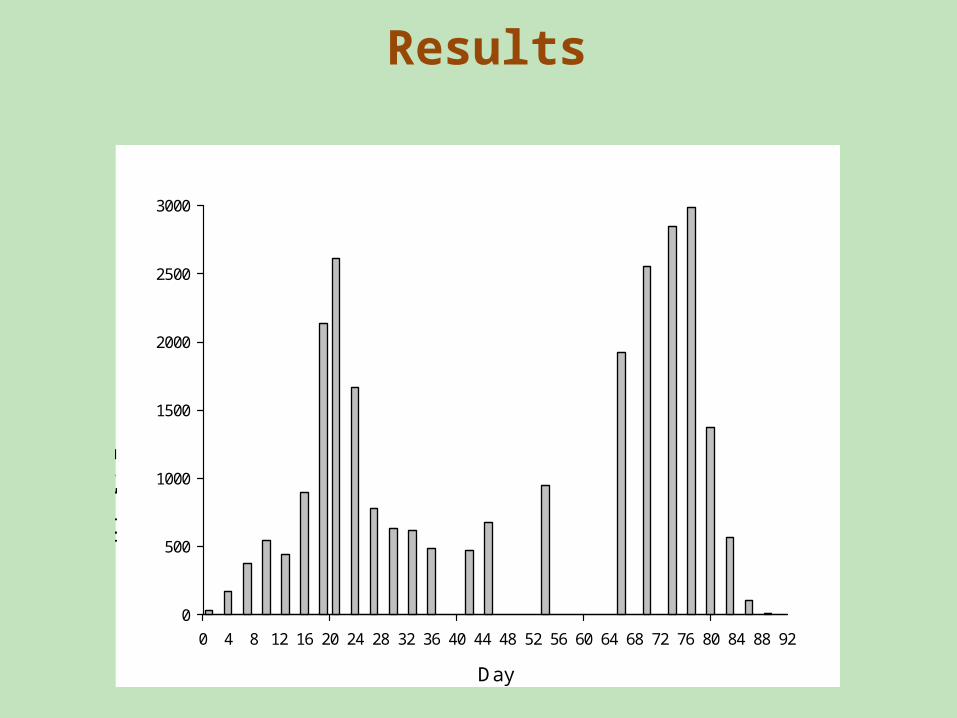
Aphid Abundance during season
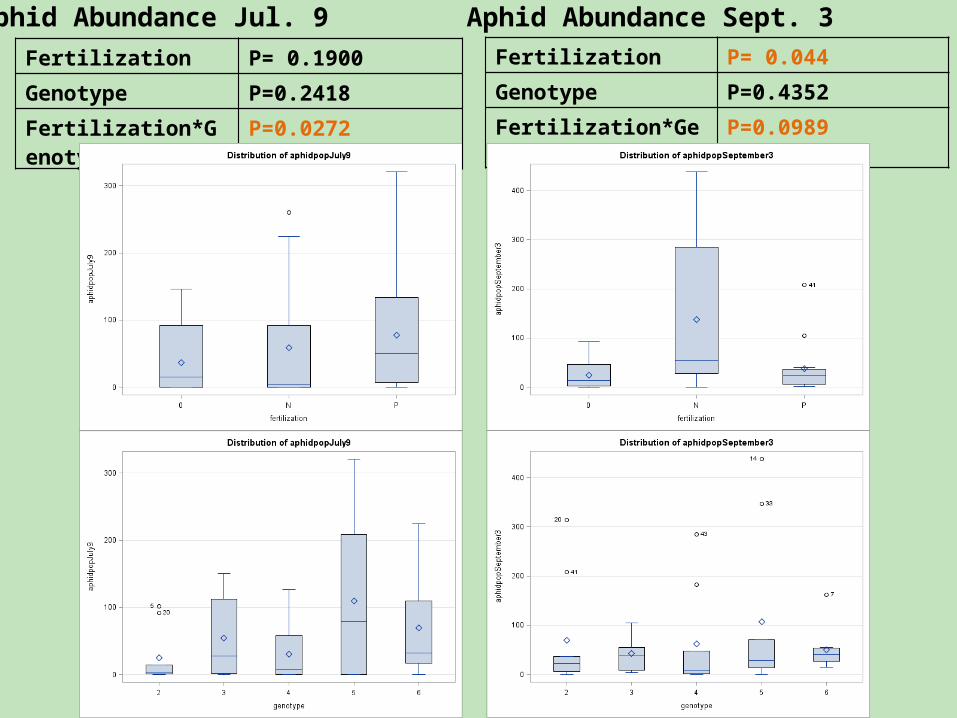
Aphid Abundance Jul. 9 Aphid Abundance Sept. 3Fertilization P= 0.1900
Genotype P=0.2418
Fertilization*Genotype P=0.0272
Fertilization P= 0.044
Genotype P=0.4352
Fertilization*Genotype P=0.0989
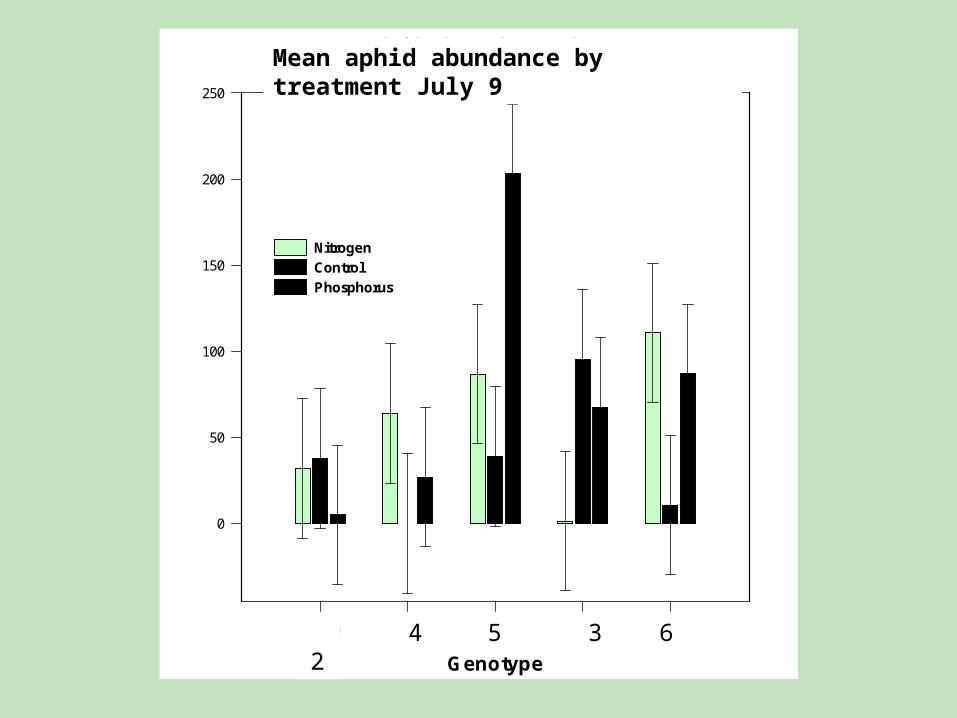
Mean aphid abundance by treatment
Genotype
2.000 4.000 5.000 3.000 6.000
Me
an
ap
hid
ab
un
da
nc
e
0
50
100
150
200
250
Nitrogen
Control
Phosphorus
Mean aphid abundance by treatment July 9
2 4 6 3 5
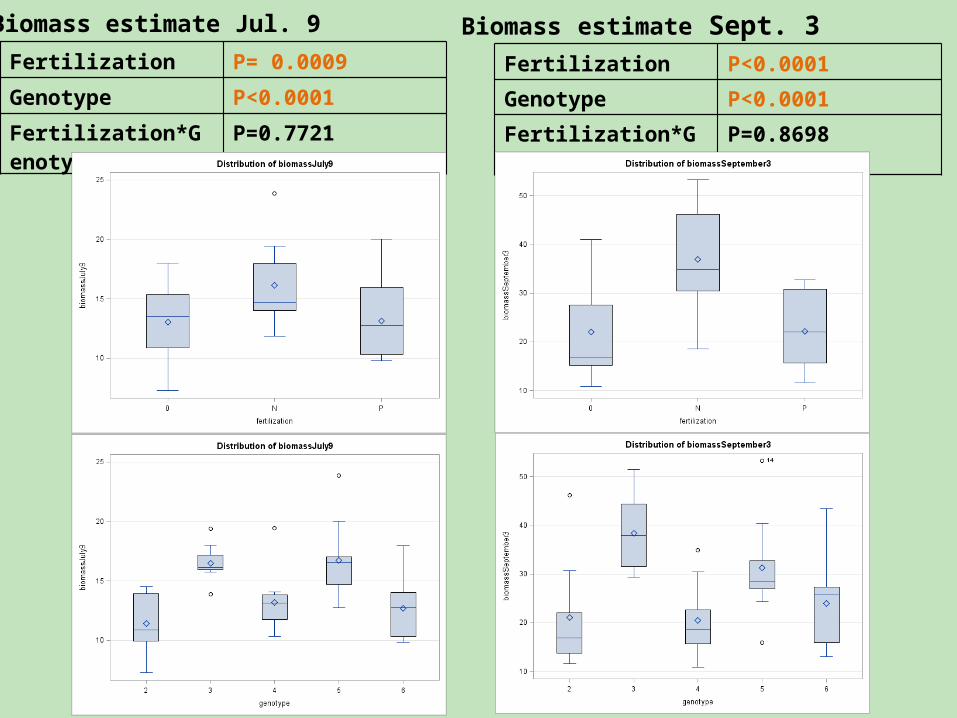
Biomass estimate Jul. 9 Biomass estimate Sept. 3Fertilization P= 0.0009
Genotype P<0.0001
Fertilization*Genotype P=0.7721
Fertilization P<0.0001
Genotype P<0.0001
Fertilization*Genotype P=0.8698
Biomass September 3
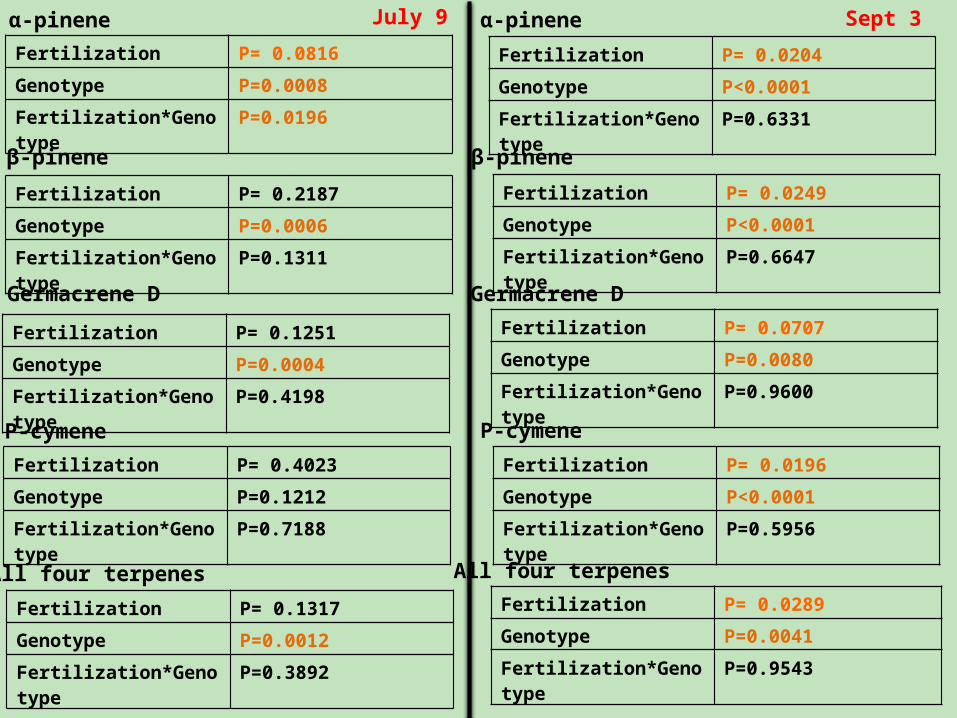
α-pinene
All four terpenes
Germacrene D Germacrene D
P-cymene P-cymene
β-pinene β-pinene
Fertilization P= 0.0816
Genotype P=0.0008
Fertilization*Genotype P=0.0196
Fertilization P= 0.0204
Genotype P<0.0001
Fertilization*Genotype P=0.6331
Fertilization P= 0.0249
Genotype P<0.0001
Fertilization*Genotype P=0.6647
Fertilization P= 0.0196
Genotype P<0.0001
Fertilization*Genotype P=0.5956
Fertilization P= 0.0707
Genotype P=0.0080
Fertilization*Genotype P=0.9600
Fertilization P= 0.4023
Genotype P=0.1212
Fertilization*Genotype P=0.7188
Fertilization P= 0.1251
Genotype P=0.0004
Fertilization*Genotype P=0.4198
Fertilization P= 0.2187
Genotype P=0.0006
Fertilization*Genotype P=0.1311
July 9 Sept 3
All four terpenesFertilization P= 0.1317
Genotype P=0.0012
Fertilization*Genotype P=0.3892
Fertilization P= 0.0289
Genotype P=0.0041
Fertilization*Genotype P=0.9543
α-pinene
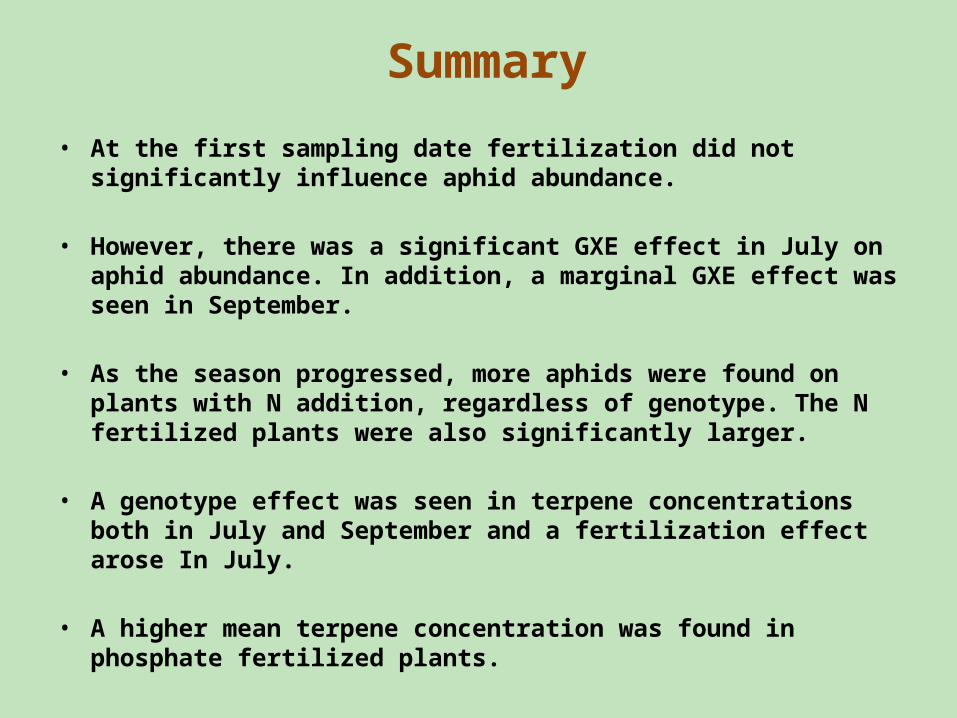
Summary
• At the first sampling date fertilization did not significantly influence aphid abundance.
• However, there was a significant GXE effect in July on aphid abundance. In addition, a marginal GXE effect was seen in September.
• As the season progressed, more aphids were found on plants with N addition, regardless of genotype. The N fertilized plants were also significantly larger.
• A genotype effect was seen in terpene concentrations both in July and September and a fertilization effect arose In July.
• A higher mean terpene concentration was found in phosphate fertilized plants.
Discussion
• Overall aphid population was affected by nutrient treatment and a GXE effect was demonstrated the early growing season.
• For terpene concentration the effect of genotype was most significant, and fertilization was seen to be significant later in the season.
• Phosphate fertilized plants had significantly higher mean terpene concentration. Flowering may deplete plants of phosphorus. Phosphorus may be integral in terpene production.
Future Work
• Awaiting analyses of C:N and N content in plants to shed more light on aphid plant colonization.
• Run Partial Least Squares Regression for individual terpenes, nutrients and aphid abundance. A multivariate correlative analysis.
• Will do linear regression analysis between aphids and nutrients, individual terpenes, and biomass.
• GC analysis on terpene content in aphids.

Acknowledgements
Williams LabRay S. WilliamsJulie RagsdaleMarae LindquistJacob Pawlik Bryan Taylor
OtherMike MadritchHowie NeufeldJerry MeyerQuinn GriffinDelaney Trimble
Funding:Appalachian State Office of Student Research