Embed Size (px)
Citation preview
Research ArticleEffect of Free Ammonia, Free Nitrous Acid, and Alkalinityon the Partial Nitrification of Pretreated Pig Slurry, Using anAlternating Oxic/Anoxic SBR
Marisol Belmonte,1,2,3 Chia-Fang Hsieh,1 José Luis Campos,4 Lorna Guerrero,5
RamónMéndez,6 Anuska Mosquera-Corral,6 and Gladys Vidal1
1Engineering and Environmental Biotechnology Group, Environmental Science Faculty & Center EULA-Chile,University of Concepcion, P.O. Box 160-C, Concepcion, Chile2School of Biochemical Engineering, Pontificia Universidad Catolica de Valparaıso, 2362803 Valparaıso, Chile3Laboratory of Biotechnology, Environment and Engineering, Faculty of Engineering, University of Playa Ancha,2340000 Valparaıso, Chile4Facultad de Ingenierıa y Ciencias, Universidad Adolfo Ibanez, 2503500 Vina del Mar, Chile5Department of Chemical and Environmental Engineering, University Federico Santa Marıa, 2390123 Valparaıso, Chile6Department of Chemical Engineering, School of Engineering, University of Santiago de Compostela,15782 Santiago de Compostela, Spain
Correspondence should be addressed to Marisol Belmonte; [email protected]
Received 18 May 2017; Accepted 1 August 2017; Published 6 September 2017
Academic Editor: Giuseppe Olivieri
Copyright © 2017 Marisol Belmonte et al. This is an open access article distributed under the Creative Commons AttributionLicense, which permits unrestricted use, distribution, and reproduction in any medium, provided the original work is properlycited.
The effect of free ammonia (NH3or FA), free nitrous acid (HNO
2or FNA), and total alkalinity (TA) on the performance of a partial
nitrification (PN) sequencing batch reactor (SBR) treating anaerobically pretreated pig slurry was studied. The SBR was operatedunder alternating oxic/anoxic (O/A) conditions and was fed during anoxic phases. This strategy allowed using organic matter topartially remove nitrite (NO
2
−) and nitrate (NO3
−) generated during oxic phases.The desiredNH4
+ toNO2
− ratio of 1.3 gN/gNwasobtained when an Ammonium Loading Rate (ALR) of 0.09 g NH
4
+-N/L⋅dwas applied.The systemwas operated at a solid retentiontime (SRT) of 15–20 d and dissolved oxygen (DO) levels higher than 3mg O
2/L during the whole operational period. PN mainly
occurred caused by the inhibitory effect of FNA on nitrite oxidizing bacteria (NOB). Once HNO2concentration was negligible,
NH4
+ was fully oxidized to NO3
− in spite of the presence of FA.The use of biomass acclimated to ammonium as inoculum avoideda possible effect of FA on NOB activity.
1. Introduction
The intensive swine production is creating scenarios wheregenerated waste is not correctly disposed, exceeding theassimilation capability of the soil-water-plant ecosystem ofthe crop lands [1]. The anaerobic digestion is the most usedtechnology to treat this kind of wastes [2]. In this pro-cess, high removal efficiencies of carbonaceous compoundscontained in the wastewater are achieved while nitrogenremoval is scarce, only due to biomass growth. Since theeffluent from the anaerobic digester has a low C/N ratio, to
perform nitrogen removal by the combination of nitrification(sequential ammonium (NH
4
+) oxidation to nitrite (NO2
−)and nitrate (NO
3
−)) and denitrification (nitrate or nitritereduction to nitrogen gas (N
2)) processes is not economically
feasible due to the requirements of organic matter. Theapplication of the combined partial nitrification (oxidationof ammonium to nitrite with around 50% efficiency) andanammox (combination of previously generated nitrite andammonium to produce nitrogen gas) processes could avoidthis drawback. However, some studies reflected problematicsituations for nitrogen removal in thisway due to the presence
HindawiBioMed Research InternationalVolume 2017, Article ID 6571671, 7 pageshttps://doi.org/10.1155/2017/6571671

2 BioMed Research International
Aeration
Stirring
Feeding
Settling
Withdrawal
Time (min)
105 5 55 105 5 55 105 5 55 105 5 55 45 15
Figure 1: Distribution of the operational cycle.
of relevant concentrations of residual organic matter in thetreated effluent [3]. In this sense, Wett et al. [4] proposedto treat a municipal wastewater, with a low C/N ratio, ina partial nitrification unit operated in alternated oxic andanoxic periods in order to promote the use of the organicmatter present for denitrification.This strategy together withthe control of the solid retention time (SRT) also allowedsuppressing the growth of nitrite oxidizers when the unitwas operated at low temperature and low ammonium con-centrations and, therefore, improving the stability of partialnitrification. Moreover, as the organic matter was removedby denitrification, alkalinity was generated which partiallycompensated for the alkalinity consumption due to partialnitrification.
During the treatment of wastewater with high ammo-nium concentrations, as the effluent of pig slurry comingfrom the anaerobic digestion, the presence of free ammonia(NH3or FA) and/or free nitrous acid (HNO
2or FNA) can
affect the performance of the partial nitrification process.These compounds can cause inhibition of nitrifying anddenitrifying bacteria and provoke the nitrite accumulationin the system [5, 6]. The nitrifying bacteria are inhibitedat concentrations of FA and FNA within 0.1–150mg NH
3-
N/L and 0.2–2.8mg HNO2-N/L, respectively [5], while the
effect of FNA on denitrifying bacteria was observed within0.01–0.20mgHNO
2-N/L [7]. Another factor to be considered
is the inlet total alkalinity/ammonium ratio (TA/NH4
+-N)since it will determine the pH value inside the reactor and,therefore, the concentrations of FNA and/or FA [8–10].
In the present research the effect of FA, FNA, andtotal alkalinity/ammonium ratio on the performance of apartial nitrification sequencing batch reactor (SBR) operatedunder alternating oxic/anoxic conditions was studied. Ananaerobically pretreated pig slurry and acclimated biomassto high ammonium concentrations were used as feedingand inoculum, respectively. The operational conditions wereadjusted to achieve the desired nitrite to ammonium ratioin the effluent and promote the consumption of the presentorganic matter by means of the denitrification process.
2. Materials and Methods
2.1. Reactor SBR Description and Operational Conditions. Alaboratory scale SBR with a working volume of 1.5 L and
a total volume of 2.5 L was used. Dimensions of the unitwere height of 540mm (𝐻), inner diameter of 77mm (𝐷),and the 𝐻/𝐷 ratio of 7. Oxygen was supplied by means ofa ceramic air diffuser located at the bottom of the reactorconnected to an air pump. The system was equipped witha mechanical stirrer operated at 80 RPM. The reactor wasmaintained in a thermostated chamber at 33 ± 2∘C. ThepH was not controlled and ranged between 6.2 and 8.5. Aprogrammable logic controller (PLC) was used to control thecycle.
The reactor was operated in cycles of 12 h distributed asshown in Figure 1. The volume exchange ratio was fixed at8.3% and the hydraulic retention time (HRT) was of 6 days.The DO was supplied only during the oxic period and itsconcentration was kept higher than 3mg O
2/L. In the anoxic
phase the mixture inside the reactor was achieved throughmechanical stirring.
The reactor was fed with the effluent coming from ananaerobic digester treating diluted pig slurry [2], whosetotal alkalinity/NH
4
+ ratio ranged from 4.0 to 9.4 g/g. Thereactor was operated during 270 days divided into threestages according to the inlet ammonium concentrations of350, 550, and 880mg NH
4
+-N/L, which corresponded toapplying Ammonium Loading Rates (ALRs) of 0.06, 0.09,and 0.15 g NH
4
+-N/L⋅d, respectively (Table 1). The SRT wasnot controlled and ranged from 15 to 20 d during the wholeoperational period.
2.2. Activity Assays. Periodical samples of biomass werecollected from the reactor during the operational stagesto evaluate their specific ammonium and nitrite oxidizingactivities (AOB and NOB, resp.) and specific denitrifyingactivity (SDA). The specific nitrifying activity (ammoniumand nitrite oxidizing) of the biomass was determined byrespirometric assays, applying the methodology described byLopez-Fiuza et al. [11], while themaximum SDA of the sludgewas determined according to the methodology proposed byBuys et al. [12].
2.3. Inoculum. The SBR was inoculated with 5 g volatilesuspended solids (VSS)/L of activated sludge collected froman aerobic reactor, used to remove both organic matterand nitrogen from pig slurry, located in the Region of theLibertador Bernardo O’Higgins, Chile. The initial specific
BioMed Research International 3
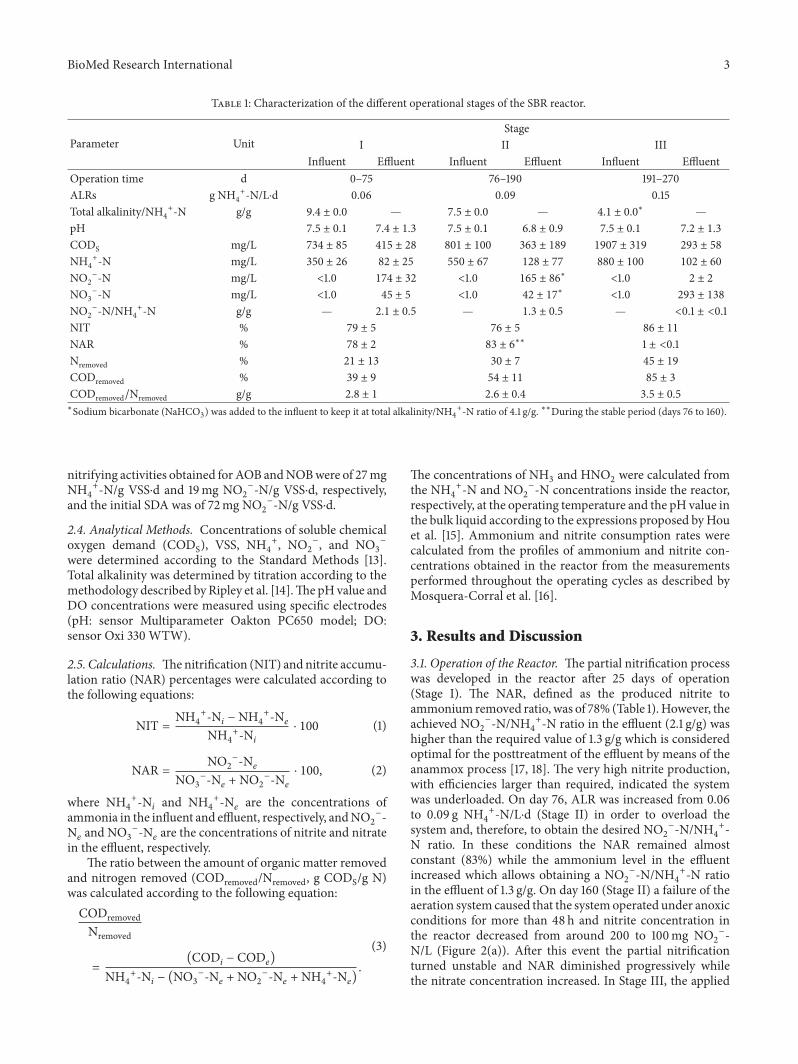
Table 1: Characterization of the different operational stages of the SBR reactor.
Parameter UnitStage
I II IIIInfluent Effluent Influent Effluent Influent Effluent
Operation time d 0–75 76–190 191–270ALRs g NH
4
+-N/L⋅d 0.06 0.09 0.15Total alkalinity/NH
4
+-N g/g 9.4 ± 0.0 — 7.5 ± 0.0 — 4.1 ± 0.0∗ —pH 7.5 ± 0.1 7.4 ± 1.3 7.5 ± 0.1 6.8 ± 0.9 7.5 ± 0.1 7.2 ± 1.3
CODS mg/L 734 ± 85 415 ± 28 801 ± 100 363 ± 189 1907 ± 319 293 ± 58
NH4
+-N mg/L 350 ± 26 82 ± 25 550 ± 67 128 ± 77 880 ± 100 102 ± 60
NO2
−-N mg/L <1.0 174 ± 32 <1.0 165 ± 86∗ <1.0 2 ± 2
NO3
−-N mg/L <1.0 45 ± 5 <1.0 42 ± 17∗ <1.0 293 ± 138
NO2
−-N/NH4
+-N g/g — 2.1 ± 0.5 — 1.3 ± 0.5 — <0.1 ± <0.1NIT % 79 ± 5 76 ± 5 86 ± 11
NAR % 78 ± 2 83 ± 6∗∗ 1 ± <0.1Nremoved % 21 ± 13 30 ± 7 45 ± 19
CODremoved % 39 ± 9 54 ± 11 85 ± 3
CODremoved/Nremoved g/g 2.8 ± 1 2.6 ± 0.4 3.5 ± 0.5∗Sodium bicarbonate (NaHCO3) was added to the influent to keep it at total alkalinity/NH4+-N ratio of 4.1 g/g. ∗∗During the stable period (days 76 to 160).
nitrifying activities obtained forAOB andNOBwere of 27mgNH4
+-N/g VSS⋅d and 19mg NO2
−-N/g VSS⋅d, respectively,and the initial SDA was of 72mg NO
2
−-N/g VSS⋅d.
2.4. Analytical Methods. Concentrations of soluble chemicaloxygen demand (CODS), VSS, NH4
+, NO2
−, and NO3
−
were determined according to the Standard Methods [13].Total alkalinity was determined by titration according to themethodology described byRipley et al. [14].ThepHvalue andDO concentrations were measured using specific electrodes(pH: sensor Multiparameter Oakton PC650 model; DO:sensor Oxi 330 WTW).
2.5. Calculations. Thenitrification (NIT) and nitrite accumu-lation ratio (NAR) percentages were calculated according tothe following equations:
NIT =NH4
+-N𝑖−NH
4
+-N𝑒
NH4
+-N𝑖
⋅ 100 (1)
NAR =NO2
−-N𝑒
NO3
−-N𝑒+NO
2
−-N𝑒
⋅ 100, (2)
where NH4
+-N𝑖and NH
4
+-N𝑒are the concentrations of
ammonia in the influent and effluent, respectively, andNO2
−-N𝑒and NO
3
−-N𝑒are the concentrations of nitrite and nitrate
in the effluent, respectively.The ratio between the amount of organic matter removed
and nitrogen removed (CODremoved/Nremoved, g CODS/g N)was calculated according to the following equation:CODremovedNremoved
=(COD
𝑖− COD
𝑒)
NH4
+-N𝑖− (NO
3
−-N𝑒+NO
2
−-N𝑒+NH
4
+-N𝑒).
(3)
The concentrations of NH3and HNO
2were calculated from
the NH4
+-N and NO2
−-N concentrations inside the reactor,respectively, at the operating temperature and the pH value inthe bulk liquid according to the expressions proposed byHouet al. [15]. Ammonium and nitrite consumption rates werecalculated from the profiles of ammonium and nitrite con-centrations obtained in the reactor from the measurementsperformed throughout the operating cycles as described byMosquera-Corral et al. [16].
3. Results and Discussion
3.1. Operation of the Reactor. The partial nitrification processwas developed in the reactor after 25 days of operation(Stage I). The NAR, defined as the produced nitrite toammonium removed ratio, was of 78% (Table 1).However, theachieved NO
2
−-N/NH4
+-N ratio in the effluent (2.1 g/g) washigher than the required value of 1.3 g/g which is consideredoptimal for the posttreatment of the effluent by means of theanammox process [17, 18]. The very high nitrite production,with efficiencies larger than required, indicated the systemwas underloaded. On day 76, ALR was increased from 0.06to 0.09 g NH
4
+-N/L⋅d (Stage II) in order to overload thesystem and, therefore, to obtain the desired NO
2
−-N/NH4
+-N ratio. In these conditions the NAR remained almostconstant (83%) while the ammonium level in the effluentincreased which allows obtaining a NO
2
−-N/NH4
+-N ratioin the effluent of 1.3 g/g. On day 160 (Stage II) a failure of theaeration system caused that the systemoperated under anoxicconditions for more than 48 h and nitrite concentration inthe reactor decreased from around 200 to 100mg NO
2
−-N/L (Figure 2(a)). After this event the partial nitrificationturned unstable and NAR diminished progressively whilethe nitrate concentration increased. In Stage III, the applied
4 BioMed Research International
Nitr
ogen
conc
entr
atio
n (m
g/L)
Stage I Stage II Stage III
50 100 150 200 250 3000Time (d)
0
200
400
600
800
1000
1200
(a)
Stages I and IIStage III
0
3
6
9
12
15
.(
3-N
(mg/
L)
20 40 60 80 1000
NAR (%)
0.0
0.1
0.2
0.3
0.4
0.5
Stage )) → )))
2-N
(mg/
L)H
NO
(b)
Stages I and IIStage III
Stage )) → )))
9.4 g/A → 7.57.5 g/A → 4.1 g/gTA/.(4+-N inf: 4.1 g/g
0
2000
4000
6000
8000
10000
Tota
l alk
alin
ity (m
g Ca
C/
3/L
)
20 40 60 80 1000NAR (%)
(c)
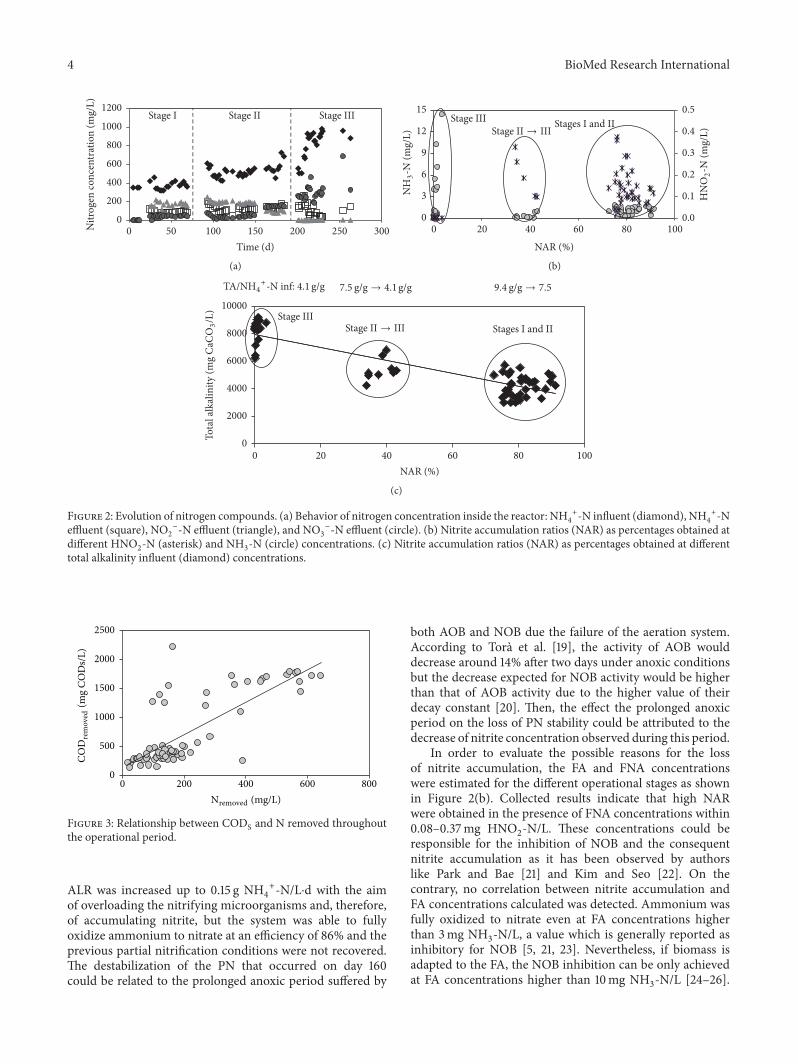
Figure 2: Evolution of nitrogen compounds. (a) Behavior of nitrogen concentration inside the reactor: NH4
+-N influent (diamond), NH4
+-Neffluent (square), NO
2
−-N effluent (triangle), and NO3
−-N effluent (circle). (b) Nitrite accumulation ratios (NAR) as percentages obtained atdifferent HNO
2-N (asterisk) and NH
3-N (circle) concentrations. (c) Nitrite accumulation ratios (NAR) as percentages obtained at different
total alkalinity influent (diamond) concentrations.
0
500
1000
1500
2000
#/$
L?GIP?
>(m
g CO
Ds/
L)
2500
200 400 600 8000NL?GIP?> (mg/L)
Figure 3: Relationship between CODS and N removed throughoutthe operational period.
ALR was increased up to 0.15 g NH4
+-N/L⋅d with the aimof overloading the nitrifying microorganisms and, therefore,of accumulating nitrite, but the system was able to fullyoxidize ammonium to nitrate at an efficiency of 86% and theprevious partial nitrification conditions were not recovered.The destabilization of the PN that occurred on day 160could be related to the prolonged anoxic period suffered by
both AOB and NOB due the failure of the aeration system.According to Tora et al. [19], the activity of AOB woulddecrease around 14% after two days under anoxic conditionsbut the decrease expected for NOB activity would be higherthan that of AOB activity due to the higher value of theirdecay constant [20]. Then, the effect the prolonged anoxicperiod on the loss of PN stability could be attributed to thedecrease of nitrite concentration observed during this period.
In order to evaluate the possible reasons for the lossof nitrite accumulation, the FA and FNA concentrationswere estimated for the different operational stages as shownin Figure 2(b). Collected results indicate that high NARwere obtained in the presence of FNA concentrations within0.08–0.37mg HNO
2-N/L. These concentrations could be
responsible for the inhibition of NOB and the consequentnitrite accumulation as it has been observed by authorslike Park and Bae [21] and Kim and Seo [22]. On thecontrary, no correlation between nitrite accumulation andFA concentrations calculated was detected. Ammonium wasfully oxidized to nitrate even at FA concentrations higherthan 3mg NH
3-N/L, a value which is generally reported as
inhibitory for NOB [5, 21, 23]. Nevertheless, if biomass isadapted to the FA, the NOB inhibition can be only achievedat FA concentrations higher than 10mg NH
3-N/L [24–26].

BioMed Research International 5
Oxic Anoxic Oxic Anoxic Oxic Anoxic Oxic Anoxic
COD
s (g)
2 4 6 8 10 120Time (h)
0.00
0.05
0.10
0.15
0.20
0.25
0.30
.(
4+,.
/2−,.
/3−(g
N)
0.00
0.20
0.40
0.60
0.80
1.00
(a)
COD
s (g)
Oxic Anoxic Oxic Anoxic Oxic Anoxic Oxic Anoxic
0.00
0.05
0.10
0.15
0.20
0.25
0.30
0.35
0.40
0.45
.(
4+,.
/2−,.
/3−(A
N)
0.00
0.20
0.40
0.60
0.80
1.00
1.20
2 4 6 8 10 120Time (h)
(b)
Figure 4: Evolution of CODS (circle), NH4+-N (square), NO
2
−-N (triangle), and NO3
−-N (diamond) calculated amounts inside the reactorduring an operational cycle in the SBR on days 109 (Stage II) (a) and 221 (Stage III) (b).
Results indicate thatNARwas quickly lost once the inhibitoryconditions for NOB were suppressed in Stage III. This woulddemonstrate that the inhibitory effects of FNA on NOB weretemporary [15, 27].
Alkalinity is another important parameter that affectsthe nitrification process since it is important to maintain a
suitable pH value [28]. Figure 2(c) shows that the decreaseof the inlet total alkalinity concentrations increased theefficiency of the system in accumulating nitrite. This can beattributed to the decrease of pH value inside the reactor,which promoted the inhibitory effect of FNA on NOB (seeTable 1). On the contrary, Hwang et al. [10] and Hou et al. [15]

6 BioMed Research International
observed that nitrite was only accumulated when the inletTA/NH
4
+-N ratio was higher than the stoichiometric one(7.1 g TA/g NH
4
+-N) since this favoured the FA.Respirometric assays were performed with biomass sam-
ples from the reactor. Experimental results confirmed theobservations from the reactor operation. The initial NOBspecific activity decreased to no detectable levels on day 25and remained at this level until day 187. These results wererelated to the increase in the FNA concentration and itsinhibitory effect on NOB (Figure 2(b)). From this day on,NOB specific activity gradually increased up to a value of230mg NO
2
−-N/g VSS⋅d. The AOB specific activity was of47, 66, and 124mg NH
4
+-N/g VSS⋅d during Stages I, II, andIII, respectively. The SDA of the biomass was of 120mg N/gVSS⋅d during the whole operational period.
The COD removal efficiency was affected by the influentquality and ranged from 39% during Stage I to 85% duringStage III. Concerning nitrogen removal efficiency, its valueranged from 21% (Stage I) to 47% (Stage III) (Table 1).Results showed a clear relationship between the amounts oforganicmatter and nitrogen removed, which indicate that thedenitrification process was taking place (Figure 3). DuringStage II, the CODremoved/Nremoved ratio was of 2.6 g/g while,during Stage III, this ratio increased up to 3.5 g/g becauseammonium was completely oxidized to nitrate during thisstage [29].
3.2. Operational Cycles. In order to evaluate the performanceof the reactor, cycle measurements were carried out. TheCODS and nitrogenous compounds concentrations weremeasured throughout different operational cycles over theoperational period. Data obtained from the cycle mea-surements of days 109 (Stage II) and 221 (Stage III) areshown in Figure 4 in terms of accumulative amounts (g)of the measured compounds. In both cycles, biodegradableorganicmatter wasmainly removed during the anoxic phasestogether with nitrite and nitrate while CODS remained prac-tically constant during oxic phases. These profiles show thatthe cycle distribution allows the efficient use of the organicmatter, contained in the influent, to carry out denitrification.Therefore, the nitrogen load to be treated in a subsequentanammox reactor decreases. The main difference betweenboth measured cycles was the relative values of ammoniumand nitrite oxidation rates. On day 109, the ammoniumoxidation ratewas 3 to 4 times larger than the nitrite oxidationrate, while on day 229, both values were almost the samethus indicating that the partial nitrification was not possibleduring the last stage.
Gilbert et al. [30] observed the appearance of a lagphase longer for the nitrite oxidation than for the ammoniaoxidation when anoxic periods, longer than 15–20 minutes,were imposed. However the lag phase corresponding to thenitrite oxidation had been always lower than 12 minutes.Therefore, the operational cycle distribution used in thiswork would not be suitable to promote PN due to the longduration of the oxic period (105 minutes). In fact, whenalternating oxic/anoxic conditions are applied to avoid thenitrite oxidation during municipal wastewater treatment by
means of continuous systems, where neither FA nor FNAinhibitions are expected, the length of the oxic and anoxicperiods is fixed at around 10 minutes [4, 29, 31].
4. Conclusions
Stable partial nitrification was achieved during the treatmentof the effluent of an anaerobic reactor fed with pig slurry.Since the system was operated at high STR values (15–20 d)and nonlimiting oxygen concentrations (higher than 3mgO2/L), nitrite accumulation was mainly attributed to the
presence of high FNA concentrations. Attempts to inhibitNOB by promoting the presence of FA were not successful.
Conflicts of Interest
The authors declare that there are no conflicts of interestregarding the publication and financing the publication ofthis paper.
Acknowledgments
This work was funded by the Chilean Government(CONICYT/FONDECYT 3140276, CONICYT/PAI/MEC80140011, FDD-UPLA-CC18105, Patagonia Seed Project210.310.055-1SP, CONICYT/FONDAP/15130015, and RedDoctoral REDOC.CTA, MINEDUC Grant UCO1202 atUniversity of Concepcion). The authors thank Mr. C.Contreras from “Sucesion Yanine Abadi” for allowing therealization of this study in their facilities.
References
[1] B. Fridrich, D. Krcmar, B. Dalmacija et al., “Impact of wastewa-ter from pig farm lagoons on the quality of local groundwater,”Agricultural Water Management, vol. 135, pp. 40–53, 2014.
[2] D. C. Rodriguez, M. Belmonte, G. Penuela, J. L. Campos, andG. Vidal, “Behaviour of molecular weight distribution for theliquid fraction of pig slurry treated by anaerobic digestion,”Environmental Technology, vol. 32, no. 4, pp. 419–425, 2011.
[3] S. Lackner, A. Terada, and B. F. Smets, “Heterotrophic activitycompromises autotrophic nitrogen removal in membrane-aerated biofilms: Results of a modeling study,” Water Research,vol. 42, no. 4-5, pp. 1102–1112, 2008.
[4] B. Wett, A. Omari, S. M. Podmirseg et al., “Going for main-stream deammonification from bench to full scale for maxi-mized resource efficiency,” Water Science and Technology, vol.68, no. 2, pp. 283–289, 2013.
[5] A. C. Anthonisen, R. C. Loehr, T. B. S. Prakasam, and E. G.Srinath, “Inhibition of nitrification by ammonia and nitrousacid,” Research Journal Water Pollution Control, vol. 48, no. 5,pp. S35–S52, 1976.
[6] J. S. Almeida, S. M. Julio, M. A. M. Reis, and M. J. T. Car-rondo, “Nitrite inhibition of denitrification by Pseudomonasfluorescens,”Biotechnology andBioengineering, vol. 46, no. 3, pp.194–201, 1995.
[7] Y. Zhou, A. Oehmen, M. Lim, V. Vadivelu, and W. J. Ng,“The role of nitrite and free nitrous acid (FNA) in wastewatertreatment plants,”Water Research, vol. 45, no. 15, pp. 4672–4682,2011.

BioMed Research International 7
[8] U. Duran, A. Val Del Rıo, J. L. Campos, A. Mosquera-Corral,and R. Mendez, “Enhanced ammonia removal at room tem-perature by pH controlled partial nitrification and subsequentanaerobic ammonium oxidation,” Environmental Technology(United Kingdom), vol. 35, no. 4, pp. 383–390, 2014.
[9] L. Zhang, J. Yang, D. Hira, T. Fujii, and K. Furukawa, “High-ratepartial nitrification treatment of reject water as a pretreatmentfor anaerobic ammonium oxidation (anammox),” BioresourceTechnology, vol. 102, no. 4, pp. 3761–3767, 2011.
[10] B.-H. Hwang, K.-Y. Hwang, E.-S. Choi, D.-K. Choi, and J.-Y.Jung, “Enhanced nitrite build-up in proportion to increasingalklinity/NH
4
+ ratio of influent in biofilm reactor,” Biotechnol-ogy Letters, vol. 22, no. 16, pp. 1287–1290, 2000.
[11] J. Lopez-Fiuza, B. Buys, A. Mosquera-Corral, F. Omil, and R.Mendez, “Toxic effects exerted on methanogenic, nitrifyingand denitrifying bacteria by chemicals used in a milk analysislaboratory,” Enzyme and Microbial Technology, vol. 31, no. 7, pp.976–985, 2002.
[12] B. R. Buys, A. Mosquera-Corral, M. Sanchez, and R. Mendez,“Development and application of a denitrification test based ongas production,” Water Science and Technology, vol. 41, no. 12,pp. 113–120, 2000.
[13] APHA-AWWA-WPCF, Standard Methods for Examination ofWater and Wastewater, 21st edition, 2005.
[14] L. E. Ripley, W. C. Boyle, and J. C. Converse, “Improved alka-limetric monitoring for anaerobic digestion of high-strengthwastes,” Journal of the Water Pollution Control Federation, vol.58, no. 5, pp. 406–411, 1986.
[15] B. Hou, H. Han, S. Jia, H. Zhuang, Q. Zhao, and P. Xu, “Effect ofalkalinity on nitrite accumulation in treatment of coal chemicalindustry wastewater using moving bed biofilm reactor,” Journalof Environmental Sciences (China), vol. 26, no. 5, pp. 1014–1022,2014.
[16] A. Mosquera-Corral, M. K. De Kreuk, J. J. Heijnen, and M.C. M. Van Loosdrecht, “Effects of oxygen concentration on N-removal in an aerobic granular sludge reactor,”Water Research,vol. 39, no. 12, pp. 2676–2686, 2005.
[17] Y.-H. Ahn, “Sustainable nitrogen elimination biotechnologies: areview,” Process Biochemistry, vol. 41, no. 8, pp. 1709–1721, 2006.
[18] J. Vazquez-Padın, I. Fernadez, M. Figueroa, A. Mosquera-Corral, J.-L. Campos, and R. Mendez, “Applications of Anam-mox based processes to treat anaerobic digester supernatant atroom temperature,” Bioresource Technology, vol. 100, no. 12, pp.2988–2994, 2009.
[19] J. A. Tora, J. Lafuente, J. A. Baeza, and J. Carrera, “Long-term starvation and subsequent reactivation of a high-ratepartial nitrification activated sludge pilot plant,” BioresourceTechnology, vol. 102, no. 21, pp. 9870–9875, 2011.
[20] G. Munz, C. Lubello, and J. A. Oleszkiewicz, “Factors affectingthe growth rates of ammonium and nitrite oxidizing bacteria,”Chemosphere, vol. 83, no. 5, pp. 720–725, 2011.
[21] S. Park andW. Bae, “Modeling kinetics of ammonium oxidationand nitrite oxidation under simultaneous inhibition by freeammonia and free nitrous acid,” Process Biochemistry, vol. 44,no. 6, pp. 631–640, 2009.
[22] D.-J. Kim and D. Seo, “Selective enrichment and granulation ofammonia oxidizers in a sequencing batch airlift reactor,” ProcessBiochemistry, vol. 41, no. 5, pp. 1055–1062, 2006.
[23] J. Li, D. Elliott, M. Nielsen, M. G. Healy, and X. Zhan, “Long-term partial nitrification in an intermittently aerated sequenc-ing batch reactor (SBR) treating ammonium-rich wastewater
under controlled oxygen-limited conditions,” Biochemical Engi-neering Journal, vol. 55, no. 3, pp. 215–222, 2011.
[24] A. Spagni and S. Marsili-Libelli, “Nitrogen removal via nitritein a sequencing batch reactor treating sanitary landfill leachate,”Bioresource Technology, vol. 100, no. 2, pp. 609–614, 2009.
[25] M. Belmonte, C.-F. Hsieh, C. Figueroa, J. L. Campos, and G.Vidal, “Effect of free ammonia nitrogen on the methanogenicactivity of swine wastewater,” Electronic Journal of Biotechnol-ogy, vol. 14, no. 3, 2011.
[26] J.W. Shanahan andM. J. Semmens, “Alkalinity andpHeffects onnitrification in amembrane aerated bioreactor: an experimentaland model analysis,”Water Research, vol. 74, pp. 10–22, 2015.
[27] L.-Y. Chai, M. Ali, X.-B. Min et al., “Partial nitrification in anair-lift reactor with long-term feeding of increasing ammoniumconcentrations,” Bioresource Technology, vol. 185, pp. 134–142,2015.
[28] M. Pijuan, L. Ye, and Z. Yuan, “Free nitrous acid inhibitionon the aerobic metabolism of poly-phosphate accumulatingorganisms,”Water Research, vol. 44, no. 20, pp. 6063–6072, 2010.
[29] S. Ge, Y. Peng, S. Qiu, A. Zhu, and N. Ren, “Complete nitrogenremoval from municipal wastewater via partial nitrificationby appropriately alternating anoxic/aerobic conditions in acontinuous plug-flow step feed process,”Water Research, vol. 55,pp. 95–105, 2014.
[30] E. M. Gilbert, S. Agrawal, F. Brunner, T. Schwartz, H. Horn, andS. Lackner, “Response of different Nitrospira Species to anoxicperiods depends on operational DO,” Environmental Scienceand Technology, vol. 48, no. 5, pp. 2934–2941, 2014.
[31] P. Regmi, M. W. Miller, B. Holgate et al., “Control of aer-ation, aerobic SRT and COD input for mainstream nitrita-tion/denitritation,”Water Research, vol. 57, pp. 162–171, 2014.

Submit your manuscripts athttps://www.hindawi.com
Hindawi Publishing Corporationhttp://www.hindawi.com Volume 2014
Anatomy Research International
PeptidesInternational Journal of
Hindawi Publishing Corporationhttp://www.hindawi.com Volume 2014
Hindawi Publishing Corporation http://www.hindawi.com
International Journal of
Volume 201
Hindawi Publishing Corporationhttp://www.hindawi.com Volume 2014
Molecular Biology International
GenomicsInternational Journal of
Hindawi Publishing Corporationhttp://www.hindawi.com Volume 2014
The Scientific World JournalHindawi Publishing Corporation http://www.hindawi.com Volume 2014
Hindawi Publishing Corporationhttp://www.hindawi.com Volume 2014
BioinformaticsAdvances in
Marine BiologyJournal of
Hindawi Publishing Corporationhttp://www.hindawi.com Volume 2014
Hindawi Publishing Corporationhttp://www.hindawi.com Volume 2014
Signal TransductionJournal of
Hindawi Publishing Corporationhttp://www.hindawi.com Volume 2014
BioMed Research International
Evolutionary BiologyInternational Journal of
Hindawi Publishing Corporationhttp://www.hindawi.com Volume 2014
Hindawi Publishing Corporationhttp://www.hindawi.com Volume 2014
Biochemistry Research International
ArchaeaHindawi Publishing Corporationhttp://www.hindawi.com Volume 2014
Hindawi Publishing Corporationhttp://www.hindawi.com Volume 2014
Genetics Research International
Hindawi Publishing Corporationhttp://www.hindawi.com Volume 2014
Advances in
Virolog y
Hindawi Publishing Corporationhttp://www.hindawi.com
Nucleic AcidsJournal of
Volume 2014
Stem CellsInternational
Hindawi Publishing Corporationhttp://www.hindawi.com Volume 2014
Hindawi Publishing Corporationhttp://www.hindawi.com Volume 2014
Enzyme Research
Hindawi Publishing Corporationhttp://www.hindawi.com Volume 2014
International Journal of
Microbiology