Embed Size (px)
Citation preview
Journal of Nutritional Bio
Effect of food restriction on the insulin signalling pathway
in rat skeletal muscle and adipose tissue
Ana Alonso1, Yolanda Fernandez1, Rebeca Fernandez, Patricia Ordonez, Marıa Moreno,
Fernando Dıaz, Angeles M. Patterson, Celestino GonzalezTDepartment of Functional Biology, Physiology Area, University of Oviedo, Oviedo, 33006 Spain
Received 29 November 2004; received in revised form 2 March 2005; accepted 4 March 2005
Abstract
We tried to elucidate the effects of a brief and severe model of food restriction on insulin sensitivity in female rats, focusing on key
proteins involved in the insulin signalling pathway in skeletal muscle and adipose tissue after 5, 10 and 15 days of food restriction. Using
euglycemic clamp, we detected that food-restricted rats are significantly less sensitive to insulin action than control rats. However, the time of
restriction promotes a progressive increase on insulin sensitivity. The analysis of the insulin signalling pathway showed a tissue-specific
regulation of several proteins involved in insulin signalling. In skeletal muscle, insulin receptor substrate 1 and Glut4 are up-regulated at the
end of the food restriction period, just the opposite of what we found in adipose tissue. In conclusion, a 50% reduction of food intake
modulates insulin sensitivity through a tissue-specific regulation of the insulin signalling pathway in the main target tissues for this hormone.
D 2005 Elsevier Inc. All rights reserved.
Keywords: Food restriction; Insulin; Insulin receptor; IRS-1; Glut4
1. Introduction
Insulin is the main hormone that is involved in glucose,
lipid and amino acid metabolism. It can be considered as an
anabolic and anticatabolic hormone that promotes glucose
uptake in muscle and fat and stimulates the storage of
substrates in fat, liver and muscle by increasing lipogenesis,
glycogen and protein synthesis and by decreasing lipolysis,
glycogenolysis and protein breakdown [1].
Insulin binds to its receptor (IR), which has intrinsic
tyrosine kinase activity; insulin binding promotes this
activity, resulting in IR autophosphorylation. Next, the kinase
phosphorylates several intracellular proteins, including those
of the IR substrate (IRS) family, of which IRS-1 is the best
characterized. IRS-1 lacks catalytic activity, but in order to
affect the many biologic responses of insulin, it serves as a
docking protein to which different signalling proteins such as
phosphatidylinositol-3-kinase (PI3-K) bind through SH2
domains. PI3-K activation has a pivotal role in the metabolic
actions of insulin, including insulin-stimulated glucose
0955-2863/$ – see front matter D 2005 Elsevier Inc. All rights reserved.
doi:10.1016/j.jnutbio.2005.03.002
T Corresponding author. Tel.: +34 985 104209; fax: +34 985 103534.
E-mail address: [email protected] (C. Gonzalez).1 This two authors should rank equally as the first.
transport through the specific translocation of Glut4 trans-
porters from intracellular storage to the plasma membrane
(for a review, see Refs. [2–4]). The regulation of the insulin
signalling pathway is of great interest. A significant increase
in the Ser/Thr phosphorylation of IRS proteins has been
shown to act as a negative feedback-control mechanism that
uncouples IRS proteins from their upstream and downstream
effectors and terminates signal transduction in response
to insulin. Therefore, IRS-1 Ser/Thr phosphorylation is a
potential molecular mechanism for insulin resistance [5,6].
A moderate reduction of food intake has important
benefits on whole-body glucose homeostasis; this is
characterized by low fasting blood glucose levels despite
low insulin levels. Food restriction is a common treatment
for insulin resistance, obesity and type 2 diabetes mellitus
[7–9]. However, hyperglycemia and hyperinsulinemia are
known to cause aging-like damage and the effects of
glucose seem to be linked to glycation and/or glycoxidation
while insulin itself is damaging because of its mitogenic
action [10,11]. It has been demonstrated that restricting food
intake to 50–70% of the level of ad libitum fed rats has
important benefits on life expectancy and prevents age-
associated diseases; this seems to be related to the effects of
food restriction on plasma insulin and glucose levels (for a
chemistry 16 (2005) 602–609
A. Alonso et al. / Journal of Nutritional Biochemistry 16 (2005) 602–609 603
review, see Ref. [12]). The fact that food restriction can
improve this situation might be related to the specific
regulation of the insulin signalling pathway. Although there
has been much research in this field over the past few years,
most studies have considered the effects of moderate food
restriction (30–40%) or protein deprivation on skeletal
muscle [13–15]. To our knowledge, no previous study has
investigated the adaptations of the insulin signalling
pathway to food restriction in adipose tissue.
Previously, we studied the effects of a severe model of
food restriction on glucose homeostasis and maternal
adaptations in rats [16,17]. In the present work, we
examined the influence of a brief and severe model of food
restriction (50%) on some events in the insulin signalling
cascade in both skeletal muscle and adipose tissue. The
results of our study show that there are significant differ-
ences between food-restricted (R) and control (C) rats and
that the adaptations to food restriction seem to differ
between skeletal muscle and adipose tissue, thus suggesting
a tissue-specific effect.
able 1
eneral characteristics of experimental animals
Group Day 5 Day 10 Day 15
ood
intake (g)
R 9.87F0.15a 9.56F0.16a 9.84F0.05a
C 18.27F0.61 19.27F0.77 20.25F0.89
ody
weight (g)
R 229.50F4.11a 225.17F4.65a 206.92F3.57a,b
C 261.53F4.27 264.4F4.17 268.71F11.2
lucose
(mg/dl)
R 124.67F5.49a 109.83F3.33a 108.75F5.93a
C 141.73F6.4 142.34F5.94 143.02F5.57
sulin
(ng/ml)
R 1.27F0.21a 1.49F0.5a 1.17F0.23a
C 8.02F1.4 7.94F0.89 8.01F1.3
alues are meanFS.E.M. The number of cases was six for each group.
nly significant differences are shown.a C vs. R.b R15 vs. R5 and R10.
2. Material and methods
2.1. Animals
Virgin female Wistar rats (from the biotery of the
University of Oviedo, Spain) weighing 250–280 g were
used in this study and were kept under standardized
conditions: temperature (23F38C), humidity (65F1%) and
a 12-h light/dark cycle (8:00 am–8:00 pm). The animals
were fed a standard diet (Panlab A04). All experimental
manipulations were performed between 9:30 am and
12:30 pm. All the animal experiments were approved by
the University of Oviedo Ethics Committee following the
bGuiding Principles for Research Involving Animals and
Human Beings: Recommendations from the Declaration of
HelsinkiQ and the bGuiding Principles in the Care and Use ofAnimalsQ approved by the Council of The American
Physiological Society.
The animals were separated randomly into two groups, C
and R, with 27 animals per group, and were kept in
metabolic cages (Tecniplast, Exton, PA, USA) throughout
the experiment. The composition of the diet was as follows:
18% proteins, 3.5% lipids, 53% carbohydrates, 12.5%
water, 8% ash, 1.3% minerals and 3.7% vitamins. The
energetic value of the diet was 2.9 kcal/g. The C group had
free access to food during the experiment, while the R group
received approximately 50% of the average daily food
intake of the C group on the corresponding day; as a result,
the R rats received approximately 50% of each dietary
component. All animals had free access to water.
The R and C groups were divided randomly into three
subgroups with nine animals in each. The animals were
sacrificed after 5, 10 and 15 days of the experiment in order
to determine whether the length of food restriction affected
the parameters that were studied in this work. Only rats in
the diestrous phase were selected based on vaginal smears
carried out on the morning of the day of sacrifice.
2.2. Euglycemic insulin-clamp studies
Clamp experiments were performed in anaesthetized rats
using a procedure described previously [18]. Briefly, after
12 h of fasting on Days 5, 10 and 15, the animals were
anaesthetized with sodium pentobarbital (50 mg/kg) and,
after a stabilization period, the left saphenous vein was
catheterized for insulin and glucose infusion. Biosynthetic
human insulin (Actaprid, Novo Nordisk, Denmark) was in-
fused at a constant rate of 20 Al/min (0.4 IU/kg/h) and the
blood glucose level was clamped at the value measured in the
basal state by a variable infusion of glucose (12% solution).
Plasma insulin was measured using a radioimmunoassay
kit for rat insulin (DGR Instruments, Germany). The
sensitivity of the assay was 0.1 ng/ml and the intra-assay
coefficient of variation was 9.32%. The sample was assayed
in duplicate. All samples were measured on the same day.
Finally, samples of skeletal muscle (flexor digitorum
superficialis, extensor digitorum longus, soleus and exten-
sor digitorum lateralis) and adipose tissue (retroperitoneal
and epididymal) were collected and frozen immediately in
liquid nitrogen for use in future experiments. The animals
were sacrificed by bleeding.
2.3. Preparation of extracts from adipose and muscle tissues
and Western blot analysis
The samples of skeletal muscle and adipose tissue
(100 mg) were prepared as described previously [19,20].
Briefly, the samples were washed with ice-cold phosphate-
buffered saline and homogenized immediately in 3 ml of
lysis buffer (50 mM Tris–HCl (pH 7.5), 150 mM NaCl, 1%
Nonidet P40 (Roche Diagnostics, Barcelona, Spain), 0.05%
sodium deoxycholate and 1 mM sodium orthovanadate at
48C. The extracts were centrifuged at 12000�g at 48C for
10 min and the protein content was determined using the
Bradford dye-binding method [21]. Similar-sized aliquots
(30 Ag for skeletal muscle and 60 Ag for adipose tissue) weresubjected to SDS-PAGE (8% Tris-Acri-Bis) and the proteins
were electrotransferred from the gel onto nitrocellulose
T
G
F
B
G
In
V
O
0
5
10
15
20
25
30
C R5 R10 R15
mg
/ min
x K
g
α
♥
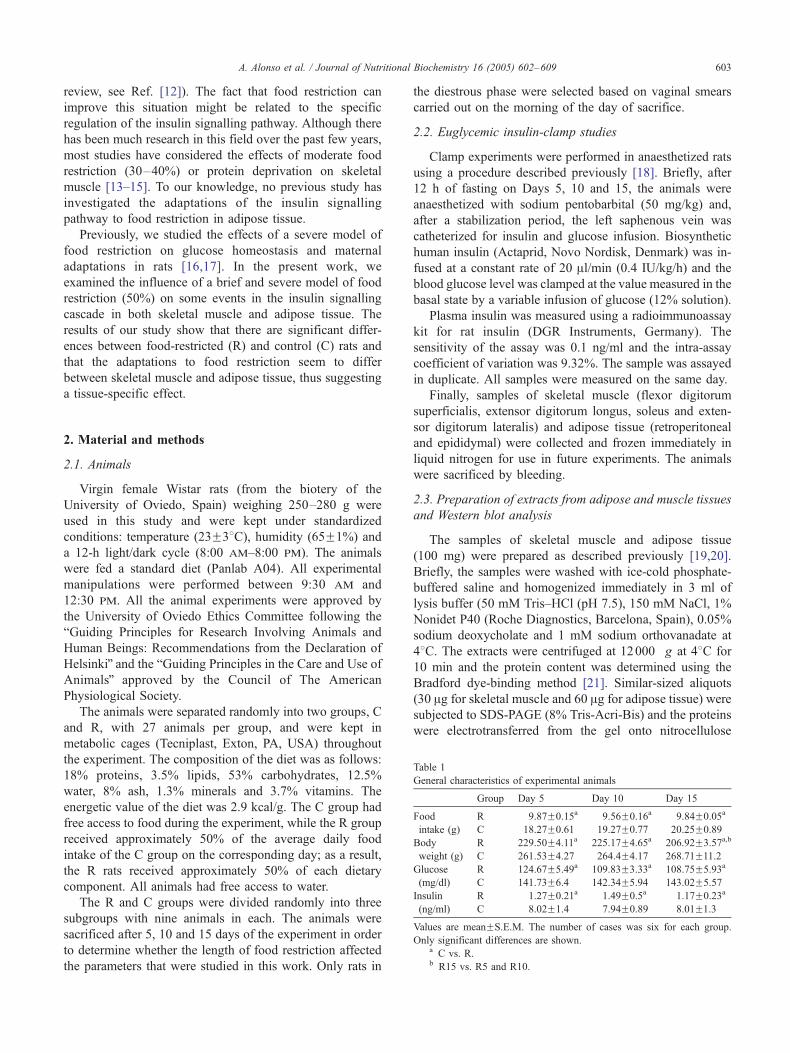
Fig. 1. Comparison of glucose infusion rates of C and R rats (R5, R10 and
R15). Glucose infusion rate was assessed as the mean value from 40 to
60 min during euglycemic/hyperinsulinemic clamp experiments. C5, C10
and C15 animals are shown like a single group because we have not found
significant differences in the glucose infusion rate. Values are meanFS.E.M.
for six animals, except for the C group where there were 18 animals. Only
significant differences are shown. (r) C vs. R5, R10 and R15; (a) R15 vs.
R5 and R10.
A. Alonso et al. / Journal of Nutritional Biochemistry 16 (2005) 602–609604
membranes (Hybond-ECL, Amersham Pharmacia Biotech,
Barcelona, Spain) as described by Towbin et al. [22].
Nonspecific protein binding to the nitrocellulose membranes
was reduced by preincubating the filter in blocking buffer
(TNT; 7% BSA) and probing was carried out using
a 1:75 000 dilution of anti-phosphotyrosine antibody
050
100150200250
C R5
C R5
R10 R15
A
A.S
.U.
050
100150200250
A.S
.U.
C R5 R10 R15
C R5 R10 R15
R10 R15
C
♥
♥
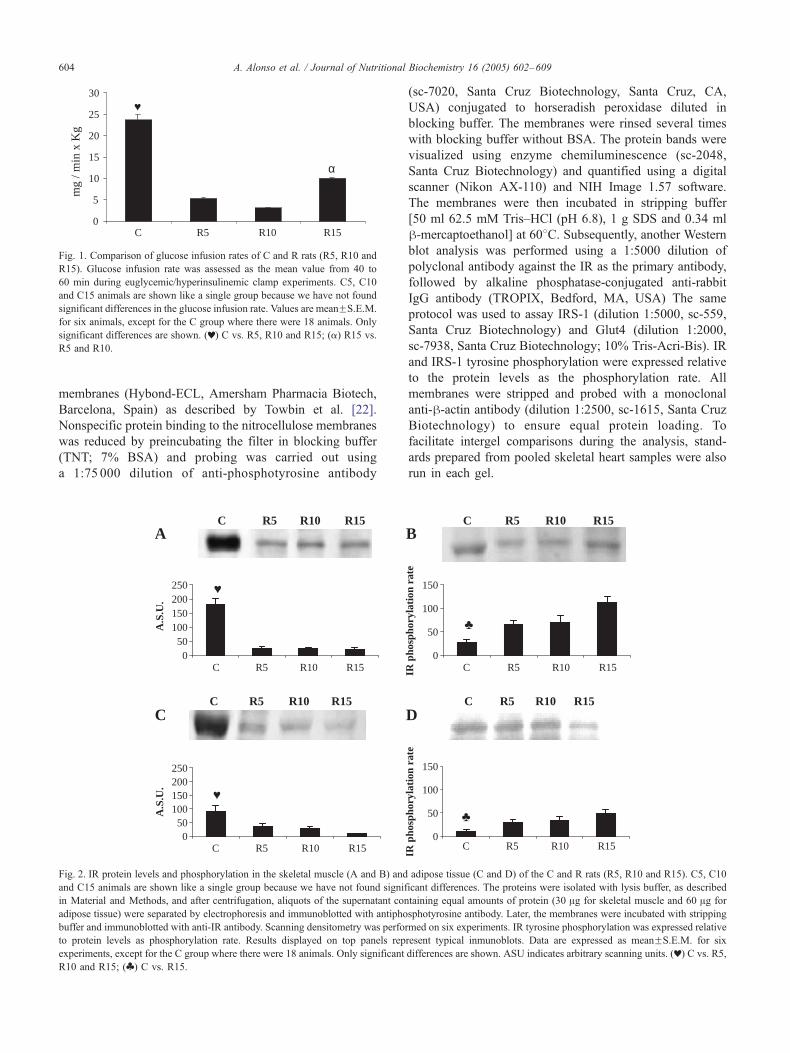
Fig. 2. IR protein levels and phosphorylation in the skeletal muscle (A and B) and
and C15 animals are shown like a single group because we have not found signif
in Material and Methods, and after centrifugation, aliquots of the supernatant con
adipose tissue) were separated by electrophoresis and immunoblotted with antipho
buffer and immunoblotted with anti-IR antibody. Scanning densitometry was perfo
to protein levels as phosphorylation rate. Results displayed on top panels rep
experiments, except for the C group where there were 18 animals. Only significant
R10 and R15; (w) C vs. R15.
(sc-7020, Santa Cruz Biotechnology, Santa Cruz, CA,
USA) conjugated to horseradish peroxidase diluted in
blocking buffer. The membranes were rinsed several times
with blocking buffer without BSA. The protein bands were
visualized using enzyme chemiluminescence (sc-2048,
Santa Cruz Biotechnology) and quantified using a digital
scanner (Nikon AX-110) and NIH Image 1.57 software.
The membranes were then incubated in stripping buffer
[50 ml 62.5 mM Tris–HCl (pH 6.8), 1 g SDS and 0.34 ml
h-mercaptoethanol] at 608C. Subsequently, another Western
blot analysis was performed using a 1:5000 dilution of
polyclonal antibody against the IR as the primary antibody,
followed by alkaline phosphatase-conjugated anti-rabbit
IgG antibody (TROPIX, Bedford, MA, USA) The same
protocol was used to assay IRS-1 (dilution 1:5000, sc-559,
Santa Cruz Biotechnology) and Glut4 (dilution 1:2000,
sc-7938, Santa Cruz Biotechnology; 10% Tris-Acri-Bis). IR
and IRS-1 tyrosine phosphorylation were expressed relative
to the protein levels as the phosphorylation rate. All
membranes were stripped and probed with a monoclonal
anti-h-actin antibody (dilution 1:2500, sc-1615, Santa Cruz
Biotechnology) to ensure equal protein loading. To
facilitate intergel comparisons during the analysis, stand-
ards prepared from pooled skeletal heart samples were also
run in each gel.
0
50
100
150
R10 R15
C R5
C R5IR p
hosp
hory
lati
on r
ate
0
50
100
150
IR p
hosp
hory
lati
on r
ate
C R5 R10 R15
C R5 R10 R15
R10 R15
D
B
♣
♣
adipose tissue (C and D) of the C and R rats (R5, R10 and R15). C5, C10
icant differences. The proteins were isolated with lysis buffer, as described
taining equal amounts of protein (30 Ag for skeletal muscle and 60 Ag for
sphotyrosine antibody. Later, the membranes were incubated with stripping
rmed on six experiments. IR tyrosine phosphorylation was expressed relative
resent typical inmunoblots. Data are expressed as meanFS.E.M. for six
differences are shown. ASU indicates arbitrary scanning units. (r) C vs. R5,
A. Alonso et al. / Journal of Nutritional Biochemistry 16 (2005) 602–609 605
2.4. Statistics
The data are expressed as meanFS.E.M. Intergroup
comparisons for each day of experimentation were per-
formed using the Student–Newman–Keuls test. Intergroup
comparisons for the length of food restriction were
performed using analysis of variance. A P value of .05 or
less was considered statistically significant. All statistical
analyses were performed using SPSS (v.6.01) for Windows.
In some cases, the C group measurements at 5, 10 and
15 days are shown as a single value because no significant
differences were detected between these time points in the
parameters tested during the experimental period.
3. Results
3.1. General characteristics of experimental animals
Table 1 shows the food intake values, total body weight
and glucose and insulin levels of the study animals. The
food intake values remained relatively constant throughout
the experimental period in both groups and, as expected,
were significantly higher in the C group than in the R group.
The mean body weight of the C group was significantly
higher than that of the R group. Considering body weight
0
20
40
60
80
C R5 R10 R15
C D
A.S
.U.
C R5 R10 R15
0
20
40
60
80
C R5 R10 R15
A B
A.S
.U.
C R5 R10 R15
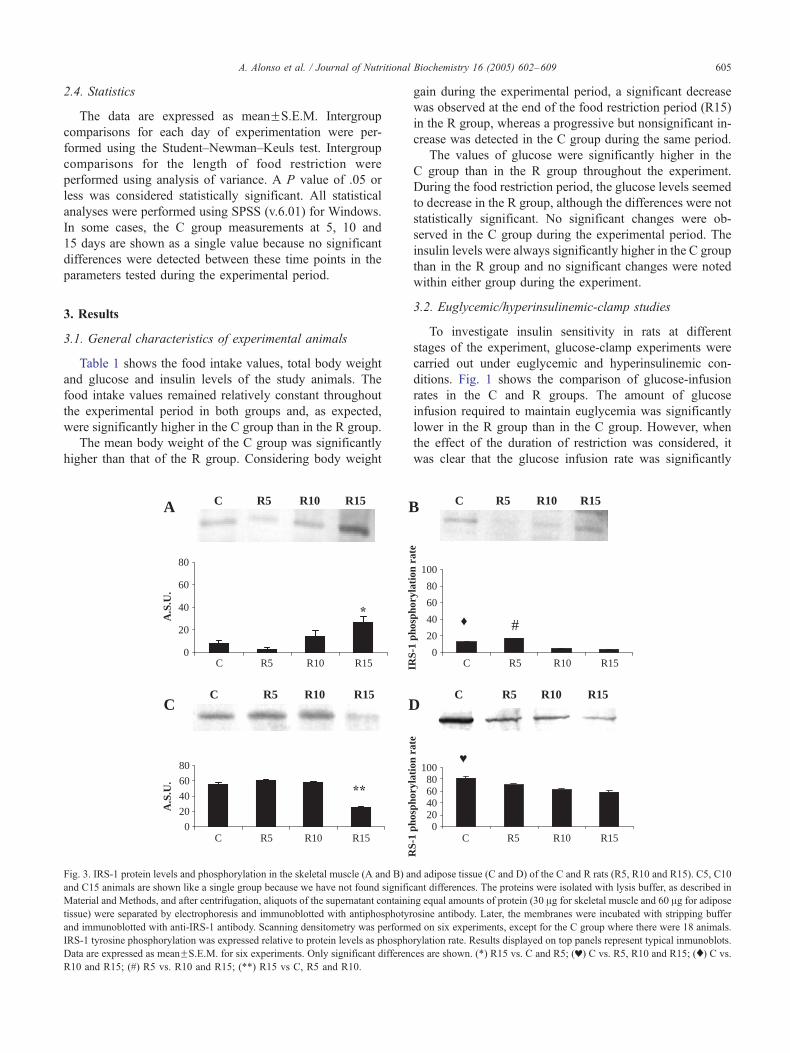
Fig. 3. IRS-1 protein levels and phosphorylation in the skeletal muscle (A and B) a
and C15 animals are shown like a single group because we have not found signific
Material and Methods, and after centrifugation, aliquots of the supernatant containi
tissue) were separated by electrophoresis and immunoblotted with antiphosphotyr
and immunoblotted with anti-IRS-1 antibody. Scanning densitometry was perform
IRS-1 tyrosine phosphorylation was expressed relative to protein levels as phospho
Data are expressed as meanFS.E.M. for six experiments. Only significant differen
R10 and R15; (#) R5 vs. R10 and R15; (**) R15 vs C, R5 and R10.
gain during the experimental period, a significant decrease
was observed at the end of the food restriction period (R15)
in the R group, whereas a progressive but nonsignificant in-
crease was detected in the C group during the same period.
The values of glucose were significantly higher in the
C group than in the R group throughout the experiment.
During the food restriction period, the glucose levels seemed
to decrease in the R group, although the differences were not
statistically significant. No significant changes were ob-
served in the C group during the experimental period. The
insulin levels were always significantly higher in the C group
than in the R group and no significant changes were noted
within either group during the experiment.
3.2. Euglycemic/hyperinsulinemic-clamp studies
To investigate insulin sensitivity in rats at different
stages of the experiment, glucose-clamp experiments were
carried out under euglycemic and hyperinsulinemic con-
ditions. Fig. 1 shows the comparison of glucose-infusion
rates in the C and R groups. The amount of glucose
infusion required to maintain euglycemia was significantly
lower in the R group than in the C group. However, when
the effect of the duration of restriction was considered, it
was clear that the glucose infusion rate was significantly
C R5 R10 R150
20406080
100
RS-
1 ph
osph
oryl
atio
n ra
te
C R5 R10 R15
C R5 R10 R150
20
40
60
80
100
IRS-
1 ph
osph
oryl
atio
n ra
te
C R5 R10 R15
#
♥
♦
nd adipose tissue (C and D) of the C and R rats (R5, R10 and R15). C5, C10
ant differences. The proteins were isolated with lysis buffer, as described in
ng equal amounts of protein (30 Ag for skeletal muscle and 60 Ag for adiposeosine antibody. Later, the membranes were incubated with stripping buffer
ed on six experiments, except for the C group where there were 18 animals.
rylation rate. Results displayed on top panels represent typical inmunoblots.
ces are shown. (*) R15 vs. C and R5; (r) C vs. R5, R10 and R15; (x) C vs.
020406080
100
C R5 R10 R15
C R5 R10 R15 C R5 R10 R15
C R5 R10 R15
A
A.S
.U.
#
#
0
20
40
60
80
100
B
A.S
.U.
♥
♥
♠
♠
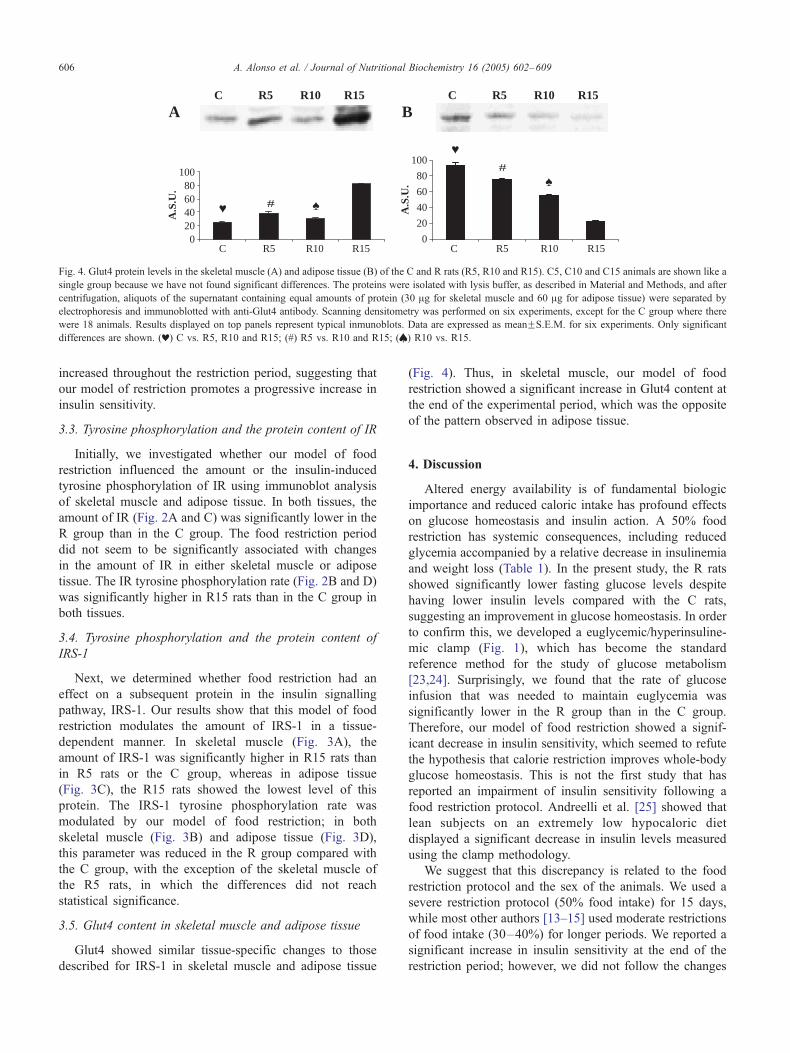
Fig. 4. Glut4 protein levels in the skeletal muscle (A) and adipose tissue (B) of the C and R rats (R5, R10 and R15). C5, C10 and C15 animals are shown like a
single group because we have not found significant differences. The proteins were isolated with lysis buffer, as described in Material and Methods, and after
centrifugation, aliquots of the supernatant containing equal amounts of protein (30 Ag for skeletal muscle and 60 Ag for adipose tissue) were separated by
electrophoresis and immunoblotted with anti-Glut4 antibody. Scanning densitometry was performed on six experiments, except for the C group where there
were 18 animals. Results displayed on top panels represent typical inmunoblots. Data are expressed as meanFS.E.M. for six experiments. Only significant
differences are shown. (r) C vs. R5, R10 and R15; (#) R5 vs. R10 and R15; (h) R10 vs. R15.
A. Alonso et al. / Journal of Nutritional Biochemistry 16 (2005) 602–609606
increased throughout the restriction period, suggesting that
our model of restriction promotes a progressive increase in
insulin sensitivity.
3.3. Tyrosine phosphorylation and the protein content of IR
Initially, we investigated whether our model of food
restriction influenced the amount or the insulin-induced
tyrosine phosphorylation of IR using immunoblot analysis
of skeletal muscle and adipose tissue. In both tissues, the
amount of IR (Fig. 2A and C) was significantly lower in the
R group than in the C group. The food restriction period
did not seem to be significantly associated with changes
in the amount of IR in either skeletal muscle or adipose
tissue. The IR tyrosine phosphorylation rate (Fig. 2B and D)
was significantly higher in R15 rats than in the C group in
both tissues.
3.4. Tyrosine phosphorylation and the protein content of
IRS-1
Next, we determined whether food restriction had an
effect on a subsequent protein in the insulin signalling
pathway, IRS-1. Our results show that this model of food
restriction modulates the amount of IRS-1 in a tissue-
dependent manner. In skeletal muscle (Fig. 3A), the
amount of IRS-1 was significantly higher in R15 rats than
in R5 rats or the C group, whereas in adipose tissue
(Fig. 3C), the R15 rats showed the lowest level of this
protein. The IRS-1 tyrosine phosphorylation rate was
modulated by our model of food restriction; in both
skeletal muscle (Fig. 3B) and adipose tissue (Fig. 3D),
this parameter was reduced in the R group compared with
the C group, with the exception of the skeletal muscle of
the R5 rats, in which the differences did not reach
statistical significance.
3.5. Glut4 content in skeletal muscle and adipose tissue
Glut4 showed similar tissue-specific changes to those
described for IRS-1 in skeletal muscle and adipose tissue
(Fig. 4). Thus, in skeletal muscle, our model of food
restriction showed a significant increase in Glut4 content at
the end of the experimental period, which was the opposite
of the pattern observed in adipose tissue.
4. Discussion
Altered energy availability is of fundamental biologic
importance and reduced caloric intake has profound effects
on glucose homeostasis and insulin action. A 50% food
restriction has systemic consequences, including reduced
glycemia accompanied by a relative decrease in insulinemia
and weight loss (Table 1). In the present study, the R rats
showed significantly lower fasting glucose levels despite
having lower insulin levels compared with the C rats,
suggesting an improvement in glucose homeostasis. In order
to confirm this, we developed a euglycemic/hyperinsuline-
mic clamp (Fig. 1), which has become the standard
reference method for the study of glucose metabolism
[23,24]. Surprisingly, we found that the rate of glucose
infusion that was needed to maintain euglycemia was
significantly lower in the R group than in the C group.
Therefore, our model of food restriction showed a signif-
icant decrease in insulin sensitivity, which seemed to refute
the hypothesis that calorie restriction improves whole-body
glucose homeostasis. This is not the first study that has
reported an impairment of insulin sensitivity following a
food restriction protocol. Andreelli et al. [25] showed that
lean subjects on an extremely low hypocaloric diet
displayed a significant decrease in insulin levels measured
using the clamp methodology.
We suggest that this discrepancy is related to the food
restriction protocol and the sex of the animals. We used a
severe restriction protocol (50% food intake) for 15 days,
while most other authors [13–15] used moderate restrictions
of food intake (30–40%) for longer periods. We reported a
significant increase in insulin sensitivity at the end of the
restriction period; however, we did not follow the changes
A. Alonso et al. / Journal of Nutritional Biochemistry 16 (2005) 602–609 607
in this parameter beyond 15 days of restriction. Therefore, it
is unclear whether the differences in insulin sensitivity
described here were due to the severity or the length of the
food restriction protocol or even to both. In addition, the
present work involved female rats in the diestrous phase
and, curiously, this model of food restriction promoted a
significant decrease in plasma 17h-estradiol levels, whileplasma progesterone did not change [16]. The influence of
female sex steroids on insulin sensitivity is well established
and we have shown that the relative plasma levels of
17h-estradiol and progesterone play a pivotal role in the
regulation of insulin sensitivity [18–20]. Moreover, Gazdag
et al. [26] showed that a reduction in food intake had a
different effect on insulin-mediated glucose uptake in male
and female mice: glucose transport was increased by food
restriction in male rats but was unaffected in female rats.
Therefore, we propose that our model of food restriction
could promote a special hormonal milieu that might be
involved in the regulation of insulin sensitivity and glu-
cose homeostasis.
The R rats in our study showed a contradictory
association between hypoglycemia, insulin deficiency and
insulin resistance, suggesting that our model of food
restriction was associated with an impairment of glucose
homeostasis, as has been reported previously [27]. R rats in a
fasting state have shown a decrease in plasma glucagon
levels due to a reduction in a-cell secretion and a diminished
ability to mobilize glucose in response to glucagon [27,28].
We believe that the hypoglycemia reported in animals in our
R group could be explained in this way.
Conversely, the model of food restriction used showed a
significant increase in insulin sensitivity at the end of the
experimental period (Day 15). As explained above, plasma
insulin and glucose levels did not change during the
experiment in the R group rats, suggesting that the adaptation
to this model of restriction led to an improvement in the
insulin signalling pathway. For this reason, the next step in
our research was to study the changes in key proteins
involved in the insulin pathway in skeletal muscle and
adipose tissue (namely, IR, IRS-1 and Glut4). We selected
these particular tissues in which to study insulin signalling
for two major reasons: (1) they are the main targets of insulin
and (2) their different metabolic responses to this hormone
(lipogenic vs. nonlipogenic) might promote specific adapta-
tions to food restriction.
In both skeletal muscle and adipose tissue, we found that
the amount of IR was significantly lower in the R group
than in the C group (Fig. 2A and C). However, the relative
phosphorylation of IR increased significantly at the end of
the experimental period (Fig. 2B and D), suggesting that this
activity might be related to the increase in insulin sensitivity
observed on Day 15 of food restriction (Fig. 1). These
results are in agreement with those of Dean and Cartee [29],
who showed that a 40% food restriction significantly
increased the amount of IR tyrosine phosphorylation in
insulin-treated muscles. The reason for this increase in
phosphorylation remains unclear. Most previous studies
have shown that food restriction is not associated with a
significant increase in IR kinase activity, and it has been
suggested that reduced food intake might be related to
decreased phosphotyrosine phosphatase activity. We are
currently testing this possibility. However, the results of
Dean and Cartee and those of the present work should be
compared with caution because we used a shorter and more
restrictive protocol (50% food intake) than the said authors
(40% food intake).
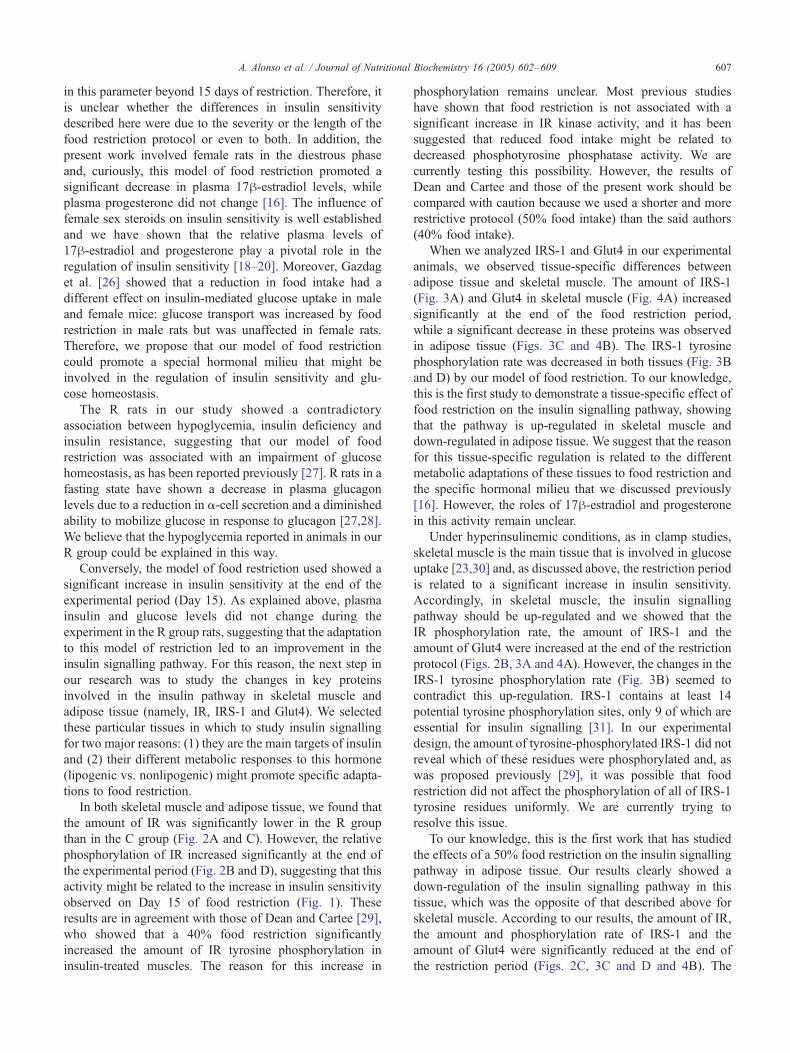
When we analyzed IRS-1 and Glut4 in our experimental
animals, we observed tissue-specific differences between
adipose tissue and skeletal muscle. The amount of IRS-1
(Fig. 3A) and Glut4 in skeletal muscle (Fig. 4A) increased
significantly at the end of the food restriction period,
while a significant decrease in these proteins was observed
in adipose tissue (Figs. 3C and 4B). The IRS-1 tyrosine
phosphorylation rate was decreased in both tissues (Fig. 3B
and D) by our model of food restriction. To our knowledge,
this is the first study to demonstrate a tissue-specific effect of
food restriction on the insulin signalling pathway, showing
that the pathway is up-regulated in skeletal muscle and
down-regulated in adipose tissue. We suggest that the reason
for this tissue-specific regulation is related to the different
metabolic adaptations of these tissues to food restriction and
the specific hormonal milieu that we discussed previously
[16]. However, the roles of 17h-estradiol and progesterone
in this activity remain unclear.
Under hyperinsulinemic conditions, as in clamp studies,
skeletal muscle is the main tissue that is involved in glucose
uptake [23,30] and, as discussed above, the restriction period
is related to a significant increase in insulin sensitivity.
Accordingly, in skeletal muscle, the insulin signalling
pathway should be up-regulated and we showed that the
IR phosphorylation rate, the amount of IRS-1 and the
amount of Glut4 were increased at the end of the restriction
protocol (Figs. 2B, 3A and 4A). However, the changes in the
IRS-1 tyrosine phosphorylation rate (Fig. 3B) seemed to
contradict this up-regulation. IRS-1 contains at least 14
potential tyrosine phosphorylation sites, only 9 of which are
essential for insulin signalling [31]. In our experimental
design, the amount of tyrosine-phosphorylated IRS-1 did not
reveal which of these residues were phosphorylated and, as
was proposed previously [29], it was possible that food
restriction did not affect the phosphorylation of all of IRS-1
tyrosine residues uniformly. We are currently trying to
resolve this issue.
To our knowledge, this is the first work that has studied
the effects of a 50% food restriction on the insulin signalling
pathway in adipose tissue. Our results clearly showed a
down-regulation of the insulin signalling pathway in this
tissue, which was the opposite of that described above for
skeletal muscle. According to our results, the amount of IR,
the amount and phosphorylation rate of IRS-1 and the
amount of Glut4 were significantly reduced at the end of
the restriction period (Figs. 2C, 3C and D and 4B). The
A. Alonso et al. / Journal of Nutritional Biochemistry 16 (2005) 602–609608
amount of white adipose tissue was greatly lowered in R
rats, and, along with several other authors [32,33], we
propose that its contribution to the overall response to
insulin could be less important than that of the skeletal
muscle under clamp experiments. It has been shown that
under severe models of food restriction, triglycerides that
are stored in adipose tissue, which are mobilized by
lipolysis, are the major energy source [34]. We believe that
the down-regulation of the insulin signalling pathway in
adipose tissue reported here suggests that this tissue is less
sensitive to the antilipolytic effects of insulin in R rats.
We do not know the precise reason for the diverse
regulation of key proteins involved in the insulin signalling
pathway. However, it was demonstrated recently that dietary
deprivation decreased IRS-1 serine phosphorylation and
increased IRS-1 tyrosine phosphorylation in skeletal muscle
[35], suggesting that the reduction in serine phosphoryla-
tion might be related to the up-regulation of the insulin
signalling pathway. We believe that this might reflect the
specific regulation of serine phosphorylation in adipose
tissue. However, further studies will be needed to identify
the serine kinase that is involved in this process.
In summary, the main finding of this study is that a
50% food restriction promotes the tissue-specific regula-
tion of the insulin signalling pathway. In skeletal muscle,
which is the main organ involved in insulin-induced glu-
cose uptake, we observed the up-regulation of several ele-
ments of this pathway such as Glut4, IRS-1 and IR
phosphorylation, while in adipose tissue, we observed the
opposite trend, suggesting down-regulation through a de-
crease in Glut4, IRS-1 and the tyrosine phosphorylation of
IR. However, further studies will be necessary to elucidate
the factors and the molecular mechanisms that are involved
in this tissue-specific regulation.
Acknowledgments
This study was supported by Fondo de Investigaciones
Sanitarias (Ref.: PI020324).
References
[1] Saltiel AR, Kahn CR. Insulin signalling and the regulation of glucose
and lipid metabolism. Nature 2001;414:799–806.
[2] Zorzano A, Sevilla L, Tomas E, Camps M, Guma A, Palacın P.
Trafficking pathway of GLUT4 glucose transporters in muscle. Int J
Mol Med 1998:263–71.
[3] Karlsson M, Thorn H, Parpal S, Stralfors P, Gustavsson J. Insulin
induces translocation of glucose transporter GLUT4 to plasma
membrane caveolae in adipocytes. FASEB J 2001;16:249–51.
[4] Watson RT, Pessin JE. Subcellular compartmentalization and traffick-
ing of the insulin-responsive glucose transporter, GLUT4. Exp Cell
Res 2001;271:75–83.
[5] Werner ED, Lee J, Hansen L, Yuan M, Shoelson SE. Insulin resistance
due to phosphorylation of insulin receptor substrate-1 at serine 302.
J Biol Chem 2004;279:35298–305.
[6] Zick Y. Uncoupling insulin signalling by serine/threonine phosphory-
lation: a molecular basis for insulin resistance. Biochem Soc Trans
2004;32:812–6.
[7] Heilbronn LK, Noakes M, Clifton PM. Effect of energy restriction,
weight loss, and diet composition on plasma lipids and glucose in
patients with type 2 diabetes. Diabetes Care 1999;22:889–95.
[8] Kemnitz JW, Roecker EB,Weindruch R, Elson DF, Baum ST, Bergman
RN. Dietary restriction increases insulin sensitivity and lowers blood
glucose in rhesus monkeys. Am J Physiol 1994;266:E540–7.
[9] Stern JS, Gades MD, Wheeldon CM, Borchers AT. Calorie restriction
in obesity: prevention of kidney disease in rodents. J Nutr 2001;131:
913S–7S.
[10] Lev-Ran A. Mitogenic factors accelerate later-age diseases: insulin as
a paradigm. Mech Ageing Dev 1998;102:95–113.
[11] Kristal BS, Yu BP. An emerging hypothesis: synergistic induction of
aging by free radicals and Maillard reactions. J Gerontol 1992;47(4):
B107–14.
[12] Masoro EJ. Caloric restriction and aging: an update. Exp Gerontol
2000;35:299–305.
[13] Gazdag AC, Sullivan S, Kemnitz JW, Cartee GD. Effect of long-term
caloric restriction on GLUT4, phosphatidylinositol-3 kinase p85
subunit, and insulin receptor substrate-1 protein levels in rhesus
monkey skeletal muscle. J Gerontol A Biol Sci Med Sci 2000;55:
B44–8.
[14] McCurdy CE, Davidson RT, Cartee GD. Brief calorie restriction
increases Akt2 phosphorylation in insulin-stimulated rat skeletal
muscle. Am J Physiol Endocrinol Metab 2003;285:E693–E700.
[15] Latorraca MQ, Reis MA, Carneiro EM, Mello MA, Velloso LA, Saad
MJ, et al. Protein deficiency and nutritional recovery modulate insulin
secretion and the early steps of insulin action in rats. J Nutr 1998;128:
1643–9.
[16] Gonzalez CG, Garcia FD, Fernandez SF, Patterson AM. Role of 17-
beta-estradiol and progesterone on glucose homeostasis: effects of
food restriction (50%) in pregnant and non pregnant rats. J Endocrinol
Invest 1997;20:397–403.
[17] Leizea JP, Gonzalez CG, Garcia FD, Patterson AM, Fernandez SF.
The effects of food restriction on maternal endocrine adaptations in
pregnant rats. J Endocrinol Invest 1999;22:327–32.
[18] Gonzalez C, Alonso A, Alvarez N, Diaz F, Martinez M, Fernandez S,
et al. Role of 17beta-estradiol and/or progesterone on insulin
sensitivity in the rat: implications during pregnancy. J Endocrinol
2000;166:283–91.
[19] Gonzalez C, Alonso A, Fernandez S, Patterson AM. Dose- and time-
dependent effects of 17beta-oestradiol on insulin sensitivity in insulin-
dependent tissues of rat: implications of IRS-1. J Endocrinol 2003;
176:367–79.
[20] Gonzalez C, Alonso A, Grueso NA, Diaz F, Esteban MM, Fernandez
S, et al. Role of 17beta-estradiol administration on insulin sensitivity
in the rat: implications for the insulin receptor. Steroids 2002;67:
993–1005.
[21] Bradford MM. A rapid and sensitive method for the quantitation of
microgram quantities utilizing the principle of protein dye binding.
Anal Biochem 1976;72:248–54.
[22] Towbin H, Staehlin J, Gordon J. Electrophoretic transfer of proteins
from polyacrylamide gels to nitrocellulose sheets. Procedure and some
applications. Proc Natl Acad Sci U S A 1979;76:4350–3.
[23] DeFronzo RA, Tobin JD, Andres R. Glucose clamp technique: a
method for quantifying insulin secretion and resistance. Am J Physiol
1979;273:E214–23.
[24] Radziuk J. Insulin sensitivity and its measurement: structural
commonalities among the methods. J Clin Endocrinol Metab 2000;
85:4426–33.
[25] Andreelli F, Lavilla M, Vega N, Riou JP, Vidal H. Regulation of gene
expression during severe caloric restriction: lack of p85alpha
phosphatidylinositol 3-kinase mRNA in skeletal muscle of patients
with type 2 diabetes (non-insulin-dependent) diabetes mellitus.
Diabetologia 2000;43:356–63.
[26] Gazdag AC, Dumke CL, Kahn CR, Cartee GD. Calorie restriction
increases insulin stimulated transport in skeletal muscle from IRS-1
knock out mice. Diabetes 1999;48:1930–6.
A. Alonso et al. / Journal of Nutritional Biochemistry 16 (2005) 602–609 609
[27] Rao RH. Fasting glucose homeostasis in the adaptation to chronic
nutritional deprivation in rats. Am J Physiol 1995;268:E873–9.
[28] Rao RH. Adaptations in glucose homeostasis during chronic
nutritional deprivation in rats: hepatic resistance to both insulin and
glucagon. Metabolism 1995;44:817–24.
[29] Dean DJ, Cartee GD. Calorie restriction increases insulin-stimulated
tyrosine phosphorylation of insulin receptor and insulin receptor
substrate-1 in rat skeletal muscle. Acta Physiol Scand 2000;169:
133–9.
[30] James DE, Burleigh KM, Kraegen EW. In vivo glucose metabolism
by individual tissues in the rat. J Biol Chem 1986;261:6366–78.
[31] Sun XJ, Miralpeix M, Myers MG, Glasheen E, Backer J, Kahn CR,
et al. Expression and function of IRS-1 in insulin signal transmission.
J Biol Chem 1992;267:22662–72.
[32] Escriva F, Rodrıguez C, Cacho J, Alvarez C, Portha B, Pascual-Leone
AM. Glucose utilization and insulin action in adult rats submitted to
prolonged food restriction. Am J Physiol 1992;26:E1–7.
[33] Wetter T, Gazdag A, Dean DJ, Cartee G. Effects of calorie restriction
on in vivo glucose metabolism by individual tissues in rats. Am J
Physiol Metab 1999;276:E728–38.
[34] Mac Donald IA, Webber J. Feeding, fasting and starvation: factors
affecting fuel utilization. Proc Nutr Soc 1995;54:267–74.
[35] Toyoshima Y, Takahashi S-I, Noguchi T, Kato HJ. Dietary protein
deprivation decreases the serine phosphorylation of insulin receptor
susbtrate-1 in rat skeletal muscle. Mol Endocrinol 2004;32:519–31.