Embed Size (px)
Citation preview

EFFECT OF FINANCIAL INCLUSION ON FINANCIAL
DEVELOPMENT IN KENYA
TABITHA WANJIRU KARANJA
D63/12093/2018
A RESEARCH PROJECT SUBMITTED IN PARTIAL
FULFILLMENT OF THE REQUIREMENTS FOR THE AWARD
OF THE DEGREE OF MASTER OF SCIENCE IN FINANCE,
SCHOOL OF BUSINESS, UNIVERSITY OF NAIROBI
AUGUST 2020

ii
DECLARATION
I, the undersigned, declare that this is my original work and has not been presented to
any institution or university other than the University of Nairobi for examination.
Signed: _____________________Date: __________________________
TABITHA WANJIRU KARANJA
D63/12093/2018
This research project has been submitted for examination with my approval as the
University Supervisor.
Signed: _____________________Date: __________________________
DR. HERICK ONDIGO
Department of Finance and Accounting
School of Business, University of Nairobi

iii
ACKNOWLEDGEMENTS
I take this opportunity to thank the almighty God for seeing me through the
completion of this project. A work of this magnitude is never accomplished without
reminiscence to our creator. In addition, I am grateful to my employer, Office of the
Auditor General through Directors Mr. George K.M’ Ringera and Mr. Andrew Kintu
for approving my examination leave days and flexible work time throughout my study
period. This invaluable support will always be a source of motivation to dedicate extra
effort to my office obligations. To my family, friends and colleagues thanks for the
tremendous support during my entire study period of this program. I would also like
to express my deepest gratitude to my supervisor Dr. Herick Ondigo for his guidance
and pieces of advice during the research project period.

iv
DEDICATION
I dedicate this work to my mom and dad Mr. and Mrs. Nelson Karanja. Your prayers
and encouragement were a source of inspiration throughout the study period. To my
husband Humphrey Mashedi and my children Aiden and Alayna who have been
affected in every way possible by this quest, thank you very much for the love,
patience and sacrifices that you have made for me. I have been forced to be away
from you most of the time and at the hour of need but with your understanding,
patience and prayers, we have reached this far.

v
TABLE OF CONTENTS
DECLARATION .......................................................................................................... ii
LIST OF TABLES ................................................................................................... viii
LIST OF ABBREVIATIONS .................................................................................... ix
ABSTRACT .................................................................................................................. x
CHAPTER ONE .......................................................................................................... 1
INTRODUCTION........................................................................................................ 1
1.1 Background of the Study ...................................................................................... 1
1.1.1 Financial Inclusion ........................................................................................ 2
1.1.2 Financial Development .................................................................................. 3
1.1.3 Financial Inclusion and Financial Development ........................................... 4
1.1.4 Financial Inclusion and Financial Development in Kenya ............................ 5
1.2 Research Problem ................................................................................................ 7
1.3 Research Objective .............................................................................................. 9
1.4 Value of the Study ................................................................................................ 9
CHAPTER TWO ....................................................................................................... 10
LITERATURE REVIEW ......................................................................................... 10
2.1 Introduction ........................................................................................................ 10
2.2 Theoretical Framework ...................................................................................... 10
2.2.3 Financial Inclusion Theory .......................................................................... 10
2.2.2 Financial Intermediation Theory ................................................................. 12
2.2.3 Finance Led Growth Theory ........................................................................ 13
2.3 Determinants of Financial Development ........................................................... 13
2.3.1 Financial Inclusion ...................................................................................... 14
2.3.2 Economic Growth ........................................................................................ 15
2.3.3 Balance of Payments ................................................................................... 16
2.3.4 Interest Rates ............................................................................................... 17

vi
2.4 Empirical Review ............................................................................................... 17
2.4.1 Global Studies.............................................................................................. 17
2.4.2 Local Studies ............................................................................................... 19
2.5 Conceptual Framework ...................................................................................... 21
2.6 Summary of the Literature Review .................................................................... 22
CHAPTER THREE ................................................................................................... 23
RESEARCH METHODOLOGY ............................................................................. 23
3.1 Introduction ........................................................................................................ 23
3.2 Research Design ................................................................................................. 23
3.3 Data Collection .................................................................................................. 23
3.4 Diagnostic Tests ................................................................................................. 24
3.4.1 Multicollinearity .......................................................................................... 24
3.4.2 Autocorrelation ............................................................................................ 24
3.4.3 Heteroskedasticity ....................................................................................... 25
3.4.4 Normality Test ............................................................................................. 25
3.5 Data Analysis ..................................................................................................... 26
3.5.1 Analytical Model ......................................................................................... 26
3.5.2 Tests of Significance .................................................................................... 27
CHAPTER FOUR ...................................................................................................... 28
DATA ANALYSIS, RESULTS AND FINDINGS .................................................. 28
4.1 Introduction ........................................................................................................ 28
4.2 Descriptive Analysis .......................................................................................... 28
4.3 Diagnostic Tests ................................................................................................. 29
4.4 Correlation Analysis .......................................................................................... 31
4.5 Regression Analysis ........................................................................................... 34
4.6 Discussion of Research Findings ....................................................................... 36

vii
CHAPTER FIVE: SUMMARY, CONCLUSION AND RECOMMENDATIONS
...................................................................................................................................... 39
5.1 Introduction ........................................................................................................ 39
5.2 Summary ............................................................................................................ 39
5.3 Conclusion ......................................................................................................... 40
5.4 Recommendation for Policy and Practice .......................................................... 41
5.5 Limitations of the Study ..................................................................................... 42
5.6 Suggestions for Further Research ...................................................................... 43
REFERENCES ........................................................................................................... 45
APPENDICES ............................................................................................................ 51
Appendix I: Research Data ...................................................................................... 51
viii
LIST OF TABLES
Table 4.1: Descriptive Statistics .................................................................................. 28
Table 4.2: Multicollinearity Test for Tolerance and VIF ............................................ 29
Table 4.3: Normality Test ............................................................................................ 30
Table 4.4: Autocorrelation Test ................................................................................... 31
Table 4.5: Heteroskedasticity Test ............................................................................... 31
Table 4.6: Correlation Analysis ................................................................................... 33
Table 4.7: Model Summary ......................................................................................... 34
Table 4.8: Analysis of Variance................................................................................... 34
Table 4.9: Model Coefficients ..................................................................................... 35

ix
LIST OF ABBREVIATIONS
ANOVA Analysis of Variance
ATM Automated Teller Machine
CBK Central Bank of Kenya
FD Financial Development
FGLS Feasible Generalized Least Squares
FI Financial Inclusion
GDP Gross Domestic Product
GOK Government of Kenya
IMF International Monetary Fund
KNBS Kenya National Bureau of Statistics
LR Likelihood Ratio
MTP Medium Term Plan
OIC Organization of Islamic Countries
OLS Ordinary Least Squares
SDG Sustainable Development Goals
SPSS Statistical Package for Social Sciences

x
ABSTRACT
Over the recent years, a lot of attention has been drawn to financial inclusion in
efforts aimed on stimulating economic development sustainability and elimination of
poverty, and it has become a topic of great importance. The main reason for this is the
awareness that about 2 billion adults across the globe continue to lack access to
financial services hence slowing down the social as well as economic development. It
has been noted that lack of accessibility of financial services leads to inabilities of
households to invest in activities like education and business. Henceforth the
likelihood of increasing future levels of income, financial development and economic
growth is lowered. This research sought to determine the effect of financial inclusion
on financial development in Kenya. The independent variable for the study was
financial inclusion operationalized as agency banking, mobile banking, bank
branches, ATMs and number of microfinance institutions. The control variables were
economic growth rate represented by economic growth rate, balance of payments
represented by current account deficit and interest rates measured as the average bank
lending rate on a quarterly basis. The dependent variable was financial development
measured as a ratio of credit lending to the private sector to GDP. A period of 10
years between January 2010 and December 2019 was studied through gathering of
secondary data. Descriptive research design was employed while multiple linear
regressions model was applied in analysis of the association between the variable. The
data was analyzed by use of SPSS version 23. An R-Square value of 0.740 was
produced from the study results which meant that 74 percent of the disparity in
financial development in Kenya can be explained by the eight independent variables
while 26 percent in the disparity of financial development was related to the variables
that were not part of this study. ANOVA results show that the F statistic was
significant at 5% level with a p=0.000. Henceforth, the model was appropriate in
explaining the relationship between the specified variables. In addition, it was
revealed that bank branches, economic growth rate and balance of payments
established positive and statistically significant values for this study while agency
banking, mobile banking, ATMs and number of MFIs produced positive but
statistically insignificant values for this study. Finally, interest rates produced
negative and not statistically influence on financial development in Kenya. It is the
recommendation of this study that measures be put in place to enhance bank branches,
economic growth rate and balance of payments as these measures have a significant
influence on financial development in Kenya.

1
CHAPTER ONE
INTRODUCTION
1.1 Background of the Study
Over the recent years, a lot of attention has been drawn to financial inclusion in
efforts aimed on stimulating economic development sustainability and elimination of
poverty, and it has become a topic of great importance. Over fifty national-level,
policy making and regulatory bodies by the year 2013 had promised to adopt
strategies of financial inclusion to stimulate their economic development (Cihak &
Singh, 2013). The main reason for this is the awareness that about 2 billion adults
across the globe continue to lack access to financial services hence slowing down the
social as well as economic development (World Bank, 2017). It has been noted that
lack of accessibility of financial services leads to inabilities of households to invest in
activities like education and business. Henceforth the likelihood of increasing the
future levels of income, Financial Development (FD) and economic growth is lowered
(Griffith-Jones et al., 2013). Klapper (2016) contended that in achievement of the
sustainability Development Goals financial inclusion plays an important role in
enabling it, majorly by creation of jobs, contracting the gender gap and improved
accessibility of health services that consequently lead to FD.
This research was based on various theories including the financial intermediation
theory, finance led growth theory and financial inclusion theory that have sought to
explain the associations between financial inclusion and FD. The theory of financial
inclusion by Ramo (2013) posits that the liberalization of the financial sector
promotes financial inclusion which subsequently leads to FD. The financial
intermediation theory by Mises (1912) supports this study in that banks and other

2
financial institutions enhances financial inclusion by developing channels aimed at
reaching the unbanked members of the society. The finance led growth theory is
founded on the idea that financial sector acts as a catalyst to resource mobilization and
enhances effective resource utilization through saving and investment. Saving and
investments are perceived to be key elements of FD (Gberevbie, 2011).
Kenya’s vision 2030 key elements were establishment of an international financial
services’ centers and deepening of capital markets as flagship projects for attainment
of growth targets (GOK, 2007). The Vision 2030 for financial sectors envisages a
globally competitive and vibrant financial sector fostering high levels of savings and
financing the Country’s investment needs. One of the specific goals have been to see
a rise in the bank deposits to 80% from 44% of GDP and decrease the proportion of
the population that lack access to finance from 85% to below 70%. Despite the
improvements noted in the financial sector in Kenya, credit lending to private sector
declined to about 14 % of GDP in 2017 (CBK, 2019). It is therefore imperative to
investigate whether financial inclusion which has been on the rise has an effect on FD
in Kenya.
1.1.1 Financial Inclusion
Joshi (2010) definition of Financial Inclusion (FI) as the provision of a variety of
financial products at affordable cost and to all segment of the society especially the
lower income earners. Triki and Faye (2013), defines FI as all initiatives which make
formal financial services readily available, easily accessible and affordable to all
subgroups of the population in a particular country. FI is also defined as the procedure
which ensures accessibility, availability, and utilization of financial systems by
members of an economy (Sarma 2008). FI entails extending affordable financial

3
services and products to not only member of the economy but especially to those that
appear to be left out (UshaThorat, 2007).
The concept of sustainable and inclusive economic growth is multifaceted concept
which considers FI as one of the key component. In order to spur a sustainable and
inclusive economic growth, it is paramount to rethink how avail relevant financial
instruments and services for the benefit of the poor and other less fortunate groups in
the society (Triki & Faye, 2013). As a result, the importance of an all-inclusive
financial system is generally acknowledged in the policy circle and has become a
central factor in the formulation of financial policy in many countries.
Financial inclusion is often measured by assessing the number of people that own and
utilize formal financial products (Klapper, El-Zoghbi & Hess, 2016). Demirguc-Kunt
et al. (2018) used the number of adults that held accounts with financial institution in
different countries across the globe to measure FI in their contribution to Global
Findex Database. This study will measure FI as the number of agency banking outlets,
number of Automated Teller Machines (ATMs), number of mobile banking accounts
and number of bank branches over the period of the study.
1.1.2 Financial Development
According to World Bank (2012), FD is described as the advancement of the financial
sector with respect to efficiency, debt, stability and accessibility (World Bank, 2012).
According to Roubini and Bilodeau (2008), financial development can be defined as
enabling infrastructural factors, institutions and policies whose outcome is broad and
deep access to capital and financial services and effective financial intermediation. A
good FD measurement is vital in assessing the advancement of financial sector and
articulating its subsequent impact on poverty reduction and economic growth.

4
Levine et al. (2012) cites four conventional ways that could be used to ascertain FD
which are; the size and market of financial institutions i.e. financial depth, the degree
to which financial services are utilized by individuals i.e. access, the financial
institutions’ efficiency in mediation of resources and facilitation of financial
transactions i.e. efficiency and the financial institutions’ stability. It is on this basis
that various FD parameters were established.
Ayadi, Arbak and Naceur (2013) used three FD indicators that can be used for the
measurement of FD. These included: Credit to private sector (%GDP); bank deposits
(% GDP); and stock market capitalization (% GDP). While Standley (2008) in
measuring financial market development in Sub-Saharan Africa used five indicators
to measure FD namely Deposit money- bank assets (%GDP), Value traded, Credit to
private sector (% of GDP); Turnover ratio and Market capitalization (%GDP). The
current study will use credit issued to the private sector by all financial institutions,
banks included divided by GDP as the measure for FD.
1.1.3 Financial Inclusion and Financial Development
In the current financial times, tremendous attention has been paid to the notion of FI
and its effects on FD. It has been identified that the reason why most of the countries
remain under developed is due to lack of sufficient financial support from foreign
companies, well-wishers, donors, foreign direct investors and government injection of
money to the economy through either subsidies or granting cheap loans (Rahman &
Mustafa, 2015). Globalization is among the factors which have been praised to
contribute directly towards FI and FD. This has contributed to the growth of capital
markets and foreign direct investment which has enabled investors to invest their

5
financial resources to nations of their choice leading to enhanced flow of financial
resources in an economy which affect the credit available to the private sector.
With increment in FI households are able to have easier access to borrowings and
savings products as a result of smoothing of consumption (& Yetman, 2015). Because
output volatility is eliminated, central bank has a less work in managing price
stability. Additionally, when the FI is increased it translates to a larger percentage of
economic activities that depends on interest rates, resulting to the possible greater
significance interest rates in monetary transmission (Mehrotra & Yetman, 2015).
Henceforth the monetary policy effectiveness is enhancing, suggesting the three is
increased FD.
When FI is increased on the other hand implies that there is increase in the number of
transactions which are done by the same intermediaries that exists. As a result, the
social cost of individual institutional imperfections can be expanded by the increased
intensity of participation in the financial markets. Subsequently, social and moral
hazard occurrence will possibly increase and hence jeopardize FD (De la Torre et al.,
2011). Considering this, the high number of financial intermediaries to be desirable
ought to be properly governed and there should be sufficient structure to regulate and
supervise them. Then, a greater risk that in presented to the financial markets when
there is an expansion in the local institutions number for instance rural banks or
cooperatives and this makes them be at risk against occurrences of recessions and
natural calamities (García & Jose, 2016).
1.1.4 Financial Inclusion and Financial Development in Kenya
Financial inclusion has been recognized to be significant in economic development
and reduction of poverty in the Vision 2030 economic pillar, the Kenya economic

6
blueprint and financial sector medium term plan of the duration 2012-2017 (GoK,
2003). There are empirical as well as theoretical proofs that supports this positive
linkage between financial inclusion and FD (Rajan & Zingales, 1998; DFID, 2004;
World Bank, 2002). However, there is little literature showing how FI and FD is
connected.
In 2005, the Kenya Financial Sector Deepening programme was founded with the aim
of stimulating creation of wealth and reduction of poverty by improving the financial
services accessibility for households with lower income and small scale enterprises.
Over the last five years, many financial service providers have experience increased
competitions which has led to them moving more into the low income market due to
the efforts of FSDK. Additionally, introduction of agency banking as well as mobile
banking by commercial banks have brought benefits as they are competing for the
mass market space. Moreover, the government has played a major role in coming up
with suitable regulations aimed of facilitating banking for low income and
strengthening microfinance institutions. All these have improved FI in the country
which is hypothesized to improve FD (CBK, 2018).
A report from the Central Bank of Kenya (2015) states that the country’s financial
sector has experienced significant growth both in size and complexity which has
greatly boosted the economy’s overall growth. The sector mainly constitutes of
banking, insurance, capital markets, credit and savings cooperatives and pensions.
Other key players consist of forex exchange bureaus, money remittance companies,
microfinance institutions and development finance institutions. Safety nets and
resolution organizations additionally exists and incorporate policyholders’
compensation funds for the insurance industry, for commercial microfinance bank the

7
Kenya deposits insurance and finally for the Capital Markets we have the investor
compensation fund. These are backed by CIS platforms through Financial Markets
Infrastructure (FMI) systems and CRB and a vibrant consisting trading, custodial
services platforms and payments and settlements. The total assets not including
capital markets were responsible for 83.27% in 2017 whereas equities’ market
capitalization accounted for 32.93% of nominal GDP.
1.2 Research Problem
Many researchers are becoming more interested to conduct studies on the
determinants of FD. “King and Levine (1993), Shaw (1973), McKinnon (1973),
Gurley and Shaw (1955) and Goldsmith (1969), Ghani (1992), Levine and Zervos
(1996) and DeGregorio and Giudotti (1995) support the preposition of the supply
leading hypothesis that FD is influenced by economic growth and in effect favorable
macro-economic environment. FI is perceived as the procedure which marks the
improvement of financial intermediary services in terms of quality, quantity as well as
efficiency that aids in fostering opportunities, improving lives and strengthening
economies. FI additionally promotes saving among locals which consequently lead to
FD (Babajide et al., 2015).
Kenya’s vision 2030 key elements were establishment of international financial
services’ centers and deepening of capital markets as flagship projects for attainment
of growth targets (GOK, 2007). The Vision 2030 for financial sectors envisages a
globally competitive and vibrant financial sector leading to high levels of savings and
financing of investment needs of Kenya. One of the specific goals have been to
increase bank deposits to 80% from 44% of GDP and decrease the share of population
that lack financial access from 85% to below 70%. Despite the improvements noted in

8
the financial sector in Kenya, credit lending to private sector declined to about 13% of
GDP in 2019 while FI has been on the rise (CBK, 2019). It is therefore imperative to
examine the effect that FI has of the FD in Kenya.
International studies in this area have mainly concentrated on the influence of FI on
economic growth or other related indicators. Le, Chuc and Hesary (2019) looked on
the influence of FI on financial efficiency and sustainability in Asia and found that
financial efficiency is negatively affected by increased FI whilst it influences financial
sustainability positively. Kim et al. (2018) studied the linkage between FI and
economic growth for Organization of Islamic Cooperation (OIC) countries and found
out that FI has a major role in improving the growth of the economy and there are
common causalities amongst the two variables. Sharma (2016), investigated the
connection existing between the different FI dimensions and the economic growth in
India which is an emerging economy over the timeframe 2004 to 2013. Bank services
availability, banking penetration and usage of banking services were the three main
FIs dimensions that were looked at. Most of the FI dimensions were found to be
positively connected to economic growth in the investigation.
Locally, existing studies have mainly focused on other determinants of FD without
considering how FI influences FD. Ndiang’ui (2019) focused on the influence of
macro-economic variables on FD in Kenya and found that interest rates positively and
significantly influence FD while government domestic borrowing negatively and
significantly affects FD. Ochieng’ (2018) focused on effect of government local
borrowing on the Kenyan financial sector development and concluded that
government domestic debt has a significant negative influence on FD. Mogaka (2017)
studied on the influence of government domestic debt on development of the

9
development of financial market at the East African Community and found that
government domestic debt has a significant positive effect on development of the East
African Community financial market. This research focused on the effect of FI on FD
in Kenya by answering the research question: What is the effect of FI on FD in
Kenya?
1.3 Research Objective
To determine the effect of financial inclusion on financial development in Kenya
1.4 Value of the Study
The study's results will be used as a reference point by academicians, researchers and
students that wish to conduct studies in this or related areas. More so, scholars and
researchers will benefit as this study will help them identify other areas of future
studies through listing associated topics which needs further studies and gaps that
need to be bridged.
The government and its bodies like CBK, Capital Markets Authority will benefit in
the formulation and implementation of policies and regulations that governs
operations in the financial system. Good policies in terms of macroeconomic factors
and other variables that will be found to have an influence on FD will add into the
advancement of FD and advancing of the economy as a whole.
The study’s findings will also be beneficial to investors in the financial markets as
they will get a deeper understanding on the part performed by FI on FD and take the
necessary actions to maximize their returns. Furthermore, the survey shall make
contributions to theory in terms of FI and FD.

10
CHAPTER TWO
LITERATURE REVIEW
2.1 Introduction
This section seeks to review theories that this study is based on. The section further
provides a discussion of empirical studies carried prior to the current research topic
and areas related. Determinants of FD are also discussed in the section and finally a
conceptual framework is presented to show how the study variables relates to each
other.
2.2 Theoretical Framework
Theoretical framework provides a foundation for understanding the theoretically
expected relationship among the study variables and in this case FI and FD. The
theories selected for this research are the financial inclusion theory, financial
intermediation theory and the finance led growth theory.
2.2.3 Financial Inclusion Theory
Ramo (2013) came up with this theory, which posits that the liberalization of the
financial sector promotes financial inclusion, which subsequently leads to financial
development. The financial inclusion concept is often used to describe an atomized
financial system, with no financial repression. It results from adopting appropriate
policies, such as comparing real rates of returns to real finance stock. In contrast,
shallow systems results from the challenges faced in the relative financing process.
The growth of intermediation contributes to financial inclusion (Yao, Wu, &
Kinugasa, 2015). Huang, Shi and Wu (2018) contend that an improved monetary
system has the potential to create opportunities for institutions to make profits and
from bill dealers to industrial banks and insurance firms. Financial inclusion

11
positively influences growth through the improvement potential of investments. This
link further confirms the positive role that financial liberalization had on growth.
It has been found that a sound and proper financial sector functioning contributes to a
variety of improvements in economic results, as demonstrated by Abosedra and Fakih
(2017), then by Demirguc Kunt and Levine (2009), a lot of literature exists that shows
the positive outcomes that nations with positive financial inclusion attain. The
proponents of the theory of financial inclusion, Yao et al. (2015), noted the major role
that the banking system played in economic development that was free from controls
on rates of interest and quantities common at the time. In addition, Karimo and
Ogbonna (2017), another proponent of theory of financial inclusion, indicates that the
need for high economic growth is what triggers demand in the financial sector.
According to this view, the economic improvements drive the demand for use of
money high, which subsequently promotes financial inclusion. This is to say that the
development and progress of financial markets occurs as a result of the demand for
services from the real sector.
The theory of financial inclusion is used to explain the role of financial deepening in
financial inclusion. Financial deepening facilitates financial inclusion which addresses
the basic issue of growth with equity (David-West, 2015). Financial inclusions across
the world empower the underprivileged population who are a major driver of social
and financial development. Some of the financial inclusions include money mobile
agents who act as financial intermediaries or banks branches since they have enough
balance of payments to meet customer’s need for cash deposit and withdrawal
services. This collection of agents have the ability to expand the mobile operator‘s
reach to the rural areas thereby increasing financial penetration to the unbanked

12
population in areas without a physical bank presence, hence creating a branchless
system of payment, different from the conventional bank-led business structure.
2.2.2 Financial Intermediation Theory
This theory was proposed by Mises (1912) and it contends that financial institutions,
particularly the banks performs an important role in financial intermediation. The
intermediation role of the bank involves collection of funds from customers who have
surplus funds and issues these funds to borrowers who lack enough money and
charges interest as the cost of lending to them. This relationship enables banks to
create a state of balance of payments as money is obtained from customers who have
short term maturity funds and lends to customer with long term maturity basis.
(Dewatripont, Tirole & Rochet, 2010). Mises (1912) maintains that the position of
banks as credit dealers is defined by lending the funds borrowed.
The primary role of the banks can thus be said to be financial intermediation where
they lend and borrow funds. As indicated by Mises (1912), banks participation in
financial intermediation denies them the chance to create money whereas withdrawing
from the process gives them an opportunity to create money. Conversely, Allen and
Santomero (2001) critique the theory on the basis that they see risk management as a
developing factor in the financial sector and put the concept of costs of participation
at the forefront.
The financial intermediary model's contribution to this research is that it highlights
the role played by monetary intermediaries including banks, the share market and
other financial firms that act as agents to community members and bridge the balance
of payments gap. The financial intermediaries further, play a critical role in FI
13
through circulation of financial resources leading to financial deepening and
consequently FD.
2.2.3 Finance Led Growth Theory
Finance led growth theory was first introduced by Schumpeter in 1911 when the
financial sector was limited to its activities. Previously the theory was known as the
finance-led growth hypothesis, pointed out that progress and expansion in the
financial sector as a whole performs a critical part in a nation's economic growth
(Schumpeter, 1911). The theory was founded on the idea that financial sector acts as a
catalyst to resource mobilization and financial sector mobilizes financial resources
and enhances effective resource utilization through saving and investment. Saving and
investments are perceived to be key elements of FD (Gberevbie, 2011).
This theory's proponents include Choonget al. (2010), who claim that comprehending
the association around FI and FD is a key factor in promoting a nation's economy.
The study however identified that in relation to the recent global and national
financial crisis; the governments should play a significant role in developing relevant
policies which regulate money circulation in the economy. Inflation and other harmful
activities in the economy are prone to arise when the financial sector is fully
controlling the economy. For this analysis, this concept is important as it describes the
connection between FI and FD.
2.3 Determinants of Financial Development
There are various variables that influence FD in a given country. Majority of these
factors have an effect on the economy which then has a spiral effect on the financial
system and in essence FD. The main variables expected to affect FD are discussed in

14
this section and they include; FI, economic growth, balance of payments and interest
rates (Athanasoglou, Brissimis & Delis, 2005).
2.3.1 Financial Inclusion
With increment in financial inclusion, households are able to have easier access to
borrowings and savings products as a result of smoothing of consumption (& Yetman,
2015). Because output volatility is eliminated, central bank has a less work in
managing price stability. Additionally, when the FI is increased it translates to a larger
percentage of economic activities that relies on interest rates, resulting to the possible
greater significance interest rates in monetary transmission (Mehrotra & Yetman,
2015). Henceforth the monetary policy effectiveness is enhancing, suggesting
increased FD.
When FI is increased alternatively implies that there is increase in the number of
transactions which are done by the same intermediaries that exists. As a result, the
social cost of individual institutional imperfections can be expanded by the increased
intensity of participation in the financial markets. Subsequently, social and moral
hazard occurrence will possibly increase and hence jeopardize FD (De la Torre et al.,
2011). Considering this, the high number of financial intermediaries to be desirable
ought to be properly governed and there should be sufficient structure to regulate and
supervise them. Then, a greater risk that in presented to the financial markets when
there is an expansion in the local institutions number for instance rural banks or
cooperatives and this makes them be at risk against occurrences of recessions and
natural calamities (García & Jose, 2016).

15
2.3.2 Economic Growth
Economic growth is the increment in the inflation-adjusted market value of
commodities produced in a nation over a given time frame (IMF, 2012). Ideally, it is
measured by determining the percent rise in real GDP and this is done on an annual
basis. The economic growth rate refers to geometric annual growth rate in GDP at the
beginning and end of a financial period. Undisputedly, this rate of growth is the
average trend in GDP output across the period, which ideally neglects GDP
fluctuations within the trend.
A scholarly article by Patrick (1966) depicts a dual causal links between economic
growth and financial sector development. The components of granger functioned
simultaneously. He labeled the two associations as supply-leading and demand
following hypotheses. The demand-following approach however posited a causal
association from economic growth and financial growth thus providing more evidence
on the association. Economic growth grew and increased need for financial services
boosted the financial sector’s growth. According to demand-following hypothesis, the
financial markets developed and advanced due to higher demand for their services
accruing from the expanding real economy. The development of financial markets
was perceived as a mere response to an economy that is growing. The expansion and
growth of the real sector generates new set of demands from the financial markets
which in turn increases new financial services' demand thus increasing pressures to
establish more sophisticated and large financial institutions to upcoming demands for
the services that make financial deepening a growth component in the economies’ real
sector.

16
2.3.3 Balance of Payments
Balance of payments greatly influences globalization in the modern world which
thereafter leads to FD. Liberalized trade together with capital flows is a big incentive
for financial and industrial incumbents to drive towards FD (Rajan & Zingales, 2004).
This was attributed with the decline of the government’s role in the financial sector
which resulted in unregulated openness. This forced the financial and industrial
incumbents to seek finance from unrestricted foreign markets for funding. Incumbents
advocated for FD since it attracted new opportunities from open financial markets
thus generating higher profits that diluted the effects intensified competition. They
therefore posit that trade openness is positively correlated with FD.
Trade liberalization, which is allowing the domestic markets access of foreign goods
can influence FD. Through this, as pointed by Zingales and Rajan (2004) in their
article Saving Capitalism from the Capitalists, political power of entrenched business
interest which may block instistutional changes can be weakened. Trade liberalization
lowers the capital base of firms and increases firms' competitiveness thus increasing
access from the external sources of capital. Therefore, they embrace the reforms that
facilitate more efficient and deeper financial system. This coincides with the findings
that a positive association exists between a deeper financial sector and trade openness
(Svaleryd & Vlachos, 2002; Rajan & Zingales, 2004). Financial deepening is also
promoted free trade as corruption practices are minimal. Corruption prevails during
high tariffs since importers exhibit incentives for payment of customs officials to
evade tariffs through smuggling.
17
2.3.4 Interest Rates
The government in the developing countries is the one which spearheads investment
and real interest rate is the key factor which influences investment. Interest rates
might affect the financial growth that subsequently might lower the growth rate. In the
event of high interest rates in the financial markets, many people feel discouraged
from getting loans for investments and other development activities will be stagnated
(Quinn & Toyoda, 2008).
However, no logical conclusion has been derived from studies on the association
between interest rate, finance development and growth in most developing nations
(Obstfeld, 2009; Kose et al., 2009; Quinn & Toyoda, 2008). These diverse findings
have mainly been attributed to differences in the type of interest rate measure, country
coverage, the sample period, and methodologies employed.
2.4 Empirical Review
Although there are many empirical studies done locally as well as globally on FD of
an economy, most of the studies have concentrated on the influence of FD on the
economic growth or other determinants of FD without focusing on how FI influence
FD. The studies that address this relationship have been carried out in varying
contexts and their results cannot be assumes to be the same in the local context.
2.4.1 Global Studies
Khalfaoui (2015) undertook an investigation to find the main FD determinants in
growing economies. The findings identified institutional variables (financial and
banking sector) and the degree of human and economic development as the core
determinants while the core determinants of FD in growing nations were identified as
legal framework, economic stability and other components of the institutional

18
framework. FD was measured using the level of lending advanced to the private
sector while the variables employed for banking and financial sector included
financial structure, inflation, non-performing loans, broad money, legal framework,
market capitalization, trade openness, index for credit information and current account
deficit.
Sharma (2016) investigated the connection existing between the different FI
dimensions and the economic growth in India which is an emerging economy over the
timeframe 2004 to 2013. Banking services availability, banking penetration and usage
of banking services were the three main FI’s dimensions that were looked at. Most of
the FI dimensions were found to be positively connected to economic growth in the
investigation. Granger causality analysis revealed that a causal relationship amongst
economic development and geographic outreach and a unidirectional causality with a
number of deposits/loan accounts to GDP was also revealed.
Ibrahim (2017) studied on the influence that FD had on the economic growth in Sub-
Saharan Africa. The conclusion of the study development of the financial sector was
anticipated to have notable contribution to economic growth by providing enhanced
quantity and quality of financial services and that higher level of finance leads to long
run growth and so is human capital and overall income level. The study signifies the
importance of FD in changing how the economy should operate for economic growth
to be realized.
Kim et al. (2018) investigated the connection amongst FI and the economic growth
for OIC countries. In measuring the main factors of FI, five variables were used which
included; bank branches per 100,000 adults, automated teller machines per 100,000
adults, borrowers and deposits account from commercial banks per 1000 adults, and

19
the volume of life insurance premium volume compared to GDP. From the outcomes
of the analysis on the 55 OIC countries, it was revealed that FI plays a major part in
promotion of economic growth and there are common causalities amongst the two
variables.
Le et al. (2019) investigated the FI trend in Asia and how it affects financial
sustainability and financial efficiency. 31 Asians were used as a sample in the study
and the period of study was 2004 to 2016. The trend was found to be fluctuating
around countries and no strong relationship was established in most circumstances.
The outcomes were strong to various standardization practices. Additionally, the
study employed Feasible Generalized Least Squares (FGLS) in analyzing the effect of
FI on financial sustainability and financial analysis. From the outcomes it was
revealed that FI affects financial efficiency negatively whilst it positively affected
financial sustainability. Similar results were revealed in all the samples and also in
the two subsamples of countries that had varying levels of income.
2.4.2 Local Studies
A study by Aduda, Murayi and Chogii (2014) explored the impact of capital market
development on Kenya’s FD. The study’s goal was to access the impact of extension
of money related improvements by the Capital Market in Kenya. The exploration
proposed five autonomous effects for extension of money by capital market extension
and one factor for FD. The research annulled that three out of the cited factors had a
positive association with GDP and was therefore an asset showcase depicting a major
impact on Kenya’s monetary advancement. The discoveries were however rather
unfulfilling and linking them with previous studies resulted to financial improvement.

20
The scrutiny depicted a strong association between financial advancement injections
of funds into the capital markets for potential investors.
Mogaka (2017) explored the impact of domestic public debt on financial market
development in the EAC Countries. The survey used secondary data collected for a
10-year period ranging 2007 to 2016 from World Bank website, Central banks
websites, national treasuries and the Kenya Bureau of Statistics. The survey employed
the descriptive research design. The results revealed that domestic public debt had a
significant effect on the financial market development of the East Africa Countries.
Ochieng (2018) aimed on determining the influence of government domestic
borrowing on FD in Kenya. Secondary data was used in the study that was gathered
for a 10 years done on a quarterly basis for the period ranging January 2008 to
December 2017. In analyzing the relationship of the variables descriptive research
design together with multiple linear regression was applied. The results established
that independently, interest rates, economic growth, trade openness and inflation rates
are insignificant determiners of FD in Kenya whereas government domestic
borrowing has a significant effect on FD.
Midigo (2018) explored the role of investment banking on FD in Kenya. 21
investment banks in Kenya form the population of study. The study applied
secondary data of 10-year quarterly basis period during the timeframe January 2008 to
December 2017. In analyzing the variables relationship, multiple linear regression
together with descriptive cross sectional research design was used. The results
revealed that only corporate finance service is a statistically significant determinant of
FD in Kenya.
21
Ndiang’ui (2019) centered on determining the effect of selected macro-economic
variables on FD in Kenya. Secondary data was used in the study that was gathered for
a 10 years done on a quarterly basis for the period ranging January 2009 to December
2018 on a quarterly basis. In analyzing the relationship of the variables a descriptive
research design together with multiple linear regression was applied. The results
revealed that individually interest rates both positively and significantly influence the
Kenyan FD while government domestic borrowing significantly and negatively
influences the Kenyan FD.
2.5 Conceptual Framework
The expected association between the study variables is best explained using a
conceptual model. The conceptual model developed below shows how FI and FD in
Kenya are related. The independent variable is FI with five measures namely; agency
banking, ATMs, mobile banking, microfinance institutions and branch network. The
control variables are economic growth as represented by real GDP growth rate,
balance of payment as measured by natural logarithm of exports minus imports and
interest rates as represented by the average bank lending rates. The dependent variable
that the research seeks to explain is FD as characterized by the ratio of credit issued to
the private sector by financial institutions divided by GDP on a quarterly basis.

22
Figure 2.1: The Conceptual Model
Independent variable Dependent variable
Financial Inclusion
• Agency banking
• ATMs
• Mobile banking
• No. of MFIs
• Bank branch network
Source: Researcher (2020)
2.6 Summary of the Literature Review
In this chapter the theories which anchors this study has been discussed and they
comprise of; financial inclusion theory, financial intermediation theory and finance
led growth theory. Also, the determinants of FD have also been discussed in this
section. Literature review has additionally looked into the previous studies undertaken
in the same or related areas in the empirical review section. From the empirical
review, it is apparent that no local research has been done to explore the effect of FI
on FD in Kenya and this is the research gap the researcher leveraged on.
Financial development
• Credit to private
sector/ GDP
Control Variables
• Economic growth
(GDP growth rate)
• Balance of payments
(Ln Net exports)
• Interest rates (Average
lending rates)

23
CHAPTER THREE
RESEARCH METHODOLOGY
3.1 Introduction
In determining the effect of FI on FD, the study ought to have a research methodology
which layout the procedure through which the research was be conducted. Four
sections are incorporated in this chapter that includes the research design, the
procedure of collecting data, the diagnostics tests to validate the data and lastly the
technique of analyzing the data.
3.2 Research Design
A descriptive research design was utilized in this study to investigate the effect of FI
on FD in Kenya. The research used a descriptive research design as it enables one to
obtain the state of affairs as the actually exists (Khan, 2008). The researcher is well
familiar with the area under scrutiny but wish to learn more with respect to the nature
of relationship amongst the study variables hence this research design was the most
suitable. More so, the aim of descriptive research is provision of an authentic and
correct representation of the study variables and this aided when it comes to
responding to the research questions (Cooper & Schindler, 2008).
3.3 Data Collection
Secondary sources of data were utilized. The secondary data for the study was
retrieved from KNBS publications and from the CBK website. The quantitative data
collected included total private credit on a quarterly basis, central bank lending rate,
number agency banking outlets in the country, number of ATMS, number of mobile
banking accounts in the country and number of bank branches which were collected
from CBK website. Data on GDP, GDP growth rate, imports and exports, were

24
collected from KNBS on a quarterly basis while data on number of microfinance
institutions was collected from Sacco society regulatory authority. The secondary data
was collected for a period of 10 years from January 2010 to December 2019 on a
quarterly basis.
3.4 Diagnostic Tests
In order to ensure that no violation of the classical linear regression model
assumptions before proceeding to estimation of the equations, diagnostic tests are
performed. The violation of classical regression model’s assumptions leads to arriving
at biased and inefficient parameter estimates. The diagnostic tests conducted on the
data were Multicollinearity, autocorrelation, normality and heteroskedasticity.
3.4.1 Multicollinearity
In the study multicollinearity was ascertained with the aid of correlation matrix where
the threshold for optimum multicollinearity will be 0.8 (Gujarati, 2013; Cooper &
Schindler, 2013). Failure to account for multicollinearity results to infinite standard
errors and indeterminate regression coefficients emerge thus leading to large standard
errors. This affects the accuracy to reject or fail to reject the null hypothesis. The
severity of the multicollenarity matters lack of it during the estimation. Therefore, a
correlation coefficient exceeding 0.8 implies severe multicollinearity. If the data
failed the test, any multicolinear variable would have been dropped from the study
and a new measure selected and substituted with the variable which exhibits co-
linearity.
3.4.2 Autocorrelation
This research utilized the Wooldridge test for serial correlation to establish the
existence of autocorrelation. Serial autocorrelation often emerges during the analysis

25
of panel data and should be addressed so as to attain the correct model specification.
Wooldridge (2012) argues that ignoring serial correlation results to inefficient
parameter estimates and biased standard errors. This test’s null hypothesis states that
no serial autocorrelation exists. The FGLS estimation approach was employed when
any serial autocorrelation was noted in the data. In case the assumption was violated
the study would have employed robust standard errors in the model.
3.4.3 Heteroskedasticity
Heteroskedasticity is a CLRM assumption that should be tested and fully accounted
for if it exists. The CLRM that the error term has a constant variance. The data is said
to be homokeskedastic in the event that the error variance is not constant. Executing a
regression analysis before testing for heteroskedasticity would result parameter
estimates being unbiased and invalid standard errors. Likelihood Ratio (LR) test
invented by Wiggins and Poi (2011) was used to measure the panel level of
heteroskedasticity in this study. This tests’s null hypothesis was that there exists an
homoscedastic error variance. Rejection of the null hypothesis implies that there is
heteroskedasticity in the study data and this was factored for by testing the FGLS
model. In case, the data failed the assumption of homogeneity of variances the study
would have used robust standard errors in the model.
3.4.4 Normality Test
Normality tests for the assumption that the response variables’ residual are normally
distributed around the mean. Shapiro-wilk test and Kolmogorov-Smirnov test were
used in determining it. In the case where one of the variables is not normally
distributed it was transformed and standardized using the logarithmic transformation
method.

26
3.5 Data Analysis
After the data was collected from the numerous sources, it was arranged in way that
could assist to address the research objective. The SPSS computer package version 23
was applied in analyzing the data. The descriptive statistics calculated the measures
of central tendency as well as dispersion together with standard deviation for each
variable. Inferential statistics on the other hand entailed correlation and regression
analysis. Correlation analysis involved establishing the degree of relationship amongst
the study variables whereas regression analysis entailed knowing the cause and effect
between the variables. A multivariate regression analysis was utilized in determining
the association between the dependent variable (FD) and independent variables:
agency banking, ATMs, mobile banking, bank branches, MFIs, economic growth,
balance of payments and interest rates.
3.5.1 Analytical Model
To determine the relative significance of each of the explanatory variables with
respect to FD in Kenya, a multivariate regression model was applied.
The study employed the following multivariate regression model;
Y= α+ β1X1+β2X2+β3X3+ β4X4+ β5X5+β6X6 +β7X7 +β8X8+ε
Where:
Y = FD as measured by total credit issued to the private sector divided by GDP
on a quarterly basis.
ß0 = the regression constant (parameter of the function)
ß1, ß2, ß3, ß4, ß5, ß6, ß7 and ß8 = the coefficients of independent variables which
measures the change in dependent variable as a result of a unit change in a given
dependent variable

27
X1 = agency banking as measured by natural logarithm of the number of agency
banking outlets on a quarterly basis
X2 = mobile banking as measured by natural logarithm of the number of mobile
banking accounts on a quarterly basis
X3 = ATMs as measured by natural logarithm of the number of ATMs on a
quarterly basis
X4 = microfinance institutions as measured by natural logarithm of the number of
microfinance institutions on a quarterly basis
X5 = branch network as measured by the number of bank branch network on a
quarterly basis
X6 = economic growth as measured by GDP growth rate on a quarterly basis
X7 = balance of payments as measured by natural logarithm of total exports
minus imports on a quarterly basis
X8 = interest rates as measured by average bank lending rates on a quarterly basis
έ = the error term which shows how the observed data differs from the actual
population data
3.5.2 Tests of Significance
Parametric tests were conducted in order to determine the statistical significance of
the overall model as well as individual parameters statistical significance. The F-test
obtained from ANOVA was applied in establishing the overall model statistical
significance while that of the individual variables was obtained from the t-test.

28
CHAPTER FOUR
DATA ANALYSIS, RESULTS AND FINDINGS
4.1 Introduction
This chapter presents the analysis of the data acquired from CBK, KNBS and
SASSRA to establish how financial inclusion influence financial development in
Kenya. Using descriptive statistics, correlation and regression analyses, the research
findings were presented on tables.
4.2 Descriptive Analysis
Measures of central tendency and dispersion statistics were used. Central tendency
measured the extent to which the data on each variable were concentrated at a central
point while dispersion measured the degree to which the data were spread out from
the convergent point. The central tendency was measured by the mean while
dispersion was measured by the standard deviation. The analysis was extracted from
SPSS software for the period of 10years (2010 to 2019) on a quarterly basis. Table
4.1 shows the minimum, maximum, mean and standard deviation of each variable.
Table 4.1: Descriptive Statistics
N Minimum Maximum Mean Std.
Deviation
Financial development 40 .2099 .3427 .297338 .0354340
Agency banking 40 25956 225843 124420.275 62756.7531
Mobile banking 40 9707920 57564434 28864410.85 11667484.67
ATMs 40 1754 2623 2384.375 248.1366
MFIs - DT SACCO 40 172 215 191.425 19.6324
Interest rate 40 5.83 18 9.6937 2.83345
Bank branches 40 1022 1597 1367.475 179.0989
Balance of payments 40 -558090 33.9 -229038.513 214219.4345
GDP growth rate 40 3.50 11.6 5.8425 1.38469
Valid N (listwise) 40
Source: Research Findings (2020)

29
4.3 Diagnostic Tests
Linear regression assumes insignificant association between between pairs of
independent variables. The data on financial inclusion components, interest rates,
economic growth and balance of payments were tested for significant
Multicollinearity. Variance inflation factors (VIFs) were used in this diagnosis. Table
4.2 shows the VIF test results.
Multicollinearity is a characteristic in data that cannot be eliminated but only ought to
be as low as possible. According to Cooper and Schindler (2013) VIF values above
10.0 demonstrate significant multicollinearity between pairs of variables. Table 4.2
shows that the variance inflation factors were 2.841, 2.778, 2.551, 1.548, 2.513,
2.577, 2.660 and 2.604 for agency banking, mobile banking, ATMs, bank branches,
MFIs, economic growth, balance of payments and interest rates respectively. This
shows that there was no significant multicollinearity between the variables since none
of them was above 10.0.
Table 4.2: Multicollinearity Test for Tolerance and VIF
Collinearity Statistics
Variable Tolerance VIF
Agency banking 0.352 2.841
Mobile banking 0.360 2.778
ATMs 0.392 2.551
Bank branches 0.646 1.548
MFIs 0.398 2.513
Economic growth 0.388 2.577
Balance of payments 0.376 2.660
Interest rates 0.384 2.604
Source: Research Findings (2020)

30
Linear regression assumes normal distribution of data. Shapiro-wilk test and
Kolmogorov-Smirnov test were used. The null hypothesis for the test was that the
secondary data was not normally distributed. The researcher would reject it if the p-
value recorded was more than 0.05. Shown in Table 4.3 are the results of the test.
Table 4.3: Normality Test
Financial
development
Kolmogorov-Smirnova Shapiro-Wilk
Statistic Df Sig. Statistic Df Sig.
Agency banking .178 40 .300 .881 40 .723
Mobile banking .173 40 .300 .918 40 .822
ATMs .176 40 .300 .892 40 .784
Bank branches .173 40 .300 .918 40 .822
MFIs .175 40 .300 .874 40 .812
Economic growth .174 40 .300 .913 40 .789
BOP .176 40 .300 .892 40 .784
Interest rates .173 40 .300 .918 40 .822
a. Lilliefors Significance Correction
Source: Research Findings (2020)
Both Shapiro-Wilk and Kolmogorov-Smirnov tests revealed that the research data
was normally distributed by recording p-values greater than 0.05 and hence rejecting
the null hypothesis. The data was consequently considered fit to be used in conducting
parametric tests like Pearson’s correlation, regression analysis and ANOVA.
Autocorrelation exists where variable measures are influenced by its historical values
which makes modelling complex. Autocorrelation is equally referred to as first order
serial correlation. In this study, the Durbin Watson test was used for testing
autocorrelation. A durbin-watson statistic of 2.222 was within the acceptable range
between 1.5 and 2.5 implied that the variable residuals were not serially correlated.

31
Table 4.4: Autocorrelation Test
Model R R Square Adjusted R
Square
Std. Error of
the Estimate
Durbin-
Watson
1 .860a .740 .673 .0202777 2.222
a. Predictors: (Constant), Interest rate, Balance of payments, GDP growth
rate, ATMs, MFIs, Mobile banking, Bank branches, Agency banking
b. Dependent Variable: Financial development
Source: Research Findings (2020)
The study checked for panel level heteroskedasticity by use of the Likelihood Ratio
(LR) as indicated in the Table 4.5. This test used the null hypothesis that the error
variance was homoscedastic. A chi-square value of 32.36 was produced by the
likelihood-ratio test with a 0.0000 p-value. The chi-square value was statistically
significant at 1 percent level and in this manner the invalid speculation of consistent
fluctuation was rejected meaning the nearness of homoskedasticity in the examination
information as suggested by Poi and Wiggins (2001).
Table 4.5: Heteroskedasticity Test
Breusch-Pagan / Cook-Weisberg test for heteroskedasticity
Ho: Constant variance
Variables: fitted values of Financial development
Chi2(1) = 32.36
Prob > chi2 = 0.0000
Source: Research Findings (2020)
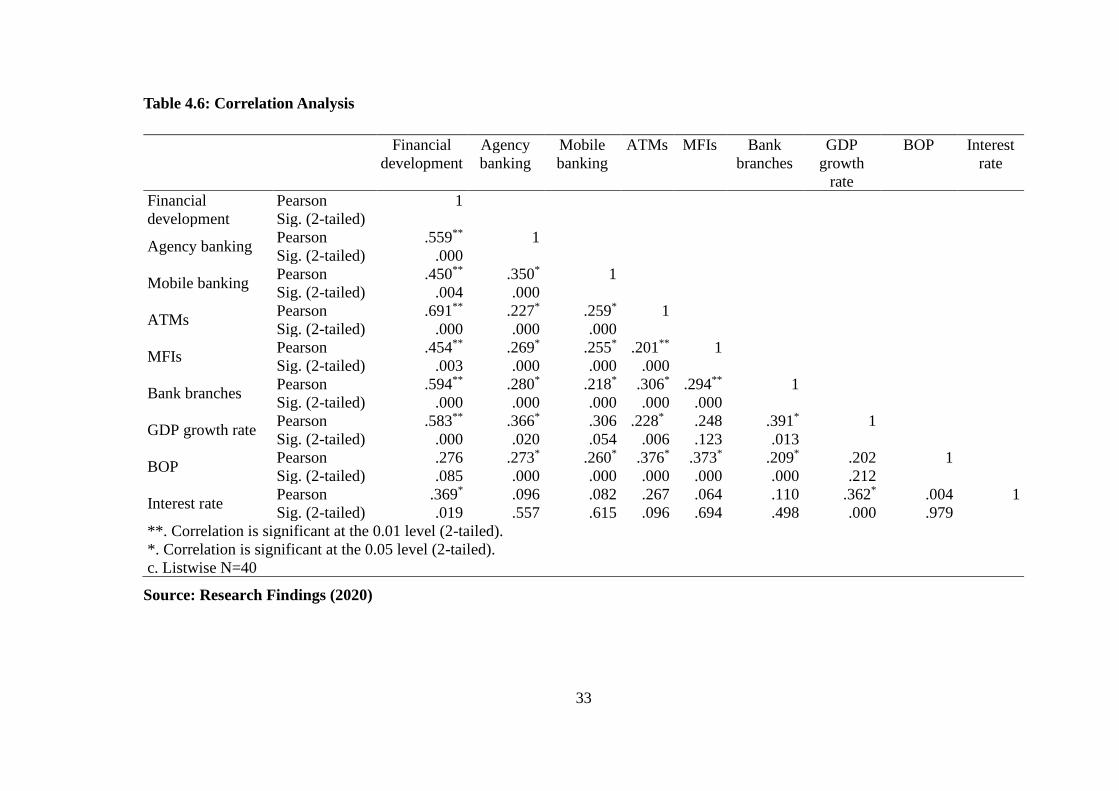
4.4 Correlation Analysis
Correlation analysis measures the relationship that exists between the variables. The
study undertakes a Pearson correlation that measures the linear relationship of
variables. A correlation of 1 show a perfect positive correlation while of 0 or value
close to zero shows no relationship or weak relationship respectively. -1 value, shows
a negative perfect relationship and values close to it have strong negative relationship.
Table 4.6 shows the value of Pearson correlations for the variables.

32
In the table, our interest is on how the dependent variable relates to the independent
variable. The correlation of agency banking against financial development is 0.559
implying that agency banking exhibits a strong positive association with financial
development. The association is also significant as shown by a p value of 0.000.
Mobile banking has a strong positive correlation with financial development. This
means that the more the transactions carried out through mobile banking, the more the
financial development.
Bank branches and ATMs also exhibited a strong positive and significant association
with performance as shown by 0.594 and 0.691 respectively. The association is
significant as the P values are less than 0.05. Number of MFIs exhibited a moderate
positive and significant association with financial development as evidenced by 0.454
and a p value less than 0.05.
Economic growth rate and interest rates exhibited positive and significant association
with financial development in Kenya as evidenced by positive correlation coefficients
and p values less than 0.05. Balance of payments however did not have a significant
association with financial development as evidenced by a p value greater than 0.05.
The correlation results further reveal that although the independent variables are
related to each other, the association is not strong enough to cause Multicollinearity.
This is evidenced by the fact no correlation between the independent variables
exceeded 0.7.
33
Table 4.6: Correlation Analysis
Financial
development
Agency
banking
Mobile
banking
ATMs MFIs Bank
branches
GDP
growth
rate
BOP Interest
rate
Financial
development
Pearson 1
Sig. (2-tailed)
Agency banking Pearson .559** 1
Sig. (2-tailed) .000
Mobile banking Pearson .450** .350* 1
Sig. (2-tailed) .004 .000
ATMs Pearson .691** .227* .259* 1
Sig. (2-tailed) .000 .000 .000
MFIs Pearson .454** .269* .255* .201** 1
Sig. (2-tailed) .003 .000 .000 .000
Bank branches Pearson .594** .280* .218* .306* .294** 1
Sig. (2-tailed) .000 .000 .000 .000 .000
GDP growth rate Pearson .583** .366* .306 .228* .248 .391* 1
Sig. (2-tailed) .000 .020 .054 .006 .123 .013
BOP Pearson .276 .273* .260* .376* .373* .209* .202 1
Sig. (2-tailed) .085 .000 .000 .000 .000 .000 .212
Interest rate Pearson .369* .096 .082 .267 .064 .110 .362* .004 1
Sig. (2-tailed) .019 .557 .615 .096 .694 .498 .000 .979
**. Correlation is significant at the 0.01 level (2-tailed).
*. Correlation is significant at the 0.05 level (2-tailed).
c. Listwise N=40
Source: Research Findings (2020)

34
4.5 Regression Analysis
So as to assess the effect of financial inclusion on financial development in Kenya,
the below model was used.
Y= α+ β1X1+β2X2+β3X3+ β4X4+ β5X5+β6X6+ β7X7+β8X8 + ε
A regression analysis was undertaken that had findings as stipulated below.
Table 4.7: Model Summary
Model R R Square Adjusted R
Square
Std. Error of
the Estimate
Durbin-
Watson
1 .860a .740 .673 .0202777 2.222
a. Predictors: (Constant), Interest rate, Balance of payments, GDP growth
rate, ATMs, MFIs, Mobile banking, Bank branches, Agency banking
b. Dependent Variable: Financial development
Source: Research Findings (2020)
In the regression model summary table, the coefficient of determination that is
denoted by R square is given as 0.740. It shows the strength in which the model is
able to forecast the dependent variable. The value indicates that 74% of the variations
in financial development can be described by the model. The other 26% can only be
described by other factors that are not in the model. The R value of 86% denotes the
relationship between the selected predictor variables and financial development.
Table 4.8: Analysis of Variance
Model Sum of
Squares
df Mean
Square
F Sig.
1
Regression .036 8 .005 11.011 .000b
Residual .013 31 .000
Total .049 39
a. Dependent Variable: Financial development
b. Predictors: (Constant), Interest rate, Balance of payments, GDP growth rate,
ATMs, MFIs, Mobile banking, Bank branches, Agency banking
Source: Research Findings (2020)

35
The significance of the model is established by matching the p value with the alpha
value. The model is said to be insignificant when the value of p is higher than that of
the alpha while the vice versa is true. The regression analysis is undertaken at 95
degrees of freedom which means the alpha value is 0.05. According to table 4.8, the p
value is shown as 0.000 which shows that it is less than the alpha value. We therefore
conclude that the relationship between the independent variables and financial
development in Kenya is statistically significant.
In order to determine whether to reject or not to reject the null hypothesis we compare
the F statistic and the calculated value of F as shown in the table 4.8. If the calculated
value is higher than the F statistic, the null hypothesis will be rejected. According to
the topic under study, the null hypothesis states that there is no effect of the selected
independent variables on financial development in Kenya. The calculated value of F
is 11.011 while the F statistic at an alpha of 0.05 and 8, and 40 degrees of freedom is
3.6. The calculated value is higher than the F statistic which means we reject the null
hypothesis. We therefore conclude that there is a statistically significant effect of
selected variables on financial development in Kenya.
Table 4.9: Model Coefficients
Model Unstandardized
Coefficients
Standardized
Coefficients
t Sig.
B Std. Error Beta
1
(Constant) -2.104 .923 -2.279 .030
Agency banking .044 .033 .795 1.333 .192
Mobile banking .015 .033 .177 .458 .650
ATMs .112 .092 .383 1.211 .235
Bank branches .354 .111 1.328 3.188 .003
MFIs .037 .072 .115 .512 .612
GDP growth rate .007 .003 .287 2.344 .026
Balance of payments .006 .000 .389 2.506 .018
Interest rate -.002 .002 -.001 -.008 .994
a. Dependent Variable: Financial development
Source: Research Findings (2020)

36
The coefficients β0, ß1, ß2, ß3, ß4, ß5, ß6, ß7 and ß8 are given by; -2.104, 0.044, 0.015,
0.112, 0.354, 0.037, 0.007, 0.006 and -0.002 respectively. The model therefore
becomes
Y = -2.104+ 0.044X1+0.015X2+0.112X3+ 0.354X4+ 0.037X5+0.007X6 +0.006X7 -
0.002X8
Where,
Y = Financial development
X1 = agency banking
X2 = mobile banking
X3 = ATMs
X4 = microfinance institutions
X5 = branch network
X6 = economic growth
X7 = balance of payments
X8 = interest rates
This model may therefore be used to show the effect of any of the independent
variables on financial development, when the variable is increased by 1 unit and all
other variables are kept constant.
4.6 Discussion of Research Findings
The study undertook a linear regression model on data collected in determining how
financial development in Kenya is influenced by financial inclusion. Diagnostic test
were first conducted on the data in order to determine presence of collinearity or
presence of residuals in autocorrelations. Collinearity test undertaken showed that all
variables had VIF values of less than 10 and therefore there was no collinearity

37
among the variables. The Durbin Watson value was 2.222 which is less than 2.5 and
therefore there were no residuals or autocorrelations that would imply error in the
model.
The Pearson correlation showed that the correlation of agency banking with
financial development was 0.559 implying that agency banking exhibits a strong
positive association with financial development. The association is also significant as
shown by a p value of 0.000. Mobile banking has a strong positive correlation with
financial development. Bank branches and ATMs also exhibited a strong positive and
significant association with performance as shown by 0.594 and 0.691 respectively.
Number of MFIs exhibited a moderate positive and significant association with
financial development as evidenced by 0.454 and a p value less than 0.05. Economic
growth rate and interest rates exhibited positive and significant association with
financial development in Kenya as evidenced by positive correlation coefficients and
p values less than 0.05. Balance of payments however did not have a significant
association with financial development as evidenced by a p value greater than 0.05.
Regression analysis undertaken discovered that the model would predict 74% of
variations in financial development in Kenya. The other 26% however would be as a
result of factors not in this model. The analysis showed that p value was less than the
alpha value and therefore the relationship was significant. The calculated value of F
was higher than F statistic making the null hypothesis to be rejected. In conclusion the
findings of the study were that there is a significant effect of the selected independent
variables on financial development in Kenya.
The findings of the study support a study done by Khalfaoui (2015) who undertook an
investigation to find the main FD determinants in growing economies. The findings

38
identified institutional variables (financial and banking sector) and the degree of
human and economic development as the core determinants while the core
determinants of FD in growing nations were identified as legal framework, economic
stability and other components of the institutional framework. FD was measured using
the level of lending advanced to the private sector while the variables employed for
banking and financial sector included financial structure, inflation, non-performing
loans, broad money, legal framework, market capitalization, trade openness, index for
credit information and current account deficit.
The findings are in contrast with Ochieng (2018) who aimed on determining the
influence of government domestic borrowing on FD in Kenya. Secondary data was
utilized in the study that was gathered for a 10 years done on a quarterly basis for the
period ranging January 2008 to December 2017. In analyzing the relationship of the
variables descriptive research design together with multiple linear regression was
applied. The results established that independently, interest rates, economic growth,
trade openness and inflation rates are insignificant determiners of FD in Kenya while
government domestic borrowing has a significant effect on FD. The study by Ochieng
(2018) had weaknesses in that the data violated the assumptions of regression analysis
such as Multicollinearity, which was not addressed.

39
CHAPTER FIVE: SUMMARY, CONCLUSION AND
RECOMMENDATIONS
5.1 Introduction
This section presents a summary of the results from the previous chapter, conclusion,
limitations encountered during the study. It also recommends policies that policy
makers can use to improve the expectations of Kenyan financial sector in regards to
the achievement of financial development. Additionally, the chapter gives
recommendations for future researchers.
5.2 Summary
The regression analysis undertaken by the study showed that there was a significant
effect of selected independent variables on FD in Kenya. The regression model that
was used was also strong as it predicted 74% of financial development in Kenya. Of
the five measures of financial inclusion, only bank branches exhibited positive and
statistically significant influence on financial development in Kenya. Mobile banking,
agency banking, ATMs and number of MFIs had a positive but insignificant effect on
financial development in Kenya.
The other independent variables in the regression model were economic growth rate,
balance of payments and interest rates that were the control variables.
Economic growth rate had a significant effect on financial development implying
that an increased economic growth rate leads to FD. Balance of payments was also
found to have a positive and significant effect on financial development in Kenya
while interest rates was found to have a negative but not statistically significant
influence on financial development in Kenya.

40
The study showed that the p value was below the alpha value of 0.05 at 0.000
implying that the overall model was statistically significant. The F statistic was also
less than the calculated value of F at 11.011 as the critical F value was at 3.6. The
results were applied to determine the significance of the relationship between the
variables and whether or not to reject or accept the null hypothesis.
5.3 Conclusion
From the findings of the study, various conclusions are made. Of the five measures of
financial inclusion adopted for this study, only the number of bank branches has a
significant positive effect on FD in Kenya. Although agency banking and mobile
banking has a positive effect on financial development in Kenya, the effect is not
statistically significant and therefore cannot be used to enhance financial development
in Kenya. Number of ATM transactions and number of MFIs in Kenya exhibited a
positive but not statistically significant influence on FD in Kenya implying that
although ATM transactions and number of MFIs has a positive influence on FD, the
influence is not statistically significant.
The regression model had a coefficient of determination (R Squared) of 74%, which
means that the model could explain up to 74% of the variations in
financial development in Kenya. Other variations in the financial development
represented by 26% are explained by other factors outside the model. The model was
found to be statistically significant and we can therefore conclude that the model is
fairly good in predicting financial development in Kenya.
Number of bank branches was found to have a significant influence on financial
development implying that the more the bank branches there is in the country, the
more the number of individuals who can access them and this leads to financial

41
development. Economic growth also exhibited a positive and significant association
with financial development and this implies that as a country records growth in GDP,
financial development increases.
The study also concludes that balance of payments significantly affects
financial development in Kenya. This implies that when the country increases its
exports as compared to the imports, this will lead to improved financial development
as evidenced in this study. This can be explained by the fact that increased exports
implies that Kenyans will be received foreign inflows and this gives them the ability
to access loans in the domestic market.
This study concurs with Le et al. (2019) who investigated the FI trend in Asia and
how it affects financial sustainability and financial efficiency. 31 Asians were used as
a sample in the study and the period of study was 2004 to 2016. The trend was found
to be fluctuating around countries and no strong relationship was established in most
circumstances. The outcomes were strong to various standardization practices.
Additionally, the study employed Feasible Generalized Least Squares (FGLS) in
analyzing the effect of FI on financial sustainability and financial analysis. From the
outcomes it was revealed that FI affects financial efficiency negatively whilst it
positively affected financial sustainability. Similar results were revealed in all the
samples and also in the two subsamples of countries that had varying levels of income
5.4 Recommendation for Policy and Practice
The study revealed that financial development in Kenya is positively and significantly
influenced by number of bank branches in the country. This implies that a country
with more bank branches is likely to record higher financial development compared to
countries with a low bank branch network. Therefore, the study recommends that

42
policy makers such as the CBK and other government agencies should come up with
policies that make it easy for banks to open branches in different parts of the country
as this will have a significant positive contribution on financial development in the
country.
The study revealed that there exists a positive and significant influence of balance of
payments on financial development in Kenya. Thus, an increase in balance of
payments would on average result to an improvement in financial development in
Kenya. This study recommends that government and other policy makers should
come up with policies that promote local production and makes it easy for locals and
other firms in Kenya to export their products. This will lead to increased balance of
payment position and in effect financial development.
The study results revealed that there is a positive influence of economic growth on
financial development in Kenya. The influence is also statistically significant. The
study recommends the need to come up with measures that can boost economic
growth as this will have an effect on the financial development. Such measures would
include boosting infrastructure development, creating a conducive environment for
doing business and ensuring political stability.
5.5 Limitations of the Study
This research study scope was ten years ranging 2010-2019. It is not guarantee that
the study findings would be the same for a period longer than 10 years. More so, it is
not guaranteed that the findings would extend beyond 2019. A period longer than ten
years would add on to the reliability of the findings since it would consider most
economic dynamics such as recessions and booms.

43
Another limitation of this study is the data used. It is difficult to conclude whether the
outcomes presented in this study are the reality of the circumstances. The data utilized
is only assumed to be accurate. The metrics used may continue to vary year to year
depending on the conditions prevailing. Also as opposed to primary data which is
usually firsthand information, the current study used secondary data in the public
domain. Lastly this study did not exhaust all factors that affect financial development
but instead centered on determinants of financial development largely because of the
challenge in obtaining data.
To undertake data analysis, this study utilized a multiple regression model. Because of
the deficiencies arising from use of regression model for instance misleading and
erroneous findings when the value of the variables changes, it is not possible for the
researcher to generalize the findings with confidence. The hypothesized association
amongst the variables might change as more data continue to be added in the
regression model.
5.6 Suggestions for Further Research
Since the current study used secondary data in studying financial inclusion and
financial development in Kenya, this study recommends that a further study be
conducted which considers primary data collected by use of interview guides or
questionnaire and broaden the context to include various players in the financial
sector so as to complement this study.
The study did not exhaust the independent variables influencing financial
development in Kenya and a recommendation is given that more studies be carried
out to factor other variables such as political stability, technological advancement,
money supply, educational levels among other variables. By determining how each

44
variable affect financial development it will aid policy makers in controlling financial
development.
This study covered the last ten years 2010-2019 because this was the latest available
data. This study suggests that further study be done covering more years for example
from 1963 to data so as to complement or disapprove the current study findings. Also
future studies might broaden the context to include countries in East Africa
community or Africa instead of Kenya alone. To conclude, because of the deficiencies
of regression model, same study may be done but use other models for example
Vector Error Correction Model (VECM).

45
REFERENCES
Aduda, J., Chogii, R. &Murayi, M.T. (2014). The effect of capital market deepening
on economic growth in Kenya: Agricultural sector development strategy.
Journal of Applied Finance & Banking, 4(1), 17-41.
Allen, F., &Santomero, A.M. (2001). What do financial intermediaries do? Journal
of Banking & Finance, 25, 271–294.
Athanasoglou, P.P., Brissimis, S.N. and M.D. Delis (2005). Bank-specific
industryspecific and macroeconomics determinants of bank profitability. Bank
of Greece Working Paper 25, June.
Athanasoglou. P., Brissimis, S., & Delis, M, (2005). Bank-Specific, Industry-Specific
and Macroeconomics Determents of Bank Profitability, Bank of Greece, No.
25.
Awry, D. (2013). Toward a supply-side theory of financial innovation. Journal
of Comparative Economics, 41(2):401-409.
Ayadi, R., Arbak, E. & Naceur S. (2013a). Financial development, bank efficiency
and economic growth across the Mediterranean, MEDPRO Technical Paper
No. 30, MEDPRO FP7 project.
Babajide, A. A., Adegboye, F. B., Omankhanlen, A. E., (2015). Financial Inclusion
and economic growth in Nigeria. International Journal of Economics and
Financial Issues, 5(3).
Beck, T., Demirgüç-Kunt, A., & Levine, R. (2003). A New Database on Financial
Development and Structure. World Bank Economic Review, 14, 597-605.
Central Bank of Kenya (2015). Statistical bulletin. Nairobi: Government press.
Central Bank of Kenya (2018). Statistical bulletin. Nairobi: Government press.
Choonget C., Toy Jun Z., & Lu Wu T. (2010). Foreign Aid, Policy Effectiveness and
Economic Growth in Tanzania, Journal of Applied Sciences, 5, 46-60
Cihak, M., & Singh, P., (2013). An analysis of national financial inclusion strategies.
Washington,D.C:World Bank. Available from
http://blogs.worldbank.org/allaboutfinance/analysis-national-financial
inclusion-strategies [Accessed 22 October 2019].
Cooper, D. R., & Schindler, P. S. (2008). Business research methods. New
Delhi: Tata Mfinancial inclusionraw-Hill Publishing Company Limited
De la Torre, A., Ize, A., & Schmukler, S. L. (2011). Financial development in Latin
America and the caribbean: The road ahead. Washington DC: The World
Bank.
DeGregorio, J., & Giudotti, P. E. (1995). Financial policies, growth, and efficiency.
World Development, 433-448.
46
Demirguc-Kunt, A., Klapper, L., Singer, D., Ansar, S., & Hess, J. (2018). The global
Findex database 2017: Measuring financial inclusion and the fintech
revolution.The World Bank.
Dewatripont, D., Rochet, C., &Tirole,W. (2010). Financial intermediation and
delegated monitoring.Review of Economic Studies,51, 393-414
García, M. J. R., & Jose, M. (2016). Can financial inclusion and financial stability go
hand in hand? Economic Issues, 21(2), 81e103
Gberevbie, E. (2011). Leadership, the financial sector and development in
Nigeria. Inkanyiso, Journal of Humanity and Social Sciencies 3(2), 148-158.
Ghani, E. (1992). How financial markets affect long-run growth: A Cross-country s
study. World Bank working paper, PPR working paper series No. 843
Goldsmith, R. (1969). Financial Structure and Development. New Haven, CT: Yale U.
Government of Kenya (2007). Economic Surveys, various Issues. Nairobi.
Government Printer
Government of Kenya. (2003). The Economic Recovery Strategy for Wealth and
Employment Creation, 2003-2004. Government Printer, Nairobi.
Griffith-Jones,S., Karwowski, E., & Dafe, F., (2013). A Financial sector to support
development in low-income countries [Online]. London: Overseas
Development Institute. Report 25.
Gurley, J. G. & Shaw, E. S. (1955). Financial aspects of economic development,
American Economic Review, 45, 515-538.
Harris, M. & Raviv, A. (1989). The design of securities. Journal of financial
economics, 24(2): 255-287
Ibrahim, M. (2017). Studies on financial development and economic growth in sub-
Saharan Africa. Physica A: Statistical Mechanics and Its Applications, 484,
66-81.
IMF (2010). Debt Sustainability in Low-Income Countries. Towards a Forward
Looking Strategy. Washington. IMF staff of the Policy and Development
Review Department
Kenya National Bureau of Statistics, (2018). Economic Survey 2008. Nairobi:
Government press. .
Khalfaoui, H. (2015). The Determinants of Financial Development: Empirical
Evidence from Developed and Developing Countries. Applied Economics and
Finance Journal 2(4)
Khan, J. A. (2008).Research Methodology. New Delhi. APH Publishing Corporation
Kim, D. W., Yu, J. S., & Hassan, M. K. (2018). Financial inclusion and economic
growth in OIC countries. Research in International Business and Finance, 43,
1e14.

47
King, R., & Zervos, S. (1996). Stock market development and long-run growth. The
World Bank Economic Review, 10(2), 323-339.
King, R.G. & Levine, R. (1993). Finance entrepreneurship and growth: theory and
evidence. Journal of Monetary Economics, 32(3), 513-542.
Klapper, L., (2016). Financial Inclusion has a big role to play in reaching the SDG’s
[Online]. Washington DC: Consultative Group to Assist the Poor.
Available from: http://www.financial inclusionap.org/blog/financial-
inclusion-has-big-role-play-reaching-sdgs [Accessed 15 October 2019]
Klapper, L., El-Zoghbi, M & Hess, J. (2016). Achieving the Sustainable
DevelopmentGoals: The Role of Financial Inclusion. FINANCIAL
INCLUSIONAP, Washington DC
Kose, M.A., Prasad, E., Rogoff, K. & Wei, S. (2006). Financial Globalization: A
Reappraisal (758 KB PDF), IMF Working Paper Series WP 06/189.
Washington: International Monetary Fund, August.
Levine, R. (2003). Finance and Growth: Theory, Evidence, and Mechanisms.
Minnesota: University of Minnesota and NBER.
Levine, R. Loayza, N. & Beck, T. (2012). Financial intermediation and growth:
Causality and causes. Journal of Monetary Economics, 46(1), 31-77.
McKinnon, R., (1973). Money and Capital in Economic Development, Washington,
D.C.: Brookings Institution.
Mehrotra, A., & Yetman, J. (2015). Financial inclusion-issues for centralbanks. BIS
Quarterly Review. London: Department for Business Innovation and Skills.
Midigo, D. (2018). The role of investment banking on financial development in
Kenya. Unpublished Msc research project, University of Nairobi
Mises, J. (1912). Financial Development, Growth, and the Distribution of Income.
Journal of Political Economy, 98 (5): 1076-1107.
Mogaka, E. (2017). Effect of domestic public debt on financial market development in
the East African Community. Unpublished MSc research project, University of
Nairobi
Mogaka, E. (2017). Effect of domestic public debt on financial market development in
the East African Community. Unpublished MSc research project, University of
Nairobi
Ndiang’ui, J. (2019). Effect of selected macro-economic variables on financial
development in Kenya. Unpublished MBA Project ,University of Nairobi
Obstfeld, M. (1994). Risk-Taking, Global Diversification, and Growth, Amer. Econ.
Rev. 84(5), 10–29.
Ochieng, E. (2018). Effect of government domestic borrowing on financial
development in Kenya. Unpublished MBA research project, University of
Nairobi

48
Patrick, H.T. (1966). Financial Development and Economic Growth in
Underdeveloped countries’, Economic Development and Cultural Change,
14(1), 174-189.
Poi, B., & Wiggins, V. (2001). Testing for panel-level Heteroskedasticity and
Autocorrelation. StataCorp LP. Retrieved from
http://www.stata.com/support/faqs/stat/panel.html
Quinn, D. & Toyoda A. (2008). Does Capital Account Liberalization Lead to
Growth? forthcoming in Review of Financial Studies.
Rahman , H. & Mustafa, S. (2015). the relationship between individual investor
sentiment, stock return and volatility: evidence from the turkish market.
International Journal of Emerging Markets, 5(2),11-15
Rajan, R., & Zingales, L. (1998). Financial Dependence and Growth. American
Economic Review, 88(3), 559-586.
Rajan, R.G., & Zingales, L., (2004). The great reversals: The politics of financial
development in the twentieth century, Journal of Financial Economics,
69(1), 5-50.
Roubini, N. & Bilodeau, J. (2008).The Financial Development Index: Assessing the
World’s Financial Systems. The financial development report 2008. Geneva
Switzerland: World Economic Forum
Sarma, M. (2008). Financial Inclusion and Development: A cross country analysis,
Indian council for research on International Economic Relations , New Delhi
, India.
Schumpeter JA (1911) The theory of economic development, an inquiry into profits,
capital, credit, interest, and the business cycle, translation 1934. Harvard
University Press, Cambridge Second Printing 1936; third printing 1949
Sharma, D. (2016). Nexus between financial inclusion and economic growth:
Evidence from the emerging Indian economy. Journal of financial economic
policy, 8(1), 13e36.
Shaw, E.S. (1973). Financial deepening in economic development, New York,
London: Oxford University Press,
Silber, W.L (1983). The process of financial innovation. American Economic Review,
73(2):89-95
Standley, S. (2008). What are the determinants of financial market development in
sub-Saharan Africa. Private Sector Development, 12(1) 17-26.
Svaleryd, H., &Vlachos, J (2002). Markets for risk and openness to trade: how are
they elated. Journal of International Economics, 57(2), 369–395.
Triki & Faye (2013). Financial inclusion in Africa. Ghana: African Development
Bank.

49
Wooldridge, J.M. (2012). Control function methods in applied econometrics. Journal
of Human Resoururce, 50, 420–445.
World Bank (2002). World Bank Data. [Online] Available from:
https://data.worldbank.org/ [Accessed 17 October 2019].
World Bank (2012). International Debt Statistics. Washington DC. World Bank.
World Bank (2017). The Findex Global Database 2017 [Online]. Washington D.C:
World Bank. Available from: datatopics.worldbank.org/financialinclusion/
[Accessed 20 October 2019].

50

51
APPENDICES
Appendix I: Research Data
Year Quarter
Financial
development
Agency
banking
Mobile
banking
Interest
rate ATMs
MFIs - DT
SACCO
Bank
branches
Balance of
payments
(Ksh in
Million)
GDP
growth
rate
2010 1 0.2183 25,956
9,707,920 7%
1,754 215
1,022
33.91 7%
2 0.2264 30,836
10,536,700 7%
1,818 215
1,032
(14,816.34) 8%
3 0.2157 34,071
14,427,767 6%
1,886 215
1,056
(17,026.56) 8%
4 0.2314 38,220
16,085,300 6%
1,948 215
1,063
(22,234.62) 12%
2011 1 0.2617 34,913
17,016,067 6%
2,021 215
1,082
(22,777.18) 8%
2 0.2859 39,545
17,942,700 6%
2,060 215
1,122
(31,291.72) 7%
3 0.2827 44,858
18,604,200 7%
2,097 215
1,140
(36,376.40) 6%
4 0.2883 49,146
19,286,900 15%
2,116 215
1,161
(30,878.43) 4%
2012 1 0.3120 53,909
18,955,134 18%
2,163 215
1,167
(26,994.49) 4%
2 0.3177 59,029
19,673,300 18%
2,207 215
1,200
(26,543.61) 4%

52
Year Quarter
Financial
development
Agency
banking
Mobile
banking
Interest
rate ATMs
MFIs - DT
SACCO
Bank
branches
Balance of
payments
(Ksh in
Million)
GDP
growth
rate
3 0.2911 64,969
19,556,667 15%
2,246 215
1,225
(39,159.97) 5%
4 0.3029 74,370
20,443,334 12%
2,285 215
1,272
(27,592.74) 5%
2013 1 0.2099 89,051
21,849,900 10%
2,322 215
1,274
(29,017.54) 6%
2 0.3146 100,023
23,412,834 9%
2,354 215
1,288
(24,498.15) 8%
3 0.3229 108,220
24,036,667 9%
2,396 215
1,313
(37,328.27) 6%
4 0.3315 112,592
24,885,434 9%
2,415 215
1,342
(37,902.89) 4%
2014 1 0.3185 115,106
26,027,067 9%
2,468 181
1,356
(26,001.12) 5%
2 0.3262 118,390
25,961,167 9%
2,543 181
1,384
(1,743.77) 6%
3 0.3379 123,783
26,286,334 9%
2,490 181
1,416
(55,932.51) 5%
4 0.3421 124,610
25,397,234 9%
2,509 181
1,443
(54,052.63) 6%
2015 1 0.3214 127,202
25,514,334 9%
2,527 181
1,444
(540,169.43) 6%
2 0.3271 130,238
26,368,834 9%
2,569 176
1,452
(558,090.03) 6%
3 0.3359 12% 176 6%

53
Year Quarter
Financial
development
Agency
banking
Mobile
banking
Interest
rate ATMs
MFIs - DT
SACCO
Bank
branches
Balance of
payments
(Ksh in
Million)
GDP
growth
rate
136,054 27,033,300 2,579 1,472 (153,009.46)
4 0.3427 142,315
28,081,900 12%
2,578 176
1,523
(454,348.34) 6%
2016 1 0.3298 148,893
29,760,867 12%
2,618 175
1,527
(378,075.91) 5%
2 0.3149 157,526
31,373,334 11%
2,623 175
1,530
(321,362.02) 6%
3 0.3192 171,526
32,842,667 11%
2,601 175
1,536
(327,861.13) 5%
4 0.3046 169,935
34,425,000 11%
2,611 175
1,541
(353,133.44) 7%
2017 1 0.3111 155,104
33,517,667 10%
2,615 174
1,524
(458,430.32) 5%
2 0.3029 163,287
34,223,000 10%
2,590 174
1,526
(487,135.98) 4%
3 0.3072 168,203
35,149,334 10%
2,583 174
1,516
(516,615.27) 4%
4 0.3262 176,616
36,592,734 10%
2,575 174
1,518
(525,858.47) 5%
2018 1 0.2813 192,050
38,533,434 10%
2,569 175
1,515
(500,205.73) 6%
2 0.2790 200,490
41,532,700 9%
2,551 175
1,513
(485,567.70) 6%
3 0.2795 202,071
43,481,367 9%
2,538 175
1,512
(459,439.08) 7%

54
Year Quarter
Financial
development
Agency
banking
Mobile
banking
Interest
rate ATMs
MFIs - DT
SACCO
Bank
branches
Balance of
payments
(Ksh in
Million)
GDP
growth
rate
4 0.2730 208,006
46,454,934 9%
2,524 175
1,505
(452,269.18) 7%
2019 1 0.277
213,515
46,898,434 9%
2,515 172
1,516
(406,200.30) 6%
2 0.276
225,843
50,348,034 9%
2,518 172
1,519
(390,156.36) 5%
3 0.275
223,175
54,787,500 9%
2,531 172
1,555
(386,984.84) 5%
4 0.275
223,165
57,564,434 9%
2,462 172
1,597
(444,492.72) 6%


![Financial Inclusion: General Overview, Central Banks …...Financial Inclusion [General Overview] •Financial inclusion or inclusive financing is the delivery of financial services](https://img.pdfslide.us/doc/110x75/5e95eef43708446e852354fe/financial-inclusion-general-overview-central-banks-financial-inclusion-general.jpg)