Embed Size (px)
Citation preview

University of Arkansas, FayettevilleScholarWorks@UARK
Theses and Dissertations
7-2015
Effect of Feeding Regimen and Age on LipidMetabolism in Broiler Breeder Hens and ProgenyNirun BoonsinchaiUniversity of Arkansas, Fayetteville
Follow this and additional works at: http://scholarworks.uark.edu/etd
Part of the Other Animal Sciences Commons, and the Poultry or Avian Science Commons
This Dissertation is brought to you for free and open access by ScholarWorks@UARK. It has been accepted for inclusion in Theses and Dissertations byan authorized administrator of ScholarWorks@UARK. For more information, please contact [email protected], [email protected].
Recommended CitationBoonsinchai, Nirun, "Effect of Feeding Regimen and Age on Lipid Metabolism in Broiler Breeder Hens and Progeny" (2015). Thesesand Dissertations. 1260.http://scholarworks.uark.edu/etd/1260

Effect of Feeding Regimen and Age on Lipid Metabolism in Broiler Breeder Hens and Progeny
A dissertation submitted for partial fulfillment
of the requirements for the degree of
Doctor of Philosophy in Poultry Science
By
Nirun Boonsinchai
Chiang Mai University
Bachelor of Agriculture in Animal Science, 2004
Chulalongkorn University
Master of Science in Animal Nutrition, 2011
July 2015
University of Arkansas
This dissertation is approved for recommendation to the Graduate Council
___________________________________
Dr. Craig Coon
Dissertation Director
___________________________________ _____________________________
Dr. Charles Maxwell Dr. Sami Dridi
Committee Member Committee Member
___________________________________
Dr. Narayan Rath
Committee Member

ABSTRACT
Age of hens and feed allocation can affect egg yolk lipid compositions which in turn directly
relate to chick quality. A series of experiments were conducted to determine the effects of age
and feeding programs on lipid metabolism in breeder hens and progeny. In the first trial, the rate
of yolk absorption and fatty acid profiles in the yolk were compared among 28, 35, and 49wk old
hens. The results revealed that the rate of yolk absorption was higher, but the absolute amount of
fatty acids absorbed was lower in young hens than in the old hens. The second trial was
hypothesized that young breeder hens synthesis egg yolk lipids from amino acids. The results
indicated that both glucogenic and ketogenic amino acids as well as glucose were used as a
substrates for de novo lipogenesis (DNL) in young hens. The third experiment was set to
compare the rate of DNL between young (28wk) and old (40wk) breeder hens as well as their
progeny. The results suggested that the rate of DNL was higher in young hens than the old ones.
At 7d of age, progeny from old breeder hens illustrated the higher rate of DNL than those chicks
from the young hens. The fourth trial was conducted to determine the partitioning of lipids into
adipose tissue of 7-day-old chicks. At hatch, yolk-derived lipid was the main lipid in adipose
tissue, while the feed-derived and DNL lipids play a bigger role after hatch. The fifth trial was
conducted to determine the effect of palmitic acid supplementation. Palmitic acid showed
positive effect on hatchability at early phase of production cycle with increasing of
monounsaturated fatty acids in fresh yolk. The las trial was set to test the effect of various
feeding programs on egg production and progeny growth as well as economic traits. The slower
feed increase before peak production with feed adding at peak, and the normal feed increases to
peak production with feed adding at 35wk of age showed the best egg production (169 and 171
eggs/HH, respectively) and economic trait expressing as cost for producing a dozen of eggs

($1.21 and $1.22/dozen eggs), whereas the practical feed withdraw program showed the worst
effects (148 eggs/HH and $1.29/dozen eggs).

ACKNOWLEDGEMENTS
I would like to sincerely express my gratitude to Dr. Craig Coon for his kindly support and
guidance along my journey. Thank you all my committee members: Dr. Charles Maxwell, Dr.
Narayan Rath, and Dr. Sami Dridi for being part of the dissertation and giving me useful advices.
I also would like to thank my bosses Khun Prajit Udnoon and Khun Buncha Khaomuangnoi for
giving me a great opportunity to improve my academic knowledge. For one of the best
agroindustry companies in the world, I would like to thank the Charoen Pokphand Foods Public
Company Limited (CPF) for financial support during my study. Also, I would to thank Cobb-
Vantress for providing breeder hens, roosters, feed, chicks, as well as hatching eggs.
A big thank needs to give to Dr. Coon’s research team: Judy England, Justinal Caldas, Phiphob
Sodsee, Karen Vignale, Monticha Putsakum, Ruben Kriseldi, Jinrong Wang, Andrew Magnuson,
Ethan Holt, Michael Schlumbohm, Garret Mullenix, and Katie Hilton for all your help during my
study. Special thank would give to Judy England, the excellent research program manager, who
keeps the researches in shape all the way through.
I would like to acknowledge Linda Kirby, Eric Vaught, Doug Yoho, Howard Lester, and all
farm, feed mill, and slaughter house staff for all your help during my experiments. Special thanks
to Erik Pollock and Doug Galloway for lab techniques regarding the GC and GC-MS.
Thanks all Thai people in Fayetteville especially Thepthai restaurant and P&N market owners
for making me not being lonely while staying aboard.
Thanks my Mom, Dad, and sister for being there for me and keeping me warm all the time.
Special thanks to my fiancé Hathairat Pinkaew who loves me unconditionally and always makes
my day. All your help contribute to today’s accomplishment.

TABLE OF CONTENTS
Introduction 1
I. Literature review 3
Lipid metabolism
Biological significances and classification of lipids 4
Transportation and storage of lipids 5
Lipid synthesis 6
Lipid breakdown 8
Interconvertibility of metabolic fuels 9
Hormones regulating fatty acid metabolism 10
Significance of breeder age to broiler breeder industry
Effect of hen age on hatchability and progeny performance 11
Effect of hen age on egg components 12
References 19
II. Effect of breeder age on yolk fatty acid composition and yolk absorption
during embryonic development 21
Abstract 22
Introduction 24
Materials and Methods 25
Results 27
Discussion 28

References 35
III. The study of de novo lipogenesis in young hens 37
Abstract 38
Introduction 40
Materials and Methods 42
Results 45
Discussion 46
References 50
IV. Comparison of de novo lipogenesis between young and old breeder hens
and their progeny 52
Abstract 53
Introduction 55
Materials and Methods 56
Results 59
Discussion 60
References 66
V. The sources of lipid partitioning to adipose tissue of baby chicks during
first week posthatch 68
Abstract 69

Introduction 71
Materials and Methods 72
Results 75
Discussion 75
References 80
VI. Effect of palmitic acid supplementation on hatchability,
reproductive performance, and progeny growth 82
Abstract 83
Introduction 85
Materials and Methods 86
Results 87
Discussion 88
References 95
VII. Effect of various feeding programs during laying period for
broiler breeder hens on reproductive performance 96
Abstract 97
Introduction 98
Materials and Methods 99
Results 100

Discussion 101
References 109
Conclusion 110
Appendix 111

1
INTRODUCTION
The final goal of broiler breeder industry is to have the highest number of a good quality salable
chicks which are depended on many factors such as, genetic, age, nutrition, and management.
The genetic selection and breeding have gained the desirable characteristics of both broiler
breeder hens, roosters, and broiler chicks. While breeder hens have been improved to produce
more eggs, hatchability and livability of the progeny did not much improve. Broiler breeder
industry is still facing the low hatchability and growth performance of progeny form young
breeder hens as well as a lack of persistency of lay. Age of hens and feed allocation can affect
egg yolk lipid compositions which in turn directly relates to chick quality. Chicks from young
breeder flocks are not preferable for the broiler farms since it has been well known that chicks
from young breeder flock have poor growth rate and higher early life mortality. Therefore, the
hatchability and growth of progeny from young breeder hens need to be improved.
Feed allocation is the key of success for broiler breeder industry. Breeder hens need to
accumulate adequate both fleshing and fat reserve before turning to liberty maturity. Improper
feed allocation can cause adverse effect for the whole production period. Not enough fleshing at
the time of photo stimulation can delayed the onset of lay, decrease peak production, and cause
high mortality during transitional period to peak production. Over feeding can also impair
reproductive performance by increasing double hierarchies and causing fatty liver hemorrhagic
syndrome (FLHS). In the commercial practice, feed is usually withdrawn after peak production
to prevent the over body weight of breeder hens and to save feed. The problem is most of the
breeder flocks achieve peak production, but cannot maintain the persistency of lay (Mabbett,
2012). Therefore, the pattern of feed allocation during laying period need to be modified in order
to have the best reproductive performance.

2
Lipids play the important roles in broiler breeder industry. Egg yolk contains 33% of fat
(O’Sullivan et al., 1991). Chick embryo receive 90% of total energy from the β-oxidation of egg
yolk fatty acids, and use egg yolk lipids for structural membrane synthesis (Noble and Cocchi,
1990). Fatty acids in the diet can affect the fatty acid profiles of the yolk. One of the most
common fatty acid is palmitic acid, the primary product for de novo lipogenesis (DNL).
Although the positive effect on feeding palmitic acid in Japanese quail was reported by Vilchez
et al. in 1990, there was no study regarding feeding palmitic acid in broiler breeder hens.
Therefore, it is interesting to be tested for the positive effects of this fatty acid in broiler breeder
hens. A better understanding of lipid metabolism will gain insight into many problems
encountering the broiler breeder industry. The use of stable isotopes is very convenience for
metabolic studies. The objectives of this dissertation are to understand the age and feed
allocation effects on lipid metabolism in breeder hens and progeny.

3
I. LITERATURE REVIEW

4
Lipid metabolism
Biological significances and classification of lipids
Lipids are referred to a group of small molecules which are water insoluble but dissolvable in
nonpolar solvents such as ether, chloroform, and benzene. Lipids are significantly important in
many aspects. They serve as energy storage similar to glycogen in liver and triglycerides (TAG)
in adipose tissues. They are the structural components in cell membranes, myelin, and fat pad.
Some of the vitamins and hormones are lipids such as vitamins A, D, E, K, sex hormones,
glucocorticoids, prostaglandins, and aldosterone. Lipids also function as receptors, signaling
molecules, antigens, sensors, biological detergents, electrical insulators, and membrane anchors
for proteins.
There is no internationally accepted system to classify the lipids. Based on the component
structures, lipids can be classified into three main categories: simple, complex, and derived lipids
(Figure 1). Simple lipids are esters between fatty acids and various types of alcohols. Fats and
waxes are two forms of simple lipids. Esterification of fatty acids and glycerol yields fats which
is called oils in the liquid state. The good example of fats is triglycerides. Waxes can be formed
by esterification of fatty acids with higher molecular weight mono hydroxyl aliphatic alcohols.
Cholesterol esters, vitamin A and D esters are the examples of waxes. Complex lipids are
referred to esters of fatty acids with other compounds in addition to alcohols, which include
phospholipids, glycolipids (glycosphingolipids), and other complex lipids such as sulfolipids,
amino lipids, and lipoproteins. Phospholipids is lipids containing a phosphoric acid residue such
as lecithin, cephalins, and choline. In glycolipids, fatty acids form ester bonds with sphingosine
and carbohydrate. Derived lipids are lipids obtained from hydrolysis of simples and complex
5
lipids, which include fatty acids, glycerol, steroids, fatty aldehydes, ketone bodies, hydrocarbons,
lipid-soluble vitamins, and hormones (Clarenburg, 1992; Botham and Mayes, 2012).
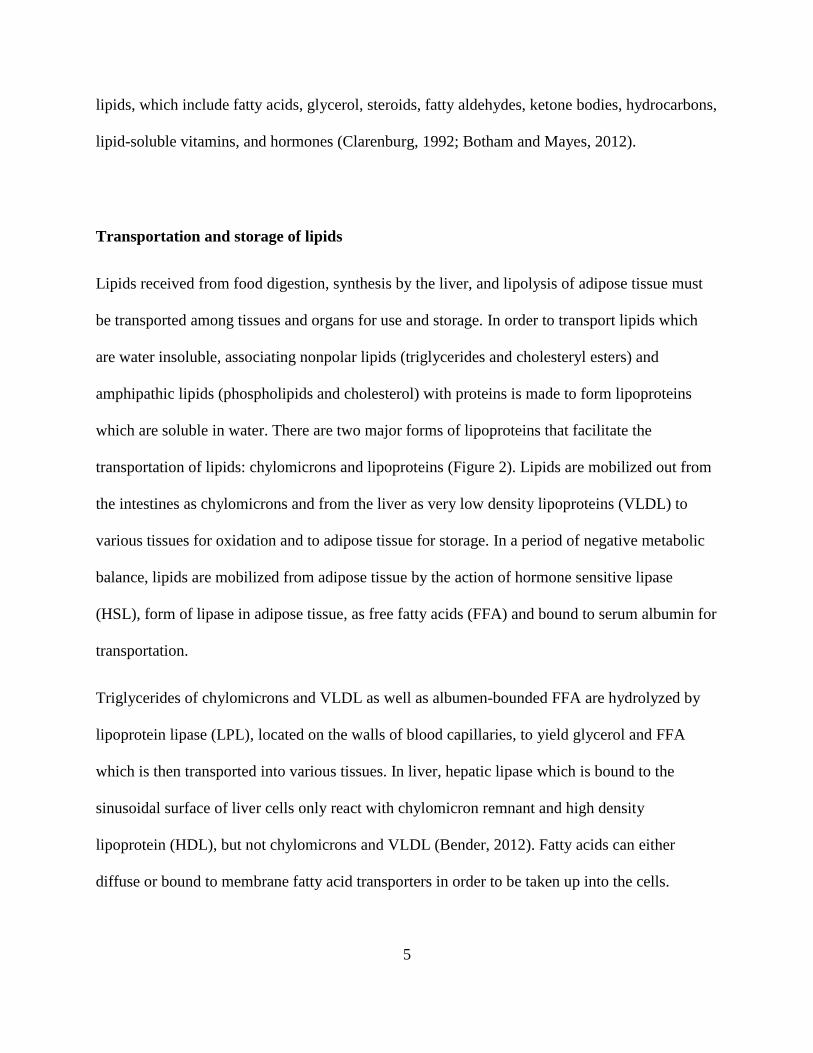
Transportation and storage of lipids
Lipids received from food digestion, synthesis by the liver, and lipolysis of adipose tissue must
be transported among tissues and organs for use and storage. In order to transport lipids which
are water insoluble, associating nonpolar lipids (triglycerides and cholesteryl esters) and
amphipathic lipids (phospholipids and cholesterol) with proteins is made to form lipoproteins
which are soluble in water. There are two major forms of lipoproteins that facilitate the
transportation of lipids: chylomicrons and lipoproteins (Figure 2). Lipids are mobilized out from
the intestines as chylomicrons and from the liver as very low density lipoproteins (VLDL) to
various tissues for oxidation and to adipose tissue for storage. In a period of negative metabolic
balance, lipids are mobilized from adipose tissue by the action of hormone sensitive lipase
(HSL), form of lipase in adipose tissue, as free fatty acids (FFA) and bound to serum albumin for
transportation.
Triglycerides of chylomicrons and VLDL as well as albumen-bounded FFA are hydrolyzed by
lipoprotein lipase (LPL), located on the walls of blood capillaries, to yield glycerol and FFA
which is then transported into various tissues. In liver, hepatic lipase which is bound to the
sinusoidal surface of liver cells only react with chylomicron remnant and high density
lipoprotein (HDL), but not chylomicrons and VLDL (Bender, 2012). Fatty acids can either
diffuse or bound to membrane fatty acid transporters in order to be taken up into the cells.

6
Lipid synthesis
The primary sites for fatty acid synthesis are liver and adipose tissue. In avian species, lipids de
novo synthesis takes place mainly in the liver, slightly occurs in adipose tissue, and does not
exist in the ovary (Salas, 2011). Palmitic acid is the primary product of fatty acid synthesis which
occurs in the cytoplasm where the needed enzymes are located. However, primary precursor of
fatty acid synthesis is acetyl-CoA, formed from pyruvate in the mitochondria, which cannot
move across the mitochondria membranes to cytoplasm by itself. In order to move acetyl-CoA
from inside mitochondria to the cytoplasm, citrate is formed from acetyl-CoA and oxaloacetate
and can be translocated to the cytoplasm by the tricarboxylate anion carrier in the inner
mitochondria membrane (Figure 3). In cytoplasm, citrate then is cleaved back to oxaloacetate
and acetyl-CoA, which is catalyzed by enzyme adenosine triphosphate (ATP)-citrate lyase.
Oxaloacetate must be converted to malate in order to return back to mitochondria by the reaction
of enzyme cytosolic-malate dehydrogenase. Malate then will be converted back to oxaloacetate
inside the mitochondria catalyzed by mitochondria-malate dehydrogenase. In addition a part of
malate generated in cytosol can be oxidized to pyruvate and carbon dioxide by malic enzyme and
pyruvate then can move across mitochondria membrane into the mitochondrial matrix.
The next step of fatty acid synthesis is conversion of acetyl-CoA to malonyl-CoA which is
catalyzed by acetyl-CoA carboxylase. First, this enzyme utilizes bicarbonate as a source of
carbon dioxide and bounds to biotin by hydrolysis of ATP. Then the biotin-bound carboxyl
group of the enzyme is transferred to acetyl-CoA and regenerate enzyme-bound biotin and
malonyl-CoA.

7
The last step of fatty acid synthesis is catalyzed by fatty acid synthase by adding 7 molecules of
malonyl-CoA into one molecule of acetyl-CoA, which is requiring 14 molecules of NADPH and
14 molecules of H+. The primary product is one molecule of palmitic acid (C16:0), 8 of CoA, 7
of CO2, 14 of NADP, and 6 of H2O. The reaction is complex and repeats itself (Figure 4)
(condensation, reduction, dehydration, and reduction) until the 16-crbon palmitate (saturated
fatty acid) is formed.
The synthesis of fatty acids longer than palmitate and unsaturated fatty acids is achieved by
elongation and desaturation. Elongation of fatty acids takes place in the endoplasmic reticulum
(ER), mitochondria, and peroxisomes. One of which, elongation in ER is the most active. The
substrates for elongation can be either saturated or unsaturated fatty acyl-CoAs. The sequence of
reactions are very similar to those catalyzed by fatty acid synthase, except the primers are long-
chain acyl-CoAs instead of acetyl-CoA. The elongation in ER uses malonyl-CoA as the
elongating group while in mitochondria uses acetyl-CoA instead.
In fatty acid desaturation, the direct oxidative desaturation is catalyzed by a complex of enzymes
located in the ER. The first double bond is commonly introduced to a saturated acyl chain at the
Δ9 position by enzyme Δ9 desaturase (also called SCD-1: stearoyl-CoA desaturase-1). In
addition, polyunsaturated fatty acids occur by introducing double bonds into the chain at the Δ5
and Δ6 positions by Δ5 and Δ6 desaturases, but double bonds cannot take place beyond Δ9
position because of the lack of Δ12 and Δ15 desaturases. This is the reason why linoleic acid
(C18:2) and linolenic acid (C18:3) cannot be synthesized by the animals and need must be
provided in the diet (Sul, 2012).

8
Lipid breakdown
Most tissues break down fatty acids for energy need, which is varied among the tissues
depending upon physiological conditions and the rate of break down is usually high during
starvation and exercise. Liver and muscle tissues are the main places for lipid β-oxidation.
However, the brain tissues and red blood cells cannot utilize fatty acids because of the limited
blood-brain barrier and the lack of mitochondria, respectively. Once fatty acids are taken up into
the cells, they bound to a fatty acid-binding proteins and are activated to a fatty acyl-CoA before
being oxidized for energy production.
Since β-oxidation of fatty acids takes place in mitochondrial compartment which is impermeable
for nonesterified long-chain fatty acids and their fatty acyl-CoA derivatives, carnitine facilitates
the translocation of those molecules. Fatty acylcarnitine is formed from fatty acyl-CoA and
carnitine by the catalyzing of enzyme Carnitine palmitoyltransferase 1 (CPT 1) which occurs in
the outer mitochondrial membrane. Then the enzyme carnitine-palmitoylcarnitine translocase
catalyzes transport of fatty acylcarnitine across the inner mitochondrial membrane. Upon
arriving the mitochondrial matrix, fatty acylcarnitine is reesterified back to fatty acyl-CoA and
free carnitine, which is catalyzed by enzyme carnitine palmitoyltransferase 2 (CPT 2). CPT 1
located in the outer mitochondrial membranes is the tissue-specific enzyme consisting with three
isoforms: CPT 1-A (liver), CPT 1-B (muscle), and CPT 1-C (brain), while CPT 2 is the
ubiquitous protein located in the inner mitochondrial membranes (Bonnefont et al., 2004).
The oxidation of fatty acids (Figure 5) inside the mitochondria involves a series of reactions
(oxidation, hydration, oxidation, and cleavage) which reveres the fatty acid synthesis. The first
step of β-oxidation is catalyzed by enzyme acyl-CoA dehydrogenases which different members

9
are differently specific for long-chain (>12 carbons), medium-chain (6 to 12 carbons), and short-
chain (<6 carbons) acyl-CoAs. Flavin adenine dinucleotide (FAD) is used as the electron donor
in this step, which in turn generates the trans-double bond enoly-CoA and the FADH2. In the
second step, the hydration of the trans double bond created in the first step, which is catalyzed
by the enoyl-CoA hydratase yielded L-3-hydroxyacyl-CoA (or D-3-hydroxyacyl-CoA when the
cis double bond enoyl-CoA is hydrolyzed). The next two final steps start by oxidation of
hydroxyacyl-CoA to generate ketoacyl-CoA which then is cleaved by 3-ketoacyl-CoA thiolase to
yield acetyl-CoA and fatty acyl-CoA that has two carbon shorter. The β-oxidation will shorten
two carbons from the fatty acid chain for each cycle of reactions and one molecule each of
acetyl-CoA, FADH2, NADH, and hydrogen ion are produced. Therefore, the oxidation of
palmitic acid which requires seven cycles of reaction series yields a maximum of 35 ATPs (Sul,
2012).
Interconvertibility of metabolic fuels
Our bodies as well as animals will try to maintain balanced metabolic status. Therefore, the body
will store excess energy which can later be readily used as needed. In the fed state, excess
carbohydrate (from the diets) from energy need and formation of glycogen reserves in liver and
muscle will be used to synthesis fatty acids and triglycerides in adipose tissue and liver (which
can be then exported in form of very low density lipoprotein: VLDL). In turn, during starvation,
lipolysis of adipose tissue yields fatty acids and glycerol, which only glycerol can be used for
glucose synthesis. In contrast, excess fatty acids cannot be used for gluconeogenesis because the
reaction forming Acetyl-CoA from pyruvate is irreversible. In addition, for every unit of Acetyl-
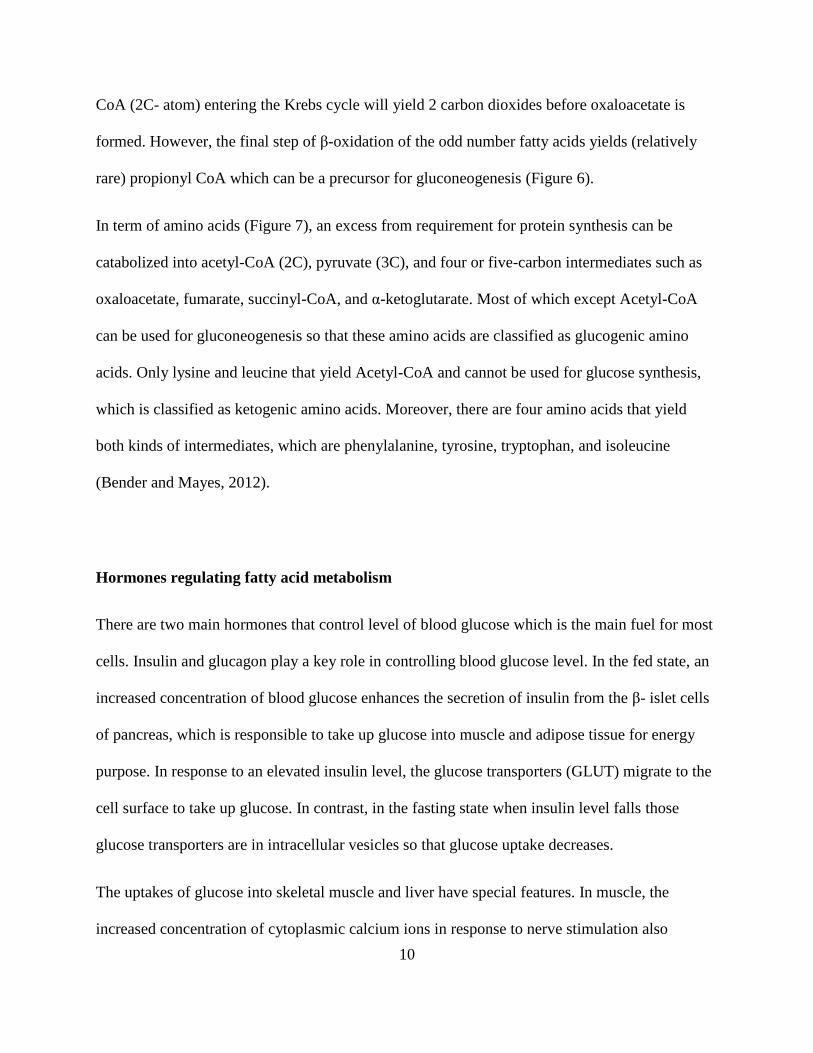
10
CoA (2C- atom) entering the Krebs cycle will yield 2 carbon dioxides before oxaloacetate is
formed. However, the final step of β-oxidation of the odd number fatty acids yields (relatively
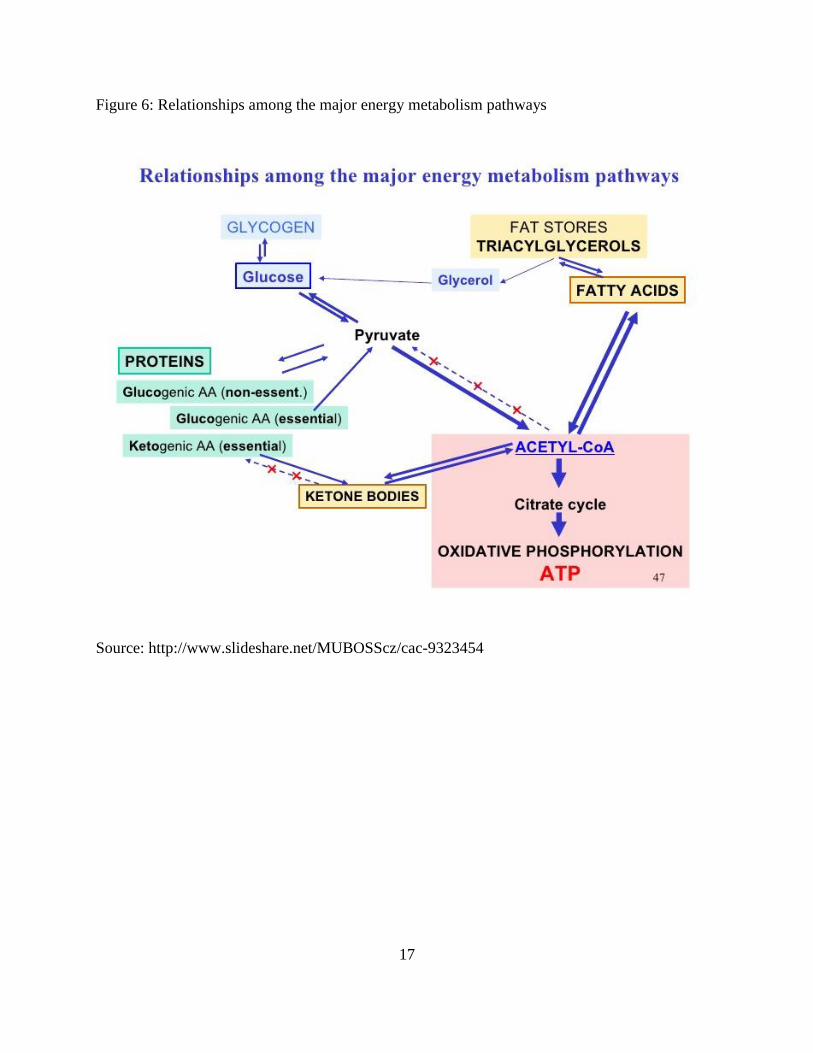
rare) propionyl CoA which can be a precursor for gluconeogenesis (Figure 6).
In term of amino acids (Figure 7), an excess from requirement for protein synthesis can be
catabolized into acetyl-CoA (2C), pyruvate (3C), and four or five-carbon intermediates such as
oxaloacetate, fumarate, succinyl-CoA, and α-ketoglutarate. Most of which except Acetyl-CoA
can be used for gluconeogenesis so that these amino acids are classified as glucogenic amino
acids. Only lysine and leucine that yield Acetyl-CoA and cannot be used for glucose synthesis,
which is classified as ketogenic amino acids. Moreover, there are four amino acids that yield
both kinds of intermediates, which are phenylalanine, tyrosine, tryptophan, and isoleucine
(Bender and Mayes, 2012).
Hormones regulating fatty acid metabolism
There are two main hormones that control level of blood glucose which is the main fuel for most
cells. Insulin and glucagon play a key role in controlling blood glucose level. In the fed state, an
increased concentration of blood glucose enhances the secretion of insulin from the β- islet cells
of pancreas, which is responsible to take up glucose into muscle and adipose tissue for energy
purpose. In response to an elevated insulin level, the glucose transporters (GLUT) migrate to the
cell surface to take up glucose. In contrast, in the fasting state when insulin level falls those
glucose transporters are in intracellular vesicles so that glucose uptake decreases.
The uptakes of glucose into skeletal muscle and liver have special features. In muscle, the
increased concentration of cytoplasmic calcium ions in response to nerve stimulation also

11
enhances the migration of glucose transporters regardless to insulin level. Also, glucose is taken
up into the liver cells independently from insulin. An excess of glucose from energy requirement
is converted to glucose 6-phosphate (catalyzed by enzyme glucokinase) which is then used for
glycogen synthesis. Some part of glucose may also be used for synthesis of lipids which are then
exported from liver in form of very low density lipoprotein (VLDL). Insulin promotes glycogen
synthetase and inhibits glycogen phosphorylase in both liver and skeletal muscle while
stimulates glucose uptake and inhibits the release of free fatty acids in adipose tissue.
Glucagon acts in the opposite manner to insulin. In the fasting state, the concentration of blood
glucose decreases resulting in low level of insulin secreted and less glucose taken up by skeletal
muscle and adipose tissue. In this condition, glucagon is secreted from α-cell of the pancreas into
the liver and inhibits glycogen synthetase while activates glycogen phosphorylase to generate
glucose. In addition, the low level of insulin as well as high level of glucagon stimulates
hormone sensitive lipase to release glycerol and fee fatty acids from adipose tissue, which are
further used for gluconeogenesis in the liver and for metabolic fuel in heart, skeletal muscle, and
liver, respectively (Bender and Mayes, 2012).
Significance of breeder age to broiler breeder industry
Effect of hen age on hatchability and progeny performance
It has been documented that young breeder flocks produce smaller eggs with lighter chick
weights, lower hatchability, and higher mortality (Whiting and Pesti, 1983; Wyatt et al., 1985,
Burke, 1992; Suarez et al., 1997). Hatchability is low at the beginning of lay than later in
production cycle (Smith and Bohren, 1975; Mauldin, 1989). Based on the field study from three

12
Dutch hatcheries during 2004 to 2006, hatchability of broiler breeder flocks increased from 66%
at 25wk to 86% between 31 and 36wk and decreased to 50% at 65wk of age (Yassin et al.,
2008). During incubation, eggs from younger flock showed higher weight loss and lower
hatchability due to increased early and late death (Roque and Soares, 1994). Age of hens directly
relates to internal egg composition or ratio, egg weight, and shell quality, which in turn affect
hatchability (Vieira and Mora, 1998). Chick body weights at hatch and at 14 d of rearing were
higher in eggs from older hens (45wk old) as compared to those from younger (35wk old) hens
(Tona et al., 2004). Also the positive relations were shown among egg weight, weight at
embryonic day 18 (E18), embryo: egg weight ratio, and parental age (O’Sullivan et al., 1991).
Effect of hen age on egg components
Egg weight and yolk size increase significantly as hens aged while albumen content increases
slightly, leading to increased yolk: albumen ratio (O’Sullivan et al., 1991). The bigger egg size
from hens in the same age is mainly due to an increase in albumen content (Vieira and Moran,
1998). It has been reported that lipid transfer from yolk sac to embryo of young hens was less
efficient than those of older hens (Noble, 1987; Yafei and Noble, 1988). Yadgary et al. (2010)
reported that eggs from 30wk old hens had lower fat content than eggs from 50wk old hens.
Fresh yolk of 36wk old broiler breeder hens showed the higher palmitoleic acid levels as
compared to the yolk from 51 and 64wk old hens (Latour et al., 1998). Chicks from young hens
showed lower levels of blood cholesterol, low & high density lipoprotein cholesterol than those
chicks from old hens (Latour et al., 1996).

13
Figure 1: Classification of lipids
Source: http://biosiva.50webs.org/lipids.htm
Figure 2: Schematic of lipoprotein
Source: http://lipidlibrary.aocs.org/Lipids/lipoprot/index.htm

14
Figure 3: Source of acetyl-CoA for fatty acid synthesis
Source: http://pharmaceuticalintelligence.com/tag/fatty-acids/

15
Figure 4: Fatty acid synthase reactions
Source: http://users.humboldt.edu/rpaselk/BiochSupp/PathwayDiagrams/FAbioSynRxns.gif

16
Figure 5: Beta oxidation reaction sequence
Source:https://www.uic.edu/classes/phar/phar332/Clinical_Cases/vitamin%20cases/carnitine/FA
%20catab%20review.htm
17
Figure 6: Relationships among the major energy metabolism pathways
Source: http://www.slideshare.net/MUBOSScz/cac-9323454

18
Figure 7: Amino acid catabolism
Source: http://commons.wikimedia.org

19
REFFERENCES
Bender, D. A., and Mayes, P. A. 2012. Chapter 16: Overview of metabolism & the provision of
metabolic duels. In R. K. Murray, D. A. Bender, K. M. Botham, P. T. Kennelly, V. W.
Rodwell, and P. A. Weil (Eds.), Harper’s illustrated biochemistry (pp.151-162).New
Yolk, McGraw Hill.
Bonnefont, Jean-Paul., F. Djouadi., C. Prip-Buss, S. Gobin, A. Munnich, and J. Bastin. 2004.
Carnitine palmitoyltransferases 1 and 2: biochemical, molecular and medical aspects.
Molecular Aspect of Medicine. 25(5-6):495-520.
Botham. K. M., and Mayes, P. A. 2012. Chapter 15: Lipids of physiologic significance. In R. K.
Murray, D. A. Bender, K. M. Botham, P. T. Kennelly, V. W. Rodwell, and P. A. Weil
(Eds.), Harper’s illustrated biochemistry (pp.140-150).New Yolk, McGraw Hill.
Burke, W. H., 1992. Sex differences in incubation length and hatching weights of broiler chicks.
Poult. Sci. 71:1933-1938.
Clarenburg, R. (1992). Physiological Chemistry of Domestic Animals. St. Louis, Missouri:
Mosby-Year Book, Inc.
Salas, J. C. (2011). Determination of metabolizable energy requirements and mechanisms of
energy mobilization towards lipid egg formation in broiler breeder hens. (Doctoral
dissertation). University of Arkansas, Fayetteville. Available from ProQuest Dissertations
and Theses database. (UMI No. 3455956)
Latour, M. A., E. D. Peeples, C. R. Boyle, S. M. Doyle, T. Pansky, and J. D. Brake. 1996.
Effects of breeder hen age and dietary fat on embryonic and neonatal broiler serum lipids
and glucose. Poult. Sci. 75:695-701.
Latour, M. A., E. D. Peebles, S. M. Doyle, T. Pansky, T. W. Smith, and Carolyn R. Boyle. 1998.
Broiler breeder age and dietary fat influence the yolk fatty acid profiles of fresh eggs and
newly hatched chicks. Poult. Sci. 77:47-53.
Noble, R. C. 1987. Lipid metabolism in the chick embryo: some recent ideas. J. Exp. Zool.
1(Suppl.):65-73.
O’Sullivan, N. P., E. A. Dunnington, and P. B. Siegel. 1991. Relationships among age of dam,
egg components, embryo lipid transfer, and hatchability of broiler breeder eggs. Poult.
Sci. 70:2180-2185.
Tona, K., O. Onagbesan, B. De Ketelaere, E. Decuypere, and V. Bruggeman. 2004. Effects of
age of broiler breeders and egg storage on egg quality, hatchability, chick quality, chick
weight, and chick posthatch growth to forty-two days. J. Appl. Poult. Res. 13:10-18.
Roque, L., and M. C. Soares. 1994. Effects of eggshell quality and broiler breeder age on
hatchability. Poult. Sci. 73:1838-1845.

20
Suarez, M. E., H. R. Wilson, F. B. Mather, C. J. Wilcox, and B. N. McPherson, 1997. Effects of
strain and age of the broiler breeder female on incubation time and chick weight. Poult.
Sci. 76:1029-1036.
Sul, H. S. 2012. Chapter 16: Metabolism of fatty acids, acylglycerols, and sphingolipids. In
Stipanuk, M. H., and Caudill, M. A. (Eds), Biochemical, physiological, and molecular
aspects of human nutrition (pp. 357-392). Missouri, Elsevier Saunders.
Vieira, S. L., and T. Mora Jr. 1998. Egg and chicks from broiler breeders of extremely different
age. J. Appl. Poult. Res.7:372-376.
Whiting, T. S., and G. M. Pesti, 1983. Effects of the dwarfing gene (dw) on egg weight, chick
weight, and chick weight; egg weight ratio in a commercial broiler strain. Poult. Sci.
62:2297-2302.
Wyatt, C. L., W. D. Weaver, and W. L. Beane, 1985. Influence of egg size, eggshell quality and
posthatch holding time on broiler performance. Poult. Sci. 64:2049-2055.
Yafei, N., and R. C. Noble. 1988. An electron microscope study of yolk lipid uptake by the chick
embryo with particular reference to low hatchability in young parent stock. Br. Poult. Sci.
29:887.(Abstr.)
Yassin, H., A. G. J. Velthuis, M. Boerjan, J. Van Riel, and R. B. M. Huirne. 2008. Field study on
broiler eggs hatchability. Poult. Sci. 87:2408-2417.

21
II. Effect of breeder age on yolk fatty acid composition and yolk absorption during
embryonic development
N. Boonsinchai1, J. V. Caldas
1, P. Sodsee
2, K. Vignale
1, M. Putsakum
3, J. Wang, J. England
1, and
C. N. Coon1;
1University of Arkansas, Fayetteville, AR,
2Charoen Pokphand Foods, Bangkok, Thailand,
3Sukhothai Thammathirat Open University, Nonthaburi, Thailand

22
ABSTRACT
The objectives of the present study were to determine the effect of breeder hen age on yolk
absorption and fatty acid profiles in yolk at different stages of development (fresh yolk, transfer
day; E17, and at hatch). Hatching eggs (n=125) were obtained from breeder hens (Cobb 500) in
the same flock at 28, 35, and 49wk of age. Egg weights were selected with a range of 5g
differences for each age: 53-57g, 58-62g, and 66-70g for 28, 35, and 49wk hens, respectively.
Twenty five eggs (or newly-hatched chicks) were used for each sampling, and 6 yolks were
saved for fatty acid determination. Fatty acid compositions in blood plasma were also determined
(n=6). As expected, yolk weights in all stages, and yolk free body weight at hatch showed the
same patterns as their original egg weights, which significantly increased by age (P<.0001). Yolk
absorption from E1 to E17 significantly increased (P<0.05) by age (23.52, 25.02, and 28.04% for
28, 35, and 49wk, respectively). However, the rate of yolk absorption from E17 to hatch slowed
down by age, resulting in the lowest (P<.0001) total yolk absorption in embryo from 49wk hens,
as compared to those from 28 and 35wk hens (65.14 vs. 75.90 and 75.48%, respectively). Fatty
acid concentrations (mg/g dry yolk) decreased throughout embryo development period
(P<.0001). Fatty acid concentrations in fresh yolk increased from 28wk to 35wk and reduced
again at 49wk of age (P<.0001), which is in agreement with fatty acid contents in plasma. In
addition, concentrations of fatty acids were higher in yolk from older hens at E17 and at hatch
(P<.0001). Although percent of total yolk absorption was lower in 49wk-old hens, the total
amounts of fatty acids being absorbed were higher (P<.0001) in older hens (4.87, 6.11, and 6.53g
for 28, 35, and 49wk, respectively). The higher amount of residual yolk at hatch together with
its higher concentrations of fatty acid contents in chicks hatched from older hens may result in
the better growth rate as has been documented. In conclusion, the rate of yolk absorption was

23
higher in embryo from younger hens, but the concentration of yolk fatty acids and the
quantitative size of available yolk for embryo was larger from older breeders thus providing
more fat for embryo gain and livability.
Keywords: yolk absorption, fatty acid profiles, breeder age, embryonic development

24
INTRODUCTION
During development process, embryo receives all nutrients from albumen and yolk. Although
dry matter of albumen contains more than 90% of protein and 7.8% of carbohydrate, but fresh
albumen also contain about 90% of water, which makes it the poor source of nutrient (Freeman
and Vince, 1974). In the other hand, fresh yolk contains about 50% water, 33% fat, 15% protein,
and less than 1% carbohydrates (O’Sullivan et al., 1991). The dry matter of yolk accounts for
70.6% of total egg dry matter (Romanoff and Romanoff, 1949), which makes egg yolk the main
source of nutrient for embryo development (Romanoff, 1967) . However, the nutrient
percentages in fresh yolk can vary depending on genetic strains, hen age, and egg weight (Vieira
and Moran, 1998; Sahan et al., 2014). Embryos receive energy mainly from yolk via the yolk sac
membrane and the surrounding vascular system for tissue growth during embryonic development
(Nobel and Cocchi, 1990; Vleck 1991). In the first few days of development, embryo utilize
carbohydrate as the energy source, then protein is used in the middle phase of development
(Romanoff, 1967; Freeman and Vince, 1974). The rate of nutrient transport from yolk to embryo
tissue increases extremely in the last week of incubation (Speake et al., 1998).
Hen age also affected growth rate and livability of progeny (Tona et al., 2004). The problem of a
low growth rate of progeny from young breeder hens still remains. A better understanding of
dynamic changes of yolk fatty acids in different ages of breeder hens may help to solve this
problem. Many studies have been conducted to determine embryo yolk absorption and fatty acid
compositions in fresh yolk (Yadgary et al., 2010; Nangsuay et al., 2011). However, few research
studies have been conducted to determine the effect of breeder hen age on yolk fatty acid profile
during different stages of embryonic development. The objectives of this study were to

25
investigate dynamic changes of yolk fatty acid concentrations from fresh egg, embryonic day 17
(E17; transfer day), and at hatch in 3 different ages of hens: 28, 35, and 49wk of age.
MATERIALS AND METHODS
Stock and Management
Hatching eggs (125eggs/age) were obtained from breeder hens (Cobb 500) in the same flock at
28, 35, and 49wk of age. Breeder hens were fed a standard Breeder diet containing 2,915kcal
ME/kg and 15.5% CP (Table 1). The rearing condition and management was followed Cobb
Breeder Management Guide (Cobb-Vantress, 2008). Egg weights were ranged within 5g
difference for each age: 53-57g, 58-62g, and 66-70g for 28, 35, and 49wk hens, respectively.
Twenty five eggs (or hatched chicks) were used for each sampling for fresh yolk, E17 yolk, and
residual yolk at hatch. For each sampling time, 6 yolks were saved (-20 0C) for fatty acid
determination.
Fatty acid concentration determination
Yolk fatty acid profiles were determined on dry matter basis using direct methylation method
described by Wang et al (2000). In brief, 50mg of dry yolk were weighed into screw-capped
tube. Then, 0.5ml (2.0mg/ml) of tridecanocid acid (C13:0) was added to each tube as internal
standard followed by 1ml of methanol, and 3ml of 3N-methanolic HCl. The capped tubes were
then vortexed and put in water bath at 95 0C for 1 hour. After cool-down for 15 minutes at room
temperature, 1ml of saturated NaCl was added to each tube followed by 2ml of hexane. Tubes

26
were centrifuged at 3,500 rpm for 5 minutes. Fatty acid methyl esters (FAMEs), the clear layer
on top, were taken into GC vial for fatty acid analysis. FAMEs were separated and quantified by
GC-2010 Plus gas chromatography (Shimadzu, Columbia, MD) using capillary column SP-2340
(Sigma-Aldrich, St. Louis, MO) and helium gas as a carrier. The injector and flame ionization
detector (FID) were set at 240 0C. Column temperature was started at 140 0C with 3 min holding,
and increased 5 0C/min to 170 0C and held for 35 min. The column temperature was then
increased 8 0C/min to 220 0C and held for 15 min. Injection volume was 1µl and split ratio was
set at 1:50.
The concentration (mg/g) of fatty acids in egg yolk was calculated as the equation described
below (Wang et al., 2000).
Fatty acid concentration (mg/g) = [R. F. x peak area of a given fatty acid]/sample weight (g)
Where:
R.F. stands for response factor, and was calculated as follow:
R.F. =concentration of internal standard (mg ml⁄ )
peak are of internal standard
All procedures in this study were conducted in accordance with the guide for the care and use of
laboratory animals of the National Institutes of health, and was approved by the University of
Arkansas Institutional Animal Care and Use Committee (protocol # 13002).

27
Statistical Analysis
The analysis of variance (ANOVA) was performed using SAS software (SAS 9.4). Differences
among treatment means of interested parameters were separated using Duncan multiple range
test at P<0.05.
RESULTS
As shown in Table 2, yolk weights and yolk free body weight at hatch showed the same patterns
as their original egg weights which significantly increased by age (P<.0001) in all stages of
development. Yolk absorption from E1 to E17 significantly increased (P<0.05) by age (23.52,
25.02, and 28.04% for 28, 35, and 49wk, respectively). However, the rate of yolk absorption
slowed down by age from E17 to hatch (68.29, 66.82, and 51.29% for 28, 35, and 49wk,
respectively), resulting in the lowest (P<.0001) total percentage of yolk absorption in embryo
from 49wk hens, as compared to embryo from 28 and 35wk hens (65.14 vs. 75.90 and 75.48%,
respectively). The absolute amounts (gram) of dried yolk being absorbed during incubation
process were shown in Table 3. Although the rate of yolk absorption was lower in older hens, the
total amount of yolk being absorbed was higher. The same scenario was shown when the total
milligrams of fatty acid being absorbed at different stages of incubation were calculated (Figure
1). The fatty acid concentrations (mg/g dried yolk) in fresh yolk, residual yolk on E17 and at
hatch were presented in Table 4. The concentration of each fatty acid decreased continuously
throughout developing period. Breeder hen age significantly affected fatty acid compositions
(P<.001) in all stages of development. The concentrations of fatty acids in fresh yolk, residual
yolk at E17, and embryo yolk sac increased by hen age. The concentrations of fatty acids in

28
blood plasma presented in mg/ml was illustrated in Table 5. As what showed in the yolk, the
concentration of blood plasma fatty acids increased from 28wk to the highest level at 35wk, and
then decreased at 49wk of age.
DISCUSSION
Yolk content increased more than 40% in the eggs from 30wk hens as compared to 50wk old
hens (Yadgary et al., 2010). This result is in agreement with the present study which yolk weight
increases about 50% from 28wk to 49wk old hens (Table 2). Previous studies indicated that the
rate of yolk absorption from E1 to E15 (Yadgary et al., 2010) or E18 (Nangsuay et al., 2011) was
lower in embryo from younger hens, which showed the same scenario with the current study. In
the current study, the rate of yolk absorption for E17 to hatch was higher in young hens, which is
in agreement with Sahan et al. (2014) reporting the higher relative yolk absorption in young
flock from E18 to hatch. However, Yadgary et al, (2010) found that the certainly same amount of
fat was absorbed at hatch for embryo from both 30 and 50wk old hens. On the other hand, it had
been proposed that embryo from young hens (25wk old) had much lower ability to take up fat
into their tissue as compared to those embryo from old hens (41wk of age), which might lead to
the higher late death in the last period of incubation in embryo from young hens (Noble et al.,
1986; Yafei and Noble, 1990). Also, Sahan et al. (2014) found that the absolute amount of yolk
being absorbed at E18 and at hatch was higher in older (52wk old) breeder hens as compared to
younger ones (36wk old). These results are in agreement with the present study that absolute
amount (mg) of fatty acids being absorbed was higher in the embryo from older hens although
the total rate of yolk absorption was lower (Table 2 and 3). This makes sense because yolk is the
29
main source of energy for embryo during incubation process (Speake et al., 1998). Therefore,
when the energy need reaches the certain point, the bigger eggs with bigger yolk content should
have more potential afford to provide extra energy to embryo for growth resulting in the higher
chick weight at hatch. As previously proposed, embryo used fat from yolk sac for small intestine
development and body growth (Noy and Sklan, 1999; Meijerhof, 2009), it is possible that chicks
hatched from older hens stored larger yolk sac with higher concentration of fatty acids in that
yolk, which can be further used for growth and livability. This may result in the better growth
rate of chicks from older hens as has been well known documented (Tona et al., 2004).
The major fatty acids in fresh yolk were C16:0, C16:1, C18:0, C18:1, and C18:2, which is in
agreement with Sahan et al. (2014). The concentration of each fatty acid as well as the total
concentration were affected by hen age, which is in corresponding to the previous studies
(Nielsen, 1998; Latour et al., 2000; Yalcm et al., 2008). Although the relative amount of fatty
acids being absorbed from E1 to hatch was higher in old hens, the percentage of fatty acid
absorption was higher in young hens because of the fact that young hens produce smaller egg
yolk with lower fatty acid concentration (Figure 1). This contributed to the total percentages of
fatty acid absorption throughout the incubation period were approximately 91.39, 87.54, and
75.71% for eggs from 28, 35, and 49wk old hens, respectively. In this high percentage of total
fatty acid absorption in 28wk old hens (91.39%), C16:0 and C18:0 itself accounted about 91.52
and 91.75%, respectively (data not shown). These percentages indicated the potential positive
effect if young hens can produce higher concentration of fatty acid in their yolks, which can
contribute to the higher fatty acid left for growth of the progeny after hatch.
It can be concluded that age of breeder hens affected the yolk fatty acid profile and yolk
absorption during embryonic development. The smaller yolk size leaded to the higher percentage

30
of yolk absorption in young hens, but the absolute amount of yolk as well as fatty acid being
absorbed was still lower than in old hens. With the bigger residual yolk size at hatch and the
higher concentration of fatty acid in that residual yolk, it might be a reason why chicks from
older hens grow better than those chicks from younger ones.

31
Table 1: Experimental diet and Nutritional value
Ingredient (%) Nutrient (%)
Corn grain 66.3 Calculated:
Soybean meal 23.1 ME (kcal/kg) 2860
Fat 1.3 Crude Protein 15.5
Limestone 6.78 Dig Lysine 0.76
Dicalcium Phosphate 1.81 Dig Met+Cys 0.67
Salt 0.17 Dig. Methionine 0.42
Alimet 0.19 Dig. Threonine 0.52
Choline 0.10 Dig. Tryptophan 0.16
Vitamin premix 0.07 Dig. Arginine 0.95
Sodium premix 0.10 Crude fat 3.38
Mineral premix 0.08 Calcium 3.25
Phosphorus-Non 0.41
Sodium 0.2
Analyzed:
Crude Protein 15.1
Crude fat 4.83
Ash 10.27
Total 100.0 Calcium (ppm) 33664

32
Table 2: Effect of hen age on yolk weight and yolk absorption at different stages of development
Age
(wk)*
Egg
weight
(g)
Fresh
yolk
(g)
E17
yolk
(g)
Hatch
yolk
(g)
Yolk
free
BW
(g)
%Fresh
yolk
%Yolk absorption
E1 to
E17
E17 to
hatch Total
28 55.01c 15.06c 11.49c 3.63c 34.41c 27.39c 23.52b 68.29a 75.9a
35 60.43b 17.86b 13.30b 4.36b 36.74b 29.55b 25.02ab 66.82a 75.5a
49 68.56a 22.64a 16.39a 8.00a 43.23a 33.02a 28.04a 51.29b 65.1b
SEM 0.361 0.209 0.18 0.152 0.304 0.184 0.634 0.849 0.57
P-value <.0001 <.0001 <.0001 <.0001 <.0001 <.0001 0.039 <.0001 <.0001
a,b,cMeans within the same column with different superscripts differ significantly
*n=25 for each sampling time for each age
Table 3: Effect of hen age on absolute amount of yolk being absorbed at different stages of
development
Age Egg
weight
(g)
Dried
fresh
Yok
(g)
Dried
E17
yolk
(g)
Dried
Hatch
yolk
(g)
Yolk
free
BW (g)
%Fresh
yolk
gram dry yolk absorbed
(wk) E1 to
E17
E17 to
hatch Total
28 55.01c 7.77c 5.73c 1.84c 34.41c 27.39c 2.04b 3.89b 5.93b
35 60.43b 9.21b 6.96b 2.18b 36.74b 29.55b 2.26a 4.78a 7.04a
49 68.56a 11.28a 8.74a 4.32a 43.23a 33.02a 2.55ab 4.42ab 6.96a
SEM 0.361 0.209 0.18 0.152 0.304 0.184 0.634 0.849 0.57
P-
value <.0001 <.0001 <.0001 <.0001 <.0001 <.0001 0.035 <.0001 <.0001
a,b,cMeans within the same column with different superscripts differ significantly
*n=25 for each sampling time for each age

33
Table 4: Effect of hen age on selected fatty acid profiles at different stages of development
Stage of
development
Fatty
acids1
C14:0 C16:0 C16:1 C18:0 C18:1 C18:2 C20:3n6 C20:5n3 Total
mg/g dry yolk
Fresh yolk
28wk 3.97a 277.80b 38.52a 89.72b 434.88b 117.87c 22.25 10.61b 1027b
35wk 4.24a 307.44a 38.24a 98.15a 490.91a 141.16a 22.53 12.94a 1154a
49wk 3.51b 270.23b 27.19b 93.63b 430.85b 137.22b 23.27 13.78a 1049b
SEM 0.12 5.88 1.9 1.42 10.21 3.62 0.34 0.51 20.47
P-value 0.003 <.0001 <.0001 0.019 <.0001 <.0001 0.509 0.002 <.0001
E17 yolk
28wk 3.54b 198.20b 28.77a 61.85b 313.70b 84.27c 11.23b 3.4c 714.3c
35wk 3.03c 196.61b 21.56b 64.43b 329.97b 90.18b 12.4b 4.36b 734.2b
49wk 3.72a 231.79a 22.15b 77.44a 387.52a 127.16a 16.5a 6.5a 874.6a
SEM 0.1 5.78 1.19 2.45 11.45 6.71 0.84 0.46 25.32
P-value <.0001 <.0001 <.0001 <.0001 <.0001 <.0001 <.0001 <.0001 <.0001
Hatched yolk
28wk 2.31b 99.28c 12.08b 31.21c 255.07c 53.30c 3.63c 0.37b 373.0c
35wk 2.66a 152.09b 14.49a 45.87b 285.71b 72.94b 7.33b 1.25b 608.8b
49wk 2.63a 163.31a 14.91a 56.97a 354.68a 103.77a 11.36a 3.58a 747.9a
SEM 0.07 9.88 0.59 3.76 14.85 7.38 1.14 0.52 24.97
P-value 0.0261 <.0001 0.0018 <.0001 <.0001 <.0001 <.0001 0.005 <.0001 a,b,cMeans within the same column with different superscripts differ significantly 1n=6 for each sampling time for each age

34
Table 5: Effect of hen age on fatty acid concentration in blood plasma
Age
(wk)
Fatty acids (mg/ml of blood plasma)1
C6:0 C8:0 C10:0 C16:0 C16:1 C18:0 C18:1n9c C18:2n6c C20:3n6 Total
FA
28 3.75 1.85 2.07 27.4b 3.83 8.33c 37.92c 14.26b 1.99c 103.7c
35 4.98 2.4 2.74 40.49a 4.49 13.99a 68.05a 19.78a 2.84a 171.7a
49 6.83 3.58 2.83 29.87b 4.45 12.22b 59.91b 18.95a 2.51b 138.3b
SEM 0.79 0.394 0.41 1.693 0.145 0.649 3.37 0.697 0.093 6.972
P-value 0.3 0.19 0.73 0.0003 0.108 <.0001 <.0001 <.0001 <.0001 <.0001
a,b,cMeans within the same column with different superscripts differ significantly 1n=6 for each sampling time for each age
Figure 1: Effect of hen age on total amount of fatty acid being absorbed at different stages of
development

35
REFERENCES
Cobb-Vantress. 2008. Cobb 500 Breeder Management Guide. Blueprint for Success. Cobb-
Vantress, Siloam Spring, AR.
Freeman, B. M., and M. A. Vince. 1974. Development of the Avian Embryo. Chapman and Hall,
London, UK.
Latour, M. A., A. A. Divitt, R. A. Meunier, J. J. Stewart, and B. A. Watkins. 2000. Effects of
conjugated linoleic acid. 2. Embryonic and neonatal growth and circulating lipids. Poult.
Sci. 79: 822-826.
Meijerhof, R. 2009. The influence of incubation on chick quality and broiler performance. Pages
167-170 in 20th Annual Australian Poultry Science Symposium. 9-11 February 2009.
Sydney, NSW, Australia.
Nangsuay, A., Y. Ruangpanit, R. Meijerhof, and S. Attamangkune. 2011. Yolk absorption and
embryo development of small and large eggs originating from young and older breeder
hens. Poult. Sci. 90:2648-2655.
Nielsen, H. 1998. Hen age and fatty acid composition of egg yolk lipid. Br. Poult. Sci. 39:53-56.
Nobel, R. C., and M. Cocchi. 1990. Lipid metabolism and the neonatal chicken. Prog. Lipid Res.
29: 107-140.
Noble, R. C., F. Lonsdale, K. Connor, and D. Brown. 1986. Changes in the lipid metabolism of
the chick embryo with parental age. Poult. Sci. 65:409-416.
Noy, Y., and D. Sklan. 1999. Energy utilization in newly hatched chicks. Poult. Sci. 78:1750-
1756.
O’Sullivan, N. P., E. A. Dunnnington, and P. B. Siegel. 1991. Relationships among age of dam,
egg component, embryo lipid transfer and hatchability of broiler breeder eggs. Poult. Sci.
70:2180-2185.
Romanoff, A. L. 1967. Biochemistry of the Avian Embryo. Wiley, New York, NY.
Romanoff, A. L., and A. J. Romanoff. 1949. The Avian Egg. Wiley and Sons Inc., Ney York,
NY.
Sahan, U., A. Ipek, and A. Sozcu. 2014. Yolk sac fatty acid composition, yolk absorption,
embryo development, and chick quality during incubation in eggs from young and old
broiler breeders. Poult. Sci. 93:2069-2077.
Speake, B. K., A. M. Murray, and R. C. Noble. 1998. Transport and transformations of yolk
lipids during development of the avian embryo. Prog. Lipid Res. 37:1-32.
Tona, K., O. Onagbesan, B. De Ketelaere, E. Decuypere, and V. Bruggeman. 2004. Effects of
age of broiler beeder s and egg storage on egg quality, hatchaqbility, chick quality, chick
weight, and chick posthatch growth to forty-two days. J. Appl. Poult. Res. 13:10-18.

36
Vieira, S. L., and E. T. Moran Jr. 1998a. Broiler chicks hatched from egg weight extremes and
diverse breeder strains. J. Appl. Poult. Res. 7:372-376.
Vleck, C. M. 1991. Allometric scaling in avian embryonic development. Chapter 2. Pages 39-58
in Avian Incubation. S. G. Tullett, ed. Butterworth-Heinemann, London, UK.
Yagary, L., A. Cahaner, O. Kedar, and Z. Uni. 2010. Yolk sac nutrient composition and fat
uptake in late-term embryos in eggs from young and old broiler breeder hens. Poult. Sci.
89:2441-2452.
Yafei, N., and R. C. Noble. 1990. Further observations on the association between lipid
metabolism and low embryo hatchability in eggs from young broiler birds. J. Exp. Zool.
253:325-329.
Yalcm, S., N. Bagdathoglu, V. Bruggeman, E. Babacanoglu, I. Uysal, J. Buyse, E. Decuypere,
and P. B. Siegel. 2008. Acclimation to heat during incubation. 2. Embryo composition
and residual yolk sac fatty acid profiles in chicks. Poult. Sci. 87:1229-1236.

37
III. The study of de novo lipogenesis in young hens
N. Boonsinchai, G. Mullenix J. CaldasA. Magnuson, J. England, and C. N. Coon;
University of Arkansas, Fayetteville, AR,

38
ABSTRACT
The aim of this study was to determine whether the none-lipid precursors: glucose, alanine, and
leucine can be used for lipid synthesis in young breeder hens at 25wk of age. Eighteen Cobb 500
breeder hens were divided into three groups of six hens each, one group of which were dosed
with one of carbon (13C) isotopes: U-13C Glucose, L-Alanine, and L-Leucine for 14 days. Four
hens in each group were dosed with 50mg/hen/day isotopes, and other two were used as control.
After 14d of dosing, eggs were collected for two consecutive days at 3 different times: Day 1&2,
5&6, and 9&10 in order to have enough number of samples. On Day 10 after dosing, all hens
were killed and abdominal fat pad samples were taken. For each time of sampling, six-dosed and
four-control eggs from each group were used for isotope determination. Fatty acid methyl esters
(FAME) were extracted from dried yolk and abdominal fat, and the isotope enrichment in
palmitic acid was analyzed using the gas chromatography equipped with mass spectrometer (GC-
MS). The abundance values of fragments m/z (mass per charge ratio) 270, 272, 274, and 276
were monitored to represent the 12C-palmitic acid (M), 2·13C-palmitic acid (M + 2), 4·13C-
palmitic acid (M + 4), and 6·13C-palmitic acid (M + 6), respectively. The enrichment of isotope-
derived palmitic acid synthesized from U- 13C glucose and L-13C alanine significantly decreased
(P<.0001) from Day 1 (0.578 vs. 0.381%, respectively) to Day 5 (0.505 and 0.171%,
respectively) and were negligible on Day 10 (0.032 and 0.047%, respectively). In contrast, the
enrichment of labeled palmitic acid derived from L-13C leucine in egg yolk significantly
increased (P<.0001) from Day 1 to Day 10 (0.112, 0.207, and 0.355%, respectively). The
concentrations of labeled palmitic acid were in the same trends with the enrichment percentages
for all sampling times. There were no differences in both percentage of enrichment and
concentration (mg·g-1) of labeled palmitic acid in abdominal fat pad between dosed and control

39
hens. These results indicated that besides glucose, breeder hens use amino acids as the precursors
for de novo lipogenesis, and the mechanisms of using glucogenic and ketogenic amino acids as a
precursor for fatty acid synthesis may be different.
Keywords: de novo lipogenesis, labeled isotopes, fatty acid synthesis, glucogenic, ketogenic

40
INTRODUCTION
In the broiler breeder industry, it is critical for breeder hens to have enough fleshing score (score
3-4 out of 5) and pelvic fat (more than 95% of the flock) before receiving photo stimulation,
which contributes to a good peak production and persistency of lay, high start hatchability and
livability of first-week progeny as well as low mortality of breeder hens during peak production
(Bakker, 2015). Pelvic fat can be determined by touching the pelvic bones and estimate the
amount of fat present (Harper, 2008). The de novo lipogenesis (DNL) and the synthesis of
triglycerides are important factors in fat deposition and efficiency of animal production (Murphy,
2006).
DNL can take place in both liver and adipose tissue. In pig and cow, DNL occurs mainly in
adipose tissue (Ballard et al., 1969), but for human and avian species it mainly occur in the liver
(O’Hea and Leveille, 1969a) and very low levels in the adipose tissue (Goodridge, 1968). DNL
is less active in human even in the conditions of excess carbohydrate (Schwarz et al., 1995;
Diraison et al., 2003). On the other hand, DNL seems to be more active in animals. In swine,
more than 80% of fatty acids in adipose tissue comes from DNL (O’Hea and Leveille, 1969b). In
rodent, about 50% of fatty acids in liver and adipose tissue comes from DNL (Brunengraber et
al., 2003).
The precursors for DNL can be either glucose or acetyl-CoA, which can be differently preferable
among species. In rodents and swine, glucose is the main substrate of DNL in adipose tissue
(Dunshea et al., 1998), whereas ruminants use acetate as the substrate for DNL in both liver and
adipose tissue (Ballard et al., 1969). Acetyl-CoA is obtained from glucose, and is used as the
precursor for palmitic acid synthesis as the primary product of DNL, which take place in the

41
cytoplasm (Botham and Mayes, 2006). The DNL from glucose substrate has been reported to
occur highly in young breeder hens, reduced by hen age (Salas, 2011). Another possible
substrate for DNL is amino acids which can come from both food and breakdown of muscle
tissue in term of protein turnover. An excess of amino acid for protein synthesis can be converted
into acetyl-CoA which is the substrate for DNL (Murray et. al., 2012).
In 1990, Geraert et al. studied DNL from glucogenic amino acids: L-U-14C alanine and glutamic
acid comparing between lean and fat chickens. They found that, in fed state DNL from labeled
alanine as well as glutamate was greater in fat chicks than those lean ones. This data suggests
that DNL can occur in any physiological status. The study of protein turnover in broiler breeder
pure line and broiler breeder hens illustrated that the protein degradation rate increased
significantly when the hens enter sexual maturity, and gradually decreased after peak production
(Vignale, 2014). The same result was reported by Ekmay (2011) that protein degradation in
breeder hens was high at beginning of lay and after 45wk of age. These results were in consistent
with the body composition study conducted by Salas (2011) showing that lean mass of broiler
breeder hens was steady from beginning of lay until after 45wk of age. These observations
suggest that breeder hens may use muscle protein for egg formation from beginning of lay
through after 45wk of age. Ekmay (2011) also reported that during early of lay, a majority of
lysine found in egg albumen came from endogenous origin. The question still remain whether
hens can use the product of protein turnover for egg yolk formation or not. There is no evidence
to confirm that hens use amino acids for lipogenesis in egg yolk. The objective of the present
study was to determine the use of amino acids and glucose as the precursors for fatty acid de
novo synthesis in the very young breeder hens.
42
MATERIALS AND METHODS
Experimental procedure
At the beginning of lay (25wk old, estimated time), 18 Cobb 500FF (fast feathering) breeder
hens were individually housed in the cage (47 cm × 30.5 cm × 47 cm) containing an individual
feeding trough and nipple drinker. Hens were fed a commercial breeder diet containing 15.5%
CP and 2860 kcal/kg ME as shown in Table 1 of Chapter II, and the lighting program was 13
hours a day. All hens were restricted fed every day based on target egg production according to
the Cobb Breeder Management guide (Cobb-Vantress, 2008). Hens were divided into three
groups of six hens each, one of which were dosed with one of carbon (13C) isotopes: U-13C
Glucose, L-Alanine, and L-Leucine (Cambridge Isotope Laboratories, Inc., Andover, MA). Four
hens in each group were dosed with 50mg/hen/d isotopes for 14d and other two were used as
control. Isotopes were diluted in distilled water (50mg/ml) and the solutions were then
individually pipetted on top of the feed that the hens received each day. In order to have enough
yolk samples, the eggs were saved in two consecutive days at three different times: Day 1&2,
5&6, and 9&10 to represent the samples on Day 1, 5, and 10 after dosing respectively. Eggs and
yolks were individually weighed. Yolk samples were save in the screw-capped cups and stored at
-80 0C freezer for further analysis. For each time of sampling, six-dosed and four-control eggs
from each group were used for isotope determination. All forms of isotopes were intended to be
the precursors for de novo fatty acid synthesis, which can be detected in palmitic acid as the
primary product of lipid synthesis in animals.

43
FAME preparation and isotope enrichment determination
Prior to analysis, yolk samples were lyophilized using the freeze dryer Genesis SQ 12 EL (The
Virtis Compay, Gardiner, NY) and then homogenized using a common coffee grinding machine.
The preparation of fatty acid methyl esters (FAME) was on the procedure described by Eder
(1995). In brief, yolk samples were individually weighed (approximately 100-120 mg) into a
15.0ml screw-capped test tube. Then 0.5ml of C13:0 internal standard solution (2.0mg glyceryl
tritridecanoate (Sigma-Aldrich, St. Louis, MO) dissolved in 1.0ml n-hexane) was added to each
tube following by 2.0ml of 0.2M metanolic-KOH. Tubes were tightly capped, vortexed, and
digested in a heating block at 50 0C for 45 minutes. During digestion, tubes need to be
continuously vortexed 2-3 times per minute. After cooled down, 1.0ml of saturated NaCl
solution was added to each tube following by 1.0ml of n-hexane. The tubes were again capped,
vortexed, and centrifuged at 3000 rpm for 5 minutes. After centrifugation, the hexane layer
containing FAME was separated on top of the aqueous layer. Then approximately 200µl each of
the hexane layer was transferred to two GC vials equipped with insertions and tightly capped.
One of the GC vial was analyzed for isotope enrichment and another one was used to determine
the fatty acid concentration. The Supelco 37 Component FAME Mix (Sigma-Aldrich, St. Louis,
MO) was used to determine the standard retention time for each fatty acid.
An Agilent 7890A gas chromatograph equipped with Agilent 5975C mass spectrophotometer
and Agilent 7683B series auto injector (Agilent Technologies, Santa Clara, CA) was used to
separate FAME and measure isotope enrichment. One microliter of FAME dissolved in n-hexane
was injected (split 1:200) and the needle was automatically washed with methanol and
acetonitrile between each injection. A silica capillary column (Agilent 19091S-433, 30m x
0.25mm x 0.25µm) was used with helium gas as a carrier (ultrahigh purity grade) at flow rate

44
1.0ml/min. The GC oven temperature was programed in series starting at 100 0C (hold 1 min),
then was raised at 6 0C/min to 180 0C, followed by increasing of 3 0C/min to 200 0C (hold 15
min), and end up with 10 0C/min to 230 0C (hold 10 min). The total run time was 49 minutes.
The mass selective detector (MSD) was operated under EI and SIM modes. The abundance
values of fragments m/z (mass per charge ratio) 270, 272, 274, and 276 were monitored to
represent the 12C-palmitic acid (M), 2·13C-palmitic acid (M + 2), 4·13C-palmitic acid (M + 4),
and 6·13C-palmitic acid (M + 6), respectively (Salas, 2011). The abundance values of the natural
occurring of those 13C fragments received from control yolks were subtracted from the treatment
yolks.
A GC-2010 Plus gas chromatograph equipped with the flame-ionization detector (FID) and
AOC-20i auto injector (Shimadzu, Columbia, MD) was used to determine the fatty acid
concentration. One microliter of FAME dissolved in n-hexane was injected (split 1:100) and the
needle was automatically washed with n-hexane between each injection. A silica capillary
column SGE BPX70 (50m x 0.22mm x 0.25µm) was used with helium gas as a carrier (ultrahigh
purity grade) at flow rate 0.5ml/min. The GC oven temperature started at 180 0C (hold 2 min),
then was raised at 5 0C/min to 200 0C, followed by /83 0C/min to 220 0C (hold 8 min). The total
run time was 58.5 minutes. The concentration of fatty acid was calculated as described
previously in Chapter II.
All procedures in this study were performed in accordance with the guide for the care and use of
laboratory animals of the National Institutes of health, and was approved by the University of
Arkansas Institutional Animal Care and Use Committee (protocol # 13002).
45
Statistical Analysis
Data were separately analyzed DNL from each labeled isotope. The analysis of variance
(ANOVA) was performed using SAS software (SAS 9.4) to compare interested parameters
among different sampling times. Differences among treatment means of interested parameters
were separated using Duncan multiple range test at P<0.05.
RESULTS
The non-lipid substrates: U- 13C glucose, L-13C alanine, and L-13C leucine were used as the
precursors of DNL, which was measured in form of palmitic acid in this study. After 14 d of
dosing, eggs were collected at three different times for the next 10 d. The DNL of palmitic acid
from labeled glucose, alanine, and leucine were shown in Table 1 and Figure 1. The egg yolk
lipid synthesis from U- 13C glucose and L-13C alanine significantly decreased from Day 1 to Day
5 and were negligible on Day 10. The enrichment of alanine into palmitic acid seemed to be
lower than glucose, but at Day 10 there was higher concentration of alanine than glucose. In
contrast, the enrichment as well as concentration of labeled palmitic acid derived from L-13C
leucine increased significantly from Day 1 to Day 10. After 10 d of egg collection (Day 10), all
hens were killed and their abdominal fat pad were collected and analyzed for isotope enrichment.
As shown in Table 2, there were no difference in both percentage of enrichment and
concentration (mg·g-1) of labeled isotopes in abdominal fat pad. These results suggested that the
mechanisms of using glucogenic and ketogenic amino acids as a precursor for fatty acid
synthesis were different.

46
DISCUSSION
The purpose of this trial was to illustrate that hens entering sexual maturity use not only glucose
but also amino acids for the synthesis of egg yolk lipids. As we can see from Table 1 and Figure
1, although the efficiency of converting amino acids into palmitic acid seemed to be lower than
the conversion of glucose, the results can confirm that young hens use fatty acids not only for
protein synthesis but also lipid genesis. The conversion of glucogenic amino acids (alanine and
glutamic acid) into lipid in fat and lean chickens was reported by Geraert et al. (1990) who found
that, in fasted state, lean chickens had significantly higher DNL from amino acid than the fat
ones. The authors concluded that part of dietary amino acids was diverted from protein synthesis
towards lipogenesis. This result suggested that DNL from amino acids may be high in young
hens since they do not accumulate much fat as the old hens do. In this study, the lower
enrichment and concentration of alanine-derived palmitate as compared to glucose-derived one
may be due to the fact that alanine is the 3-carbon molecules whereas glucose contains 6
carbons. Also, the metabolic fates of amino acid received form the diet can be either used for
protein synthesis or converted to metabolic intermediates, especially pyruvate. Pyruvate can then
be converted into acetyl-CoA for energy purpose or fatty acid synthesis, or used for
gluconeogenesis (Margaret and John, 2013). This may be a reason why the enrichment of alanine
into palmitic acid was lower than the conversion of glucose into palmitic acid.
The study in metabolic fates of leucine in fat and lean chickens conducted by Memier et al.
(1986) revealed that fat chickens illustrated significantly higher lipogenesis and protein synthesis
than lean chickens. In this study, the incorporation pattern of leucine into palmitic acid was
opposite to alanine and glucose. While the enrichment of alanine and glucose into palmitic acid
decreased by days after dosing, the enrichment of leucine into palmitic acid increased (Table 1

47
and Figure 1). The possible reason for this scenario may be due to the fact that leucine is
ketogenic amino acid which cannot be used for gluconeogenesis as alanine. The carbon skeleton
of leucine can be converted into acetyl-CoA or acetoacetate which can then be used for energy
purpose or fatty acid synthesis (Margaret and John, 2013). It is also possible that most part of
leucine was used for protein synthesis and fat store in adipose tissue rather than used for lipid
synthesis in the egg yolk as can be seen from the higher concentration of leucine-derived
palmitic acid in the abdominal fat at the end of the experiment (Table 2) as compared to the
concentration of glucose and alanine-derived palmitic acids.
The results from this study also suggested that protein turnover plays a crucial role in egg
formation in the young hens. Egg formation is the long process which takes up to 25 to 26 hours
(Jacob, 2015) so that it is possible that hens will rely on the product of protein turnover for egg
formation. Watford (1994) reported that the muscle releases large quantities of alanine during
postabsorptive state, and the rate of release increases during early starvation. The result from this
study is in agreement with man previous studies. Vignale (2014) reported that the protein
degradation rate increased significantly when the hens enter sexual maturity, and gradually
decreased after peak production. Ekmay (2011) proposed that protein degradation in breeder
hens was high at beginning of lay and after 45wk of age. The result from the high protein
turnover rate can be seen from the plateau of lean mass from beginning of lay until after 45wk of
age (Salas, 2011). In conclusion, young breeder hens use both glucose and amino acids as a
substrate of de novo lipogenesis (DNL) for egg yolk lipids.

48
Table 1: De novo lipogenesis from glucose, alanine, and leucine in egg yolk of very young hens
Treatment
Parameter Day after dosing
SEM P-value Day 1 Day5 Day 10
U-13C Glucose %enrichment 0.578a 0.505a 0.032b 0.078 <.0001
mg·g-1 0.874a 0.764a 0.041b 0.119 <.0001
mg·egg-1 5.578a 5.234a 0.338b 0.769 <.0001
L-13C Alanine %enrichment 0.381a 0.131b 0.080b 0.039 <.0001
mg·g-1 0.576a 0.208b 0.131b 0.057 <.0001
mg·egg-1 4.041a 1.768b 0.858b 0.413 0.0004
L-13C Leucine %enrichment 0.112c 0.207b 0.355a 0.031 <.0001
mg·g-1 0.169c 0.313b 0.537a 0.046 <.0001
mg·egg-1 0.713c 1.416b 2.466a 0.219 <.0001
1values were subtracted from the control group
a,b,c Means within the same row with different superscripts differ significantly
Table 2: De novo lipogenesis from glucose, alanine, and leucine in abdominal fat pad of very
young hens
Parameter
Treatment SEM P-value
U-13C Glucose L-13C Alanine L-13C Leucine
%enrichment 0.032b 0.463a 0.511a 0.066 <.0001
mg·g-1 0.078b 1.126a 1.236a 0.161 <.0001 1values were subtracted from the control group

49
Figure 1: Concentration (mg/egg) of palmitic acid derived from labeled glucose, alanine, and
leucine
a,b,c Means within the same line with different superscripts differ significantly
5.578a
5.234a
0.338b
4.041a
1.768b
0.858c
0.713c1.416b
2.466a
0
1
2
3
4
5
6
7
Day 1 Day 5 Day 10
mg /
egg
mg/egg U-13C Glucose
mg/egg L-13C Alanine
mg/egg L-13C Leucine

50
REFERENCES
Bakker, W. 2015. The key role of breeder nutrition and management in chick quality.
International hatchery practice. 29(6): 7-9.
Ballard, F. J., R. W. Hanson, and D. S. Kronfeld. 1969. Gluconeogenesis and lipogenesis in
tissue from ruminant and nonruminant animals. Fed. Proc. 28:218-231.
Botham, K. M. 2012. Chapter 23: Biosynthesis of fatty acid and eicosanoids. In R. K. Murray, D.
A. Bender, K. M. Botham, P. T. Kennelly, V. W. Rodwell, and P. A. Weil (Eds.),
Harper’s illustrated biochemistry (pp.216-228).New Yolk, McGraw Hill.
Brunengraber, D. Z., B. J. McCabe, T. Kasumov, J. C. Alexander, V. Chandramouli, and S. F.
Previs. 2003. Influence of diet on the modeling of adipose tissue triglycerides during
growth. Am. J. Physiol. Endocrinol. Metab. 285:E917-E925.
Cobb-Vantress. 2008. Cobb 500 Breeder Management Guide. Blueprint for Success. Cobb-
Vantress, Siloam Spring, AR.
Cobb-Vantress. (2013, November 15). Broiler management guide. Retrieved from http://cobb-
vantress.com/docs/default-source/guides/cobb-broiler-management-guide---english.pdf
Diraison, F., V. Yankah, D. Letexier, E. Dusserre, P. Jones, and M. Beylot. 2003. Differences in
the regulation of adipose tissue and liver lipogenesis by carbohydrates in humans. J.
Lipid Res. 44:846-853.
Dunshea, F. R., B. J. Leury, A. J. Tilbrook, and R. H. King. 1998. Ractopamine increases
glucose turnover without affecting lipogenesis in the pig. Aust. J. Agric. Res. 49:1147-
1152.
Harper, R. (2008). Measuring growth and evaluating reproductive performance of commercial
broiler-breeder pullets fed on varying growth curves. (Master’s thesis). University of
Arkansas, Fayetteville. Available from ProQuest Dissertations and Theses database.
(UMI No. 1456094)
Salas, J. C. (2011). Determination of metabolizable energy requirements and mechanisms of
energy mobilization towards lipid egg formation in broiler breeder hens. (Doctoral
dissertation). University of Arkansas, Fayetteville. Available from ProQuest Dissertations
and Theses database. (UMI No. 3455956)
Eder, K. 1995. Gas chromatographic analysis of fatty acid methyl esters. Journal of
Chromatography B: Biomedical Applications. 671:113-131.
Ekmay, R. D. (2011). Protein utilization and requirements in broiler breeders. (Doctoral
dissertation). University of Arkansas, Fayetteville. Available from ProQuest Dissertations
and Theses database. (UMI No. 3487091)
Geraert, P. A., M. L. Grisoni, S. Guillaumin, C. Law, and M. Larbier. 1990. Amino acids as
energy sources in genetically fat and lean chickens. In Lubec, G., and Rosenthal, G. A.
51
(Eds), Amino acids, chemistry, biology and medicine (pp. 1125-1131). Leiden, The
Netherlands, ESCOM Science Publishers B. V.
Goodridge, A. G. 1968. Metabolism of glucose U-C14 in vitro in adipose tissue from embryonic
and growing chicks. Am. J. Physiol. 214:897-901.
Jacob, J. (2015, May 05). Avian reproductive system-female. Retrieved from
http://www.extension.org/pages/65372/avian-reproductive-systemfemale#.VZdd2PlVhBc
Mamier, B., P. A. Geraert, and M. Larbier. 1986. Metabolic utilization of leucine in a fat and
lean line of chicken. Comp. Biochem. Physiol. 83A:735-737.
Margaret E. B., and T. B. John. 2013. Chapter 14: Amino acid metabolism. In Stipanuk, M. H.,
and Caudill, M. A. (Eds), Biochemical, physiological, and molecular aspects of human
nutrition (pp. 287-330). Missouri, Elsevier Saunders.
Murphy, E. J. 2006. Stable isotope methods for the in vivo measurement of lipogenesis and
triglyceride metabolism. J. Anim. Sci. 84(E. Suppl.):E94-E104.
O’Hea, E. K., and G. A. Leveille. 1969a. Lipid biosynthesis and transport in the domestic chick
(Gallus domesticus). Comp. Biochem. Physiol. 30:149-159.
O’Hea, E. K., and G. A. Leveille. 1969b. Significance of adipose tissue and liver as sites of fatty
acid synthesis in the pig and the efficiency of utilization of various substrates for
lipogenesis. J. Nutr. 99:338-344.
Schwarz, J. M., R. A. Neese, S. Turner, D. Dare, and M. K. Hellerstein. 1995. Short-term
alterations in carbohydrate energy intake in humans. Striking effects on hepatic glucose
production, de novo lipogenesis, lipolysis, and whole-body fuel selection. J. Clin. Invest.
96:2735-2743.
Vignale, K. L. (2014). Protein turnover in broiler, layers, and broiler breeders. (Doctoral
dissertation). University of Arkansas, Fayetteville. Available from ProQuest Dissertations
and Theses database. (UMI No. 3666514)
Wang, Y., H. Sunwoo, G. Cherian, and J. S. Sim. 2000. Fatty acid determination in chicken egg
yolk: A comparison of different methods. Poult. Sci. 79:1168-1171.
Watford, M. (1994). Glutamine metabolism in rat small intestine: Synthesis of three-carbon
products in isolated enterocytes. Biochimica et Biophytsica Acta. 1200:73-78.

52
IV. Comparison of de novo lipogenesis between young and old breeder hens and their
progeny
N. Boonsinchai\
, G. Mullenix, J. Caldas, A. Magnuson , J. England, and C. N. Coon; 1
University of Arkansas, Fayetteville, AR,

53
ABSTRACT
The objectives of this experiment were to compare the rate of de novo lipogenesis (DNL)
between young and old breeder hens as well as their progeny using labeled isotope. Two sets of
experiments were conducted. In experiment 1, fifteen hens from each 28 and 40wk old were
individually housed in the battery cage to represent hens from young and old breeders,
respectively. Twelve hens from each age were dosed with 40mg/hen/d of U-13C Glucose for 14d
and the other three hens were used as control. After 14d-period of isotope dosing, their eggs were
saved at three different times: Day 1, Day 7, and Day 14. For each time of egg sampling, three
hens from treatment and one hen from control group were killed, and their body weight and fat
pad were recorded. Fat samples were also taken. The enrichment of 13C received from glucose in
palmitic acid the yolk and abdominal fat was detected by the GC-MS. Although there were no
significantly differences in the enrichment percentage and the concentration per gram (of dried
yolk) of glucose-derived palmitic acid on Day 1, the total concentration per egg (whole yolk)
was significantly higher (P<0.05) in 40wk than 28wk old hens. However, on Day 7 the
concentration of palmitic acid synthesized from labeled glucose decreased approximately half
way in the yolk from 40wk hens, while there was no change in 28wk hens with slightly increased
concentration per egg. At Day 14 of egg collection, the enrichment percentage as well as the
concentration of isotope-derived palmitic acid was slightly detectable, and did not significantly
differ between two groups of hens. Unlike in the yolk, only abdominal fat of young hens (28wk)
was detected the glucose-derived fat in the noticeable amount, which decreased continuously by
days of sampling, and presented in a very small amount on Day 14. In experimental 2, ten other
hens from each age (28 vs. 40wk) were randomly selected and were artificially inseminated (AI),
and all eggs were saved for hatching. At hatch, eight chicks from each group were raised for 7 d,

54
five of which were orally dosed with 40mg/bird/d of U-13C Glucose, the rest were used as
control. At Day 7, all chicks were killed by CO2 gas and subcutaneous adipose tissue of each
bird was taken. The enrichment of labeled glucose into palmitic acid was measured by the GC-
MS. Chicks from older hens showed higher enrichment percentage and concentration (mg·g-1) of
labeled palmitic acid than those chicks from younger hens. This result indicated the higher DNL
rate in 28wk hens than 40wk old hens, and the higher rate of DNL in adipose tissue of the chicks
from older breeder hens than those chicks from the younger breeders.
Keywords: De novo lipogenesis (DNL), young and old breeder hens, labeled isotope, progeny,
enrichment

55
INTRODUCTION
The main goals for broiler breeder industry are good egg production, long persistency of lay,
good hatchability, and high livability and growth rate of progeny. The reproductive performance
is directly related to hen physiological condition which is contributed from management,
breeding, diseases, and nutrition (Kennard and Chamberlin, 1939). Lipids are the main
component of egg yolk accounting for about 33% (O’Sullivan et al., 1991), and embryos receive
energy mainly from yolk for tissue growth during embryonic development (Nobel and Cocchi,
1990). The results in Chapter II proposed that young hens had lighter yolk weight with lower
concentration of fatty acids in the yolk than old hens, resulting in the lower hatched weight and
slower growth rate. These observations suggested that lipids are important for egg formation and
posthatch progeny growth. It is highly recommended from the breeder company to perform light
stimulation only when hens have enough fleshing and fat reserve (Bakker, 2015). Salas (2011)
postulated that at the beginning of lay, young hens mainly relied on DNL for yolk lipid
formation, thereafter egg yolk lipids were mainly made from dietary fat and body fat reserve.
This result is quite reasonable because young hens have less fat reserve than old hens so that they
still need to build up more fat reserve as well as synthesize of yolk fats. However, the author did
not compare the DNL in abdominal fat pad between young and old breeders. Also, the question
still remains whether the DNL in the progeny from young and old breeder hens is the same or
not. The better understanding on how different lipids are made between young and old breeder
hens will lead to a better nutritional management as well as enhanced reproductive performance.
To gain insight into this obstacle, the study of DNL in young and old breeder hens by using
labeled isotope was conducted. The objectives of this experiment were to compare the age effect
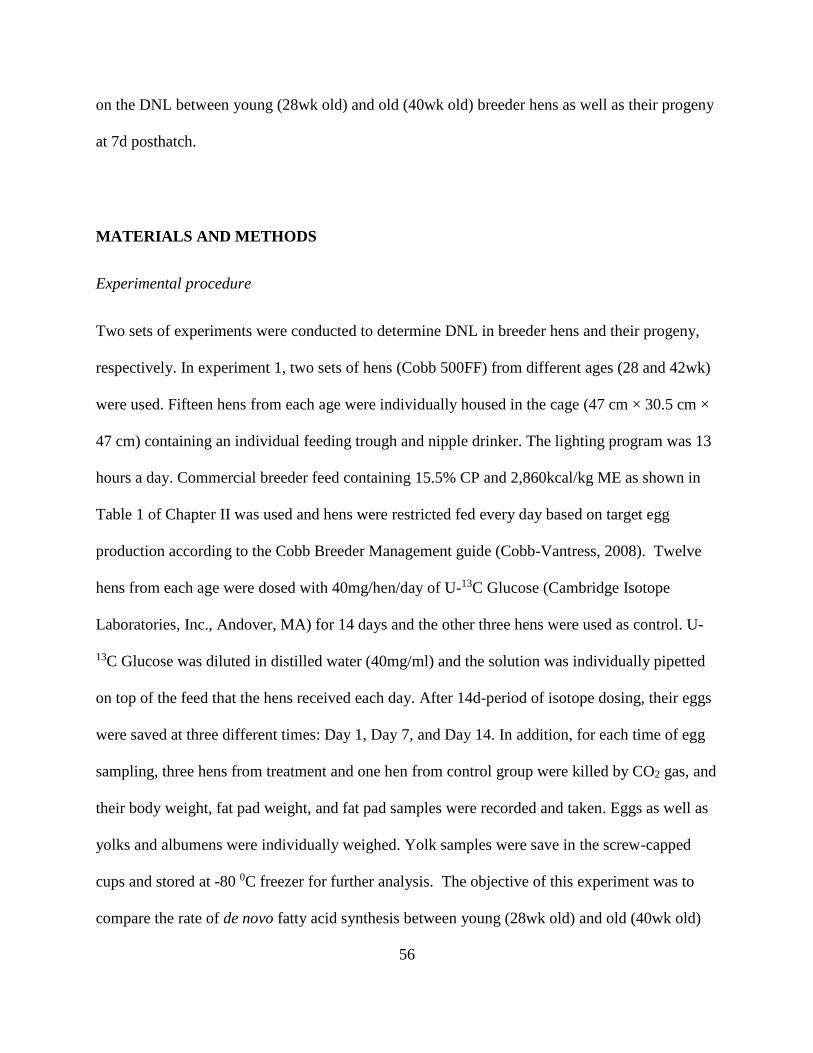
56
on the DNL between young (28wk old) and old (40wk old) breeder hens as well as their progeny
at 7d posthatch.
MATERIALS AND METHODS
Experimental procedure
Two sets of experiments were conducted to determine DNL in breeder hens and their progeny,
respectively. In experiment 1, two sets of hens (Cobb 500FF) from different ages (28 and 42wk)
were used. Fifteen hens from each age were individually housed in the cage (47 cm × 30.5 cm ×
47 cm) containing an individual feeding trough and nipple drinker. The lighting program was 13
hours a day. Commercial breeder feed containing 15.5% CP and 2,860kcal/kg ME as shown in
Table 1 of Chapter II was used and hens were restricted fed every day based on target egg
production according to the Cobb Breeder Management guide (Cobb-Vantress, 2008). Twelve
hens from each age were dosed with 40mg/hen/day of U-13C Glucose (Cambridge Isotope
Laboratories, Inc., Andover, MA) for 14 days and the other three hens were used as control. U-
13C Glucose was diluted in distilled water (40mg/ml) and the solution was individually pipetted
on top of the feed that the hens received each day. After 14d-period of isotope dosing, their eggs
were saved at three different times: Day 1, Day 7, and Day 14. In addition, for each time of egg
sampling, three hens from treatment and one hen from control group were killed by CO2 gas, and
their body weight, fat pad weight, and fat pad samples were recorded and taken. Eggs as well as
yolks and albumens were individually weighed. Yolk samples were save in the screw-capped
cups and stored at -80 0C freezer for further analysis. The objective of this experiment was to
compare the rate of de novo fatty acid synthesis between young (28wk old) and old (40wk old)

57
hens. The enrichment of 13C received from glucose was intended to be converted into palmitic
acid in the egg yolk and abdominal fat pad.
In experimental 2, ten other hens (Cobb 500FF) from each age (28 vs. 40wk) were randomly
selected and were artificially inseminated (AI) with 2x10⁶ cells/ 50µl of pooled semen (Ekmay,
2011) two days in the row. Two days after AI, hatching eggs were saved for the next 6 days. All
hatching eggs were then set into the incubator Jamesway PS500 (Jamesway, Indian Trial, NC)
using the commercial practice: incubator condition 99.6 0F 56% RH with egg turning once an
hour, and hatcher condition 98 0F 53% RH. At hatch, eight chicks from each group were wing-
banded and raised for 7d, five of which were orally dosed with 40mg/bird/d of U-13C Glucose
(Cambridge Isotope Laboratories, Inc., Andover, MA) dissolved in 0.3ml distilled water, the rest
were used as control. Chicks from each group were placed together in the cage (91cm length x
30cm width x 30cm high) installed with nipple drinker and feed trough. Chicks were fed ad
libitum by commercial starter feed containing 2,988kcal/kg ME and 21.0% CP (Table 1) and
reared under commercial management practice (Cobb-Vantress, 2013). On Day 7, all chicks
were killed by CO2 gas and individually weighed. The subcutaneous adipose tissue of each bird
was taken from the same area (under the wings surrounding the breast). The weights of adipose
tissue were recorded and the sample were save in -80 0C freezer for further analysis.
FAME preparation and isotope enrichment determination
Prior to analysis, yolk and fat samples were lyophilized using the freeze dryer Genesis SQ 12 EL
(The Virtis Compay, Gardiner, NY). Yolk samples were then individually homogenized using a
common coffee grinding machine. A small piece of each fat sample was cut and chopped on top

58
of the clean microscope slide. Approximately 100 -120mg of yolk samples and 50mg of fat
samples were used for FAME preparation using the same procedure as described previously in
Chapter III.
The Agilent 7890A gas chromatograph equipped with Agilent 5975C mass spectrophotometer
and Agilent 7683B series auto injector (Agilent Technologies, Santa Clara, CA) was used to
measure isotope enrichment. The concentrations of fatty acids was analyzed by the GC-2010
Plus gas chromatograph equipped with the flame-ionization detector (FID) and AOC-20i auto
injector (Shimadzu, Columbia, MD). The procedures for setting up those instruments were
described previously in Chapter III. The abundance values of fragments m/z (mass per charge
ratio) 270, 272, 274, and 276 were monitored to represent the 12C-palmitic acid (M), 2·13C-
palmitic acid (M + 2), 4·13C-palmitic acid (M + 4), and 6·13C-palmitic acid (M + 6), respectively
(Salas, 2011). The abundance values of the natural occurring of those 13C fragments received
from control yolks were subtracted from the treatment yolks.
All procedures in this study were performed in the same way with the guide for the care and use
of laboratory animals of the National Institutes of health, and was approved by the University of
Arkansas Institutional Animal Care and Use Committee (protocol # 13002).
Statistical Analysis
The Student’s T-test was performed using SAS software (SAS 9.4) to compare interested
parameters between two ages of hens at each sampling time. Differences between treatment
means of interested parameters were separated using Duncan multiple range test at P<0.05.

59
RESULTS
The rates of DNL in egg yolk, hen abdominal fat pad, and progeny adipose tissue were compared
between young (28wk old) and old (40wk old) hens using the incorporation of labeled glucose
into palmitic acid in egg yolk as well as fat tissue. As shown in Table 2 and Figure 1, the
enrichment percentage of glucose-derived palmitic acid and its concentrations decreased
gradually from Day 1 to Day 7, and were slightly present on Day 14. The rate of reduction of the
enrichment percentage seemed to be faster in 40wk hens, as compared to 28wk ones. Although
there were no significantly differences in the enrichment percentage and the concentration per
gram (of dried yolk) of glucose-derived palmitic acid on Day 1, the total concentration per egg
(whole yolk) was significantly higher (P<0.05) in 40wk hens compared to 28wk hens due to the
higher yolk size (data not shown). However, on Day 7 the concentration of palmitic acid
synthesized from labeled glucose decreased approximately half way in the yolk from 40wk hens,
while there was no change in 28wk hens with slightly increased concentration per egg because of
bigger yolk size (data not shown). At Day14 of egg collection, the enrichment percentage as well
as the concentration of isotope-derived palmitic acid was slightly detectable, and were not
significantly differ between two groups of hens.
The enrichment percentage and the concentrations of isotope-derived palmitate in the abdominal
fat pad are presented in Table 3 and Figure 1. Unlike in the yolk, only abdominal fat of young
hens (28wk old), but not old hens (40wk old), was detected the glucose-derived fat in the
noticeable amount. From Day 7 to 14, the enrichment as well as the concentrations of labeled
palmitic acid in abdominal fat of young hens decreased continuously, and present in a very small
amount on Day 14. In the old hens, the levels of isotope-derived palmitic acid were extremely
low for all those sampling times.

60
The DNL in the adipose tissue of the progeny from both 28 and 40wk hens were also compared
(Table 4). After 7d of labeled glucose dosing (40mg/b/d), chicks from older hens showed higher
enrichment percentage and concentration (mg·g-1) of labeled palmitic acid than those chicks
from younger hens. This result indicated the higher lipid synthesis rate in chicks from older
breeder hens.
DISCUSSION
The metabolic fates of glucose can be either oxidized into H2O and CO2 for energy purpose or
used to synthesis of many other products such as glycogen, non-essential amino acids, de novo
lipogenesis, and anaerobic glycolysis (Tappy et al., 1995). In this experiment, the age effect on
DNL was compared between 28wk and 40wk hens using U-13C glucose as a substrate. After 14d-
period of dosing, the enrichment and concentration of labeled palmitic acid decreased by days of
sampling, which is in agreement to the result in Chapter III. On Day 1 of egg collection, the
incorporation of labeled glucose into palmitic acid did not differ between groups. However,
when the yolk size was taken into account, the total milligrams of glucose-derived palmitate per
total yolk was higher in older hens. The rate of reduction of glucose isotope enrichment into egg
yolk palmitic acid seemed to be faster in older hens. As can be seen from Day 7 of egg sampling,
the enrichment percentage as well as milligram of labeled palmitate per egg decreased almost
haft way in 40wk hens, while 28wk hens showed the same enrichment with slightly higher
concentration of labeled palmitate per egg because of a bigger yolk size (data no shown). This
data suggested that DNL for egg lipid in young hens is higher than in old hens. This observation
is consistent with results from Salas (2011) who proposed that young breeder hens use DNL as a

61
main source of egg yolk lipids while old breeder hens mobilized more dietary and body fat in to
egg yolk.
Another interesting aspect is the difference on how young and old breeder hens deposit labeled
palmitate into their abdominal fat pads. As shown in Table 3, the deposition of labeled palmitic
acid in the abdominal fat was significantly high in young hens, whereas the deposition was
extremely low in old hens. This observation suggested that young hens had a higher demand to
build up more amount of fat reserve than old hens. Buyes et al. (2004) proposed that the rate of
glucose oxidation increased with age of broilers, indicating the less DNL in older chicks. What
telling us is young hens need to share the product of DNL into both egg yolk and fat store. This
may be a reason why eggs from young hens contain less concentration of lipids than those eggs
produced by older hens as has been reported in Chapter II.
The comparison of DNL in adipose tissue of progeny from young and old breeder hens was also
conducted (Table 4). The result revealed that baby chicks have ability to synthesis lipids from
glucose. The positive relations between excess carbohydrate intake and lipogenesis in broiler
chicks (Tanaka et al., 1983; Donaldson, 1985) and Turkey poults (Rosebrough and Steele, 1982)
have been reported. Leclercq (1984) reported the positive relationship between the body size and
the number of adipocytes in broiler chicks, and the author concluded that the increase of fat in
adipose tissue was mainly due to hepatic lipogenesis. This observation is in agreement with the
present study finding the higher rate of DNL in progeny from old hens than those birds from
young breeders since chicks hatched from older breeders had bigger body size than those chicks
hatched from younger ones. Geraert et al. (1990) also reported that lipogenesis form glucogenic
amino acids into adipose tissue was greater in fat than in lean birds. On the other hand, the study
conducted by Latour et al. (1996) indicated that the serum of embryo at E18 from young breeder

62
hens (26wk old) exhibited higher cholesterol, high and low density lipoprotein cholesterol, but
lower glucose than those embryo from older hens (36 and 48wk old). Furthermore, the serum of
newly hatched chick from 51wk hens showed the highest level of high density lipoprotein
cholesterol and the lowest level of triglycerides than those chicks from 36 and 64wk hens. These
observations implicated that the lipid constituents were higher in serum of chicks from young
hens. However, Noble and Cocchi, 1990 reported the lower ability of chicks from young hens to
absorb liver lipids, as compared to chicks from old hens. Also, the study conducted by Latour et
al. (1996) did not measure the concentration of lipids in adipose tissue of the chicks, which can
be varied depending upon how efficient the birds can absorb liver lipids into their adipose tissue.
In mature vertebrates, lipoprotein lipase (LPL) is responsible for taking up triglycerol-rich
lipoproteins from dietary or hepatic sources into adipose tissue (Bensadoun and Kompiang,
1979), but the level of LPL is very low at hatch (Speak et al., 1993). It is possible that the DNL
in liver of chicks from young hens is higher than the chicks form old hens, but the naturally low
level of LPL in the blood system of chicks from young hens leads to the accumulation of
lipoproteins than those chick from old hens. In conclusion, age affects DNL in breeder hens and
their progeny. Young breeder hens exhibit higher rate of DNL and deposit more of lipids into
both egg yolk and abdominal fat than old breeder hens. The progeny from the young breeder
hens accumulate lower DNL product into their adipose tissue, as compared to progeny from old
breeder hens.

63
Table 1: Broiler starter diet composition and nutritional content
Ingredient (%) Broiler starter
Corn grain 52.27
Soybean meal 38.79
Ark Poultry Fat 4.12
Dicalcium Phosphate 2.25
Limestone 0.86
Salt 0.38
Methionine 0.35
Lysine 0.28
Chol Cholride-60 0.20
Ark vitamin premix 0.20
Threonine 0.15
Ark Trace Mineral 0.10
Kemin Mold Curb 0.05
Selenium 0.02
Monsanto Sanoquin 6 etho 0.02
Total 100.0
Calculated nutrient (%)
ME (kcal/kg) 2988
Crude Protein 21.0
Calcium 1.0
Non-phytate P 0.5
Total P 0.73
Lysine 1.19
Methionine 0.52
Met + Cys 0.89
Analyzed nutrient (%)
Crude Protein 20.7
Crude Fat 5.52
Ash 5.83
Calcium (ppm) 10860
Phosphorus (ppm) 6722

64
Table 2: The enrichment percentage and concentration of palmitic acid derived from labeled
glucose in egg yolks of young and old breeder hens
Day after
dosing
Parameter1
Age of hen SEM
P-
value 28wk 40wk
Day 1 %enrichment 0.220 0.237
0.009 0.3677
mg·g-1 0.363 0.373
0.014 0.7413
mg·egg-1 2.706 3.774
0.202 0.0014
Day 7 %enrichment 0.218 0.113
0.025 0.0225
mg·g-1 0.361 0.178
0.042 0.0175
mg·egg-1 3.018 1.842
0.317 0.0412
Day 14 %enrichment 0.038 0.025
0.03 0.8462
mg·g-1 0.064 0.039
0.049 0.8301
mg·egg-1 0.551 0.410
0.463 0.8978 1values were subtracted from the control group
Table 3: The enrichment percentage and concentration of palmitic acid derived from labeled
glucose in abdominal fat of young and old breeder hens
Day after
dosing
Parameter1
Age of hen SEM
P-
value 28wk 40wk
Day 1 %enrichment 0.493 0.064
0.097 0.0003
mg·g-1 1.139 0.138
0.227 0.0003
mg·fat-1 78.619 16.906
14.075 0.0006
Day 7 %enrichment 0.415 0.032
0.086 <.0001
mg·g-1 0.962 0.069
0.201 <.0001
mg·fat-1 66.41 8.497
13.046 <.0001
Day 14 %enrichment 0.081 0.021
0.014 <.0001
mg·g-1 0.188 0.045
0.032 <.0001
mg·fat-1 12.975 5.523
1.683 0.0001 1values were subtracted from the control group
65
Table 4: The enrichment and concentration of palmitic acid derived from labeled glucose in
adipose tissue of 7d old progeny hatched from young and old breeder hens
Parameter1
Age of hen SEM P-value
28wk
40wk
%enrichment 0.927
1.458
0.112 0.0056
mg·g-1 3.145
4.087
0.187 0.0016 1values were subtracted from the control group
Figure 1: The concentration of labeled palmitic acid in total egg yolk and abdominal fat pad of
young and old breeder hens (data were taken from Table 2 and 3)
0
10
20
30
40
50
60
70
80
90
0
1
2
3
4
5
6
Day1 Day7 Day14
mg·f
at-1
mg·e
gg
-1
Age of bird (day)
mg·egg-1(28wk) mg·egg-1(40wk) mg·fat-1(28wk) mg·fat-1(40wk)
66
REFERENCES
Bakker, W. 2015. The key role of breeder nutrition and management in chick quality.
International hatchery practice. 29(6): 7-9.
Bensadoun, A., and I. P. Kompiang, 1979. Role of lipoprotein lipase in plasma triglyceride
removal. Fed. Proc. 38:2622-2626.
Buyse, J., B. Geypens, R. D. Malheiros, V. M. Moraes, Q. Swennen, and E. Decuypere. 2004.
Assessment of age-related glucose oxidation rates of broiler chickens by using stable
isotopes. Life Sciences. 75:2245-2255.
Cobb-Vantress. 2008. Cobb 500 Breeder Management Guide. Blueprint for Success. Cobb-
Vantress, Siloam Spring, AR.
Cobb-Vantress. (2013, November 15). Broiler management guide. Retrieved from http://cobb-
vantress.com/docs/default-source/guides/cobb-broiler-management-guide---english.pdf
Salas, J. C. (2011). Determination of metabolizable energy requirements and mechanisms of
energy mobilization towards lipid egg formation in broiler breeder hens. (Doctoral
dissertation). University of Arkansas, Fayetteville. Available from ProQuest Dissertations
and Theses database. (UMI No. 3455956)
Donaldson, W. E. 1985. Lipogenesis and body fat in chicks: effect of calorie-protein ratio and
dietary fat. Poult. Sci. 64:1199-1204.
Ekmay, R. D. (2011). Protein utilization and requirements in broiler breeders. (Doctoral
dissertation). University of Arkansas, Fayetteville. Available from ProQuest Dissertations
and Theses database. (UMI No. 3487091)
Geraert, P. A., M. L. Grisoni, S. Guillaumin, C. Law, and M. Larbier. 1990. Amino acids as
energy sour5ces in genetically fat and lean chickens. In Lubec, G., and Rosenthal, G. A.
(Eds), Amino acids, chemistry, biology and medicine (pp. 1125-1131). Leiden, The
Netherlands, ESCOM Science Publishers B. V.
Kennard, D. C., and V. D. Chamberlin. 1939. Egg production and livability of pullets as affected by
management. Poult. Sci. 18(4):318-322.
Latour, M. A., E. D. Peebles, C. R. Boyle, S. M. Doyle, T. Pansky, and J. D. Brake. 1996. Effect of
breeder hen age and dietary fat on embryonic and neonatal broiler serum lipids and glucose.
Poult. Sci. 75:695-701.
Leclercq, B. 1984. Adipose tissue metabolism and its control in birds. Poult. Sci. 63:2044-2054.
Nobel, R. C., and M. Cocchi. 1990. Lipid metabolism and the neonatal chicken. Prog. Lipid Res.
29: 107-140.
O’Sullivan, N. P., E. A. Dunnington, and P. B. Siegel. 1991. Relationships among age of dam,
egg components, embryo lipid transfer, and hatchability of broiler breeder eggs. Poult.
Sci. 70:2180-2185.

67
Rosebrough, R. W., and N. C. Steele. 1982. The role of carbohydrate and protein level in the regulation of
lipogenesis by the turkey poult. Poult. Sci. 61:2212-2217.
Speake, B. K., R. C. Noble, and R. J. McCartney. 1993. Tissue-specific changes in lipid composition and
lipoprotein lipase activity during the development of the chick embryo. Biochem. Biophys. Acta.
1165:263-270.
Tanaka, K., S. Ohtani, and K. Shigeno. 1983. Effect of increasing dietary energy on hepatic lipogenesisi
in growing chicks. I. Increasing energy by carbohydrate supplementation. Poult. Sci. 62:445-451.
Tappy, L., N. Paquot, P. Tounian, P. Schneiter, and E. Jequier. 1995. Assessment of glucose metabolism
in humans with the simultaneous use of indirect calorimetry and tracer techniques. Clinical
Physiology. 15:1-12.

68
V. The sources of lipids partitioning to adipose tissue of chicks during first week posthatch
N. Boonsinchai, J. England, G. Mullenix, J. CaldasA. Magnuson, and C. N. Coon;
University of Arkansas, Fayetteville, AR,

69
ABSTRACT
The objective of this study was to determine the sources of lipid in the adipose tissue of chicks
during first week posthatch. Six broiler breeder hens (Cobb 500FF; 25wk of age) were used in
this trial. Hens were individually housed in the battery cage. Four hens were dosed with
50mg/hen/day of U-13C Linoleic acid (C18:2) ethyl ester dissolved in 1.0ml of corn oil for 14
days, and the other two hens were dosed with 1.0ml/hen/day of corn oil for 14 day and used as a
control. On Day 13 and 14, all hens were artificially inseminated, and two yolk samples from
treatment hens, and one from control hens were randomly collected on Day 1, 3, and 6 of the 6-
day egg collection. The rest of the eggs were set into the incubator. At hatch, three chicks from
each group were randomly selected for adipose tissue sampling. The rest of the chicks from each
group (6 control and 8 treatment birds) were wing-banded and placed in group in the floor pen
installed with nipple drinker and feed trough for 7 days. Chicks hatched from the hens dosed
with U-13C Linoleic acid were orally dosed with 50mg/bird/day of U-13C Glucose and
50mg/bird/day of 31D Linoleic methyl for 7 days. On Day 3 and 7 of growing, three control and 4
treatment chicks were kills by CO2 gas. Chicks were individually weighed, and the subcutaneous
fat as well as residual yolk were collected. The subcutaneous adipose tissue of each bird was
taken from under the wings and surrounding the breast, and the samples were save at -80 0C
freezer for further analysis. The U-13C Linoleic ethyl ester was intended to represent the source
of lipid receiving from the egg yolk, while the 31D Linoleic methyl ester was expected to show
the part of lipid coming from the feed. In addition, U-13C Glucose was proposed the lipid gaining
from de novo lipogenesis. The enrichment percentage and the concentration of U-13C LA
decreased significantly (P<.0001) from fresh yolk to Day 3, and were undetectable on Day 7
posthatch. The enrichment and concentration of U-13C LA which represented the lipid derived

70
from egg yolk were significantly reduced (P<.0001) from hatch to 7d of age. On the other hand,
the partitioning of 31D-LA and 13C-PA (represented lipids from feed and DNL, respectively)
were significantly increased (P<0.01) from hatch to 7d of growing. This result indicated that
chicks utilize lipids from each source in different manners.
Keywords: U-13C Linoleic acid, DNL, 31D-LA, residual yolk, baby chicks

71
INTRODUCTION
Avian and mammalian species are different in many aspects of carbohydrate and lipid
metabolism. They can resist to acute hypoglycemia (Houpt, 1958) as well as low-carbohydrate
and high-fat diet (Renner, 1964). The blood glucose level of avian is about two-time higher than
that of mammals (Leveille et al., 1975). Unlike mammals, avian embryo are relied on nutrient
deposited in the eggs for the whole period of incubation, which directly affects hatching quality
(Uni et al., 2012). It has been well known that embryo from young hens have smaller body size
and residual yolk, which directly affect final body weight (Nielsen, 1998; Tona et al., 2004;
Nangsuay et al., 2011). The data from Chapter II revealed that residual yolk of progeny from
young breeder hens was relatively low in lipid content. Baby chicks use residual yolk for energy
and tissue development in the first few days after hatch (Noble and Ogunyemi, 1989; Huang et
al., 2008). Right after hatch, residual yolk can be either used for maintenance or intestinal
growth. The reduction of body within 48 hours after hatch, before feed is available, is mainly due
to yolk utilization. The first few days after hatch is the transitional period that chicks must adapt
from yolk sac dependence to exogenous feed utilization. The presence of feed in the
gastrointestinal tract stimulates the absorption of yolk material into the small intestines (Noy and
Sklan, 2001). The partitioning of lipid from feed, body fat, and de novo synthesis (DNL) into egg
yolk has been studied in broiler breeder hens by Salas (2011). The author found that at the
beginning of lay, the lipids accumulated into egg yolk were from DNL, and as hen aged the main
sources of lipids in the yolk came from dietary and body fat reserve. However, there is no
evidence on how lipids are partitioning into adipose tissue of newly hatched chicks. A better
understanding on how chicks built up their body fat at the beginning of life will provide insight
into how important among the yolk-derived, feed, and DNL lipids to newly hatched chicks. In

72
order to gain knowledge on that mechanism, three forms of labeled isotopes were used in this
study: U-13C Linoleic acid, 31D - Linoleic acid, and U-13C glucose. The purpose of this study was
to determine the partitioning of lipids from three sources: yolk-derived, feed, and DNL, into
adipose tissue of baby chicks from one to seven days of age.
MATERIALS AND METHODS
Experimental procedure
The objective of this study was to determine the sources of lipid in the adipose tissue of baby
chicks during the first week posthatch. Six broiler breeder hens (Cobb 500FF; 25wk of age) were
used in this trial. Hens were individually housed in the battery cage (47 cm × 30.5 cm × 47 cm)
containing an individual feeding trough and nipple drinker. Hens received commercial breeder
feed containing 15.5% CP and 2,860kcal/kg ME as shown in Table 1 of Chapter II, and feed was
restricted based on target egg production according to the Cobb Breeder Management guide
(Cobb-Vantress, 2008). Four hens were dosed with 50mg/hen/d of U-13C Linoleic acid (C18:2)
ethyl ester (Cambridge Isotope Laboratories, Inc., Andover, MA) dissolved in 1.0ml of corn oil
for 14 days, and the other two hens were dosed with 1.0ml/hen/d of corn oil for 14 day and used
as a control. The isotope dissolved in corn oil as well as corn oil was pipetted on top of the feed
that the hens received each day. On Day 13 and 14, all hens were artificially inseminated with
2x10⁶ cells/50µl of pooled semen (Ekmay, 2011). All hatching eggs were collected for hatching
in the next 6 days. Two yolk samples from treatment hens, and one from control hens were
randomly collected on Day 1, 3, and 6 of collection. The rest of the eggs were set into the
incubator Jamesway PS500 (Jamesway, Indian Trial, NC) using the commercial practice:
73
incubator condition 99.6 0F 56% RH with egg turning once an hour, and hatcher condition 98 0F
53% RH.
At hatch, three chicks from each group were randomly selected for adipose tissue sampling.
Chicks were individually weighed and killed by CO2 gas. The subcutaneous adipose tissue of
each bird was taken from under the wings and surrounding the breast. The weights of adipose
tissue as well as residual yolk were recorded and the samples were save in -80 0C freezer for
further analysis. The rest of the chicks from each group (6 control and 8 treatment birds) were
wing-banded and placed in group in the floor pen (91cm length x 30cm width x 30cm high)
installed with nipple drinker and feed trough for 7 days. Chicks were fed ad libitum with
commercial starter feed containing 2,988kcal/kg ME and 21.0% CP as used for the trial in
Chapter IV, and were reared under commercial management practice (Cobb-Vantress, 2013).
Chicks hatched from the hens dosed with U-13C Linoleic acid were orally dosed with
50mg/bird/day of U-13C Glucose and 50mg/bird/day of 31D Linoleic methyl ester (Cambridge
Isotope Laboratories, Inc., Andover, MA) for 7 days. U-13C Glucose was dissolved in 0.5ml
distilled water, and 31D-Linoleic methyl ester was dissolved in 0.5ml corn oil. The control chicks
were also dosed with 0.5ml corn oil. On Day 3 and 7 of growing, three control and 4 treatment
chicks were kills by CO2 gas. Chicks were individually weighed, and the adipose tissue as well
as residual yolk were collected using the same basis as described previously. The U-13C Linoleic
ethyl ester was intended to represent the source of lipid receiving from the egg yolk, while the
31D Linoleic methyl ester was expected to show the part of lipid coming from the feed. In
addition, U-13C Glucose was proposed the lipid gaining from de novo lipogenesis.

74
FAME preparation and isotope enrichment determination
The preparation of the FAME, analysis of fatty acid concentration, and measurement of isotope
enrichment were the same as what have been described in Chapter III and IV. U-13C Glucose
was expected to be used for palmitic acid synthesis as the product of DNL. Therefore, the
abundance values of fragments m/z (mass per charge ratio) 270, 272, 274, and 276 were
monitored to represent the 12C-palmitic acid (M), 2·13C-palmitic acid (M + 2), 4·13C-palmitic
acid (M + 4), and 6·13C-palmitic acid (M + 6), respectively (Salas, 2011). For linoleic acids, the
abundance values of fragments m/z 294, 312, and 325 were monitored representing 12C-linoleic
acid (M), 18·13C-linoleic acid (M+18), and 2D31-linoleic acid (M + 31), respectively. The
abundance values of the natural occurring of those 13C and 2D fragments received from control
samples were subtracted from the treatment samples. The concentration of fatty acid in egg yolk
and adipose tissue was determined by the gas chromatography equipped with the FID as
previously described in Chapter II.
All procedures in this study were performed following the guide for the care and use of
laboratory animals of the National Institutes of health, and was approved by the University of
Arkansas Institutional Animal Care and Use Committee (protocol # 13002).
Statistical Analysis
The analysis of variance (ANOVA) was performed using SAS software (SAS 9.4) to compare
interested parameters among different sampling times. Differences among treatment means of
interested parameters were separated using Duncan multiple range test at P<0.05.

75
RESULTS
The enrichment and concentration of U-13C LA in fresh yolk, residual yolk at hatch and Day 3
posthatch were shown in Table 1. The enrichment percentage and the concentration of U-13C LA
decreased significantly (P<.0001) from fresh yolk to Day 3, and were undetectable on Day 7
posthatch. The partitioning among two forms of labeled linoleic acids and glucose into adipose
tissue of chicks from hatch tills 7d of age were shown in Table 2 and Figure 1. The enrichment
and concentration of U-13C LA which represented the lipid derived from egg yolk were
significantly reduced (P<.0001) from hatch to 7d of age. On the other hand, the partitioning of
31D-LA and 13C-PA representing lipids from feed and DNL, respectively were significantly
increased from hatch to 7d of growing. There were no partitioning of those fatty acids at hatch
because the labeled 31D-LA and U-13C glucose were administered after hatch. This result
indicated that baby chicks utilize lipids from each source in different manners.
DISCUSSION
In the first few days of life, chicks utilize nutrients from the left over residual yolk (Noble and
Ogunyemi, 1989). The data from Hang et al. (2008) illustrated that baby chicks utilized all
residual yolk around Day 6 of life. In the present study, the amount of residual yolk sac at Day 7
after hatch was relatively small which can be assumed as undetectable. The enrichment and
concentration of yolk-derived linoleic acid in residual yolk decreased extremely from hatch to
Day 3 and was undetected on Day 7 since the very tiny left over residual yolk sac (Table 1). This
observation showed the importance of residual yolk for early growth of baby chicks. As
expected, the adipose tissue of hatched chicks was detected the enrichment of yolk-derived

76
linoleic acid, suggesting that lipid mobilization mechanism exists during embryonic development
period. After chicks were fed, the mobilization of feed-derived linoleic acid as well as glucose-
derived palmitic acid into adipose tissue started, and the accumulation increased by age (Table 2
and Figure 1). On the contrary, accumulation of yolk-derived linoleic acid in to adipose tissue of
the baby chicks reduced by age. It is possible that chicks may use lipids in residual yolk for
maintenance or gastrointestinal growth at the first priority as reported by Noy and Sklan (2001).
Newly hatched chicks that did not receive feed for 48 hours after hatch decreased body weight
about 7.8%, while the weight of the small intestine still increased by 80% (Noy and Sklan,
1999). Also, the less available of residual yolk as the chicks aged with the bigger size of the
adipose tissue may result in the lower concentration of yolk-derived linoleic acid in adipose
tissue.
The increase of labeled palmitic acid in adipose tissue of baby chick from at Day 3 and 7 after
hatch is in consistent with the result in Chapter IV showing the exist of DNL in baby chicks from
both young and old breeder hens. Liver plays a key role for de novo lipogenesis in avian species
(Leveille et al., 1975; Borron and Britton, 1977). Noy and Sklan (1999) reported that the
absorption of carbohydrate and protein increased immediately after hatch, which can bring up
more substrate for DNL in the liver.
The experiment conducted by Noy and Sklan (1999) by feeding a bolus of labeled glucose,
methionine, or oleic acid to the newly hatched chicks found that, at hatch, the absorption of fatty
acids was upper 80% and higher than that of glucose and methionine. Then, the rates of
absorption for all substrates increased with age and were more than 80% by Day 4 of life. This
observation is in agreement with the result in the present study showing the increased
accumulation of feed-derived linoleic acid in adipose tissue of the chicks from hatch to 7d of life.

77
In summary, at hatch yolk-derived lipids are the main source of lipids in adipose tissue of the
baby chicks, while lipids from feed and DNL play a bigger role after hatch. After hatch, chicks
seem to use yolk-derived lipids for the growth of gastrointestinal tract and energy purpose rather
than body fat reserve.

78
Table 1: The enrichment and concentration of U-13C Linoleic acid in fresh and residual yolk at
hatch and Day 3 posthatch
Treatment
Parameter
Day of experiment
SEM P-value Fresh Yolk
Hatch
RY
Day3
RY
U-13C Linoleic acid (Yolk) %enrichment 2.53a 0.64b 0.25c 0.298 <.0001
mg·g-1 2.47a 0.29b 0.05c 0.325 <.0001
mg·egg-1 16.93a 0.51b 0.02b 2.348 <.0001
a,b,cMeans within the same row with different superscripts differ significantly
Table 2: The partitioning of differently labeled fatty acids in adipose tissue of baby chicks from
hatch tills 7d of age
Treatment Parameter
Day of experiment SEM P-value
Hatch Day 3 Day 7
U-13C Linoleic acid (Yolk) %enrichment 0.646a 0.347b 0.127c 0.064 <.0001
mg·g-1 0.898a 0.581b 0.238c 0.078 <.0001
31D - Linoleic acid (Feed) %enrichment NA 3.484b 4.371a 0.16 <.0001
mg·g-1 NA 5.845b 8.139a 0.392 <.0001
13C Palmitic acid (DNL) %enrichment NA 2.556b 3.739a 0.231 0.0026
mg·g-1 NA 4.959b 7.778a 0.524 <.0001 a,b,cMeans within the same row with different superscripts differ significantly 1values were subtracted from the control group

79
Figure 1: The enrichment and concentration of different isotope-derived fatty acids in adipose
tissues (data were taken from Table 2)
of baby chicks during first week posthatch
0
1
2
3
4
5
6
7
8
9
0
0.5
1
1.5
2
2.5
3
3.5
4
4.5
5
Hatch Day 3 Day 7
Conce
ntr
atio
n (
mg.g
-1)
% E
nri
chm
ent
Age of bird (day)
U13C-LA (%enrichment) 31D-LA(%enrichment)
13C-PA(%enrichment) U13C-LA (mg·g-1)
31D-LA(mg·g-1) 13C-PA(mg·g-1)

80
REFERENCES
Borron, D. C., and W. M. Britton. 1977. The significance of adipose tissue and livers as sites of
lipid biosynthesis in the turkey. Poult. Sci. 56:353-355.
Cobb-Vantress. 2008. Cobb 500 Breeder Management Guide. Blueprint for Success. Cobb-
Vantress, Siloam Spring, AR.
Cobb-Vantress. (2013, November 15). Broiler management guide. Retrieved from http://cobb-
vantress.com/docs/default-source/guides/cobb-broiler-management-guide---english.pdf
Salas, J. C. (2011). Determination of metabolizable energy requirements and mechanisms of
energy mobilization towards lipid egg formation in broiler breeder hens. (Doctoral
dissertation). University of Arkansas, Fayetteville. Available from ProQuest Dissertations
and Theses database. (UMI No. 3455956)
Ekmay, R. D. (2011). Protein utilization and requirements in broiler breeders. (Doctoral
dissertation). University of Arkansas, Fayetteville. Available from ProQuest Dissertations
and Theses database. (UMI No. 3487091)
Houpt, T. R. 1958. Effects of fasting on blood sugar levels in baby chicks of varying ages. Poult.
Sci. 37:1452-1459.
Huang, J. X., X. G. Luo, L. Lu., and B. Liu. 2008. Effects of age and strain on yolk sac
utilizat8on and leptin levels in newly hatched broilers. Poult. Sci. 87:2647-2652.
Leveille, G., D. R. Romsos, Y. Y. Yeh, and E. K. O’Hea. 1975. Lipid biosynthesis in the chick.
A consideration of site of synthesis, influence of diet and possible regulatory
mechanisms. Poult. Sci. 54:1075-1093.
Nangsuay, A., Y. Ruangpanit, R. Meijerhof, and S. Attamangkune. 2011. Yolk absorption and
embryo development of small and large eggs originating from young and older breeder
hens. Poult. Sci. 90:2648-2655.
Nielsen, H. 1998. Hen age and fatty acid composition of egg yolk lipid. Br. Poult. Sci. 39:53-56.
Noble, R. C., and D. Qgunyemi. 1989. Lipid changes in the residual yolk and liver of the chick
immediately after hatching. Biol. Noeonate. 56:228-236.
Noy, Y., and D. Sklan. 1999. Energy utilization in newly hatched chick. Poult. Sci. 78:1750-
1756.
Noy, Y., and D. Sklan. 2001. Yolk and exogenous feed utilization in the posthatch chick. Poult.
Sci. 80:1490-1495.
Renner, R. 1964. Factors affecting the utilization of “carbogydrate-free” diets by the chick. I.
Level of protein. J. Nutr. 84:322-326.

81
Tona, K., O. Onagbesan, B. De Ketelaere, E. Decuypere, and V. Bruggeman. 2004. Effects of
age of broiler beeder s and egg storage on egg quality, hatchaqbility, chick quality, chick
weight, and chick posthatch growth to forty-two days. J. Appl. Poult. Res. 13:10-18.
Uni, Z., L. Yadgary, and R. Yair. 2012. Nutritional limitations during poultry embryonic
development. J. Appl. Poult. Res. 21:175-184.

82
XI. Effect of palmitic acid supplementation on hatchability, reproductive performance,
yolk fatty acid profiles, and progeny growth
N. Boonsinchai, G. Mullenix, J. Caldas, A. Magnuson, J. England, and C. N. Coon;
University of Arkansas, Fayetteville, AR,

83
ABSTRACT
The objectives of the present study were to determine the effect of supplementation of 3.0% of
palmitic acid in the diet on hatchability, egg production, and progeny performance of broiler
breeder hens. A total of 90 Cobb-500 pullets (18wk of age) were raised in group on the floor
pens (35 pullets / pen). Pullets were divided into two groups, each of 45 birds. Two feed rations
were prepared containing the same energy and protein levels. Basal diet were formulated and
then corn starch and Palmit 80 (containing 80% free palmitic acid) were added to make the
control and treatment diets, respectively. The experimental period lasted from 18 to 45wk of age.
At 21wk of age, pullets were placed into individual cage and photo stimulation program was
applied. Egg production, hatchability traits, progeny performance, and egg yolk lipid profiles
were compared at different ages. The Student’s T-test were performed to compare means of
interested parameters, and Chi-square test was used for hatchability traits (SAS 4.0). Cumulative
egg production at 45wk of age was not significantly different between control (89.17 eggs/hen)
and palmitic acid supplemented groups (87.12 eggs/hen). The body weights of hens from 23 to
40wk of age were not significant difference between treatments. Palmitic acid supplemented feed
showed positive effects on fertility and percent hatch of fertile at 27 and 35wk of age, but there
was no difference at 40wk of age. The ten-day growth performances of progeny as well as egg
weights were tested at 27 and 35wk of ages. No significant difference was detected except for O-
day body weight at 35wk hens, which was significantly higher in progeny from palmitic acid
supplemented hens. The same scenario was also shown at 40wk of age by which progeny from
palmitate fed hens had heavier (P<0.05) body weight at hatch which contributed from higher
(P<0.05) residual yolk at hatch. Hens received palmitic acid (C16:0) supplemented feed did not
produce higher amount of palmitic acid in their eggs (fresh yolk), but did generate higher

84
(P<0.05) amount of MUFA, especially oleic acid (C18:1) which contributed to the higher
(P<0.05) total FA concentration per gram of dried yolk as well. However, the concentration of
each fatty acid in the residual yolk at hatch did not differ between treatments.
Keywords: palmitic acid, Palmit 80, egg production, hatchability, lipid profile

85
INTRODUCTION
While the genetic selection and improvement is trying to enhance egg production and progeny
growth rate at the same time, the hatchability and livability of embryo from young breeder hens
are still low. McNaughton et al. (1978) reported the higher mortality in progeny hatched from
29wk old than 58wk old hens. The field study revealed that the average hatchability of 25wk old
breeder hens was about 20% less than that of hens at peak production (Yassin et al., 2008). Age
of hens affects egg quality which in turn relates to hatchability (Yassin et al., 2008). It has been
reported that the ability to take up fat into the body tissues of embryo from young hens lower
than those embryo from old hens, which might lead to the higher late death in the last period of
(Noble et al., 1986; Yafei and Noble, 1990). The type of lipids in the diet can affect the lipid
profiles in the egg yolk (Vilchez et al., 1991; Oliveira et al., 2010). The previous study in
Chapter II showed that the huge amount of palmitic acid was utilized (about 64.0% of palmitic
acid content in the fresh yolk) by the embryo from young hens (28wk of age). Also,
supplementation of 3.0% palmitic acid in the diet has been reported to enhance egg production,
hatchability, and livability of progeny in Japanese quails (Vilchez et al., 1990). However, the
positive effect of palmitic acid supplementation needs to be calcified in broiler breeder hens. A
little improvement of hatchability and livability of progeny in the very young breeder hens can
worth a thousand of dollars for the industry. The objective of the present study were to determine
the effect of supplementation of 3.0% of palmitic acid in the diet on hatchability, egg production,
and progeny performance of broiler breeder hens.

86
MATERIALS AND METHODS
A total of 90 Cobb-500 pullets (18wk of age) were raised in group (35 pullets / pen) on the floor
pens (2.0x4.7x2.0 m3). Pullets were divided into two groups, each of 45 birds. Two breeder feed
rations were prepared containing the same energy (2,921kcal/kg ME) and protein (15.5%) levels
(Table 1). Basal diet were formulated and then corn starch and Palmit 80 (containing 80%
palmitic acid; Global Agri-Trade Corporation, CA) were added to make the control and
treatment diets, respectively. The experimental period lasted from 18 to 45wk of age. At 21wk of
age, pullets were placed into individual cage (47 x 30.5 x 47 cm3) equipped with feeder and
nipple drinker. The photo stimulation program was applied at that time. All management
practices were followed the Cobb Breeder Management Guide (Cobb-Vantress, 2008).
Maximum feed allocation was peak at 390kcal/hen/day at 70% peak production without
withdrawal. Egg production, hatchability traits, hen weight, egg weight, and progeny
performance were compared at 27, 35, and 40wk of age. Fatty acid profile of fresh yolk was also
compared between two groups of hens.
At 27 and 35wk of age, hens were artificially inseminated with 50µl (containing 2x10⁶ cells) of
pooled semen (Ekmay, 2011) two days in the row. Eggs were collected for hatch, and
hatchability and 10d-progeny growth performance were compared at 27, 35, and 40wk of age.
The commercial starter feed containing 2,988kcal/kg ME and 21.0% CP was used to grow the
progeny (Table 2). All management practices were followed the Cobb broiler management guide
(Cobb-Vantress, 2013) The fatty acid profiles of the yolk was determined using the same
procedure as previously described in Chapter III.

87
All procedures in this study were performed as recommended by the guide for the care and use
of laboratory animals of the National Institutes of health, and was approved by the University of
Arkansas Institutional Animal Care and Use Committee (protocol # 13002).
Statistical Analysis
The Student’s T-test were performed to compare means of interested parameters, and Chi-square
test was used for hatchability traits (SAS 4.0).
RESULTS
The accumulate egg production per hen at 45wk of age was not significantly different between
treatments, which was slightly higher in control group (89.17 vs. 87.12 eggs/hen; SEM 1.364,
data not shown). The body weights of hens from 23 to 40wk of age was shown in Table 3 with
no difference between treatments. Palmitic acid supplemented feed showed positive effects on
fertility and percent hatch of fertile at 27 and 35wk of age, but there was no difference at 40wk
of age (Table 4).
The 10d growth performances of progeny as well as egg weights were tested at 27 and 35wk of
ages (Table 5). No significant difference was detected except for O-day body weight at 35wk
hens, which was significantly higher in progeny from palmitic acid supplemented hens. The
same scenario was also shown at 40wk of age by which progeny from palmitate fed hens had
heavier (P<0.05) body weight at hatch which contributed from higher (P<0.05) residual yolk at
hatch (Table 6).

88
The fatty acid profiles in fresh yolk and residual yolk at hatch were also compared between the
treatments at 40wk of age (Table 7). Hens received palmitic acid (C16:0) supplemented feed did
not produce higher amount of palmitic acid in their eggs (fresh yolk), but did generate higher
(P<0.05) amount of MUFA, especially oleic acid (C18:1) which contributed to the higher
(P<0.05) total FA concentration per gram of dry yolk as well. However, the concentration of
each fatty acid in the residual yolk at hatch did not differ between treatments.
DISCUSSION
Hen body weight did not differ throughout the experimental period (Table 3), which indicated
that hens in both groups received the same amount of nutrients. Also, egg production was not
significantly different between groups, suggesting that hens in both groups receive the same
nutritional level even though the feed ingredients were different. Supplementation of 3.0%
palmitic acid in the diet seemed to improve the hatchability in young hens, but not old hens
(Table 4). The experiment conducted by Vilchez et al. (1990) also found that the
supplementation of 3.0% palmitic acid in the diet of Japanese quail breeders improved
hatchability. The study in rats indicated that saturated fatty acids promote liver lipoprotein
synthesis and lipid storage (Beynen and Katan, 1985). As follow the hen body and egg weight,
the 10d body weight of the progeny from both groups of hens did not significantly different.
Also, all other growth parameters did not differ between groups (Table 5). At 40wk of age, hens
fed palmitic acid supplemental diet seemed to have slightly bigger egg size, which might
contribute to the significantly higher chick weight, and the yolk free body weight at hatch (Table
6). However, the O-day body weight of the progeny from palmitate supplemented hens was also

89
significantly higher although their original egg weight was slightly lower than hens fed control
diet. It may be other factors affecting this phenomenon.
Interestingly, the fatty acid profiles (Table 7) in fresh yolk at 40wk of age were significantly
different between groups. The hens received palmitic acid showed the higher concentration of
monounsaturated fatty acids (MUFA), especially oleic acid (C18:1). This observation is in
agreement to Vilchez et al. (1990) who found that the Japanese quail breeders received palmitic
acid supplementation exhibited higher level of palmitoleic and oleic acids in their plasma and
egg yolk. It is possible that hens use palmitic acid as a precursor for desaturation and elongation
to form oleic acid (Botham, 2012). The total fatty acid content in the fresh yolk of palmitate
supplemented hens was significantly higher than that of control hens, while the total fatty acid
concentration in the residual yolk at hatch was the same. This observation suggested that the total
fatty acid absorption into embryo tissue during incubation period is greater in palmitic acid
supplemented hens, which may contribute to the higher yolk free body weight at hatch. In
summary, palmitic acid supplementation improve hatchability in young hens without affecting
egg production and progeny growth performance.
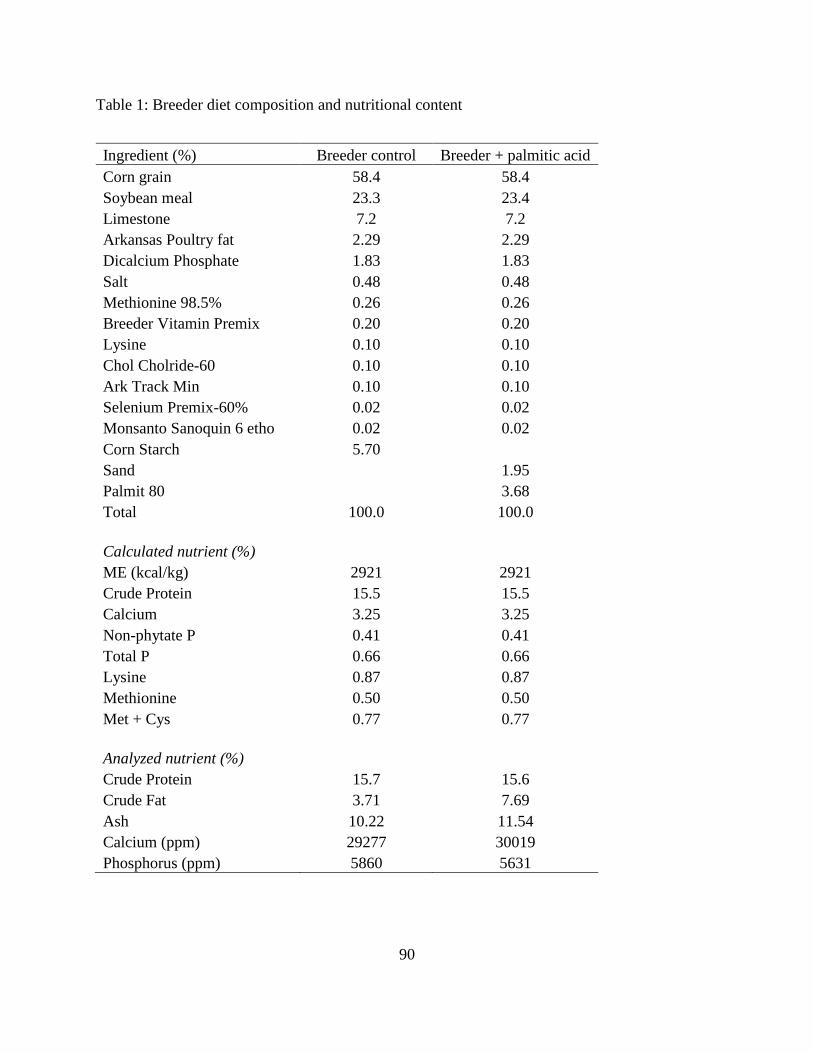
90
Table 1: Breeder diet composition and nutritional content
Ingredient (%) Breeder control Breeder + palmitic acid
Corn grain 58.4 58.4
Soybean meal 23.3 23.4
Limestone 7.2 7.2
Arkansas Poultry fat 2.29 2.29
Dicalcium Phosphate 1.83 1.83
Salt 0.48 0.48
Methionine 98.5% 0.26 0.26
Breeder Vitamin Premix 0.20 0.20
Lysine 0.10 0.10
Chol Cholride-60 0.10 0.10
Ark Track Min 0.10 0.10
Selenium Premix-60% 0.02 0.02
Monsanto Sanoquin 6 etho 0.02 0.02
Corn Starch 5.70
Sand 1.95
Palmit 80 3.68
Total 100.0 100.0
Calculated nutrient (%)
ME (kcal/kg) 2921 2921
Crude Protein 15.5 15.5
Calcium 3.25 3.25
Non-phytate P 0.41 0.41
Total P 0.66 0.66
Lysine 0.87 0.87
Methionine 0.50 0.50
Met + Cys 0.77 0.77
Analyzed nutrient (%)
Crude Protein 15.7 15.6
Crude Fat 3.71 7.69
Ash 10.22 11.54
Calcium (ppm) 29277 30019
Phosphorus (ppm) 5860 5631

91
Table 2: Broiler starter diet composition and nutritional content
Ingredient (%) Broiler starter
Corn grain 52.27
Soybean meal 38.79
Ark Poultry Fat 4.12
Dicalcium Phosphate 2.25
Limestone 0.86
Salt 0.38
Methionine 0.35
Lysine 0.28
Chol Cholride-60 0.20
Ark vitamin premix 0.20
Threonine 0.15
Ark Trace Mineral 0.10
Kemin Mold Curb 0.05
Selenium 0.02
Monsanto Sanoquin 6 etho 0.02
Total 100.0
Calculated nutrient (%)
ME (kcal/kg) 2988
Crude Protein 21.0
Calcium 1.0
Non-phytate P 0.5
Total P 0.73
Lysine 1.19
Methionine 0.52
Met + Cys 0.89
Analyzed nutrient (%)
Crude Protein 21.5
Crude Fat 5.60
Ash 5.83
Calcium (ppm) 10172
Phosphorus (ppm) 7152

92
Table 3: Hen body weight at different ages
Treatment / Age Hen body weight (g)
23wk 25wk 28wk 30wk 35wk 40wk
Control feed 2561.89 2931.36 3357.5 3509.32 3746.82 3881.74
Palmitic acid feed 2594.11 2985.44 3404.33 3531.44 3765.67 3908.41
SEM 40.69 35.92 38.105 40.813 28.98 46.71
P-value 0.5769 0.2927 0.3899 0.704 0.7471 0.6858
Table 4: Hatchability at different ages of hens
Treatment
27wk 35wk 40wk
%fertile % hatch of
fertile %fertile
% hatch of
fertile %fertile
% hatch of
fertile
Control feed 75.2b 70 77.5b 77 96.51 94.36
Palmitate feed 80.2a 73.3 89.2a 87.2 95.97 93.61
SEM 2.512 NA 3.624 NA 0.6114 1.211
P-value 0.0492 NA 0.0174 NA 0.6919 0.7921
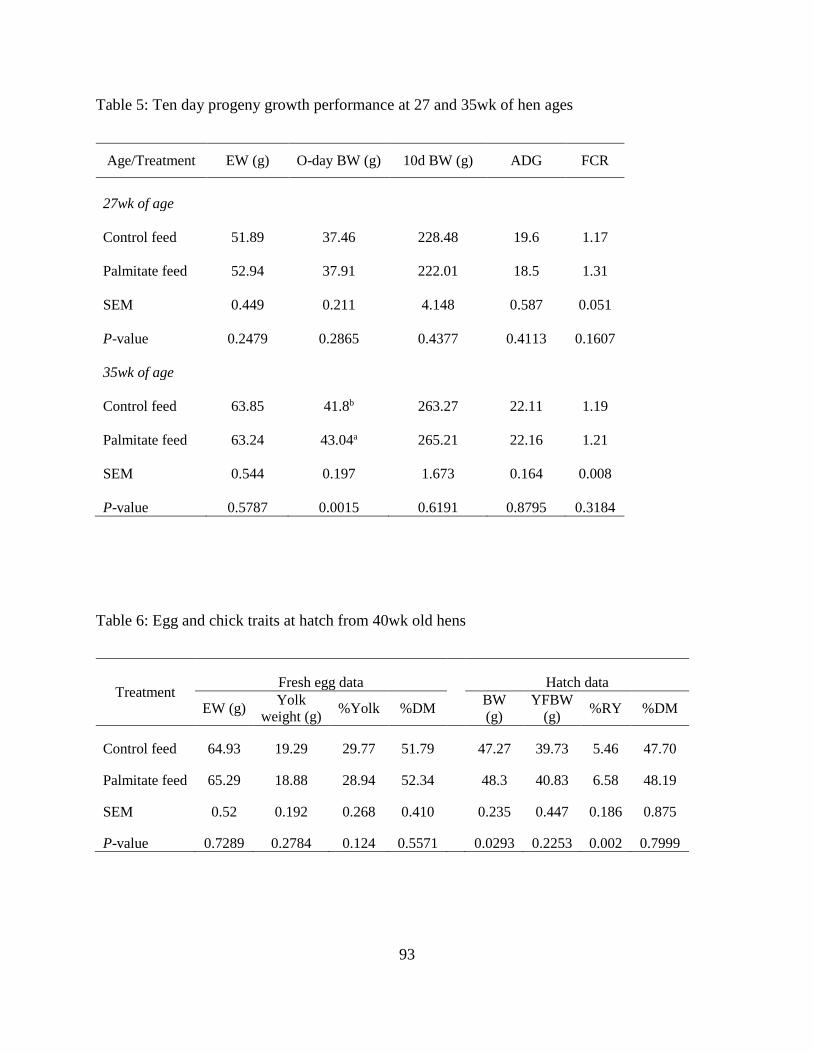
93
Table 5: Ten day progeny growth performance at 27 and 35wk of hen ages
Age/Treatment EW (g) O-day BW (g) 10d BW (g) ADG FCR
27wk of age
Control feed 51.89 37.46 228.48 19.6 1.17
Palmitate feed 52.94 37.91 222.01 18.5 1.31
SEM 0.449 0.211 4.148 0.587 0.051
P-value 0.2479 0.2865 0.4377 0.4113 0.1607
35wk of age
Control feed 63.85 41.8b 263.27 22.11 1.19
Palmitate feed 63.24 43.04a 265.21 22.16 1.21
SEM 0.544 0.197 1.673 0.164 0.008
P-value 0.5787 0.0015 0.6191 0.8795 0.3184
Table 6: Egg and chick traits at hatch from 40wk old hens
Treatment Fresh egg data Hatch data
EW (g) Yolk
weight (g) %Yolk %DM
BW
(g)
YFBW
(g) %RY %DM
Control feed 64.93 19.29 29.77 51.79 47.27 39.73 5.46 47.70
Palmitate feed 65.29 18.88 28.94 52.34 48.3 40.83 6.58 48.19
SEM 0.52 0.192 0.268 0.410 0.235 0.447 0.186 0.875
P-value 0.7289 0.2784 0.124 0.5571 0.0293 0.2253 0.002 0.7999

94
Table 7: Fatty acid profiles of fresh yolk and residual yolk at hatch at 40wk of age
Treatment Concentration of fatty acid (mg/g of dry yolk)
C14:0 C16:0 C16:1 C18:0 C18:1 C18:2 C18:3 C20:1 C20:3 C24:1 Total
FA SFA MUFA PUFA
Fresh yolk
Control feed 2.26 141.54 21.01 44.68 229.85 68.09 1.13 1.06 11.35 5.23 533.51 190.74 258 84.82
Palmitate
feed 2.27 141.22 20.65 46.38 242.06 67.53 1.21 1.05 10.92 5.97 544.47 192.5 268.6 83.23
SEM 0.056 1.028 0.287 0.964 3.468 1.266 0.035 0.033 0.183 0.203 1.976 1.375 2.241 1.316
P-value 0.9649 0.8848 0.5734 0.4079 0.0348 0.6003 0.683 0.9889 0.262 0.0586 0.0231 0.5536 0.043 0.3693
RY at hatch
Control feed 1.57 91.74 13.03 29.02 160.51 39.46 0.63 0.69 5.78 1.52 342.77 119.88 175.6 46.85
Palmitate
feed 1.73 91.05 13.17 28.83 162.48 40.71 0.65 0.68 5.57 1.46 344.98 120.9 176.3 47.74
SEM 0.102 2.391 0.548 0.472 2.645 1.450 0.030 0.074 0.153 0.075 4.857 4.993 7.246 1.941
P-value 0.4631 0.8953 0.9108 0.8523 0.204 0.6916 0.773 0.9955 0.5153 0.7306 0.8352 0.9272 0.962 0.8362
RY = residual yolk; FA = fatty acid; SFA = saturated fatty acid; MUFA = monounsaturated fatty acids; PUFA = polyunsaturated fatty acid

95
REFERENCES
Beynen, A. C., and M. B. Katan. 1985. Why do polyunsaturated fatty acids lower serum
cholesterol? Am. J. Clin. Nutr. 42:560-563.
Botham, K. M. 2012. Chapter 23: Biosynthesis of fatty acid and eicosanoids. In R. K. Murray, D.
A. Bender, K. M. Botham, P. T. Kennelly, V. W. Rodwell, and P. A. Weil (Eds.),
Harper’s illustrated biochemistry (pp.216-228).New Yolk, McGraw Hill.
Cobb-Vantress. 2008. Cobb 500 Breeder Management Guide. Blueprint for Success. Cobb-
Vantress, Siloam Spring, AR.
Cobb-Vantress. (2013, November 15). Broiler management guide. Retrieved from http://cobb-
vantress.com/docs/default-source/guides/cobb-broiler-management-guide---english.pdf
Ekmay, R. D. (2011). Protein utilization and requirements in broiler breeders. (Doctoral
dissertation). University of Arkansas, Fayetteville. Available from ProQuest Dissertations
and Theses database. (UMI No. 3487091)
McNaughton, J. L., J. W. Deaton, and R. N. Reece, 1978. Effect of age of parents and hatching
egg weight on broiler chick mortality. Poult. Sci. 57:38-44.
Noble, R. C., F. Lonsdale, K. Connor, and D. Brown. 1986. Changes in the lipid metabolism of
the chick embryo with parental age. Poult. Sci. 65:409-416.
Oliveira, D. D., N. C. Baiao, S. V. Cancado, R. Grimaldi, M. R. Souza, L. J. C. Lara., and A. M.
Q. Lana. 2010. Effects of lipid sources in the diets of laying hens on the fatty acid
profiles of egg yolks. Poult. Sci. 89.2484-2490.
Vilchez, C., S. P. Touchburn, E. R. Chavez, and C. W. Chan. 1990. Dietary palmitic and linoleic
acids and reproduction of Japanese quail (Coturnix coturnix japonica). Poult. Sci.
69:1922-1930.
Vilchez, C., S. P. Touchburn, E. R. Chavez, and C. W. Chan. 1991. Effect of feeding palmitic,
oleic, and linoleic acids to Japanese quail hens (Coturnix coturnix japonica). 1.
Reproductive performance and tissue fatty acids. Poult. Sci. 70:2484-2493.
Yafei, N., and R. C. Noble. 1990. Further observations on the association between lipid
metabolism and low embryo hatchability in eggs from young broiler birds. J. Exp. Zool.
253:325-329.
Yassin, H., A. G. J. Velthuis, M. Boerjan, J. Van Riel, and R. B. M. Huirne. 2008. Field study on
broiler eggs hatchability. Poult. Sci. 87:2408-2417.

96
XII. Effect of various feeding programs during laying period for broiler breeder hens on
reproductive performance
N. Boonsinchai1, J. Caldas
1, P. Sodsee
2, K. Vignale
1, M. Putsakum
3, A. Magnuson
1, J. England1,
and C. N. Coon1;
1University of Arkansas, Fayetteville, AR,
2Charoen Pokphand Foods, Bangkok, Thailand,
3Sukhothai Thammathirat Open University, Nonthaburi, Thailand

97
ABSTRACT
The objective of the present study was to determine the effect of different feeding programs
during laying period (21-65wk of age) on reproductive performance of broiler breeder hens. A
total of 324 breeder females (Cobb 500) were randomly assigned into 6 treatments (54 birds
each) and placed in the individual battery cages (47x47x30.5cm3). Feeding program 1, 2, 4, 5,
and 6 provided 390kcal ME/kg/hen/day at 60% egg production while program 3 provided peak
feed (390kcal ME/hen/day) was applied at 75% egg production. Feed was not withdrawn after
peak production except for program 2. Feed was withdrawn for program 2 breeders after peak
feed based on commercial practice (total of 8.21% of peak feed). Moreover, feeding amounts
were increased to 415kcal ME/hen/day at 75% egg production for program 4 and at 32, 35, and
40wk of age for programs 3, 5, and 6, respectively. The accumulated eggs per hen housed
(eggs/HH) of hens that received feeding program 2 was significantly lower (P<0.05) than hens in
other feeding programs (148 vs. average 160.6 eggs/hen), while hens in feeding programs 3 and
5 showed the best egg numbers per hen (169 and 171 eggs/HH, respectively). The hatch of fertile
at 30, 35, 45, 55, and 65wk of age varied between 85 to 88%, and were not significantly
different. Starting from 35wk of age to the end of the experiment, hens in program 2 had
significant lower BW than hens in other programs (P<0.05). In addition, from 45 to 65wk of age,
EW and chick BW at hatch produced by hens in feeding program 2 were significantly lower than
EW and chick BW from breeders on other programs (P<0.01). Also, YFBW at hatch, BW and
ADG at 7d after hatch of chicks from hens in feeding program 2 were significantly lower
(P<0.05), as compared to other feeding programs. In conclusion, feed withdrawal after peak
production can be detrimental to egg production and persistency of lay as well as progeny
performance.

98
INTRODUCTION
As hens age, egg production, fertility, and hatchability decrease (Fasenko et al., 1992). Current
broiler breeder hens have been shown to accumulate lean mass from 45-65 wk while body fat
content is reduced. Lipids in egg yolk are primarily produced from de novo synthesis at the
beginning of lay whereas feed and fat mobilization have been shown to play a bigger role in
providing yolk lipids in older hens (Salas, 2011). This is in agreement with breeder skeletal
protein synthesis and degradation observed in both pure-line and PS breeders (Vignale, 2014).
The rate of protein synthesis was high from 22 to 24wk of age, and dropped from 24 to 44wk of
age before increasing again after 44wk of age. Protein degradation in skeletal muscle in breeders
increases from first egg through peak to 37wk and then declines as egg production drops.
Breeders are using protein from lean mass for egg production during beginning of lay through
peak production and then may be using fat calories for egg production and lean mass gain during
the later stages of production. Hess and Lien (2009) reported that slow feed withdrawal during
41-50wk of age yielded more eggs. Feed withdrawal after peak production may not provide
enough energy to the hens for lean mass gain and egg production. NRC (1994) recommends 400-
450kcal ME/h/d for laying breeder hens raised on floor. However, caged hens need 20% less
MEm than hens grown on floor (Sakomura, 2004). Salas (2011) has previously shown that
standard BW caged-breeder hens fed energy levels ranging from 330 to 480kcal ME at peak
produced the highest number of hatching eggs when fed 390kcal ME. Most breeder flocks
achieve peak egg production, but cannot maintain persistency of lay (Mabbett, 2012). Feed
allocation during laying period need to be addressed in order to achieve best reproductive
performance. The objectives of the present study were to investigate the effect of different

99
feeding programs during laying period (21-65wk of age) on reproductive performance and
economic trait of broiler breeder hens as well as progeny growth performance
MATERIALS AND METHODS
A total of 324 Cobb-500 pullets were raised on floor-pen (2.0x4.7x2.0 m3) based on standard
management guideline (Cobb-Vantress, 2008). At 21wk of age, each pullet was randomly placed
into individual battery cage (47x30.5x47 cm3). The completely randomized block design
(CRBD) was applied. Six different feeding programs were randomly applied to each block. Each
feeding program had 6 blocks, each of 9 hens. All feeding programs use the same breeder feed
containing 15.5% CP and 2,860kcal/kg ME as shown in Table 1. Feeding program 1, 2, 4, 5, and
6 provided 390kcal ME/hen/day at 60% egg production while program 3 provided peak feed
(390kcal ME/hen/day) was applied at 75% egg production (Table 2 and Figure 1). All feeding
programs did not withdraw feed after peak production except program 2 which feed was
withdrawn after peak based on commercial practice (total of 8.21% of peak feed) as shown in
Table 3 and Figure 1. Moreover, feeding amounts were increased to 415kcal ME/hen/day at 75%
egg production (program 4) and at 32, 35, and 40wk of age for programs 3, 5, and 6, respectively
(Fig 1). Egg production, hen BW, EW, hatch of fertile, cost per dozen eggs, chick BW at hatch
were determined. At 60wk of age, all hens were artificially inseminated with 50µl (containing
2x10⁶ cells) of pooled semen (Ekmay, 2011). Eggs were saved for hatching using the same
protocol and equipment as previously described in Chapter II. The 7d growth performance of the
progeny from each feeding programs were compared. The commercial starter feed containing

100
2,988kcal/kg ME and 21.0% CP was used as shown in Table 2 of Chapter XI. All management
practices were followed the Cobb broiler management guide (Cobb-Vantress, 2013).
All procedures in this study were performed as suggested by the guide for the care and use of
laboratory animals of the National Institutes of health, and was approved by the University of
Arkansas Institutional Animal Care and Use Committee (protocol # 13002).
Statistical Analysis
Analysis of variance (ANOVA) was performed using SAS software (SAS 9.3). Differences
among treatment means of interested parameters were separated using Tukey’s HSD at P<0.05.
Chi-square test was performed to compare hatchability among treatments (P<0.05).
RESULTS
As shown in Figure 2 and Table 4, the accumulated eggs per hen housed (eggs/HH) of hens
received feeding program 2 was significantly lower (P<0.05) than those hens in other feeding
programs (148 vs. average 160.6 eggs/hen), while hens in feeding programs 3 and 5 showed the
best egg numbers per hen (169 and 171 eggs/HH, respectively). The hen day egg production
(eggs/HD) showed the same trend as the eggs per hen housed. In term of cost per dozen eggs,
hens in treatment 2 still showed the highest cost followed by hens in treatments 4 and 6. The
cheapest cost per dozen eggs still showed in treatment 3 and 5. Livability did not differ among
treatments. The hatch of fertile did not affect by the feeding program from 30wk to the end of the
experiment (Table 5).

101
Egg weight directly reflected chick BW at hatch (Table 6). Eggs produced by hens in feeding
program 2 were significantly lower (P<0.05) than those eggs in other feeding programs (Fig 3).
The growth performance of the progeny from the 60wk old hens in each feeding program were
shown in Table 7. Yolk free body weight (YFBW) at hatch, BW and ADG at 7d after hatch of
chicks from hens in feeding program 2 were significantly lower (P<0.05), as compared to other
feeding programs.
DISCUSSION
Broiler breeders nowadays differ from the past decade. They have bigger body size and gain lean
mass all the way through the end of flock. The bigger body size will contribute to the higher
need of energy for maintenance. Salas (2011) suggested that the metabolized energy at 390kcal
per hen per day yield the best egg production. However, in the broiler breeder industry feed is
usually withdrawn after peak egg production, which might lead to inadequate energy for egg
production. In this experiment, treatment 2 showed the lowest reproductive performance
including egg production, egg weight, chick weight and growth, and cost per dozen eggs. The
feeding pattern in this treatment was adopted from the commercial practice by withdrawing feed
after peak egg production. Compared to treatment 1 which the feeding pattern is closest to
treatment 2 except no feed withdraw after peak production, treatment 2 still showed the lower
reproductive performance than treatment 1. This suggested that feed withdrawal after peak
impairs persistency of lay. In addition, additional energy is needed after peak egg production to
sustain persistency of lay and provide energy for maintenance and lean mass growth.

102
The study by Salas (2011) indicated that breeder hens use body fat reserve and lipids from feed
as the main sources of lipids putting in the egg yolk. The results from Chapter IV also implicated
that older hens need more feed to produce lipids into their eggs since the DNL slowed down by
age. In agreement to those observations, hens in treatment 5 which were added daily energy
consumption from 390 to 415kcal/hen/day showed the best reproductive performance. However,
feed must be added at the right time. The increase of feed too early (treatment 4) or too late
(treatment 6) did not show the positive effect.
Since the commercial practice usually encounters with high mortality rate, double hierarchies,
and multiple ovulation from the beginning of lay to peak production when feed allocation rate is
too fast in this period (Leksrisompong et al., 2014), the feeding program 3 was conducted to
solve the problem. In feeding program 3, feed increase rate was slowed down to provide peak
feed at 75% egg production instead of 60% egg production as other treatments. Then feed
allowance was increased again at peak egg production and held for the whole laying cycle. The
result showed the positive effects of the slow feed increment program.
The growth performance of progeny from the hens in each feeding program seemed to reflect the
hen body weights and original egg weights. Chicks from feeding program 2 show the numerical
less efficient than other feeding programs. It has been well known that chicks hatched form
smaller eggs will have less performance than those chicks hatched form bigger eggs (Kosin et
al., 1952; Wyatt et al., 1985; Lourens et al., 2006). In conclusion, feed withdrawal after peak
production can be detrimental to egg production and persistency of lay as well as progeny
performance. Increasing feed at the right time such as at 32 or 35wk of age (instead of
withdrawing feed) significantly increased egg numbers.
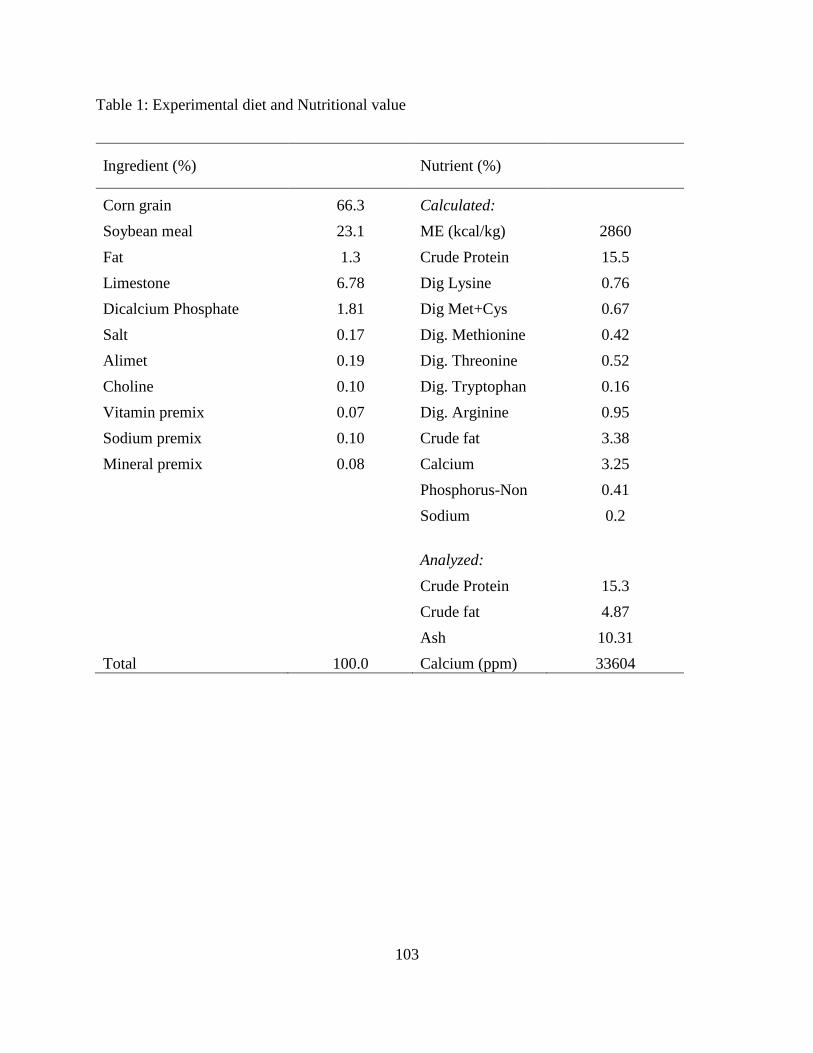
103
Table 1: Experimental diet and Nutritional value
Ingredient (%) Nutrient (%)
Corn grain 66.3 Calculated:
Soybean meal 23.1 ME (kcal/kg) 2860
Fat 1.3 Crude Protein 15.5
Limestone 6.78 Dig Lysine 0.76
Dicalcium Phosphate 1.81 Dig Met+Cys 0.67
Salt 0.17 Dig. Methionine 0.42
Alimet 0.19 Dig. Threonine 0.52
Choline 0.10 Dig. Tryptophan 0.16
Vitamin premix 0.07 Dig. Arginine 0.95
Sodium premix 0.10 Crude fat 3.38
Mineral premix 0.08 Calcium 3.25
Phosphorus-Non 0.41
Sodium 0.2
Analyzed:
Crude Protein 15.3
Crude fat 4.87
Ash 10.31
Total 100.0 Calcium (ppm) 33604

104
Table 2: Feed allocation patterns from 5% to peak production of each treatment
Treatment 1,2,4,5,6 Treatment 3
Stage %Production %Increase kcal/h/d Stage %Production %Increase kcal/h/d
before 5% 329 before 5% 329
1 5% 5% 333 1 5% 2.50% 331
2 13% 5% 335 2 13% 5.00% 334
3 21% 10% 342 3 21% 5.00% 337
4 29% 10% 348 4 29% 7.00% 341
5 37% 15% 356 5 37% 7.00% 345
6 45% 15% 366 6 45% 8.50% 351
7 53% 20% 378 7 53% 10.00% 357
8 61% 20% 390 8 61% 15.00% 365
9 69% 20.00% 377
10 75% 20.00% 390
Total 100% Total 100.00%
Table 3: Reduction pattern of feed allocation for treatment 2
Week after
peak Wk of age kcal/h/d % Reduction lb/100b/d
390
1 33 383 1.83% 0.5
2 34 376 1.73% 0.5
3 35 374 0.70% 0.2
4 36 371 0.71% 0.2
5 37 368 0.71% 0.2
6 38 366 0.72% 0.2
7 39 363 0.72% 0.2
8 41 360 0.73% 0.2
9 42 358 0.73% 0.2
End 65 358 8.21% (total)

105
Table 4: Reproductive performance of each feeding program
Treatment Eggs/HH Eggs/HD Cost/dozen eggs
($) Livability (%)
1: normal 157ab 177ab 1.22 77%
2: normal/withdraw 148b 166b 1.29 83%
3: slow + 32wk 169a 182a 1.21 80%
4: normal +75% 158ab 175ab 1.27 79%
5: normal + 35wk 171a 181a 1.22 81%
6: normal + 40wk 161ab 175ab 1.25 81%
SEM 2.479 1.746 0.018 2.041
P-value 0.0398 0.0169 0.7113 0.7424
Table 5: Percent hatch of fertile (HOF) of each feeding program at different ages of hens
Treatment Week of age (%)
30 35 45 55 65 Average
1 - normal 91 92 89 87 82 88
2 - normal/withdraw 86 90 86 87 85 87
3 - slow + 32 wks 93 88 81 82 85 86
4 - normal + 75% 89 87 79 81 87 85
5 - normal + 35 wks 88 92 89 84 75 86
6 - normal + 40 wks 91 91 85 88 79 87
P-value 0.225 0.464 0.801 0.729 0.468

106
Table 6: Egg and chick weights of hens from each feeding programs at different ages
Age (wk) 30 35 45 55 65
Feeding program EW
Chick
BW EW
Chick
BW EW
Chick
BW EW
Chick
BW EW
Chick
BW
1: normal 57.5 41.2 62.18 44.0 67.37 47.9 70.28 51.0 72.08 51.7
2:
normal/withdraw 57.8 41.6 61.59 43.5 65.36 47.0 68.45 49.1 70.71 50.2
3: slow + 32wk 58.43 41.2 62.19 44.3 67.75 48.2 70.7 51.2 72.81 52.3
4: normal +75% 58.15 41.4 62.38 43.6 66.84 48.4 70.68 51.4 73.12 52.2
5: normal + 35wk 58.31 41.2 62.62 43.9 67.85 47.7 71.76 51.4 73.54 52.9
6: normal + 40wk 58.47 41.3 62.15 44.0 68.08 49.1 71.82 51.0 74.25 53.3
SEM 0.206 0.086 0.207 0.082 0.257 0.084 0.318 0.085 0.375 0.362
P-value 0.713 0.818 0.596 0.169 0.005 0.003 <.0001 <.0001 0.007 0.003
Table 7: Growth performance of progeny from hens in each feeding program
Treatment
YFBW* at hatch
(g)
BW 7d
(g)
ADG 7d
(g) FCR 7d
1:normal 45.22a 189.80a 18.65a 1.14
2:normal/withdraw 41.76b 169.20b 15.96b 1.19
3:slow+32wk 44.59a 188.20a 18.73a 1.00
4:normal+75% 45.26a 187.20a 18.70a 1.14
5:normal+35wk 44.79a 187.80a 19.06a 1.00
6:normal+40wk 44.68a 186.60a 18.74a 1.11
SEM 0.269 2.145 0.312 0.025
P-value 0.001 0.037 0.026 0.211

107
Figure 1: Feeding programs from 20 to 42wk of age

108
Figure 2: Egg production of each feeding programs as compared to Cobb’s standard
Figure 3: Hen body weights at different ages as compared to Cobb’s standard
1500
2000
2500
3000
3500
4000
4500
5000
21 25 30 35 40 45 50 55 60 65
1:normal2:normal/withdraw3:slow+32wk4:normal+75%5:normal+35wk6:normal+40wkstd
Hen
bod
y
wei
ght
(g)
Age (week)

109
REFERENCES
Cobb-Vantress. 2008. Cobb 500 Breeder Management Guide. Blueprint for Success. Cobb-
Vantress, Siloam Spring, AR.
Cobb-Vantress. (2013, November 15). Broiler management guide. Retrieved from http://cobb-
vantress.com/docs/default-source/guides/cobb-broiler-management-guide---english.pdf
Salas, J. C. (2011). Determination of metabolizable energy requirements and mechanisms of
energy mobilization towards lipid egg formation in broiler breeder hens. (Doctoral
dissertation). University of Arkansas, Fayetteville. Available from ProQuest Dissertations
and Theses database. (UMI No. 3455956)
Fasenko, G. M., R. T. Hardin, and F. E. Robinson. 1992. Relationship of hen age and egg
sequence position with fertility, hatchability, viability, and preincubation embryonic
development in broiler breeders. Poult. Sci. 71:1374-1383.
Kosin, I. L., H. Abplanalp, J. Gutierrez, and J. S. Carver. 1952. The influence of egg size on
subsequent early growth of chick. Poult. Sci. 31 (2):247-254.
Hess, J. B., and Lien, R. J. 2009. Influence of post-peak feed withdrawal rate on egg production
by broiler breeders of different weights. Int. J. Poult. Sci. 8(6):529-535.
Leksrisompong, N., H. Romero-Sanchez, E. O. Oviedo-Rondon, and J. Brake. 2014. Effects of
feeder space allocations during rearing, female strain, and feed increase from
photostimulation to peak egg production on broiler breeder female performance. Poult.
Sci. 93:1045-1052.
Lourens, A., R. Molenaar, H. van den Brand, M. J. W. Heetkamp, R. Meijerhof, and B. Kemp.
2006. Effect of egg size on heat production and the transition of energy from egg to
hatchling. Poult. Sci. 85(4):770-776.
Mabbett, D. T. (2012, March 07). Maintaining egg production persistency for broiler breeders.
Retrieved from http://www.fareasternagriculture.com/live-stock/poultry/maintaining-egg-
production-persistency-for-broiler-breeders
Sakomura, N. K. 2004. Modeling energy utilization in broiler breeders, laying hens and broilers.
Braz. J. Poult. Sci. 6:1-11.
Vignale, K. L. (2014). Protein turnover in broiler, layers, and broiler breeders. (Doctoral
dissertation). University of Arkansas, Fayetteville. Available from ProQuest Dissertations
and Theses database. (UMI No. 3666514)
Wyatt, C. L., W. D. Weaver, JR., and W. L. Beane. 1985. Influence of egg size, eggshell quality,
and posthatch holding time on broiler performance. Poult. Sci. 64(11):2049-2055.

110
CONCLUSION
Effects of age and feeding program on the metabolism of lipid in breeder hens and progeny have
been studied in many aspects. Eggs from young breeder hens contain less nutritional values than
those eggs from old breeder hens, which might result in the lower growth rate of progeny. The
studies of de novo lipogenesis (DNL) illustrate that young hens have higher rate of DNL than old
hens. At the beginning of lay, all non-lipid substrates are used for DNL including glucose and
both ketogenic and glucogenic amino acids. The progeny from the young breeder hens have less
ability to deposit the products of DNL into the body fat tissue as compared to those progeny
from old breeder hens. At hatch, yolk-derived lipids are the main source of lipids in adipose
tissue of the baby chicks. Then, the yolk lipids are used for energy purpose and gastrointestinal
growth after hatch, and lipids from feed and DNL play a key role in the deposition of adipose
tissue lipids. Palmitic acid supplementation increases the levels of monounsaturated fatty acids
(MUFA) especially oleic acid, and has positive effect on hatchability at early production period.
The slow feed increase during photostimulation to peak production with feed adding at 32wk and
the normal feed increase with feed adding at 35wk of age enhance egg production and economic
traits. Feed withdrawal after peak production impairs egg production and persistency of lay.

111
APPENDIX