Embed Size (px)
Citation preview
Journal of Engineering Science and Technology Vol. 11, No. 6 (2016) 768 - 787 © School of Engineering, Taylor’s University
768
EFFECT OF END ANCHORAGE LENGTH AND STIRRUP RATIO ON BOND AND SHEAR CAPACITY OF
CONCRETE BEAMS WITH NONMETALLIC REINFORCEMENT
RENDY THAMRIN
Department of Civil Engineering, Faculty of Engineering, Andalas University,
Padang, 25163, West Sumatera, Indonesia
E-mail: [email protected]
Abstract
This paper presents a study on the effect of end anchorage length and stirrup
ratio on bond and shear capacity of concrete beams reinforced with Carbon
Fiber Reinforced Polymer (CFRP) bars. This study was carried out using test
data on nine simply supported reinforced concrete beams with stirrups. The
beams were subjected to two point monotonic loads and the test variables were
the length of end anchorage and the stirrup ratio. Theoretical equations for
calculating bond strength and shear capacity obtained from literature were
applied and then compared with experimental values. Beams with inadequate
end anchorage length showed premature bond failure even when there was
sufficient stirrup ratio. Beams with adequate end anchorage length failed in
shear or flexure modes depending on the stirrup ratio. A numerical model for
bond stress and slip in response to pullout forces was also used to determine
analytically the bond stress distributions along end anchorage. The behavior of
tensile force acting on the stirrups was also examined. Finally, a simple model
for predicting tension force acting on the stirrups was proposed.
Keywords: bond and shear capacity, reinforced concrete beams, CFRP bar, end
anchorage length, stirrup ratio.
1. Introduction
Shear failure in reinforced concrete beams is principally indicated by propagation
of diagonal shear cracks in the shear span zone. The occurrence of diagonal shear
crack affects the distribution of tensile force along the longitudinal reinforcement
and a significant quantity of tensile force develops at the support [1-3]. In his
extensive report, Mylrea [4] suggested that extending the bar past the support may
Effect of End Anchorage Length and Stirrup Ratio on Bond and Shear . . . . 769
Journal of Engineering Science and Technology June 2016, Vol. 11(6)
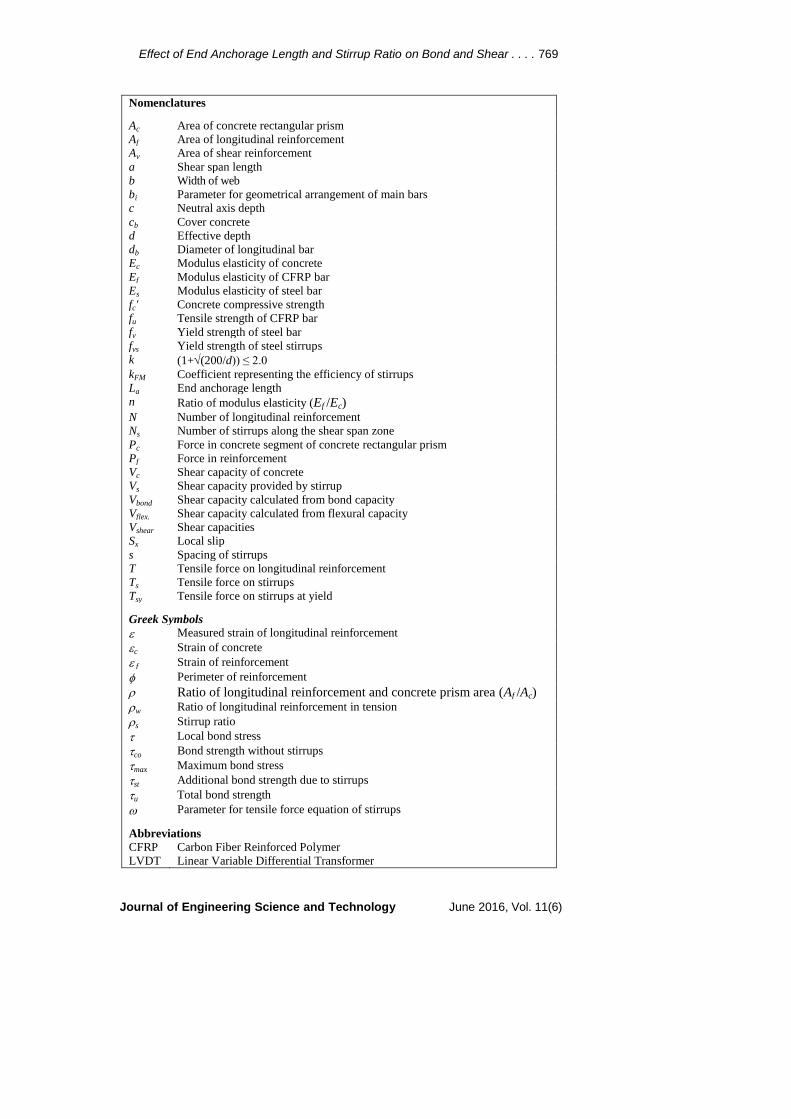
Nomenclatures
Ac Area of concrete rectangular prism
Af Area of longitudinal reinforcement
Av Area of shear reinforcement
a Shear span length
b Width of web
bi Parameter for geometrical arrangement of main bars
c Neutral axis depth
cb Cover concrete
d Effective depth
db Diameter of longitudinal bar
Ec Modulus elasticity of concrete
Ef Modulus elasticity of CFRP bar
Es Modulus elasticity of steel bar
fc' Concrete compressive strength
fu Tensile strength of CFRP bar
fy Yield strength of steel bar
fys Yield strength of steel stirrups
k (1+(200/d)) ≤ 2.0
kFM Coefficient representing the efficiency of stirrups
La End anchorage length
n Ratio of modulus elasticity (Ef /Ec) N Number of longitudinal reinforcement
Ns Number of stirrups along the shear span zone
Pc Force in concrete segment of concrete rectangular prism
Pf Force in reinforcement
Vc Shear capacity of concrete
Vs Shear capacity provided by stirrup
Vbond Shear capacity calculated from bond capacity
Vflex. Shear capacity calculated from flexural capacity
Vshear Shear capacities
Sx Local slip
s Spacing of stirrups
T Tensile force on longitudinal reinforcement
Ts Tensile force on stirrups
Tsy Tensile force on stirrups at yield
Greek Symbols
Measured strain of longitudinal reinforcement
c Strain of concrete
f Strain of reinforcement
Perimeter of reinforcement
Ratio of longitudinal reinforcement and concrete prism area (Af /Ac) w Ratio of longitudinal reinforcement in tension
s Stirrup ratio
Local bond stress
co Bond strength without stirrups
max Maximum bond stress
st Additional bond strength due to stirrups
u Total bond strength
Parameter for tensile force equation of stirrups
Abbreviations
CFRP Carbon Fiber Reinforced Polymer
LVDT Linear Variable Differential Transformer
770 Thamrin, R.
Journal of Engineering Science and Technology June 2016, Vol. 11(6)
result in a better tensile force distribution and provide higher bond capacity. Pay
et al. [5] recently report that flexural bond strength is affected by modulus
elasticity and axial rigidity of longitudinal reinforcement. It is also confirmed in
their report that the bond length in splice region affects bond strength. The test
result clarified by Pay et al. supports the previous report described by Mylrea [4]
concerning the requirement of bond length of tensile reinforcement.
Meanwhile, a series of experimental studies on shear capacity of concrete
beams with stirrups and longitudinally reinforced with Glass Fiber Reinforced
Polymer (GFRP) bars were carried out by Azlina et al. [6-8]. These studies
confirm that a significant amount of tensile force exists at the support region due
to the occurrence of the diagonal shear cracks. This suggests that longitudinal
reinforcement in the shear span zone must be sufficiently extended into the
support to avoid bond-splitting failure due to some shifting of the tensile force.
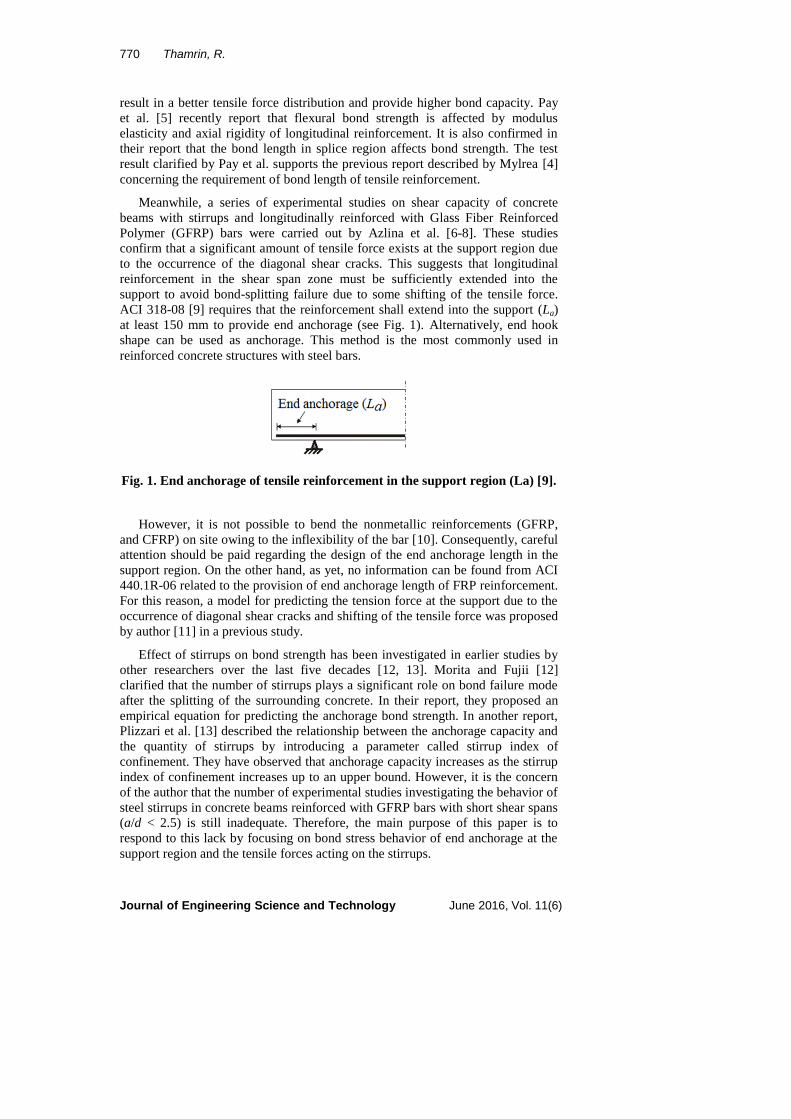
ACI 318-08 [9] requires that the reinforcement shall extend into the support (La)
at least 150 mm to provide end anchorage (see Fig. 1). Alternatively, end hook
shape can be used as anchorage. This method is the most commonly used in
reinforced concrete structures with steel bars.
Fig. 1. End anchorage of tensile reinforcement in the support region (La) [9].
However, it is not possible to bend the nonmetallic reinforcements (GFRP,
and CFRP) on site owing to the inflexibility of the bar [10]. Consequently, careful
attention should be paid regarding the design of the end anchorage length in the
support region. On the other hand, as yet, no information can be found from ACI
440.1R-06 related to the provision of end anchorage length of FRP reinforcement.
For this reason, a model for predicting the tension force at the support due to the
occurrence of diagonal shear cracks and shifting of the tensile force was proposed
by author [11] in a previous study.
Effect of stirrups on bond strength has been investigated in earlier studies by
other researchers over the last five decades [12, 13]. Morita and Fujii [12]
clarified that the number of stirrups plays a significant role on bond failure mode
after the splitting of the surrounding concrete. In their report, they proposed an
empirical equation for predicting the anchorage bond strength. In another report,
Plizzari et al. [13] described the relationship between the anchorage capacity and
the quantity of stirrups by introducing a parameter called stirrup index of
confinement. They have observed that anchorage capacity increases as the stirrup
index of confinement increases up to an upper bound. However, it is the concern
of the author that the number of experimental studies investigating the behavior of
steel stirrups in concrete beams reinforced with GFRP bars with short shear spans
(a/d < 2.5) is still inadequate. Therefore, the main purpose of this paper is to
respond to this lack by focusing on bond stress behavior of end anchorage at the
support region and the tensile forces acting on the stirrups.
Effect of End Anchorage Length and Stirrup Ratio on Bond and Shear . . . . 771
Journal of Engineering Science and Technology June 2016, Vol. 11(6)
In this investigation the author's test data [3] on nine concrete beams was
analysed to examine the effect of end anchorage length and the effect of stirrup
ratio on beam capacity. Bond strength of the beams calculated using empirical
equation is compared to that obtained from the test data. Numerical analysis was
also carried out to predict the distribution of bond stresses along the end
anchorage. In addition, the behavior of tensile force acting on the stirrups was
examined. Finally, a simple empirical model for predicting the growth of tensile
force acting on the stirrups after the occurrence of diagonal shear crack was
developed from the data.
2. Experimental Study
2.1. Beam specimens and materials
The author's test data [3] on nine simply supported reinforced concrete beam
monotonically subjected to two point load were used. The beam size was 130 mm
wide, 230 mm deep, and 1300 mm span length. All of the beams were
longitudinally reinforced (tensile reinforcement) with deformed CFRP bars.
CFRP bars used in this study were produced by Fukui Fibertech, Co. Ltd. Japan
and contain of 60% carbon fiber. The tensile strength, fu, of CFRP bars was about
1800 MPa with modulus elasticity, Ef, of 160 GPa. The longitudinal compression
reinforcement was deformed steel bars with 10 mm diameter, yield strength, fy, of
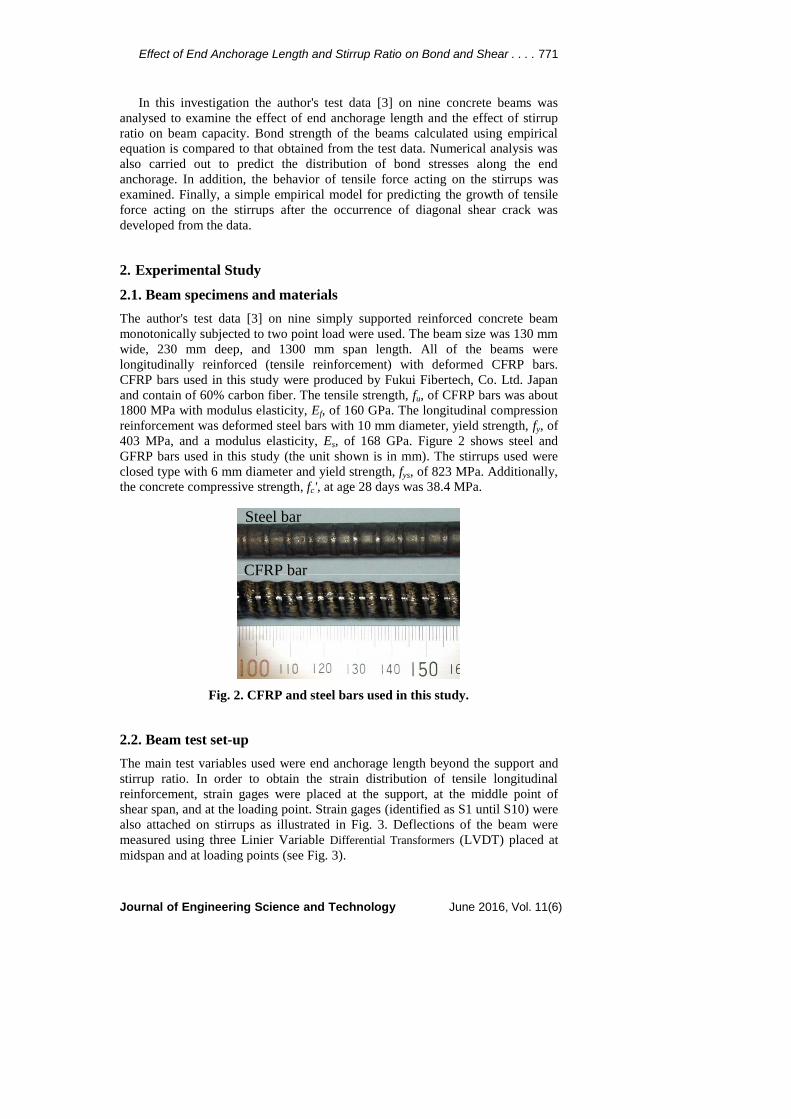
403 MPa, and a modulus elasticity, Es, of 168 GPa. Figure 2 shows steel and
GFRP bars used in this study (the unit shown is in mm). The stirrups used were
closed type with 6 mm diameter and yield strength, fys, of 823 MPa. Additionally,
the concrete compressive strength, fc', at age 28 days was 38.4 MPa.
Fig. 2. CFRP and steel bars used in this study.
2.2. Beam test set-up
The main test variables used were end anchorage length beyond the support and
stirrup ratio. In order to obtain the strain distribution of tensile longitudinal
reinforcement, strain gages were placed at the support, at the middle point of
shear span, and at the loading point. Strain gages (identified as S1 until S10) were
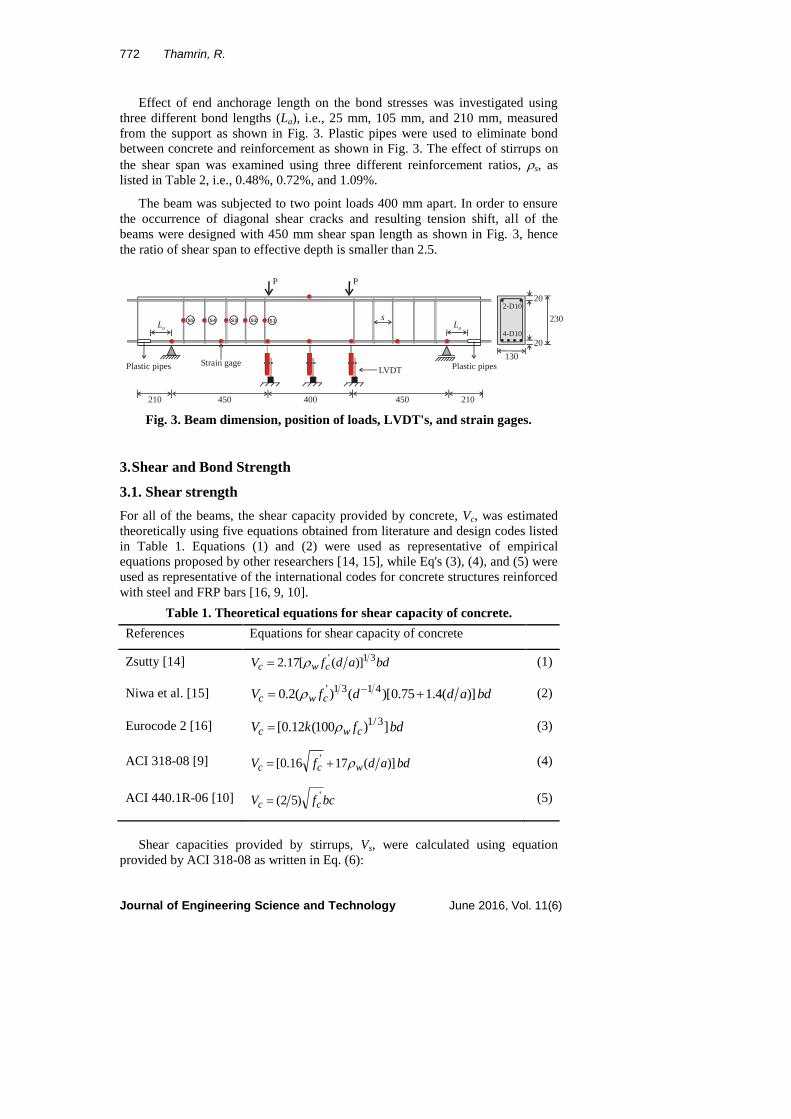
also attached on stirrups as illustrated in Fig. 3. Deflections of the beam were
measured using three Linier Variable Differential Transformers (LVDT) placed at
midspan and at loading points (see Fig. 3).
Steel bar
CFRP bar
772 Thamrin, R.
Journal of Engineering Science and Technology June 2016, Vol. 11(6)
Effect of end anchorage length on the bond stresses was investigated using
three different bond lengths (La), i.e., 25 mm, 105 mm, and 210 mm, measured
from the support as shown in Fig. 3. Plastic pipes were used to eliminate bond
between concrete and reinforcement as shown in Fig. 3. The effect of stirrups on
the shear span was examined using three different reinforcement ratios, s, as
listed in Table 2, i.e., 0.48%, 0.72%, and 1.09%.
The beam was subjected to two point loads 400 mm apart. In order to ensure
the occurrence of diagonal shear cracks and resulting tension shift, all of the
beams were designed with 450 mm shear span length as shown in Fig. 3, hence
the ratio of shear span to effective depth is smaller than 2.5.
Fig. 3. Beam dimension, position of loads, LVDT's, and strain gages.
3. Shear and Bond Strength
3.1. Shear strength
For all of the beams, the shear capacity provided by concrete, Vc, was estimated
theoretically using five equations obtained from literature and design codes listed
in Table 1. Equations (1) and (2) were used as representative of empirical
equations proposed by other researchers [14, 15], while Eq's (3), (4), and (5) were
used as representative of the international codes for concrete structures reinforced
with steel and FRP bars [16, 9, 10].
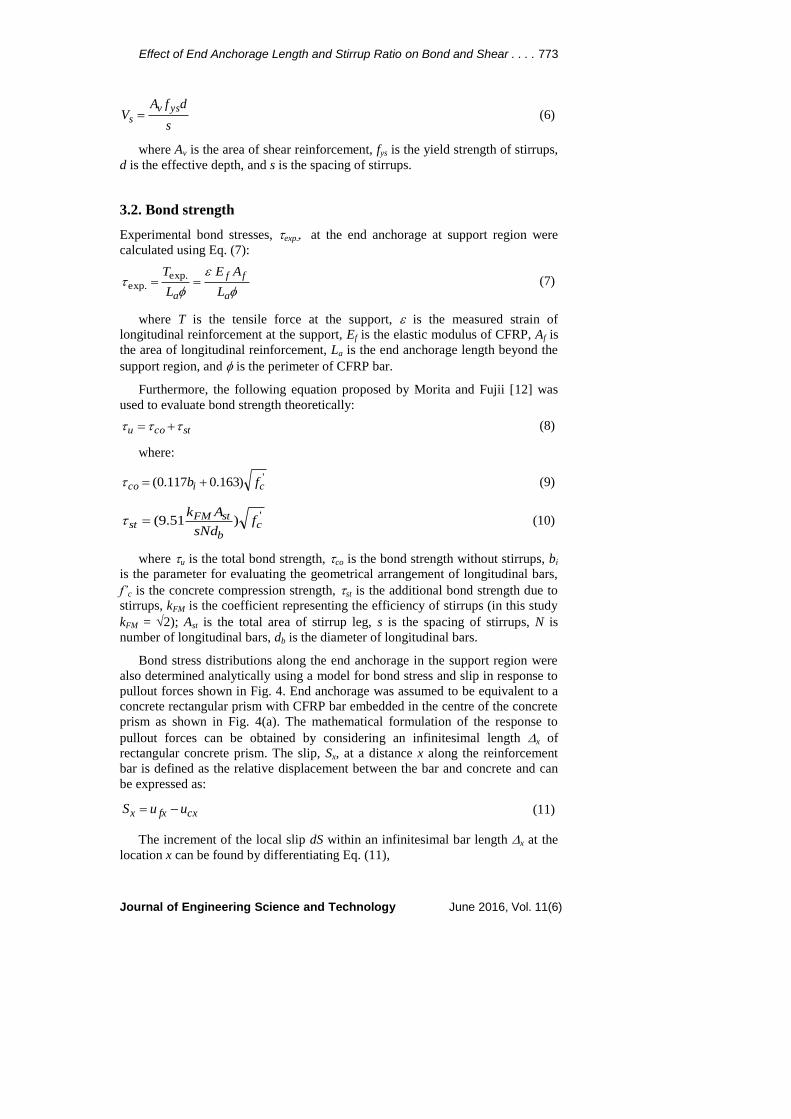
Table 1. Theoretical equations for shear capacity of concrete.
References Equations for shear capacity of concrete
Zsutty [14] bdadfV cwc31' )]([17.2 (1)
Niwa et al. [15] bdaddfV cwc )](4.175.0)[()(2.0 4131' (2)
Eurocode 2 [16] bdfkV cwc ])100(12.0[ 3/1 (3)
ACI 318-08 [9] bdadfV wcc )](1716.0[ ' (4)
ACI 440.1R-06 [10] bcfV cc')52( (5)
Shear capacities provided by stirrups, Vs, were calculated using equation
provided by ACI 318-08 as written in Eq. (6):
P P
LVDT
20
20
130
230
400450 450210 210
La
Plastic pipes
La
s
Plastic pipesStrain gage
4-D10
2-D10
S5 S4 S3 S2 S1
Effect of End Anchorage Length and Stirrup Ratio on Bond and Shear . . . . 773
Journal of Engineering Science and Technology June 2016, Vol. 11(6)
s
dfAV
ysvs (6)
where Av is the area of shear reinforcement, fys is the yield strength of stirrups,
d is the effective depth, and s is the spacing of stirrups.
3.2. Bond strength
Experimental bond stresses, exp. at the end anchorage at support region were
calculated using Eq. (7):
a
ff
a L
AE
L
T .exp.exp (7)
where T is the tensile force at the support, is the measured strain of
longitudinal reinforcement at the support, Ef is the elastic modulus of CFRP, Af is
the area of longitudinal reinforcement, La is the end anchorage length beyond the
support region, and is the perimeter of CFRP bar.
Furthermore, the following equation proposed by Morita and Fujii [12] was
used to evaluate bond strength theoretically:
stcou (8)
where:
')163.0117.0( cico fb (9)
')51.9( cb
stFMst f
sNd
Ak (10)
where u is the total bond strength, co is the bond strength without stirrups, bi
is the parameter for evaluating the geometrical arrangement of longitudinal bars,
f’c is the concrete compression strength, st is the additional bond strength due to
stirrups, kFM is the coefficient representing the efficiency of stirrups (in this study
kFM = 2); Ast is the total area of stirrup leg, s is the spacing of stirrups, N is
number of longitudinal bars, db is the diameter of longitudinal bars.
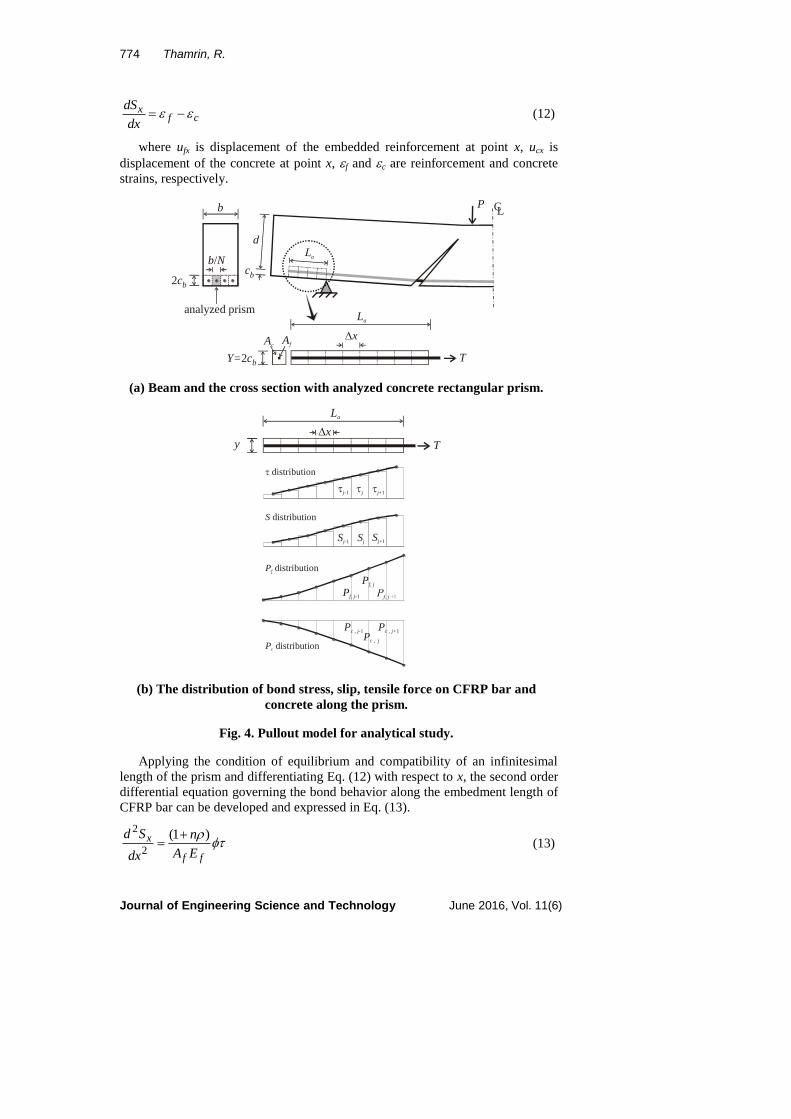
Bond stress distributions along the end anchorage in the support region were
also determined analytically using a model for bond stress and slip in response to
pullout forces shown in Fig. 4. End anchorage was assumed to be equivalent to a
concrete rectangular prism with CFRP bar embedded in the centre of the concrete
prism as shown in Fig. 4(a). The mathematical formulation of the response to
pullout forces can be obtained by considering an infinitesimal length x of
rectangular concrete prism. The slip, Sx, at a distance x along the reinforcement
bar is defined as the relative displacement between the bar and concrete and can
be expressed as:
cxfxx uuS (11)
The increment of the local slip dS within an infinitesimal bar length x at the
location x can be found by differentiating Eq. (11),
774 Thamrin, R.
Journal of Engineering Science and Technology June 2016, Vol. 11(6)
cfx
dx
dS (12)
where ufx is displacement of the embedded reinforcement at point x, ucx is
displacement of the concrete at point x, f and c are reinforcement and concrete
strains, respectively.
(a) Beam and the cross section with analyzed concrete rectangular prism.
(b) The distribution of bond stress, slip, tensile force on CFRP bar and
concrete along the prism.
Fig. 4. Pullout model for analytical study.
Applying the condition of equilibrium and compatibility of an infinitesimal
length of the prism and differentiating Eq. (12) with respect to x, the second order
differential equation governing the bond behavior along the embedment length of
CFRP bar can be developed and expressed in Eq. (13).
ff
x
EA
n
dx
Sd )1(2
2
(13)
CLP
d
cb2cb
b
b N/
analyzed prism
La
x
Y= c2 b
La
AfAc
T
xy
La
j-1 j j+1
Sj-1 Sj Sj+1
Pf, j-1
Pf, j
Pc , j-1
Pc , j
Pc , j+1
distribution
S distribution
Pf distribution
Pc distribution
T
Effect of End Anchorage Length and Stirrup Ratio on Bond and Shear . . . . 775
Journal of Engineering Science and Technology June 2016, Vol. 11(6)
where Sx is the local slip, n = Ef /Ec, = Af /Ac, is the local bond stress, and
Ac is the area of concrete rectangular prism.
This equation indicates that modulus elasticity of concrete and embedded bar,
area of rectangular concrete prism and embedded bar are parameters influenced
the local bond stress-slip relationship. The distribution of bond stress, slip, tensile
force carried by the CFRP bars and concrete along the concrete rectangular prism
are illustrated in Fig. 4(b). The slip at each segment of the concrete rectangular
prism shown in Fig. 4(b) can be solved numerically using Eq. (14).
cc
jcjc
ff
jfjf
jjEA
PP
EA
PPxSS
111
2
1 (14)
The following equilibrium equation written in Eq. (15) must be satisfied for
each assumed initial slip (load step) and given value of the tensile force, T, at the
end of embedded bar:
TPPPP ocofjcjf ,,,, (15)
If the equilibrium condition is not satisfied, the procedure should be repeated
with a new value of assumed initial slip until Eq. (15) converges within a defined
value of tolerance limit. On the other hand, if the equilibrium condition is
satisfied, the computation process will be continued with the new value of the
tensile force, T, and the distribution of slip, bond stress, Pf, and Pc can be plotted.
The maximum tensile force of longitudinal reinforcement at the support obtained
from the test, Texp., was used as the maximum tensile force, T, applied at the
loaded end of embedded bar.
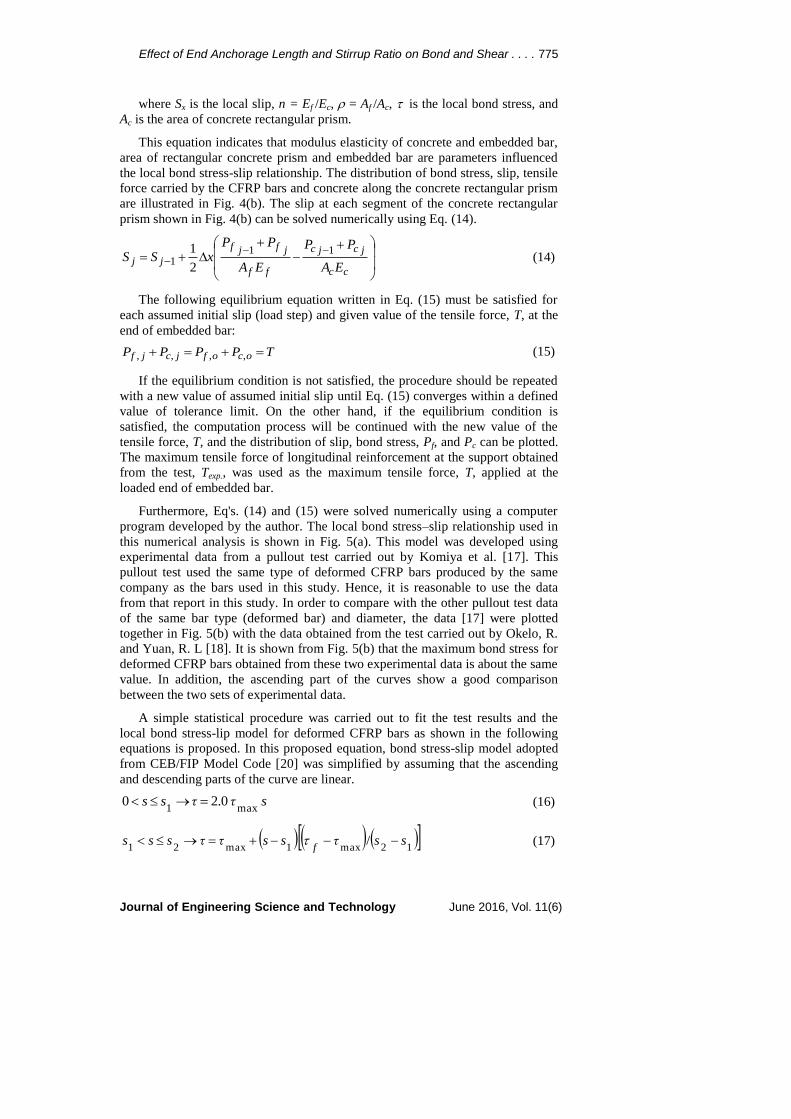
Furthermore, Eq's. (14) and (15) were solved numerically using a computer
program developed by the author. The local bond stress–slip relationship used in
this numerical analysis is shown in Fig. 5(a). This model was developed using
experimental data from a pullout test carried out by Komiya et al. [17]. This
pullout test used the same type of deformed CFRP bars produced by the same
company as the bars used in this study. Hence, it is reasonable to use the data
from that report in this study. In order to compare with the other pullout test data
of the same bar type (deformed bar) and diameter, the data [17] were plotted
together in Fig. 5(b) with the data obtained from the test carried out by Okelo, R.
and Yuan, R. L [18]. It is shown from Fig. 5(b) that the maximum bond stress for
deformed CFRP bars obtained from these two experimental data is about the same
value. In addition, the ascending part of the curves show a good comparison
between the two sets of experimental data.
A simple statistical procedure was carried out to fit the test results and the
local bond stress-lip model for deformed CFRP bars as shown in the following
equations is proposed. In this proposed equation, bond stress-slip model adopted
from CEB/FIP Model Code [20] was simplified by assuming that the ascending
and descending parts of the curve are linear.
sττss 0.2 0max1
(16)
12max1max21
/ ssτssττsssf
(17)
776 Thamrin, R.
Journal of Engineering Science and Technology June 2016, Vol. 11(6)
2 f
ττss (18)
1'
max sfc (19)
max 0.2 fτ (20)
where mm 50 1
.s and mm 5 2s
Figure 5(a) also shows the comparison between Eligehausen, Popov, and
Bertero (BPE) modified model [19] and the proposed model. It is shown that BPE
modified model (ribbed bar type) has a lower bond strength. This result is
reasonable because the value of maximum bond stress (max) obtained from
reference [19] is lower than the maximum bond stress in references [17] and [18]
as that used to develop the proposed model.
(a) Proposed model (b) Experimental data [17, 18]
Fig. 5. Proposed local bond stress–slip relationship used in analytical study.
4. Test Results and Discussion
4.1. Failure modes of the beams
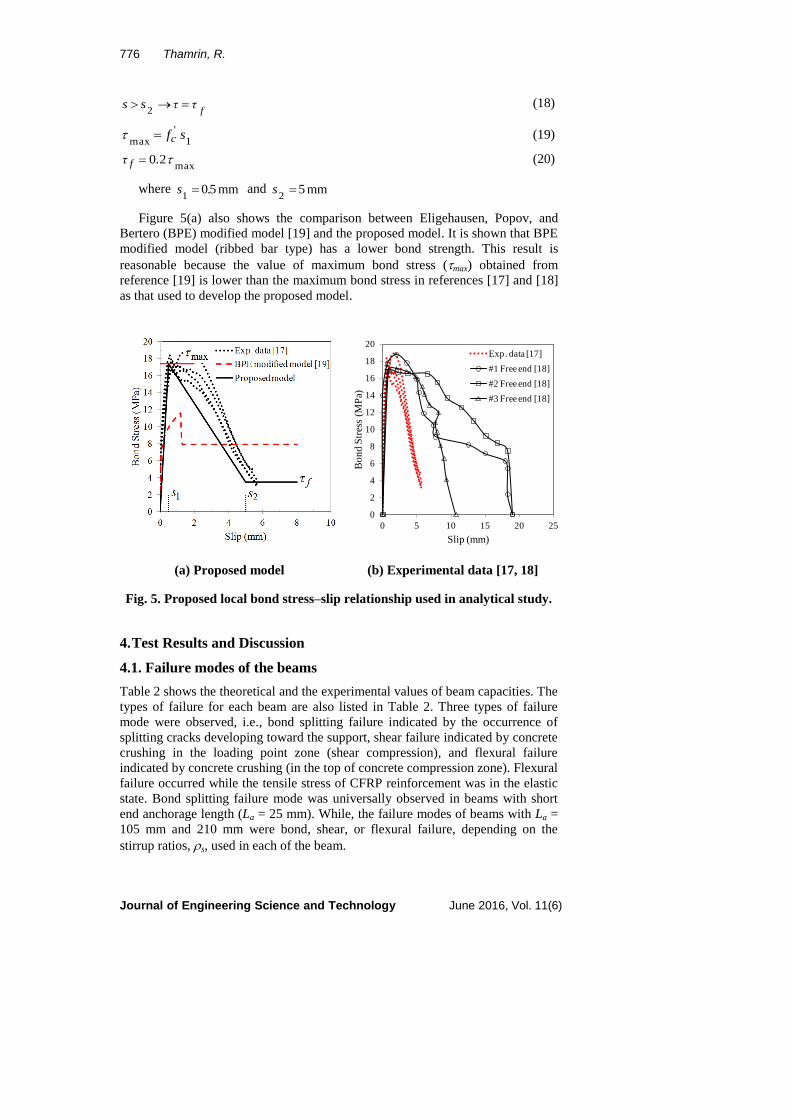
Table 2 shows the theoretical and the experimental values of beam capacities. The
types of failure for each beam are also listed in Table 2. Three types of failure
mode were observed, i.e., bond splitting failure indicated by the occurrence of
splitting cracks developing toward the support, shear failure indicated by concrete
crushing in the loading point zone (shear compression), and flexural failure
indicated by concrete crushing (in the top of concrete compression zone). Flexural
failure occurred while the tensile stress of CFRP reinforcement was in the elastic
state. Bond splitting failure mode was universally observed in beams with short
end anchorage length (La = 25 mm). While, the failure modes of beams with La =
105 mm and 210 mm were bond, shear, or flexural failure, depending on the
stirrup ratios, s, used in each of the beam.
0
2
4
6
8
10
12
14
16
18
20
0 5 10 15 20 25
Bo
nd
Str
ess
(MP
a)
Slip (mm)
Exp. data [17]
#1 Free end [18]
#2 Free end [18]
#3 Free end [18]
Effect of End Anchorage Length and Stirrup Ratio on Bond and Shear . . . . 777
Journal of Engineering Science and Technology June 2016, Vol. 11(6)
Table 2. Theoretical and experimental values of beams capacities.
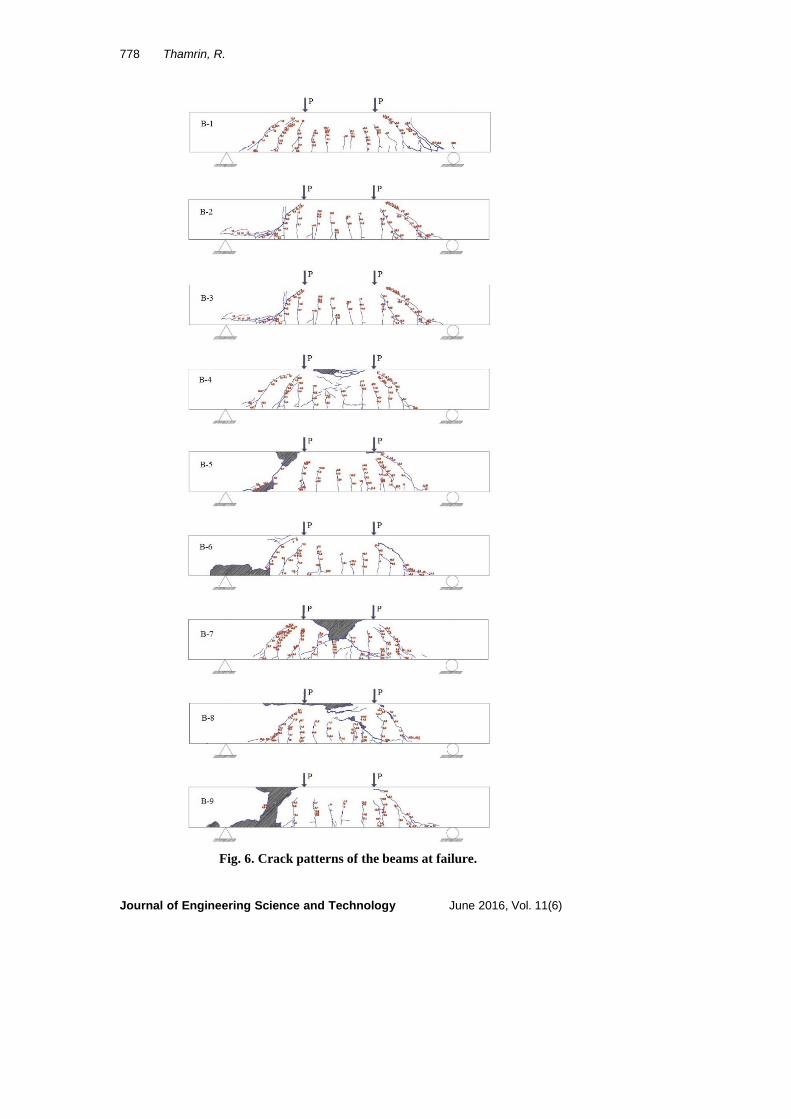
Crack patterns of the beams at failure are illustrated in Fig. 6. It shows that the
first flexural crack is initially developed in the constant moment zone (between
two point loads). As the load increases, the cracks appear in the shear span zone
followed by the occurrence of the diagonal shear cracks. Propagation of the
diagonal crack is basically due to a condition of pure shear which occurs at the
neutral axis and causes rotation of the principal stress trajectories. In the case of
beams with insufficient end anchorage length (B-1, B-2, and B-3), the diagonal
crack in the shear span zone was followed by bond-splitting cracks developing
toward the support zone. This condition decreases bond strength in the support
zone and caused failure in bond-splitting mode. In addition, the stirrup ratio
significantly affect not only the capacity but also the crack patterns of the beams
in the shear span zone as shown in Fig. 6.
4.2. Shear capacity of the beams
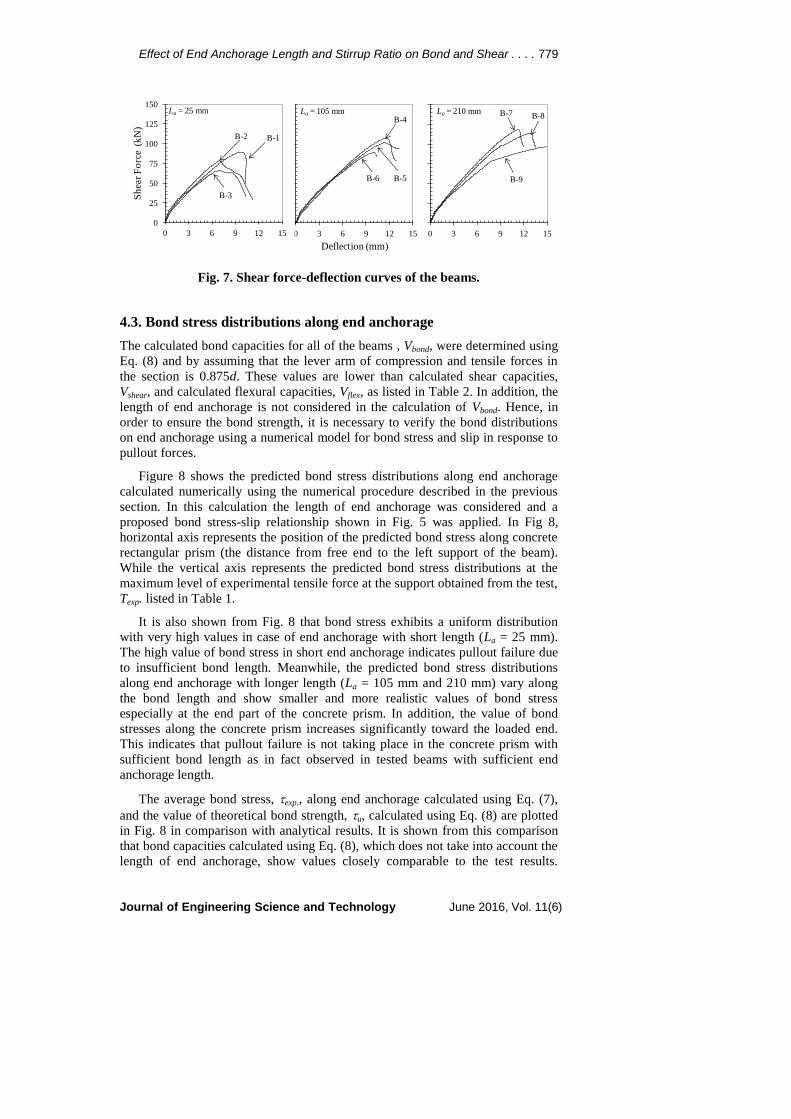
Shear force-deflection curves indicating beam capacities are shown in Fig. 7. The
deflections plotted in this figure were obtained from data measured by LVDT
located in the midspan of the beams. It is shown from Fig. 7 that beams with
longer end anchorage length and higher stirrup ratio fail at higher shear forces and
larger deflections. In addition, stiffness of the beams with higher stirrup ratio (B-4
and B-7) is slightly higher than stiffness of beams with lower (B-3, B-6 and B-9)
stirrup ratio. Figure 7 also shows that all of the curves drop down rapidly without
showing ductile behavior after reaching the peak load even though the beam
failed in flexural mode which was indicated by concrete crushing at the top of
concrete compression zone.
In this study, the total shear capacity of the beams was evaluated theoretically
using empirical equations listed in Table 1 and Eq. (6). The results are shown in
Table 2, it is shown that concrete shear capacity, Vc, calculated using Eq. (3) and
Eq. (5) considerably underestimates the results obtained from the test and appears
to be conservative for all beams examined in this study. While predicted values
using Eq. (2) seem to be the closest to the appearance of experimental diagonal
cracks, Vc exp.. It is also shown from Table 2 that the contribution of stirrups to
shear capacity of the beams, Vs, is relatively high, even in the case of beams with
the lowest stirrup ratio. This might be due to the high value of stirrups yield
stress. However, not all of the calculated shear capacities, Vshear, of the beams
were higher than calculated flexural capacities, Vflex, as listed in Table 2.
Eq.(1) Eq.(2) Eq.(3) Eq.(4) Eq.(5) Eq.(6)
(mm) (%) (MPa) (kN) (kN) (kN) (kN) (kN) (kN) (kN) (MPa) (MPa) (MPa) (kN) (kN) (kN) (kN) (kN)
B-1 1.09 6.1 20.3 244.3 2.51 1.96 4.5 109.5 265.9 44.1 89.5 Bond
B-2 0.72 4.7 15.8 162.9 2.51 1.31 3.8 93.4 184.4 43.0 78.0 Bond
B-3 0.48 5.5 18.2 108.6 2.51 0.87 3.4 82.8 130.1 35.0 65.5 Bond
B-4 1.09 4.6 64.2 244.3 2.51 1.96 4.5 109.5 265.9 38.1 107.5 Flexural
B-5 0.72 4.3 60.8 162.9 2.51 1.31 3.8 93.4 184.4 37.1 102.1 Shear
B-6 0.48 4.4 61.6 108.6 2.51 0.87 3.4 82.8 130.1 35.6 90.0 Bond
B-7 1.09 2.9 80.7 244.3 2.51 1.96 4.5 109.5 265.9 50.6 118.0 Flexural
B-8 0.72 2.6 72.8 162.9 2.51 1.31 3.8 93.4 184.4 46.2 113.6 Flexural
B-9 0.48 3.0 84.4 108.6 2.51 0.87 3.4 82.8 130.1 40.1 106.0 Shear
29.9105
210
25
L a
Type
of
failure
42.5
V flex
130.5
st u
V s
41.6 21.524
V exp.V shear co V bondT exp. exp. s V c exp.
V c theoretical
Beams
778 Thamrin, R.
Journal of Engineering Science and Technology June 2016, Vol. 11(6)
Fig. 6. Crack patterns of the beams at failure.
Effect of End Anchorage Length and Stirrup Ratio on Bond and Shear . . . . 779
Journal of Engineering Science and Technology June 2016, Vol. 11(6)
Fig. 7. Shear force-deflection curves of the beams.
4.3. Bond stress distributions along end anchorage
The calculated bond capacities for all of the beams , Vbond, were determined using
Eq. (8) and by assuming that the lever arm of compression and tensile forces in
the section is 0.875d. These values are lower than calculated shear capacities,
Vshear, and calculated flexural capacities, Vflex, as listed in Table 2. In addition, the
length of end anchorage is not considered in the calculation of Vbond. Hence, in
order to ensure the bond strength, it is necessary to verify the bond distributions
on end anchorage using a numerical model for bond stress and slip in response to
pullout forces.
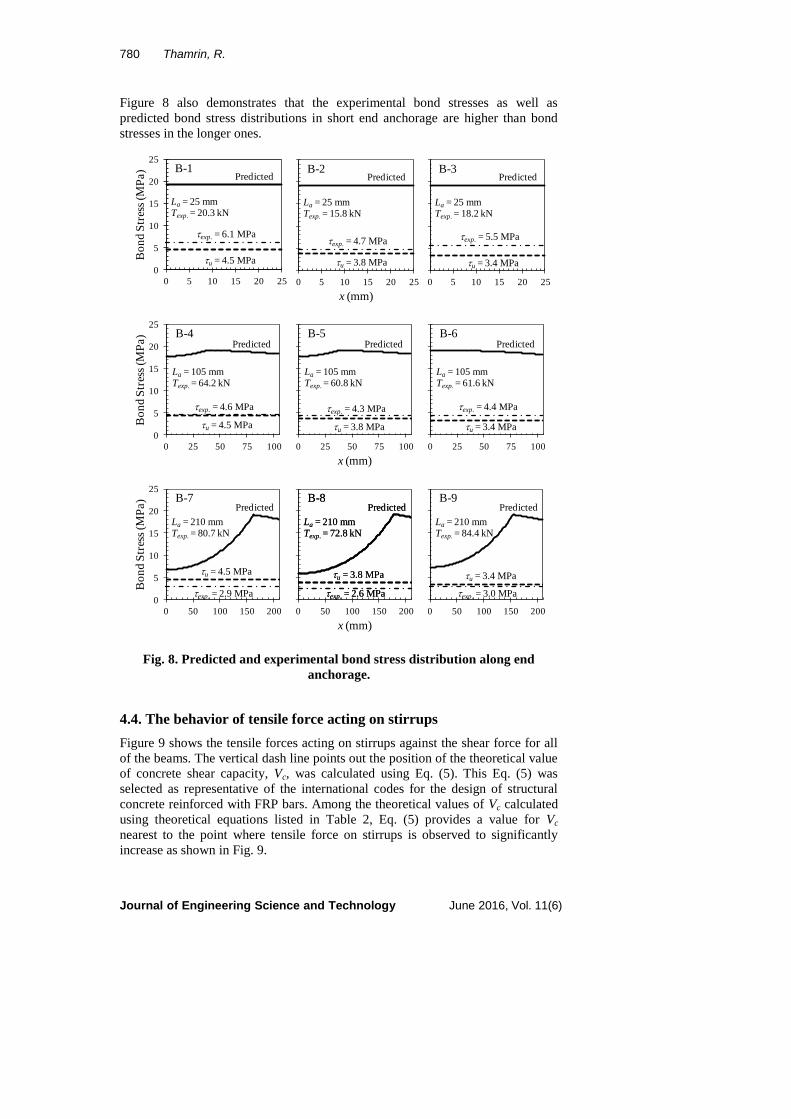
Figure 8 shows the predicted bond stress distributions along end anchorage
calculated numerically using the numerical procedure described in the previous
section. In this calculation the length of end anchorage was considered and a
proposed bond stress-slip relationship shown in Fig. 5 was applied. In Fig 8,
horizontal axis represents the position of the predicted bond stress along concrete
rectangular prism (the distance from free end to the left support of the beam).
While the vertical axis represents the predicted bond stress distributions at the
maximum level of experimental tensile force at the support obtained from the test,
Texp. listed in Table 1.
It is also shown from Fig. 8 that bond stress exhibits a uniform distribution
with very high values in case of end anchorage with short length (La = 25 mm).
The high value of bond stress in short end anchorage indicates pullout failure due
to insufficient bond length. Meanwhile, the predicted bond stress distributions
along end anchorage with longer length (La = 105 mm and 210 mm) vary along
the bond length and show smaller and more realistic values of bond stress
especially at the end part of the concrete prism. In addition, the value of bond
stresses along the concrete prism increases significantly toward the loaded end.
This indicates that pullout failure is not taking place in the concrete prism with
sufficient bond length as in fact observed in tested beams with sufficient end
anchorage length.
The average bond stress, exp., along end anchorage calculated using Eq. (7),
and the value of theoretical bond strength, u, calculated using Eq. (8) are plotted
in Fig. 8 in comparison with analytical results. It is shown from this comparison
that bond capacities calculated using Eq. (8), which does not take into account the
length of end anchorage, show values closely comparable to the test results.
0
25
50
75
100
125
150
0 3 6 9 12 15
Sh
ear
Fo
rce
(kN
)
Deflection (mm)
B-7 B-8
B-9
La = 210 mm
0
25
50
75
100
125
150
0 3 6 9 12 15
Sh
ear
Fo
rce
(kN
)
Deflection (mm)
B-4
B-5B-6
La = 105 mm
0
25
50
75
100
125
150
0 3 6 9 12 15
Sh
ear
Fo
rce
(kN
)
Deflection (mm)
B-2 B-1
B-3
La = 25 mm
780 Thamrin, R.
Journal of Engineering Science and Technology June 2016, Vol. 11(6)
Figure 8 also demonstrates that the experimental bond stresses as well as
predicted bond stress distributions in short end anchorage are higher than bond
stresses in the longer ones.
Fig. 8. Predicted and experimental bond stress distribution along end
anchorage.
4.4. The behavior of tensile force acting on stirrups
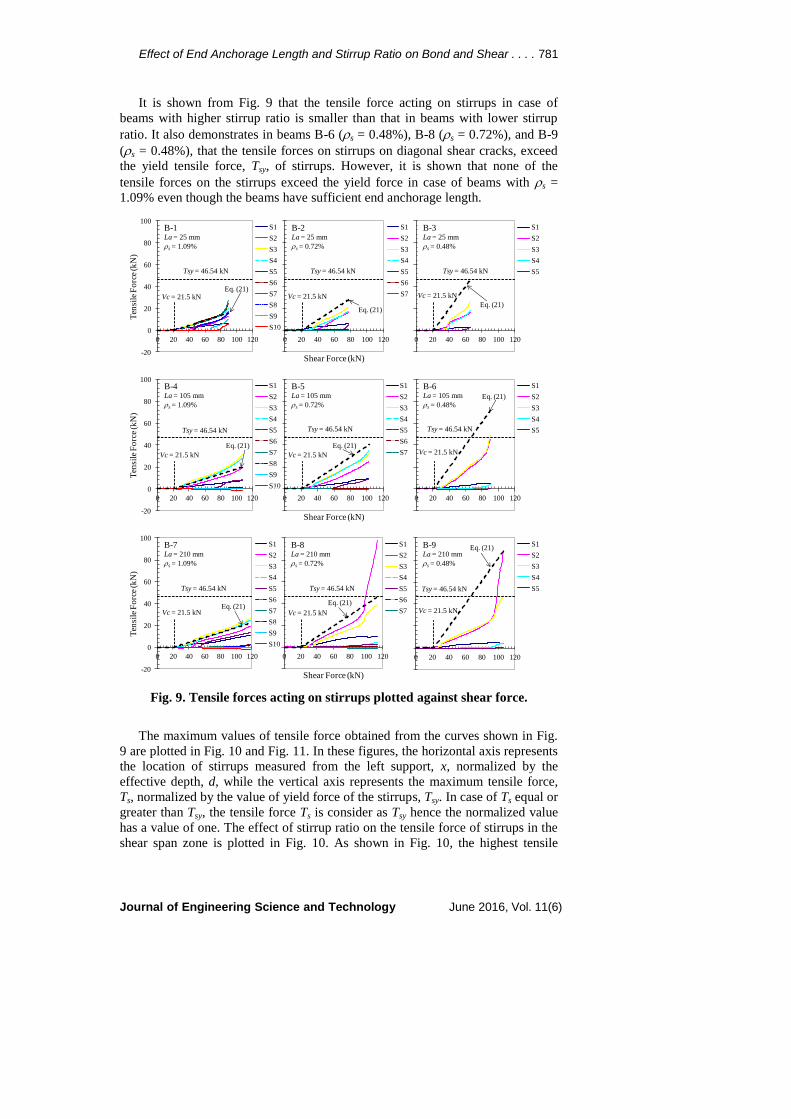
Figure 9 shows the tensile forces acting on stirrups against the shear force for all
of the beams. The vertical dash line points out the position of the theoretical value
of concrete shear capacity, Vc, was calculated using Eq. (5). This Eq. (5) was
selected as representative of the international codes for the design of structural
concrete reinforced with FRP bars. Among the theoretical values of Vc calculated
using theoretical equations listed in Table 2, Eq. (5) provides a value for Vc
nearest to the point where tensile force on stirrups is observed to significantly
increase as shown in Fig. 9.
0
5
10
15
20
25
0 5 10 15 20 25
Bo
nd
Str
ess
(MP
a)
x (mm)
u = 3.4 MPa
Predicted
exp. = 5.5 MPa
La = 25 mmTexp. = 18.2 kN
B-3
0
5
10
15
20
25
0 5 10 15 20 25B
on
d S
tres
s (M
Pa)
x (mm)
u = 3.8 MPa
Predicted
exp. = 4.7 MPa
La = 25 mmTexp. = 15.8 kN
B-2
0
5
10
15
20
25
0 5 10 15 20 25
Bo
nd
Str
ess
(MP
a)
x (mm)
u = 4.5 MPa
Predicted
exp. = 6.1 MPa
La = 25 mmTexp. = 20.3 kN
B-1
0
5
10
15
20
25
0 25 50 75 100
Bo
nd
Str
ess
(MP
a)
x (mm)
u = 3.4 MPa
exp. = 4.4 MPa
Predicted
La = 105 mmTexp. = 61.6 kN
B-6
0
5
10
15
20
25
0 25 50 75 100
Bo
nd
Str
ess
(MP
a)
x (mm)
u = 3.8 MPa
exp. = 4.3 MPa
Predicted
La = 105 mmTexp. = 60.8 kN
B-5
0
5
10
15
20
25
0 25 50 75 100
Bo
nd
Str
ess
(MP
a)
x (mm)
u = 4.5 MPa
exp. = 4.6 MPa
Predicted
La = 105 mmTexp. = 64.2 kN
B-4
0
5
10
15
20
25
0 50 100 150 200
Bo
nd
Str
ess
(MP
a)
x (mm)
u = 3.4 MPa
exp. = 3.0 MPa
Predicted
La = 210 mmTexp. = 84.4 kN
B-9
0
5
10
15
20
25
0 50 100 150 200
Bo
nd
Str
ess
(MP
a)
x (mm)
u = 3.8 MPa
exp. = 2.6 MPa
Predicted
La = 210 mmTexp. = 72.8 kN
B-8
u = 3.8 MPa
exp. = 2.6 MPa
Predicted
La = 210 mmTexp. = 72.8 kN
B-8
0
5
10
15
20
25
0 50 100 150 200
Bo
nd
Str
ess
(MP
a)
x (mm)
u = 4.5 MPa
exp. = 2.9 MPa
Predicted
La = 210 mmTexp. = 80.7 kN
B-7
Effect of End Anchorage Length and Stirrup Ratio on Bond and Shear . . . . 781
Journal of Engineering Science and Technology June 2016, Vol. 11(6)
It is shown from Fig. 9 that the tensile force acting on stirrups in case of
beams with higher stirrup ratio is smaller than that in beams with lower stirrup
ratio. It also demonstrates in beams B-6 (s = 0.48%), B-8 (s = 0.72%), and B-9
(s = 0.48%), that the tensile forces on stirrups on diagonal shear cracks, exceed
the yield tensile force, Tsy, of stirrups. However, it is shown that none of the
tensile forces on the stirrups exceed the yield force in case of beams with s =
1.09% even though the beams have sufficient end anchorage length.
Fig. 9. Tensile forces acting on stirrups plotted against shear force.
The maximum values of tensile force obtained from the curves shown in Fig.
9 are plotted in Fig. 10 and Fig. 11. In these figures, the horizontal axis represents
the location of stirrups measured from the left support, x, normalized by the
effective depth, d, while the vertical axis represents the maximum tensile force,
Ts, normalized by the value of yield force of the stirrups, Tsy. In case of Ts equal or
greater than Tsy, the tensile force Ts is consider as Tsy hence the normalized value
has a value of one. The effect of stirrup ratio on the tensile force of stirrups in the
shear span zone is plotted in Fig. 10. As shown in Fig. 10, the highest tensile
-20
0
20
40
60
80
100
0 20 40 60 80 100 120
Ten
sile
Fo
rce
(kN
)
Shear Force (kN)
S1
S2
S3
S4
S5
S6
S7
S8
S9
S10
Tsy = 46.54 kN
B-1La = 25 mm
s = 1.09%
Vc = 21.5 kNEq. (21)
-20
0
20
40
60
80
100
0 20 40 60 80 100 120
Ten
sile
Fo
rce
(kN
)
Shear Force (kN)
S1
S2
S3
S4
S5
S6
S7
Tsy = 46.54 kN
B-2La = 25 mm
s = 0.72%
Vc = 21.5 kN
Eq. (21)
-20
0
20
40
60
80
100
0 20 40 60 80 100 120
Ten
sile
Fo
rce
(kN
)
Shear Force (kN)
S1
S2
S3
S4
S5Tsy = 46.54 kN
B-3La = 25 mm
s = 0.48%
Vc = 21.5 kN
Eq. (21)
-20
0
20
40
60
80
100
0 20 40 60 80 100 120
Ten
sile
Fo
rce
(kN
)
Shear Force (kN)
S1
S2
S3
S4
S5
S6
S7
S8
S9
S10
Tsy = 46.54 kN
B-4La = 105 mm
s = 1.09%
Vc = 21.5 kN
Eq. (21)
-20
0
20
40
60
80
100
0 20 40 60 80 100 120
Ten
sile
Fo
rce
(kN
)
Shear Force (kN)
S1
S2
S3
S4
S5
S6
S7
Tsy = 46.54 kN
B-5La = 105 mm
s = 0.72%
Vc = 21.5 kN
Eq. (21)
-20
0
20
40
60
80
100
0 20 40 60 80 100 120
Ten
sile
Fo
rce
(kN
)
Shear Force (kN)
S1
S2
S3
S4
S5Tsy = 46.54 kN
B-6La = 105 mm
s = 0.48%
Vc = 21.5 kN
Eq. (21)
-20
0
20
40
60
80
100
0 20 40 60 80 100 120
Ten
sile
Fo
rce
(kN
)
Shear Force (kN)
S1
S2
S3
S4
S5
S6
S7
S8
S9
S10
Tsy = 46.54 kN
B-7La = 210 mm
s = 1.09%
Vc = 21.5 kNEq. (21)
-20
0
20
40
60
80
100
0 20 40 60 80 100 120
Ten
sile
Fo
rce
(kN
)
Shear Force (kN)
S1
S2
S3
S4
S5
S6
S7
Tsy = 46.54 kN
B-8La = 210 mm
s = 0.72%
Vc = 21.5 kN
Eq. (21)
-20
0
20
40
60
80
100
0 20 40 60 80 100 120
Ten
sile
Fo
rce
(kN
)
Shear Force (kN)
S1
S2
S3
S4
S5Tsy = 46.54 kN
B-9La = 210 mm
s = 0.48%
Vc = 21.5 kN
Eq. (21)
782 Thamrin, R.
Journal of Engineering Science and Technology June 2016, Vol. 11(6)
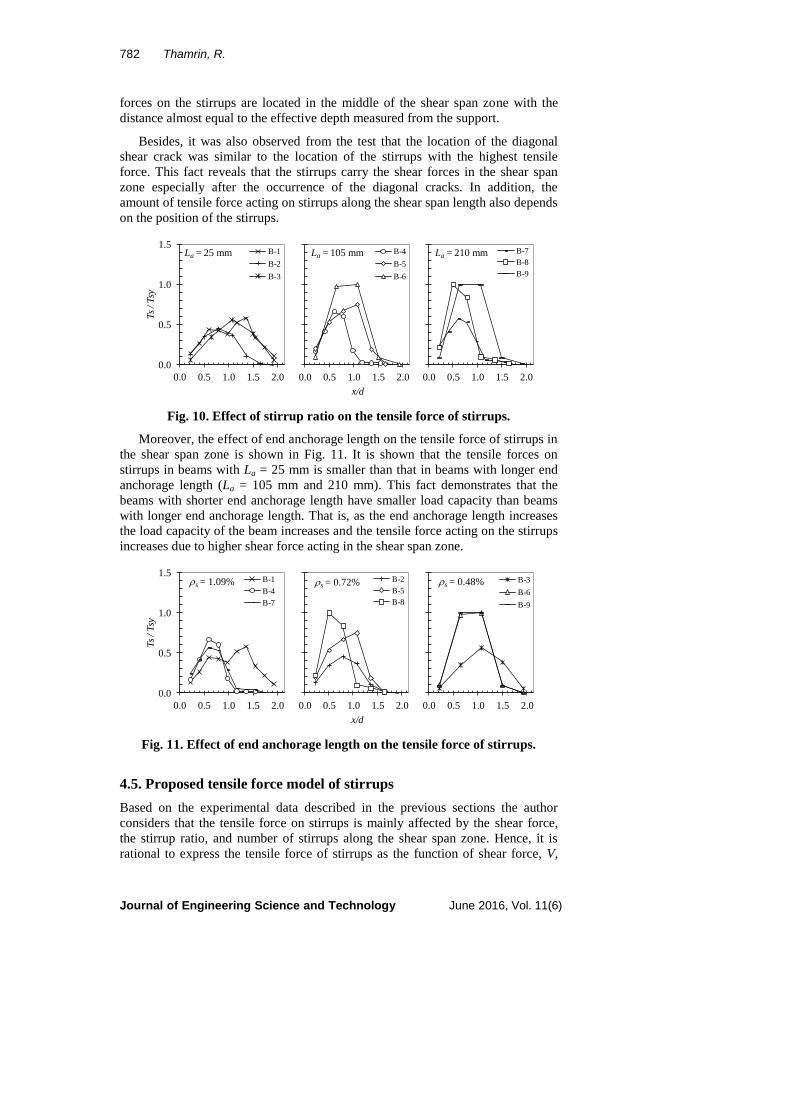
forces on the stirrups are located in the middle of the shear span zone with the
distance almost equal to the effective depth measured from the support.
Besides, it was also observed from the test that the location of the diagonal
shear crack was similar to the location of the stirrups with the highest tensile
force. This fact reveals that the stirrups carry the shear forces in the shear span
zone especially after the occurrence of the diagonal cracks. In addition, the
amount of tensile force acting on stirrups along the shear span length also depends
on the position of the stirrups.
Fig. 10. Effect of stirrup ratio on the tensile force of stirrups.
Moreover, the effect of end anchorage length on the tensile force of stirrups in
the shear span zone is shown in Fig. 11. It is shown that the tensile forces on
stirrups in beams with La = 25 mm is smaller than that in beams with longer end
anchorage length (La = 105 mm and 210 mm). This fact demonstrates that the
beams with shorter end anchorage length have smaller load capacity than beams
with longer end anchorage length. That is, as the end anchorage length increases
the load capacity of the beam increases and the tensile force acting on the stirrups
increases due to higher shear force acting in the shear span zone.
Fig. 11. Effect of end anchorage length on the tensile force of stirrups.
4.5. Proposed tensile force model of stirrups
Based on the experimental data described in the previous sections the author
considers that the tensile force on stirrups is mainly affected by the shear force,
the stirrup ratio, and number of stirrups along the shear span zone. Hence, it is
rational to express the tensile force of stirrups as the function of shear force, V,
0.0
0.5
1.0
1.5
0.0 0.5 1.0 1.5 2.0
Ts
/Tsy
x/d
B-7
B-8
B-9
La = 210 mm
0.0
0.5
1.0
1.5
0.0 0.5 1.0 1.5 2.0
Ts
/Tsy
x/d
B-4
B-5
B-6
La = 105 mm
0.0
0.5
1.0
1.5
0.0 0.5 1.0 1.5 2.0
Ts
/Tsy
x/d
B-1
B-2
B-3
La = 25 mm
0.0
0.5
1.0
1.5
0.0 0.5 1.0 1.5 2.0
Ts
/Tsy
x/d
B-3
B-6
B-9
s = 0.48%
0.0
0.5
1.0
1.5
0.0 0.5 1.0 1.5 2.0
Ts
/Tsy
x/d
B-2
B-5
B-8
s = 0.72%
0.0
0.5
1.0
1.5
0.0 0.5 1.0 1.5 2.0
Ts
/Tsy
x/d
B-1
B-4
B-7
s = 1.09%
Effect of End Anchorage Length and Stirrup Ratio on Bond and Shear . . . . 783
Journal of Engineering Science and Technology June 2016, Vol. 11(6)
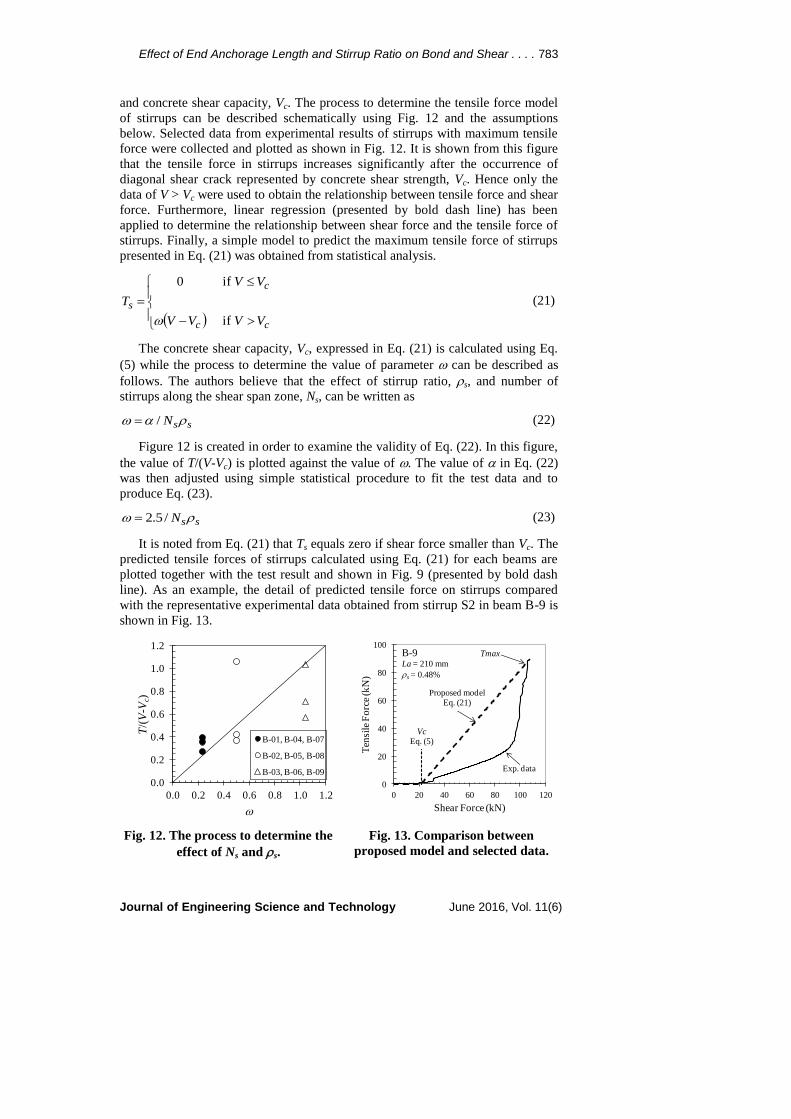
and concrete shear capacity, Vc. The process to determine the tensile force model
of stirrups can be described schematically using Fig. 12 and the assumptions
below. Selected data from experimental results of stirrups with maximum tensile
force were collected and plotted as shown in Fig. 12. It is shown from this figure
that the tensile force in stirrups increases significantly after the occurrence of
diagonal shear crack represented by concrete shear strength, Vc. Hence only the
data of V > Vc were used to obtain the relationship between tensile force and shear
force. Furthermore, linear regression (presented by bold dash line) has been
applied to determine the relationship between shear force and the tensile force of
stirrups. Finally, a simple model to predict the maximum tensile force of stirrups
presented in Eq. (21) was obtained from statistical analysis.
c
c
c
s
VV
VV
VV
T
if
if0
(21)
The concrete shear capacity, Vc, expressed in Eq. (21) is calculated using Eq.
(5) while the process to determine the value of parameter can be described as
follows. The authors believe that the effect of stirrup ratio, s, and number of
stirrups along the shear span zone, Ns, can be written as
ssN / (22)
Figure 12 is created in order to examine the validity of Eq. (22). In this figure,
the value of T/(V-Vc) is plotted against the value of . The value of in Eq. (22)
was then adjusted using simple statistical procedure to fit the test data and to
produce Eq. (23).
ssN /5.2 (23)
It is noted from Eq. (21) that Ts equals zero if shear force smaller than Vc. The
predicted tensile forces of stirrups calculated using Eq. (21) for each beams are
plotted together with the test result and shown in Fig. 9 (presented by bold dash
line). As an example, the detail of predicted tensile force on stirrups compared
with the representative experimental data obtained from stirrup S2 in beam B-9 is
shown in Fig. 13.
Fig. 12. The process to determine the
effect of Ns and s.
Fig. 13. Comparison between
proposed model and selected data.
0.0
0.2
0.4
0.6
0.8
1.0
1.2
0.0 0.2 0.4 0.6 0.8 1.0 1.2
T/(
V-V
c)
B-01, B-04, B-07
B-02, B-05, B-08
B-03, B-06, B-09
0
20
40
60
80
100
0 20 40 60 80 100 120
Ten
sile
Fo
rce
(kN
)
Shear Force (kN)
VcEq. (5)
Proposed modelEq. (21)
Exp. data
TmaxB-9La = 210 mm
s = 0.48%
784 Thamrin, R.
Journal of Engineering Science and Technology June 2016, Vol. 11(6)
In practical application, the value of maximum tensile force, Tmax, shown in
Fig. 13 is obtained by substituting the minimum shear capacity value of Vflex.,
Vbond, or Vshear, i.e., the shear force calculated from flexural, bond, or shear
capacity, respectively. It is shown from Fig. 9 and Fig. 13 that, in case of beams
with higher stirrup ratio, the proposed model predicts the maximum tensile force
with a good level of accuracy. While, in the case of beams with lower stirrup
ratio, the predicted values lie above observed values obtained from the test. This
results indicates that the proposed model conservatively predicts the tension force
acted on stirrups especially in case of beams with lower stirrup ratio.
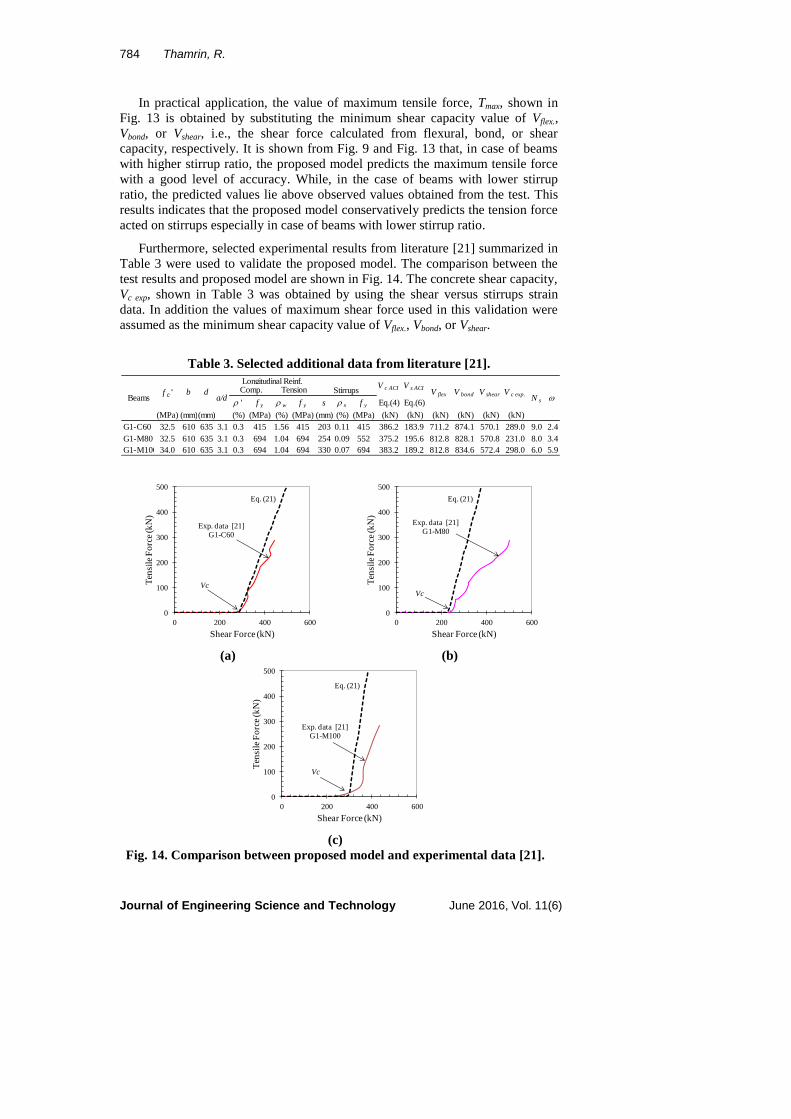
Furthermore, selected experimental results from literature [21] summarized in
Table 3 were used to validate the proposed model. The comparison between the
test results and proposed model are shown in Fig. 14. The concrete shear capacity,
Vc exp, shown in Table 3 was obtained by using the shear versus stirrups strain
data. In addition the values of maximum shear force used in this validation were
assumed as the minimum shear capacity value of Vflex., Vbond, or Vshear.
Table 3. Selected additional data from literature [21].
(a) (b)
(c)
Fig. 14. Comparison between proposed model and experimental data [21].
' f y w f y s s f y Eq.(4) Eq.(6)
(MPa) (mm)(mm) (%) (MPa) (%) (MPa) (mm) (%) (MPa) (kN) (kN) (kN) (kN) (kN) (kN)
G1-C60 32.5 610 635 3.1 0.3 415 1.56 415 203 0.11 415 386.2 183.9 711.2 874.1 570.1 289.0 9.0 2.4
G1-M80 32.5 610 635 3.1 0.3 694 1.04 694 254 0.09 552 375.2 195.6 812.8 828.1 570.8 231.0 8.0 3.4
G1-M100 34.0 610 635 3.1 0.3 694 1.04 694 330 0.07 694 383.2 189.2 812.8 834.6 572.4 298.0 6.0 5.9
f c ' b da/d
V c exp.V shear
V c ACI V s ACIV flex
Beams N s
Comp. TensionLongitudinal Reinf.
V bond
Stirrups
0
100
200
300
400
500
0 200 400 600
Ten
sile
Fo
rce
(kN
)
Shear Force (kN)
Vc
Exp. data [21]G1-C60
Eq. (21)
0
100
200
300
400
500
0 200 400 600
Ten
sile
Fo
rce
(kN
)
Shear Force (kN)
Vc
Eq. (21)
Exp. data [21]G1-M80
0
100
200
300
400
500
0 200 400 600
Ten
sile
Fo
rce
(kN
)
Shear Force (kN)
Vc
Eq. (21)
Exp. data [21]G1-M100
Effect of End Anchorage Length and Stirrup Ratio on Bond and Shear . . . . 785
Journal of Engineering Science and Technology June 2016, Vol. 11(6)
The tensile forces of stirrups plotted in Fig. 14 were obtained using the data
listed in Table 3 and the shear versus stirrups strain records [21]. It is shown from
Fig. 13 that Eq. (21) predicts conservatively the growth of tensile force on
stirrups. Figures 14(b) and (c) show that the maximum tensile forces of the
proposed model are about 40% to 50% higher than the test results. It might be due
to the termination of loading before the stirrups reach the predicted maximum
tensile force.
5. Conclusions
The test data from nine concrete beams reinforced with CFRP bars were used in
order to study the effect of end anchorage length and stirrup ratio on bond and
shear behavior. Based on the test results and numerical calculation, the behavior
of bond stress distributions along the end anchorage was analyzed. Consequently,
a tension force model of stirrups as a function of shear force, V, concrete shear
capacity, Vc, stirrup ratio, s, and number of stirrups along the shear span zone,
Ns. was proposed. Finally, the following conclusions are drawn:
Beams with higher stirrup ratio fail at higher shear forces and larger
deflections. The stiffness of the beams with higher stirrup ratio is slightly
higher than beams with lower stirrup ratio. In addition, the stirrup ratio
affects significantly the failure type of the beams.
End anchorage beyond the support has an important role in improving the
bond capacity of the beams. The beams with insufficient length of end
anchorage failed in bond-splitting failure mode due to premature bond loss at
the support zone indicated by the occurrence of bond splitting cracks
developing toward the support, while beams with sufficient end anchorage
length failed in flexure or shear mode depending on the number of stirrups.
The load carrying capacity of the concrete beams reinforced with CFRP bars
drops rapidly without showing ductile behavior after reaching the peak load
even though the beam failed in flexural mode.
The shear capacity of the concrete, Vc, required in ACI 440.1R-06
underestimates the values of concrete shear capacity, Vcexp., obtained from the
test and appears to be conservative for design application.
Bond strength calculated using Eq. (8) predicts bond capacity of the beams
with reasonable accuracy although this empirical equation was originally
generated from concrete section reinforced with steel bars,
Predicted bond stress distributions along the concrete rectangular prism using
numerical procedure shows a uniform distribution of bond stresses along
insufficient end anchorage with very high values. Meanwhile more
reasonable profiles of bond stress distributions along end anchorage are
shown in case of adequate end anchorage length.
The stirrups in the location of diagonal cracks show high tensile force with
the distance measured from the support almost equal to the effective depth.
The beams with lower stirrup ratio show higher tensile force on stirrups.
In case of beams with lower stirrup ratio, observed values of tensile forces lie
below the predicted value. While, in the case of beams with higher stirrup
786 Thamrin, R.
Journal of Engineering Science and Technology June 2016, Vol. 11(6)
ratio, the proposed model predicts the maximum tensile force with a good
level of accuracy.
References
1. Bresler, B. (1974). Reinforced concrete engineering, Vol. I, Materials,
structural elements, safety. John Wiley and Sons, New York.
2. Magnusson, J. (2000). Bond and anchorage of ribbed bars in high-strength
concrete. PhD Thesis. Division of Concrete Structures, Chalmers University
of Technology, Goteborg, Sweden.
3. Thamrin, R.; and Kaku, T. (2005). Development length evaluation of reinforced
concrete beam with CFRP bars. Proceedings of International Symposium on
Bond Behaviour of FRP in Structures, Hongkong, China, 393-399.
4. Mylrea, T.D. (1948). Bond and anchorage. ACI Journal, 44(3), 521-552.
5. Pay, A.C.; Canbay, E.; and Frosch, F.J. (2014). Bond strength of spliced fiber-
reinforced polymer reinforcement. ACI Structural Journal, 111(2), 257-266.
6. Azlina, N.; Ibrahim, A.; Thamrin, R.; and Hamid, H.A. (2013). Experimental
investigation on the shear behaviour of concrete beams reinforced with GFRP
reinforcement bars. Journal of Advanced Materials Research, 626, 559-563.
7. Azlina, N.; Thamrin, R.; and Ibrahim, A. (2013). Shear capacity of non-
metallic (FRP) reinforced concrete beams with stirrups. International Journal
of Engineering and Technology, 5(5), 593-598.
8. Azlina, N.; Thamrin, R.; Ibrahim, A.; and Hamid, H.A. (2014). Strain
distribution on reinforcement of concrete beams reinforced with glass fiber
reinforced polymer (GFRP) bars. International Journal of Key Engineering
Materials, 594-595, 812-817.
9. ACI 318M-08. (2008). Building code requirements for structural concrete
and commentary, American Concrete Institute.
10. ACI 440.1R-06. (2006). Guide for the design and construction of structural
concrete reinforced with FRP bars, American Concrete Institute.
11. Thamrin, R.; and Kaku, T. (2007). Bond behavior of CFRP bars in simply
supported reinforced concrete beam with hanging region. Journal of
Composites for Construction, ASCE, 11(2), 129-137.
12. Morita, S.; and Fujii, S. (1982), Bond capacity of deformed bars due to
splitting of surrounding concrete. Bond in Concrete, Applied Science
Publisher, 331-341.
13. Plizzari, G.A.; Deldossi, M.A.; and Massimo, S. (1998). Transverse
reinforcement effects on anchored deformed bars. Magazine of Concrete
Research, 50(2), 161-177.
14. Zsutty, T.C. (1968). Beam shear strength prediction by analysis of existing
data. ACI Journal, 65(11), 942–951.
15. Niwa, J.; Yamada, K.; Yokozawa, K.; and Okamura, H. (1987). Revaluation
of the equation for shear strength of reinforced concrete beams without web
reinforcement. Concrete Library International of JSCE, (9), 65-84.
16. British Standards Institution. (2014). Eurocode 2: Design of concrete
structures - Part 1-1: General rules and rules for buildings. BSI, London, UK.
Effect of End Anchorage Length and Stirrup Ratio on Bond and Shear . . . . 787
Journal of Engineering Science and Technology June 2016, Vol. 11(6)
17. Komiya, I.; Kaku, T.; and Kutsuna, H. (1999). Bond characteristic of FRP rods
No. 3. Proceedings of AIJ Annual Conference, Japan, 623–624 (in Japanese).
18. Okelo, R.; and Yuan, R. L. (2005). Bond strength of fibre reinforced polymer
rebars in normal strength concrete. Journal of Composites for Construction,
ASCE, 9(3), 203-213.
19. Cosenza, E.; Manfredi, G.; and Realfonzo, R. (1997). Behavior and
modelling of bond of FRP rebars to concrete. Journal of Composites for
Construction, ASCE, 1(2), 40-51.
20. CEB/FIP Model Code, (1990). - Final Draft. Information bulletin 204, Comite
Euro- International du Beton, Lausanne, Switzerland.
21. Munikrishna, A.; Hosny, A.; Rizkalla, S.; and Zia, P. (2011). Behavior of concrete
beams reinforced with ASTM A1035 grade 100 stirrups under shear. ACI
Structural Journal, 108(1), 34-41.