Embed Size (px)
Citation preview

Natural Resources, 2015, 6, 433-441 Published Online July 2015 in SciRes. http://www.scirp.org/journal/nr http://dx.doi.org/10.4236/nr.2015.67041
How to cite this paper: Elmoustafa, A.M., Farres, H.N. and ElFawy, M.M. (2015) Effect of Elevation Data Accuracy on Strom Drainage Schemes, Lagos, Nigeria. Natural Resources, 6, 433-441. http://dx.doi.org/10.4236/nr.2015.67041
Effect of Elevation Data Accuracy on Storm Drainage Schemes, Lagos, Nigeria Ashraf M. Elmoustafa, Hesham N. Farres, Mohamed M. ElFawy Irrigation and Hydraulics Department, Faculty of Engineering, Ain Shams University, Cairo, Egypt Email: [email protected] Received 25 April 2015; accepted 13 July 2015; published 16 July 2015
Copyright © 2015 by authors and Scientific Research Publishing Inc. This work is licensed under the Creative Commons Attribution International License (CC BY). http://creativecommons.org/licenses/by/4.0/
Abstract The check of elevation data is an essential step prior the start of any drainage study. An investiga-tion for this concept was done in Lagos, Nigeria using two types of survey sources; a Digital Eleva-tion Model (DEM) with a 15 m resolution produced from Russian Stereo Satellite images (RSS) and a LiDAR survey with a 5 m DEM resolution. A comparison between the RSS model survey and the LiDAR survey showed that LiDAR survey was more accurate than RSS survey and given high relia-bility. The study also showed that RSS survey could sometimes become misleading and could not assure reliability. A watershed modeling tool was used to analyze both surveys to produce the ex-pected drainage streams. It was found that some locations using RSS had a false drainage direction when compared with higher accurate LiDAR surveys.
Keywords Lagos, DEM, LiDAR, Drainage, RSS
1. Introduction Often planners and engineers are faced with various options and questions in storm drainage network design, e.g. flow pattern, direction, runoff quantity. In most instances planning without drainage in mind has caused failure or extensive damage to property including the storm water drains. With the advent of various modeling tools and Geographic Information Systems (GIS), this problem can be averted [1].
Digital Elevation Model (DEM), an important source of information for geomorphology, is usually used to express a topographic surface in three dimensional and to imitate essential natural geography. Jaurequi (1984) defines a Digital Elevation Model (DEM) as a statistical representation of continuous surface of the ground by a large number of selected points with known x, y, z co-ordinate fields [2]. The quality of a DEM is a measure of its accuracy on the pixel level (absolute accuracy) and how accurately is the morphology presented (relative ac-

A. M. Elmoustafa et al.
434
curacy). The modeling and forecasting of floods and their consequences require extensive spatial information of cat-
chments and flood risk areas. GIS and Remote Sensing (RS) offer valuable tools to contribute to the required data [3]. There are several factors that play an important role for quality of DEM-derived products such as ter-rain roughness; sampling density (elevation data collection method); grid resolution or pixel size; interpolation algorithm; vertical resolution; terrain analysis algorithm, etc.
There are also several methods for obtaining elevation data used to create DEMs such as LIDAR, stereo pho-togrammetry from aerial surveys, block adjustment from optical satellite imagery, topographic maps, etc.
A combination of a DEM, rainfall-runoff models and a GIS tool proves to be useful in estimating runoff on partly urbanized watersheds and in determining the size and orientation of storm drains. It is particularly useful for new areas where development is still under study.
2. The Study Area Lagos has historically been challenged by rapid urbanization and natural population growth. With its coastal lo-cation limiting expansion, the availability of land is a major issue. It is imperative to manage and utilize land and resources as efficiently as possible. Extensive reclamation works have been undertaken in several areas, includ-ing Victoria Island, Lekki Peninsula, Amuwo Odofin New Town, and Festac. Private developers have en-croached on areas zoned as a conservation belt in the Lagos Master Plan. The continued pressure on land has resulted in unmet demand for efficient basic urban infrastructure services, such as safe water, storm drainage and flood prevention, electricity, access roads, public transport, sanitation, and solid waste management [4].
To investigate the above mentioned schemes, a sample study area was selected in Lekki Zone on the Atlantic Ocean, Nigeria; Figure 1. The area is having almost a flat nature with maximum elevation difference of about 20 m between the highest and lowest points, this increases the impotency of accurate elevation survey to be used for the drainage studies. The topography of the 3.0 km2 study area basin is to be presented using remote sensed data (mainly elevation data) which should be evaluated prior using for storm drainage management studies. The basin was first delineated into sub-catchments. The land use, watershed and soil map of Lagos were then merged in a rainfall - runoff model using the Soil Conservation Services (SCS) Curve Numbers (CN) approach.
The study area is located at the south of Omu creek and a new creek is proposed at its south. The catchment was divided into 11 sub-catchments draining through main water streams, evolving from these sub-catchments, towards the proposed south creek. While some local areas are directly drained to the creek, Figure 2.
With the area being under development, the six main tributaries discharging into the proposed creek as natural streams have been aligned in order to respect the City Master Plan as much as possible. Figure 3 shows the alignment of the proposed systems contributing to the new proposed creek.
3. Elevation Data Pre-Processing 3.1. Shuttle Radar Topography Mission (90 m DEM) The Shuttle Radar Topography Mission (SRTM) from NASA started more than 10 years ago obtained elevation data on a near global scale to generate the most complete high resolution digital topographic database of the Earth. Data of approximate resolution of 90 m are available for the region. These were downloaded for Lagos State and surrounding regions. The SRTM Data along with the extracted DEM from ground survey are used in order to complete the general elevation data and obtain hydrological analysis for the whole area.
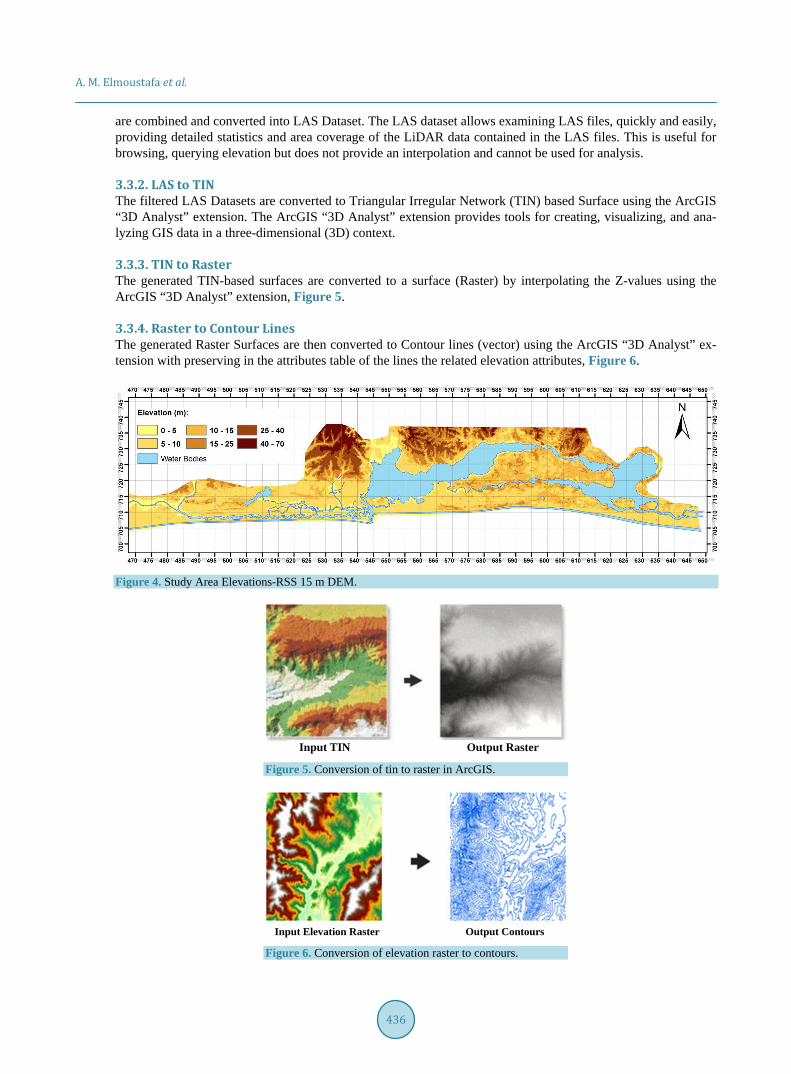
3.2. Russian Stereo Satellite (15 m DEM) A 15-meter DEM was generated from a Russian Stereo Satellite (RSS). The resolution of the satellite imagery is 5 m with an accuracy varying between 5 m to 15 m in elevation, and up to 5 - 10 m in northing and easting, Figure 4.
3.3. LiDAR LiDAR basics: Huge numbers of densely‐spaced discrete pulses of light (signals) are sent towards a surface from an aerial or, more recently, ground-based, platform. Sensors measure the return time (travel time over the speed of light = distance, or elevation) and other qualities, of all signals reflected back to the platform. The data

A. M. Elmoustafa et al.
435
Figure 1. Catchment of the selected sample study area.
Figure 2. Sub-catchments of the selected sample study area.
Figure 3. Proposed drainage scheme.
is delivered in LAS-format files. Millions of highly accurate data points can be produced in just a few city blocks [5] [6].
In order to emphasize the work procedures for the pre-processing phase and to determine the preferable out-put format, a pilot area was chosen to explain the work procedures included the following types of conversion.
3.3.1. DSM to SHP The Digital Surface Model (DSM) Binary files are loaded in ArcGIS as Event Layer and converted to point shape files holding the X, Y coordinates, Z-levels and Intensity attributes. LiDAR Laser files format (LAS) files
A. M. Elmoustafa et al.
436
are combined and converted into LAS Dataset. The LAS dataset allows examining LAS files, quickly and easily, providing detailed statistics and area coverage of the LiDAR data contained in the LAS files. This is useful for browsing, querying elevation but does not provide an interpolation and cannot be used for analysis.
3.3.2. LAS to TIN The filtered LAS Datasets are converted to Triangular Irregular Network (TIN) based Surface using the ArcGIS “3D Analyst” extension. The ArcGIS “3D Analyst” extension provides tools for creating, visualizing, and ana-lyzing GIS data in a three-dimensional (3D) context.
3.3.3. TIN to Raster The generated TIN-based surfaces are converted to a surface (Raster) by interpolating the Z-values using the ArcGIS “3D Analyst” extension, Figure 5.
3.3.4. Raster to Contour Lines The generated Raster Surfaces are then converted to Contour lines (vector) using the ArcGIS “3D Analyst” ex-tension with preserving in the attributes table of the lines the related elevation attributes, Figure 6.
Figure 4. Study Area Elevations-RSS 15 m DEM.
Input TIN Output Raster Figure 5. Conversion of tin to raster in ArcGIS.
Input Elevation Raster Output Contours Figure 6. Conversion of elevation raster to contours.
A. M. Elmoustafa et al.
437
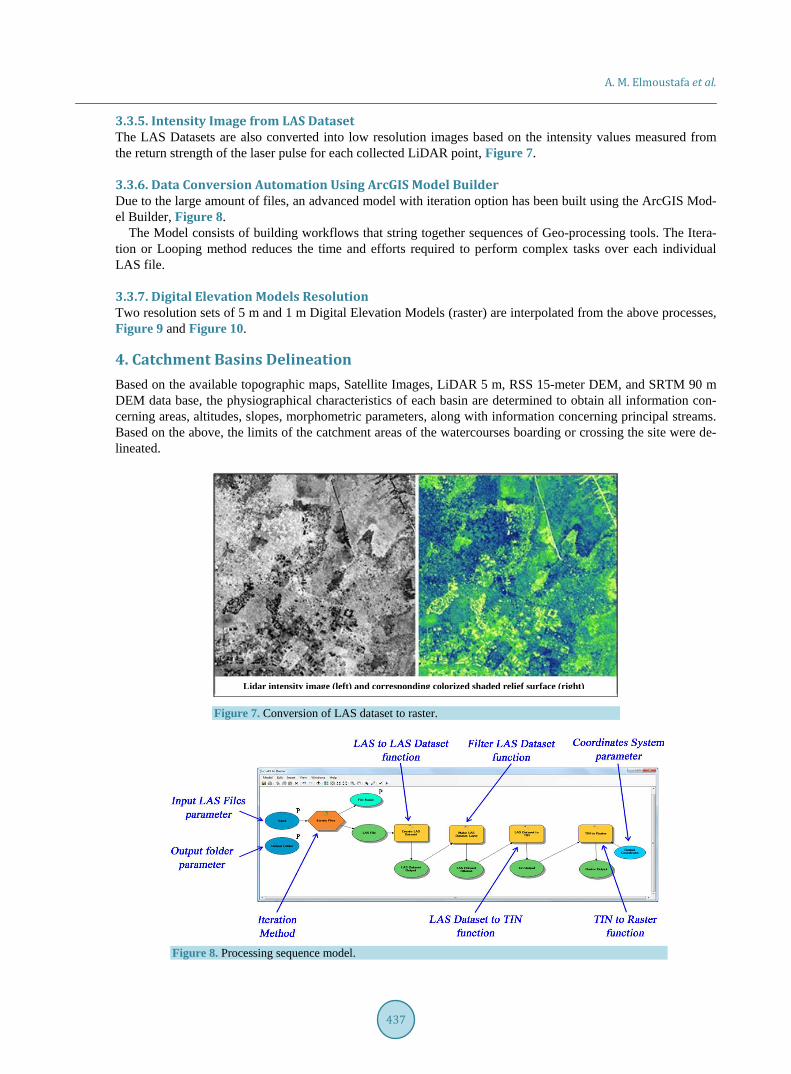
3.3.5. Intensity Image from LAS Dataset The LAS Datasets are also converted into low resolution images based on the intensity values measured from the return strength of the laser pulse for each collected LiDAR point, Figure 7.
3.3.6. Data Conversion Automation Using ArcGIS Model Builder Due to the large amount of files, an advanced model with iteration option has been built using the ArcGIS Mod-el Builder, Figure 8.
The Model consists of building workflows that string together sequences of Geo-processing tools. The Itera-tion or Looping method reduces the time and efforts required to perform complex tasks over each individual LAS file.
3.3.7. Digital Elevation Models Resolution Two resolution sets of 5 m and 1 m Digital Elevation Models (raster) are interpolated from the above processes, Figure 9 and Figure 10.
4. Catchment Basins Delineation Based on the available topographic maps, Satellite Images, LiDAR 5 m, RSS 15-meter DEM, and SRTM 90 m DEM data base, the physiographical characteristics of each basin are determined to obtain all information con-cerning areas, altitudes, slopes, morphometric parameters, along with information concerning principal streams. Based on the above, the limits of the catchment areas of the watercourses boarding or crossing the site were de-lineated.
Lidar intensity image (left) and corresponding colorized shaded relief surface (right)
Figure 7. Conversion of LAS dataset to raster.
Figure 8. Processing sequence model.

A. M. Elmoustafa et al.
438
Figure 9. DEM blocks for the resolution of 5 m.
Figure 10. DEM blocks for the resolution of 1 m.
Roads constitute barriers to natural surface runoff and modify the drainage pattern. Therefore, the Study Area
was subdivided into sub drainage areas according to their natural drainage ability following the natural topogra-phy and the road network scheme. As such, the proposed drainage system along roads is designed to drain storm flow into existing natural watercourses.
The direction of flow is based on the contours generated from LiDAR 5 m, RSS 15-meter DEM, and SRTM 90m DEM data base for catchments outside Lagos State.
5. Comparison of Different Surveys 5.1. Survey Elevations Figure 11 shows a close view on the initial survey elevations of Lekki zone with a Digital Elevation Model (DEM) of 15 m resolution. While another close view on the ground survey elevations of Lekki zone with a 5 m DEM resolution is shown in Figure 12. To easily distinguish any difference in the two figures, the same legend of elevations ranging between 0 m and 20 m was used. Comparing these two figures with each other, the fol-lowing can be noticed: • The initial survey has elevations mostly ranging from 8 m to 10 m while that of the ground one has eleva-
tions mostly ranging from 2 m to 4 m; • An average difference of around 6 m can be observed between both surveys; • Locations of low/high points are completely different between both surveys, as an example, Omu creek is
located in high points (16 - 18 m) in the initial survey while it located in low points (0 - 2 m) in the ground survey, this difference is due to the existence of forests and swamps in Omu creek location and has thus af-fected the accuracy of the previous survey.
5.2. Elevation Differences To present a data comparison between the initial and the ground survey, the elevation of the initial survey was subtracted from that of the ground survey data. Figure 13 shows the elevation difference between both surveys, the light color presents areas that have almost equal elevations, while the dark brown color presents areas of dif-ference in elevations ranging from 10 m to 20 m.

A. M. Elmoustafa et al.
439
Figure 11. Initial survey elevations of Lekki zone (15 m DEM).
Figure 12. Ground survey elevations of Lekki zone (5 m DEM).
Figure 13. Difference in elevations between the initial and ground survey.
The difference is obvious in Lekki and Badagry zones where dark brown color can be seen in many places.
Dark brown color can also be noticed in the north of Lagos where streams exist, thus affecting the definition of the natural streams and catchment boundaries.
6. Results Interpretations 6.1. Comparison of Different Surveys with Respect to Total Run-Off Scheme From the above analysis, it was found that there are differences in ground elevations and ground slope directions, ground survey was examined to seek its impact on the drainage scheme, and a sample study area on Lekki zone was selected to describe this impact.
A. M. Elmoustafa et al.
440
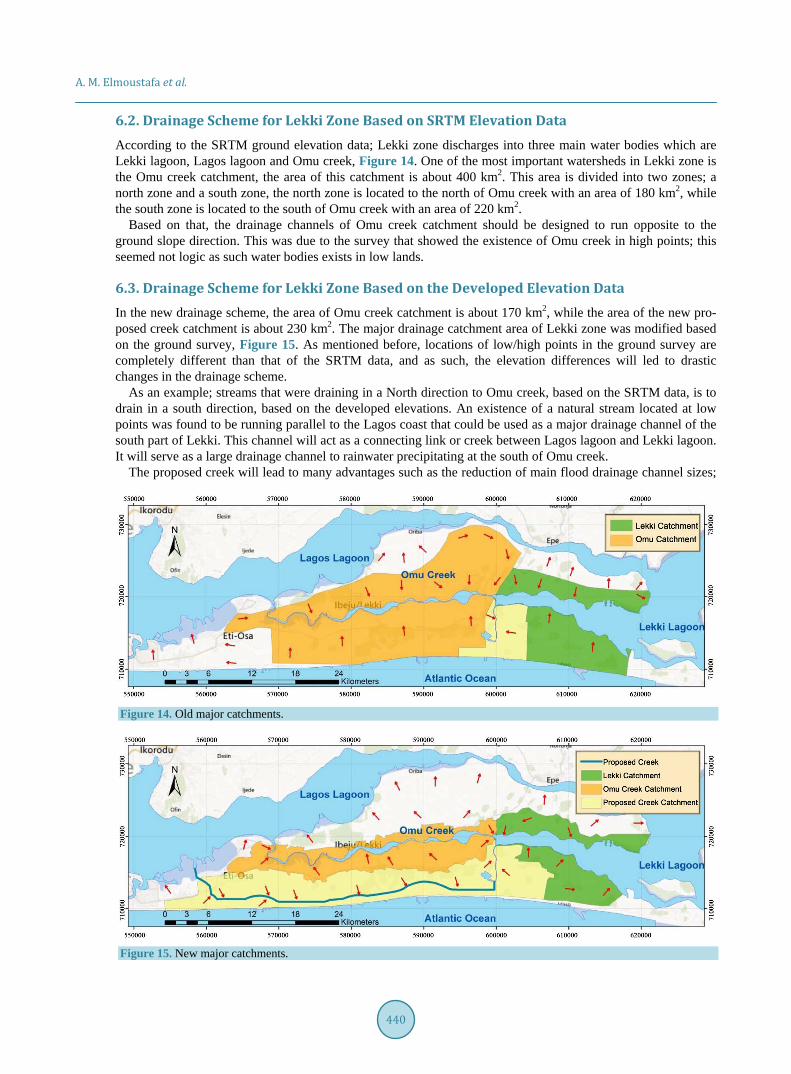
6.2. Drainage Scheme for Lekki Zone Based on SRTM Elevation Data According to the SRTM ground elevation data; Lekki zone discharges into three main water bodies which are Lekki lagoon, Lagos lagoon and Omu creek, Figure 14. One of the most important watersheds in Lekki zone is the Omu creek catchment, the area of this catchment is about 400 km2. This area is divided into two zones; a north zone and a south zone, the north zone is located to the north of Omu creek with an area of 180 km2, while the south zone is located to the south of Omu creek with an area of 220 km2.
Based on that, the drainage channels of Omu creek catchment should be designed to run opposite to the ground slope direction. This was due to the survey that showed the existence of Omu creek in high points; this seemed not logic as such water bodies exists in low lands.
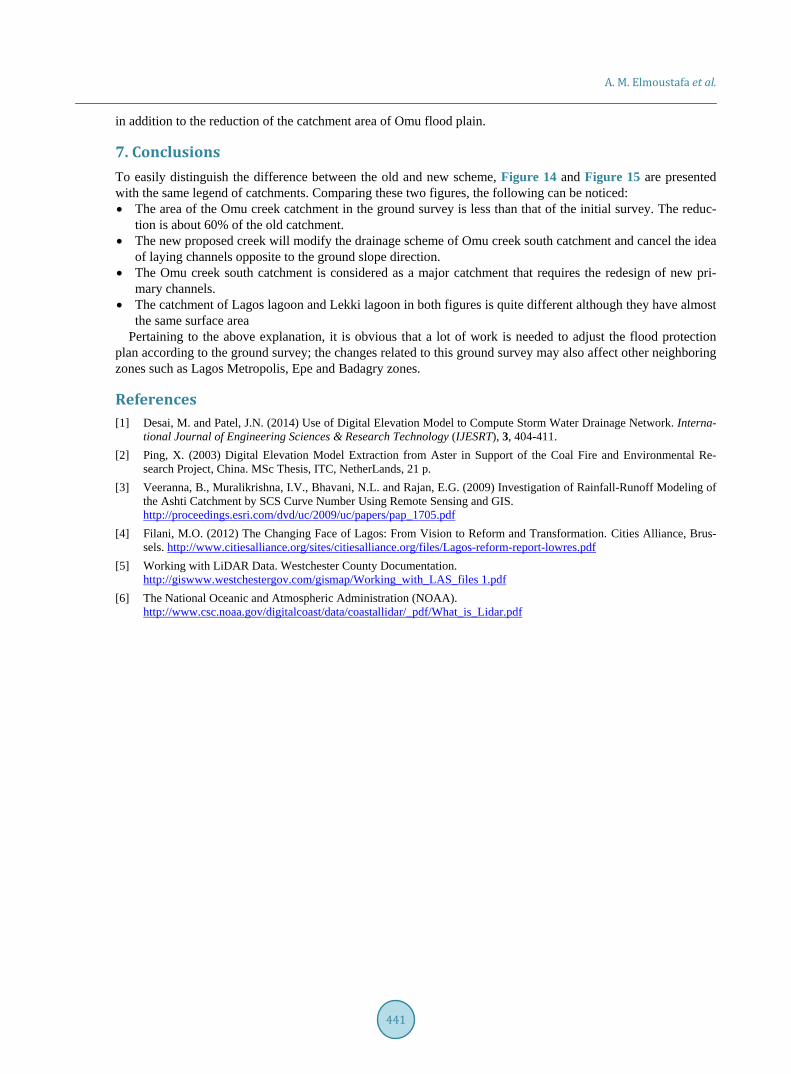
6.3. Drainage Scheme for Lekki Zone Based on the Developed Elevation Data In the new drainage scheme, the area of Omu creek catchment is about 170 km2, while the area of the new pro-posed creek catchment is about 230 km2. The major drainage catchment area of Lekki zone was modified based on the ground survey, Figure 15. As mentioned before, locations of low/high points in the ground survey are completely different than that of the SRTM data, and as such, the elevation differences will led to drastic changes in the drainage scheme.
As an example; streams that were draining in a North direction to Omu creek, based on the SRTM data, is to drain in a south direction, based on the developed elevations. An existence of a natural stream located at low points was found to be running parallel to the Lagos coast that could be used as a major drainage channel of the south part of Lekki. This channel will act as a connecting link or creek between Lagos lagoon and Lekki lagoon. It will serve as a large drainage channel to rainwater precipitating at the south of Omu creek.
The proposed creek will lead to many advantages such as the reduction of main flood drainage channel sizes;
Figure 14. Old major catchments.
Figure 15. New major catchments.
A. M. Elmoustafa et al.
441
in addition to the reduction of the catchment area of Omu flood plain.
7. Conclusions To easily distinguish the difference between the old and new scheme, Figure 14 and Figure 15 are presented with the same legend of catchments. Comparing these two figures, the following can be noticed: • The area of the Omu creek catchment in the ground survey is less than that of the initial survey. The reduc-
tion is about 60% of the old catchment. • The new proposed creek will modify the drainage scheme of Omu creek south catchment and cancel the idea
of laying channels opposite to the ground slope direction. • The Omu creek south catchment is considered as a major catchment that requires the redesign of new pri-
mary channels. • The catchment of Lagos lagoon and Lekki lagoon in both figures is quite different although they have almost
the same surface area Pertaining to the above explanation, it is obvious that a lot of work is needed to adjust the flood protection
plan according to the ground survey; the changes related to this ground survey may also affect other neighboring zones such as Lagos Metropolis, Epe and Badagry zones.
References [1] Desai, M. and Patel, J.N. (2014) Use of Digital Elevation Model to Compute Storm Water Drainage Network. Interna-
tional Journal of Engineering Sciences & Research Technology (IJESRT), 3, 404-411. [2] Ping, X. (2003) Digital Elevation Model Extraction from Aster in Support of the Coal Fire and Environmental Re-
search Project, China. MSc Thesis, ITC, NetherLands, 21 p. [3] Veeranna, B., Muralikrishna, I.V., Bhavani, N.L. and Rajan, E.G. (2009) Investigation of Rainfall-Runoff Modeling of
the Ashti Catchment by SCS Curve Number Using Remote Sensing and GIS. http://proceedings.esri.com/dvd/uc/2009/uc/papers/pap_1705.pdf
[4] Filani, M.O. (2012) The Changing Face of Lagos: From Vision to Reform and Transformation. Cities Alliance, Brus-sels. http://www.citiesalliance.org/sites/citiesalliance.org/files/Lagos-reform-report-lowres.pdf
[5] Working with LiDAR Data. Westchester County Documentation. http://giswww.westchestergov.com/gismap/Working_with_LAS_files 1.pdf
[6] The National Oceanic and Atmospheric Administration (NOAA). http://www.csc.noaa.gov/digitalcoast/data/coastallidar/_pdf/What_is_Lidar.pdf