Embed Size (px)
Citation preview

EFFECT OF DIFFERENT FLOURS ON QUALITY OF GLUTEN-FREE
WAFER SHEETS
A THESIS SUBMITTED TO
THE GRADUATE SCHOOL OF NATURAL AND APPLIED SCIENCES
OF
MIDDLE EAST TECHNICAL UNIVERSITY
BY
SELEN MERT
IN PARTIAL FULFILLMENT OF THE REQUIREMENTS
FOR
THE DEGREE OF MASTER OF SCIENCE
IN
FOOD ENGINEERING
AUGUST 2014

ii

Approval of the thesis:
EFFECT OF DIFFERENT FLOURS ON QUALITY OF GLUTEN-
FREE WAFER SHEETS
submitted by SELEN MERT in partial fulfillment of the requirements for the
degree of Master of Science in Food Engineering Department, Middle
East Technical University by,
Prof. Dr. Canan Özgen
Dean, Graduate School of Natural and Applied Sciences
Prof. Dr. Alev Bayındırlı
Head of Department, Food Engineering
Prof. Dr. Serpil Şahin
Supervisor, Food Engineering Dept., METU
Prof. Dr. Gülüm Şumnu
Co-Supervisor, Food Engineering Dept., METU
Examining Committee Members:
Asst. Prof. Dr. İlkay Şensoy
Food Engineering Dept., METU
Prof.Dr. Serpil Şahin
Food Engineering Dept., METU
Prof. Dr. Gülüm Şumnu
Food Engineering Dept., METU
Asst. Prof. Dr. Mecit Öztop
Food Engineering Dept., METU
Asst. Prof. Dr. Elif Turabi Yolaçaner
Food Engineering Dept., Hacettepe University
Date: 08.08.2014

iv
I hereby declare that all information in this document has been obtained
and presented in accordance with academic rules and ethical conduct. I
also declare that, as required by these rules and conduct, I have fully
cited and referenced all material and results that are not original to this
work.
Name, Last name: Selen MERT
Signature:

v
ABSTRACT
EFFECT OF DIFFERENT FLOURS ON QUALITY OF GLUTEN-
FREE WAFER SHEET
Mert, Selen
M.S., Department of Food Engineering
Supervisor: Prof. Dr. Serpil Şahin
Co-Supervisor: Prof. Dr. Gülüm Şumnu
August 2014, 85 pages
Lifelong gluten-free diet is essential for patients having celiac disease. Since
wheat flour contains gluten, it is necessary to replace wheat flour with other
types of gluten-free flours. Rice flour is commonly used in gluten-free baked
products as an alternative to wheat flour. The main objective of this study was
to develop gluten-free wafer sheet formulations by replacing rice flour
partially with different gluten-free flours at different ratios. Rice-corn flour
blends, rice-buckwheat flour blends and rice-chestnut flour blends with
different ratios (80:20, 60:40, 40:60) were used in the experiments in order to
find the higher quality and more nutritional gluten-free wafer sheet
formulations. As a control, wafer sheet samples containing only rice flour and
only wheat flour were used. Rheological properties of batters and color and
texture of wafer sheets were determined. In the rheological analyses, it was
observed that Power law model was suitable to explain the flow behavior of
all samples. Among these samples buckwheat flour containing sample (60:40
RF:BF) had the closest value of consistency and flow behavior index to wheat
flour containing sample. In texture analyses, samples containing only rice
flour and all the samples with corn flours had harder texture compared to the
other samples. In the color analyses of wafer sheets, the effects of natural
color of the flours were clearly observed. According to quality, the best

vi
formulation for gluten-free wafer sheets was obtained by flour blend
containing rice and buckwheat flour at a ratio of 60:40.
Keywords: Buckwheat flour, Chestnut flour, Corn flour, Gluten-free, Rice
flour, Wafer sheet.

vii
ÖZ
FARKLI UN ÇEŞİTLERİNİN GLÜTENSİZ GOFRET YAPRAĞI
KALİTESİNE ETKİSİ
Mert, Selen
Yüksek Lisans, Gıda Mühendisliği Bölümü
Tez Yöneticisi: Prof. Dr. Serpil Şahin
Ortak Tez Yöneticisi: Prof. Dr. Gülüm Şumnu
Ağustos 2014, 85 sayfa
Çölyak hastalarının hayat boyu glütensiz bir beslenme diyeti uygulamaları
gerekmektedir. Buğday unu glüten içerdiğinden dolayı farklı tür glütensiz
unlarla yer değiştirmelidir. Buğday ununa alternatif olarak pirinç unu
glütensiz ürünlerde yaygın olarak kullanılmaktadır. Bu çalışmanın ana amacı
sadece pirinç unu yerine pirinç unu ile birlikte farklı oranlarda, farklı
glütensiz un çeşitleri kullanarak glütensiz gofret yaprağı formülasyonları
geliştirmektir. Pirinç-mısır unu, pirinç-karabuğday unu, pirinç-kestane unu
karışımları farklı oranlarda karıştırılarak (80:20, 60:40, 40:60) daha yüksek
kalitede ve besin değeri yüksek glütensiz gofret yaprağı formülasyonları
oluşturmak için kullanılmıştır. Kontrol olarak sadece pirinç unu ve sadece
buğday unu ile oluşturulmuş glütensiz gofret yaprakları kullanılmıştır. Gofret
hamurunun reolojik özellikleri ve gofret yapraklarının rengi, yapısı ve duyusal
özelikleri incelenmiştir. Reolojik analizlerde tüm örneklerin Power yasasına
uyduğu bulunmuştur. Tüm örnekler arasında 60:40 oranında pirinç
unu:karabuğday unu içeren örneğin tutarlılık göstergesi ve akış davranışı
göstergesi değerleri bakımından buğday unu içeren örneğe en yakın olduğu
gözlemlenmiştir. Tekstür analizlerine göre, diğer örnekler ile
karşılaştırıldığında sadece pirinç unu içeren örnek ve pirinç-mısır unu karışımı
örneklerin daha sert bir yapıya sahip oldukları bulunmuştur. Renk analizinde
ise unların doğal renklerinin etkileri açıkça görülmüştür. Kalite açısından

viii
60:40 oranında pirinç ve karabuğday unu karışımının glütensiz gofret yaprağı
için en iyi formülasyon olduğu bulunmuştur.
Anahtar Kelimeler: Gofret yaprağı, Glütensiz, Kestane unu, Karabuğday unu,
Mısır unu, Pirinç unu.

ix
To My Beloved Family

x

xi
ACKNOWLEDGEMENT
I would like to thank my advisor Prof. Dr. Serpil Şahin for her continuous
support, guidance, and encouragement throughout this study. She always tried
to help me and it would be very hard to complete the research without her
support and knowledge. Also, I am grateful to my co-advisor Prof. Dr. Gülüm
Şumnu for her valuable advices throughout this study.
I would like to express my gratitude also to Assist. Prof. Mecit Öztop for his
support and knowledge. I would like to thank members of my thesis
committee, Prof. Dr. Gülüm Şumnu, Assist. Prof. İlkay Şensoy, Assist. Prof.
Mecit Öztop, and Assist. Prof. Elif Turabi Yolaçaner for valuable comments.
I would also like to thank ETİ for its laboratory support during my
experiments and their flexibility throughout the research.
I would like to extend my thanks to research assistants at our department,
Hande Baltacıoğlu, Hazal Turasan, Sevil Çıkrıkçı, Bade Tonyalı, Oğuz Kaan
Öztürk, Ayça Aydoğdu, and Emrah Kırtıl for their help and friendships.
My grateful thanks are extended to my best friends Sinem Nenni, Gizem
Erkan, Sema Aydın, Şeyda Hastaoğlu, Mehmet Ali Çömlek and Hülya Duyan
for their love, encouragement and patience in my stressful days. Also, I would
like to special thanks to İrem Akıncı for her friendship, and support.
I would like to express my sincere thanks to Derya Uğurlar, one of my best
friends, for her continuous support, encouragement, motivation, and warm
friendship in my stressful days. I feel myself very lucky to have a friend like
her. It would be hard for me to complete this study without her support.
Finally, my deepest gratitude goes to my family, my mother Sema Mert, my
father Ahmet Yaşar Mert and my brother Volkan Mert for their endless love,
support, encouragement and patience. Any word can exactly express my love
and appreciation to them. I dedicate this work to my beloved family.

xii

xiii
TABLE OF CONTENTS
ABSTRACT ..................................................................................................... v
ÖZ..................... .............................................................................................. vii
ACKNOWLEDGEMENT ............................................................................... xi
TABLE OF CONTENTS...............................................................................xiii
LIST OF TABLES .........................................................................................xv
LIST OF FIGURES .......................................................................................xvii
LIST OF ABBREVIATIONS ........................................................................xix
CHAPTERS
1. INTRODUCTION ........................................................................................ 1
1.1 Celiac Disease ............................................................................................ 1
1.2 Flour Types ................................................................................................. 4
1.2.1 Wheat Flour ......................................................................................... 4
1.2.2 Gluten-free Flour Types ...................................................................... 5
1.2.2.1 Rice Flour ..................................................................................... 5
1.2.2.2 Corn Flour .................................................................................... 6
1.2.2.3 Buckwheat Flour .......................................................................... 7
1.2.2.4 Chestnut Flour .............................................................................. 8
1.3 Gluten-free Product Development .............................................................. 9
1.4 Wafer ........................................................................................................ 12
1.4.1 Wafer Sheet Quality Parameters ................................................... 13
1.4.2 Ingredients Used in Wafer Sheet Production ................................ 13
1.4.2.1 Flour.........................................................................................15
1.4.2.2 Water........................................................................................15
1.4.2.3 Salt...........................................................................................16
1.4.2.4 Leavening Agent......................................................................16
1.4.2.5 Oil and Emulsifier....................................................................16
1.5 Objective of the Study .............................................................................. 16
2. MATERIALS AND METHOD ................................................................. 19
2.1 Materials ................................................................................................... 19

xiv
2.2 Methods.....................................................................................................19
2.2.1 Batter Preparation ................................................................................19
2.2.2 Baking ................................................................................................. 20
2.2.3 Rheological Analyses of Wafer Sheet Batter ..................................... 21
2.2.4 Analyses of Wafer Sheet .................................................................... 21
2.2.4.1 Weight loss....................................................................................21
2.2.4.2 Color..............................................................................................21
2.2.4.3 Texture Profile Analysis................................................................22
2.2.4.4 Sensory Analysis...........................................................................22
2.2.5 Statistical Analysis ............................................................................. 23
3. RESULTS AND DISCUSSION ................................................................. 25
3.1 Effects of Different Flour Types on Rheological Properties of Wafer
Batters...........................................................................................25
3.2 Effects of Different Flour Types on Weight Loss of Wafer Sheets ......... 30
3.3 Effects of Different Flour Types on Texture Properties of Wafer Sheets. 31
3.3.1 Hardness ............................................................................................ 31
3.3.2 Fracturability ..................................................................................... 33
3.4 Effects of Different Flour Types on Color of Wafer Sheets .................... 34
3.4.1 L* Parameter ...................................................................................... 34
3.4.2 a* Parameter ...................................................................................... 35
3.4.3 b* Parameter ...................................................................................... 38
3.4.4 Total Color Difference (∆E*) ............................................................ 39
3.5 Effects of Different Flour Types on Sensory Analysis of Wafer Sheets. 40
3.5.1 Color .................................................................................................. 41
3.5.2 Texture ............................................................................................... 41
3.5.3 Taste................................................................................................... 42
4. CONCLUSION AND RECOMMENDATIONS ....................................... 45
REFERENCES ............................................................................................... 47
APPENDICES
A. ANOVA & DUNCAN TEST TABLES .................................................... 55
B. PICTURE OF BAKING MACHINE.........................................................85
xv
LIST OF TABLES
TABLES
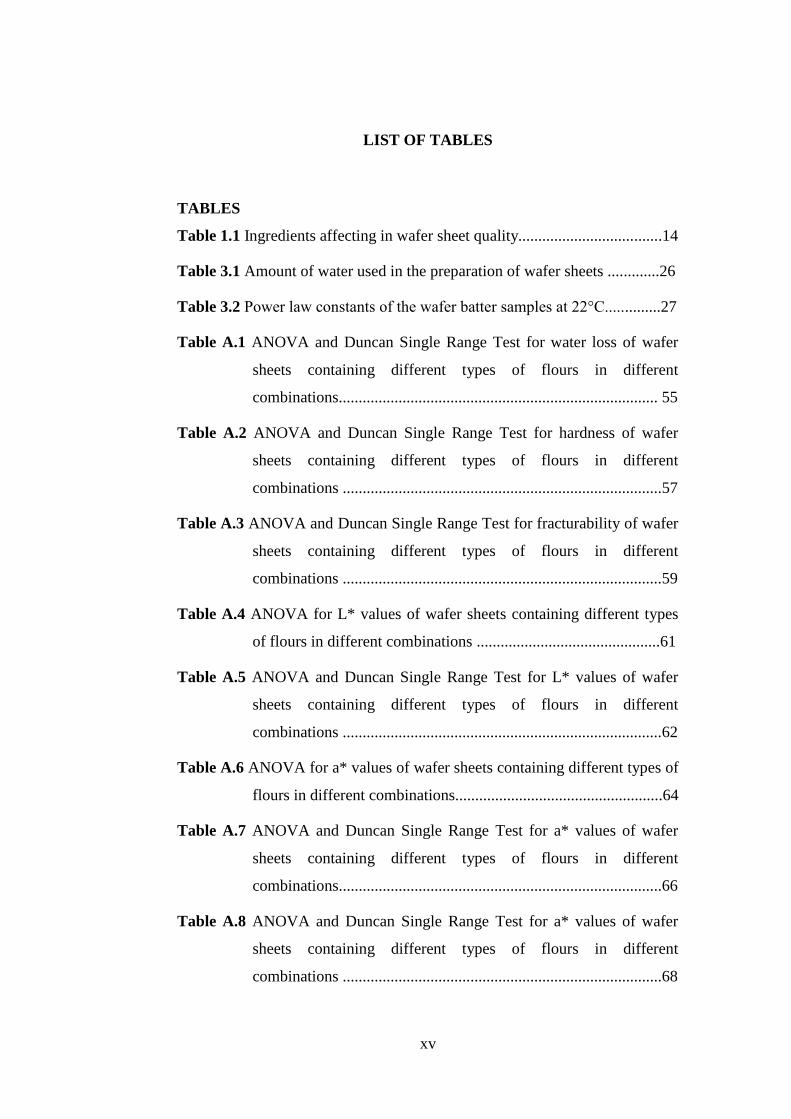
Table 1.1 Ingredients affecting in wafer sheet quality....................................14
Table 3.1 Amount of water used in the preparation of wafer sheets .............26
Table 3.2 Power law constants of the wafer batter samples at 22°C..............27
Table A.1 ANOVA and Duncan Single Range Test for water loss of wafer
sheets containing different types of flours in different
combinations................................................................................ 55
Table A.2 ANOVA and Duncan Single Range Test for hardness of wafer
sheets containing different types of flours in different
combinations ................................................................................57
Table A.3 ANOVA and Duncan Single Range Test for fracturability of wafer
sheets containing different types of flours in different
combinations ................................................................................59
Table A.4 ANOVA for L* values of wafer sheets containing different types
of flours in different combinations ..............................................61
Table A.5 ANOVA and Duncan Single Range Test for L* values of wafer
sheets containing different types of flours in different
combinations ................................................................................62
Table A.6 ANOVA for a* values of wafer sheets containing different types of
flours in different combinations....................................................64
Table A.7 ANOVA and Duncan Single Range Test for a* values of wafer
sheets containing different types of flours in different
combinations.................................................................................66
Table A.8 ANOVA and Duncan Single Range Test for a* values of wafer
sheets containing different types of flours in different
combinations ................................................................................68

xvi
Table A.9 ANOVA for b* values of wafer sheets containing different types of
flours in different combinations....................................................70
Table A.10 ANOVA and Duncan Single Range Test for b* values of wafer
sheets containing different types of flours in different
combinations.................................................................................72
Table A.11 ANOVA for total color difference values of wafer sheets
containing different types of flours in different combinations ....74
Table A.12 ANOVA and Duncan Single Range Test for total color difference
values of wafer sheets containing different types of flours in
different combinations................................................................. 76
Table A.13 ANOVA and Duncan Single Range Test for color acceptability
values of wafer sheets containing different types of flours in
different combinations..................................................................78
Table A.14 ANOVA and Duncan Single Range Test for texture acceptability
values of wafer sheets containing different types of flours in
different combinations .................................................................80
Table A.15 ANOVA and Duncan Single Range Test for taste acceptability
values of wafer sheets containing different types of flours in
different combinations..................................................................82

xvii
LIST OF FIGURES
FIGURES
Figure 3.1 Flow curves for wafer batter samples containing RF and BF at
different ratios and control flours ................................................................... 28
Figure 3.2 Flow curves for wafer batter samples containing RF and ChF in
combination and control flours........................................................................28
Figure 3.3 Flow curves for wafer batter samples containing different RF and
CF different ratios and control flours ............................................................. 29
Figure 3.4 Weight loss of wafer sheets prepared by replacement of rice flour
by different flour types at different ratios.…………….…….………….……31
Figure 3.5 Hardness of wafer sheets prepared using different flour types in
different ratios and combinations..…..………………………………………32
Figure 3.6 Fracturability of wafer sheets prepared using different flour types
in different ratios and combinations.…………………………..….…………34
Figure 3.7 L* values of wafer sheets (at both upper and lower surfaces)
containing different flour types in different ratios and
combinations..………......................................................................…………35
Figure 3.8 a* values of upper wafer sheets containing different flour types in
different ratios and combinations………………….………..………….……37
Figure 3.9 a* values of lower wafer sheets containing different flour types in
different ratios and combinations……….………………….……….…….…38
Figure 3.10 b* values of wafer sheets at both upper and lower surfaces
containing different flour types in different ratios and combinations.………39
Figure 3.11 ΔE* values of wafer sheets at both lower and upper surface
containing different flour types in different ratios and combinations.............40
Figure 3.12 Color acceptability scores of wafer sheets containing different
flour types at different ratios and combinations ............................................. 41
Figure 3.13 Texture acceptability scores of wafer sheets containing different
flour types in different ratios and combinations ............................................. 42

xviii
Figure 3.14 Taste acceptability scores of wafer sheets containing different
flour types in different ratios and combinations…................................……..43
Figure B.1 Baking machine…………………………………………...…….85
xix
LIST OF ABBREVIATIONS
BF Buckwheat flour
CF Corn flour
ChF Chestnut flour
RF Rice flour
WF Wheat flour

xx

1
CHAPTER 1
INTRODUCTION
1.1 Celiac Disease
Celiac disease, a disease caused by an immune disorder which is also known
as gluten sensitive enteropathy, occurs in people who have a genetic problem
with gluten when they eat it (Cureton and Fasano, 2009). Increasing numbers
of scientists in the medical field acknowledge the existence of this
autoimmune enteropathy that is the result of permanent gluten intolerance. As
a matter of fact, this disease can affect various systems and is caused by the
immune system responding to gluten when it is eaten by people who are
genetically prone to this disease (Niewinski, 2008).
In countries with relatively healthy people, normally 0.3-1% of the population
has celiac disease (Bai et al., 2007). In U.S., almost 1% of the population (1
out of 133 people) has celiac disease. Regrettably, only 17% of these 3
million Americans who are affected by this disease have been properly
diagnosed. Celiac disease is transferred through DNA from parents to their
children, making it a genetic disorder. The symptoms of the disease are
sometimes set off by intense emotional distress, surgery, pregnancy, infection,
or other highly stressful situations (http://www.celiaccentral.org/Celiac-
Disease/21/. Last visited: July, 2014).
The catalyst of celiac disease is the immune system's response to a protein
present in some grains (especially in wheat, rye, and barley) known as gluten.
If an individual has this disease and eats foods containing gluten, that person's
immune system will react violently to it by destroying some of the small
intestine's lining, particularly the villi, which are extremely small protrusions
that resemble fingers. Because these protrusions are essential for absorbing

2
nutrients to pass into the bloodstream, their loss ensures that the body will not
absorb the nutrients it needs, no matter how much the person eats
(http://www.cdd.com.au/pages/disease_info/coeliac_disease.html.Last visited:
July, 2014). The only known cure for celiac disease is the complete lifelong
gluten-free diet (Mendoza, 2005).
Of the permanent disorders, celiac disease is among the most frequently seen
in the world. This disease can cause many medical problems and symptoms
that were previously unrealized by medical professionals that can damage any
part of the body, such as the common malabsorption syndrome (including loss
of weight, chronic diarrhea, and abdominal distention). Because a large
number of people with this disease are not correctly diagnosed due to the fact
that celiac disease behaves differently from most other diseases, this disease
may remain unchecked and cause other long-term illnesses, for example
cancer, infertility or osteoporosis. There is a growing interest in the social
dimension of celiac disease, since the burden of illness related to this
condition is doubtless higher than previously thought. As a result of the
increasing awareness of symptoms and complications caused by celiac
disease, the level of interest in the social implications of this disease is
increasing. Many times the effects of celiac disease can be detected in
affected young children; however, the disease can wait to show itself until any
age, even in elderly people (Catassi and Fasano, 2008).
Because celiac disease can manifest itself in many different kinds of health
problems, it can be challenging to diagnose it correctly. A diagnosis can be
obtained through an antibody blood test which can be run in conjunction with
a genetic test. When results from these tests indicate celiac disease, usually an
intestinal biopsy is done to confirm the results
(http://www.celiaccentral.org/Celiac-Disease/21/. Last visited: July, 2014).
Celiac disease manifests itself in different ways in different people.
Symptoms can not only be seen in the digestive organs but also in other

3
organs. In the case of babies and young children, digestive symptoms such as
the followings are more prevalent:
• abdominal bloating and pain
• chronic diarrhea
• vomiting
• constipation
• pale, foul-smelling, or fatty stool
• weight loss
Also, children with this disease are often irritable. For a child, being able to
absorb necessary nutrients is essential for healthy growth and development.
Malnutrition can cause multiple health problems including sickly babies,
defective enamel on adult teeth, slow and stunted growth, and delayed
puberty.
In the case of adults, who tend to have fewer digestive symptoms, the
following symptoms are common:
• unusually low iron levels
• extreme tiredness
• pain in joints or bones
• osteoporosis or loss of bone
• arthritis
• seizures
• unusual prickling sensations in feet and hands
• anxiety or depression
• missed menstrual periods
• successive miscarriages or inability to conceive
• open sores in mouth
• dermatitis herpetiformis, a rash that causes itching
Although individuals having celiac disease may not show immediate signs of
it, serious problems can develop with time such as disease of the liver,
intestinal cancer, and effects of malnutrition resulting in a variety of problems

4
such as osteoporosis, anemia, and miscarriage
(http://digestive.niddk.nih.gov/ddiseases/pubs/celiac/ Last visited: July, 2014).
1.2 Flour Types
1.2.1 Wheat Flour
Approximately 10,000 years ago, when people started farming, people in the
Middle East began eating cereal grains (including wheat) in large quantities
(Figoni, 2008). Wheat is primarily important because people can grind wheat
kernels into flour, semolina, and other products. Since these wheat products
are used as the main ingredients of pasta and baked goods such as bread,
wheat provides most of the humans on the planet with most of their nutrients
(Šramková et al., 2009).
Varying with the kind of flour, with 68-76% (w/w) starch, 11-14% (w/w)
moisture, 6-18% (w/w) protein, 2-3% (w/w) gums, 1-1.5% (w/w) lipids and
about 0.5% (w/w) ash, wheat flour is a good source of complex
carbohydrates. Flour's ability to give structure is mostly due to the presence of
starch and gluten. When flour and water are combined, glutenin and gliadin,
proteins present in flour, create gluten. Although they have a minor role in
creating structure when compared with starch and gluten, pentosan gums are
also important. It seems that gums help with structure by either working
together with gluten or making their own structure (Figoni, 2008).
According to the texture of the wheat kernel, wheat flour may be considered
soft or hard. Soft wheat kernels disintegrate more easily than hard kernels,
which need more pressure. Soft wheat flour is less coarse than hard wheat
flour. The wheat species T. aestivum produces hard wheat kernels used mostly
in making bread if it contains the right amount of protein, which is 11-13%.
If the protein level in the flour from this species is low (7-9%), the flour is
softer and better for cakes and biscuits. Pancakes, crackers, waffles, wafers,
and cookies are also produced using soft wheat flour. These foods look and
taste better when they are produced with soft wheat flour instead of hard.

5
Although usually foods made with soft wheat flour are less dense than foods
made with hard wheat flour, the foods made with soft wheat are softer and
more tender when eaten, have better internal uniformity, and have better
height and spread properties. These characteristics are likely due to the result
of the low protein levels, low amount of water absorption, and the degree of
fineness in soft wheat flour (Hoseney et al., 1988).
1.2.2 Gluten-free Flour Types
To maintain a healthy diet, individuals with celiac disease must receive
nutrients from different flours. For this purpose, flours such as rice, corn,
chestnut, chickpea, soy, soybean and sorghum flour and pseudocereals such as
buckwheat and amaranth are used as alternatives.
1.2.2.1 Rice Flour
Rice (a cereal grain which comes from the species Oryza sativa) is the second
most important food in the world, the most important one being wheat. Rice
has low protein level, high starch level, and no gluten-forming proteins.
People usually eat rice as whole grains, but sometimes people rub off the
outer part containing many important nutrients and grind it into flour or grits.
They are very clean and white, and since they are low in oil have good storage
properties (Manley, 2000).
People are starting to use rice flour more often for baked goods because it is a
good substitute for wheat for those who cannot consume wheat. Both rice and
corn are accepted as gluten-free cereal grains; however, rice is the more
appropriate substitute in gluten-free products because it is white, bland, easily
digestible, and hypoallergenic (Rosell and Collar, 2007). Rice has other
properties that make it a top choice for gluten intolerant people including its
easily digestible carbohydrates and its low level of sodium, protein and
prolamins (Arendt et al., 2009).
Rice flour tastes quite bland. When used in place of wheat flour in biscuits,
rice flour does not allow for as much rising of the dough and makes the final
product softer. However, besides being used in Japanese rice crackers; rice

6
flour is usually not used for making biscuits. Sometimes people use rice flour
to make wafer batter thicker (Manley, 2000).
Even though there are many good properties that make rice flour suitable for
usage, the proteins in rice are not as suitable for food processing as compared
to proteins from other plants. Because rice proteins are hydrophobic, they do
not dissolve easily in water. They cannot give dough the elasticity it needs to
retain the carbon dioxide produced during proofing of yeast-leavened bread-
like products. Because rice flour has only a small amount of prolamins, these
cannot form a protein network like flour normally does when kneaded with
water. That is why the rice dough cannot keep the carbon dioxide from
escaping during proofing of the dough and the final product has lower specific
volume and harder and more dense than regular wheat bread (Rosell and
Collar, 2007).
Numerous products around the world such as cereals, breads, cakes, noodles
and crackers, are made using rice flour, sometimes blending rice flour with
chestnut, buckwheat, or other types of flours (Yeh, 2004).
1.2.2.2 Corn Flour
Cultivated around the world, corn (maize) production is about 8 million tons a
year. The biggest producers of corn include Indonesia, France, India,
Argentina, Brazil, China and the United States. Many different varieties of
corn are cultivated, including flint corn, flour corn, dent corn, popcorn,
amylomaize, waxy corn and sweet corn. Corn kernels may be purple, red, or
yellow. The kernels contain 82-93% endosperm, 10-11% germ, 5-6% pericarp
and 0.8-1.0% tip cap (Singh et al., 2011).
Enwere (1998) states that corn has the highest percentage of oil among cereal
grains except millet. Corn has also a high sulphur, sodium, chlorine,
potassium, calorie and carbohydrate content. Although corn's protein has a
low tryptophan and lysine content, it has a good amount of sulfur which
means it has such amino acids as cysteine and methionine (Adebayo and
Emmanuel, 2001).

7
Corn flour composed of the endosperm portion of the kernel and usually has a
starch content of 75-87% and a protein content of 6-8% (Shukla and Cheryan,
2001).
1.2.2.3 Buckwheat Flour
Grown in large quantities in North America, buckwheat is among the major
crops from East Asia, and products made from it, including buckwheat bread,
noodles, and pancakes, are widely consumed in Asia, Canada, the United
States and Central Europe. Because of its nutritional value, it is used to make
healthy foods and, buckwheat has been brought to the awareness of many
countries (Takahama et al., 2011).
Because proteins that form gluten are not present in buckwheat (Francischi et
al., 1994; Kreft and Kreft, 2000), Carroll and Hamilton (1975) have proposed
that buckwheat can be used for treating people with celiac disease. Therefore,
gluten-free foods can be made from buckwheat (Arendt et al., 2009).
The starch content of buckwheat flour, which varies according to the flour
type, is 70-91% (w/w). Amylose makes up 25% of the starch, while
amylopectin makes up the remaining 75%. When the buckwheat seeds and
flour are baked or boiled, part of the starch turns resistant to hydrolysis.
Because of this, buckwheat products may also be used for people with
diabetes. In addition, the protein level of buckwheat flour is 10-20% (w/w).
The protein found in buckwheat is rich in essential amino acids because it
contains globulin, prolamin, glutelin, and albumin (Takahama et al., 2011).
Buckwheat flour also contains a generous amount of sodium, iron, calcium,
magnesium and potassium, as well as a good amount of manganese, copper,
and zinc. Compared to wheat flour, it contains twice as much lithium,
manganese, sodium, magnesium, potassium, iron, copper and strontium, and
about the same amount of the elements chromium, cobalt and lead. Overall,
buckwheat contains more minerals than does wheat flour (Wei et al., 1995).

8
According to Steadman et al., (2001) there are many essential fatty acids and
amino acids contained in buckwheat and Watanabe (1998) reports that it also
contains vitamins B1 and B2. In addition, the anti-inflammatory flavanoid
rutin, which produces hypotensive effects and strengthens blood vessels
suffering from cerebral hemorrhage or other coronary diseases, is also present
in buckwheat. According to a study by Tomotake et al., (2000) hamsters that
ingested buckwheat protein experienced a decrease in cholesterol in their
gallbladders, livers, and serum and a decrease in gallstones due to the
different way cholesterol is metabolized. Another study by He et al., (1995),
showed that buckwheat has a similar effect on humans produced by the
presence of soluble fiber.
1.2.2.4 Chestnut Flour
The chestnut, a member of the Fagaceae family, ripens in fall and winter and
is usually eaten roasted or boiled. For extending its shelf life and
consumption, starch and flour that are made from chestnuts can be used.
These products are high in essential fatty acids and can be used in the
production of gluten-free food for people with celiac disease. Chestnut flour
can be used in a variety of baked goods as a partial substitute for corn, rice or
wheat flour (Moreira et al., 2010a).
Normally chestnut flour is ground from lower quality and smaller chestnuts
(Moreira et al., 2010b). The most common uses for chestnut flour is in
making creams, purees, flakes, pasta, cakes, snacks and biscuits (Sacchetti et
al., 2004). The chestnut flour has an average composition of 63.5±13.8% of
starch, 22.9±9.2% of sugars, 6.2±0.7% of protein, 3.8±1.6% of fiber and
3.6±1.7% of fat (Demiate et al., 2001; Sacchetti et al., 2004).
Chestnut flour is also rich in essential amino acids and sucrose. However,
dough made from chestnut flour is low in protein and does not have protein
that can make elastic dough like gluten does (Borges et al., 2007). To help
with the elasticity and produce a more desired form, there are some oils and

9
hydrocolloids that can be added to the dough (Moreira et al., 2011). Adding
these substances solves the problem of maintaining a gluten-free product
without compromising its consistency and quality (Bárcenas and Rosell,
2006).
The amount of nutrition in foods could be increased by using chestnut flour in
place of cereal flours. Even though using chestnut flour may result in less
protein, the proteins have unique nutritional value such as the high percentage
of albumin present in globulins, which are the primary storage proteins
(approximately 20%). In addition, there is good amount of B group vitamins
and vitamin E as well as a significant amount of dietary fiber present in
chestnut flour (Sacchetti et al., 2004). Chestnut flour not only improves the
nutritional value and healthiness of products, but also adds some different
value to the dough. For example, the thickening, stabilizing, texturing, and
emulsifying of the dough can be aided by the rich fiber content, and the flavor
and color of the food can be changed by the sugar present in the chestnut flour
(Demirkesen, 2013).
1.3 Gluten-free Product Development
Because celiac disease is a lifelong condition that makes the body sensitive to
rye, wheat and barley due to amino acids found in the prolamin fraction of the
grains; in order to remain healthy, affected individuals must strictly follow a
gluten-free diet, which means they cannot eat the proteins from the offending
grains. People on the gluten-free diet must be careful about what grains they
eat. Because they cannot eat anything with rye, wheat or barley in it, they
must eat only products produced with grains which are gluten-free such as
corn, rice, millet, sorghum, amaranth, quinoa, chestnut and buckwheat. The
majority of breads, baked goods and pasta products are made from wheat, and
a large percentage of breakfast cereals are made from grains containing
gluten. Therefore, substitutes without gluten must be consumed by individuals
who have celiac disease (Thompson, 2009).

10
The definition of gluten-free food, according to the codex standard is a food
that does not contain any kind of barley, oats, wheat (including all members
of the Triticum species, for example, kamut, spelt and durum wheat) or rye or
any of their cross breed varieties even if these have gone through a gluten-
removing process. Also, the gluten level in the product must be 20 mg/kg or
less (Codex Standard 118, 1979).
In recent years, gluten-free foods, especially breads, cakes and biscuits have
been commonly investigated by many researchers. Numerous studies have
been conducted especially on gluten-free bread.
Gallagher et al. (2003) were investigated the properties of crumbs and crusts
of gluten-free breads by using seven dairy powders. They found that powders
with high protein content result in breads with a lower volume but with an
increased crumb and crust hardness.
Examinations of the results of combining hydrocolloids with dough in the
absence of gluten, especially in bread quality and dough rheology, were
carried out by Lazaridou et al. (2007). According to their oscillatory and creep
measurements, the elasticity and resistance to deformation of gluten-free
dough formulations improved with hydrocolloids xanthan, CMC, pectin,
agarose and β-glucan in decreasing order.
Marco and Rosell (2008) studied gluten-free bread quality by adding
structuring agents, such as HPMC. They found that the use of HPMC
improved the volume of the bread which was closer to the wheat bread
structure when the soybean flour was used.
The rheological properties of gluten-free bread dough were examined by
Demirkesen et al. (2010a). Their measurements showed that in order to get
the desired physical properties in dough formulation, addition of emulsifiers
and gums were necessary. In another study of Demirkesen et al. (2013), the
effects of different tigernut flour/rice flour ratios on quality of gluten-free
bread formulations baked in infrared-microwave combination and

11
conventional ovens were investigated. They found that both tigernut/rice flour
ratio and oven type were significant factors in the quality parameters of
gluten-free breads.
Sensory, textural, and rheological characteristics of bread made from rice and
buckwheat flour were investigated by Torbica et al. (2010). According to this
study, gluten-free bread containing rice and buckwheat flour did not require
the addition of the hydrocolloids such as xanthan, guar gum and HPMC for
the development of dough structure.
There are also studies about other types of gluten-free products in addition to
bread. Rice cakes prepared with different kinds of gums and baked in
different ovens were examined by Turabi et al. (2010) to analyze their macro
and micro-structures quantitatively. They found that the usage of xanthan and
xanthan–guar gum blend resulted in more porous cakes. In addition to this,
compared to the cakes baked in infrared-microwave combination oven, there
were more deformed starches in conventionally baked ones. In the other study
of Turabi et al. (2008) rheological properties of rice cake batter and quality
characteristics of rice cakes prepared using different gums with or without an
emulsifier blend were investigated. They found that all gums except HPMC
increased the emulsion stability of cake batter. In addition to this, the highest
volume and porosity were obtained in cakes containing xanthan and
emulsifier blend. The effect of xanthan gum on the quality of cakes containing
no gluten was studied by Preichardt et al. (2011). According to their results
xanthan gum improved the quality of gluten-free cakes by making them softer
and retarding their staling.
Schober et al. (2003) evaluated the effects of fat powders and combinations of
gluten-free flour on quality of biscuits. They found that rice-corn-potato-soya
flour blend in ratio of 70:10:10:10 was most similar to wheat flour in terms of
water activity, moisture, texture, diameter, thickness and color for biscuits and
hardness and stickiness for biscuit dough. In addition to this flour blend also
showed the best overall acceptability in sensory testing.

12
1.4 Wafer
A particular type of thin, crispy biscuit known as wafer is made by spreading
flavored cream between wafer sheets. Some of the ingredients of these wafer
sheets are water, flour, and small amounts of oil, salt, and sugar, which are
combined to make a liquid batter (TSE, 1989).
It is thought that wafers were invented by monks who were accustomed to
using iron plates which usually bore religious symbols or the symbol of their
order to cook their holy bread. The dough was placed between these plates,
producing thin disc-like bread. The people of Holland are accredited with
creating the modern wafer in the mid-19th
century. They used special hinged
tongs to make the wafers. Following World War I, wafer ovens were
constructed. However, mass manufacturing of wafers did not begin until the
1950’s.
Special equipment is necessary to make this unique kind of biscuit called
wafer. The heated metal plates used in baking wafers resemble book leaves
with hinges at one side and often have patterns engraved in them. The wafer
sheets baked between them are usually thin and bear the patterns of the plates.
The wafers commonly found in markets that sell biscuits are typically made
by spreading caramel or cream between the large rigid flat wafer sheets and
then using wires or saws to cut the sheets into smaller pieces. The wafers may
be smothered in or molded with chocolate (Manley, 2000).
Producing wafers with a good shelf-life period is very important. Customers
tend to prefer brittle wafers, not leathery or soggy wafers. The shelf-life is
affected by several factors including the characteristics of the ingredients
(especially flour) and the method used in producing the wafer. Getting the
right consistency of wafer batter is quite complex. Even the temperature of the
water, the sequence of adding ingredients and the time and speed of mixing
have an important effect on the final product. After the batter is mixed, it is
poured onto a hot plate, and the top hot plate is placed over it. At this point,
13
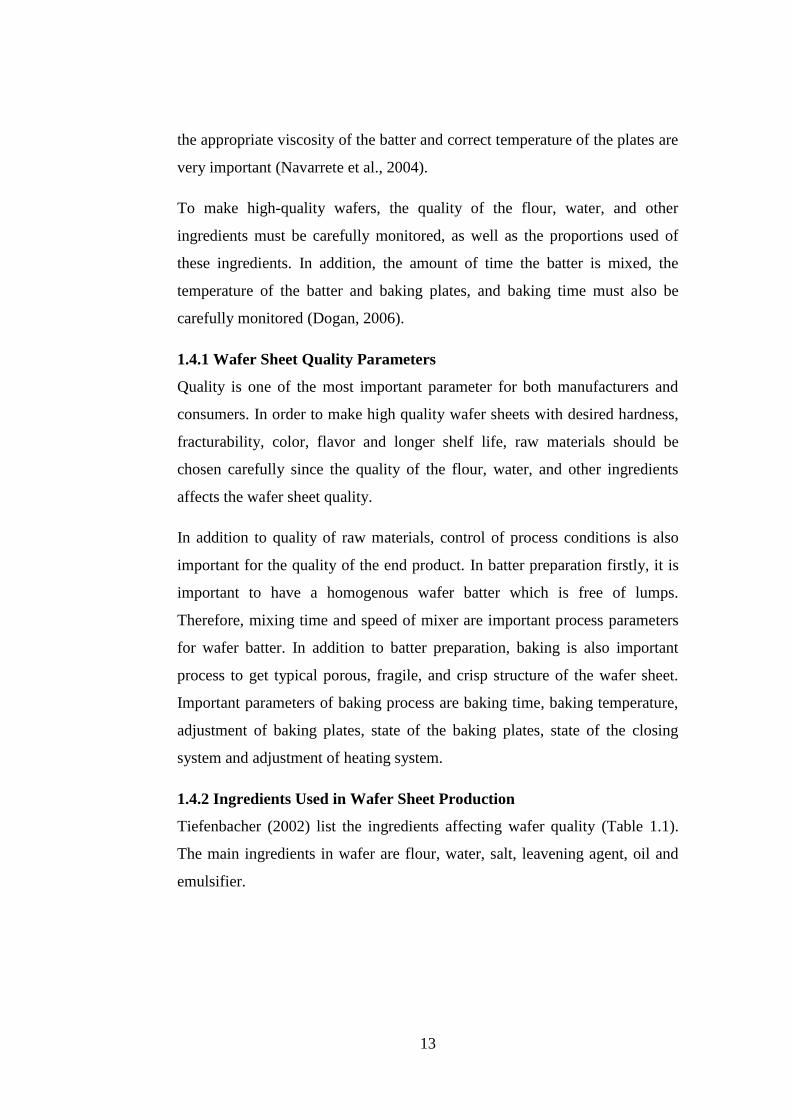
the appropriate viscosity of the batter and correct temperature of the plates are
very important (Navarrete et al., 2004).
To make high-quality wafers, the quality of the flour, water, and other
ingredients must be carefully monitored, as well as the proportions used of
these ingredients. In addition, the amount of time the batter is mixed, the
temperature of the batter and baking plates, and baking time must also be
carefully monitored (Dogan, 2006).
1.4.1 Wafer Sheet Quality Parameters
Quality is one of the most important parameter for both manufacturers and
consumers. In order to make high quality wafer sheets with desired hardness,
fracturability, color, flavor and longer shelf life, raw materials should be
chosen carefully since the quality of the flour, water, and other ingredients
affects the wafer sheet quality.
In addition to quality of raw materials, control of process conditions is also
important for the quality of the end product. In batter preparation firstly, it is
important to have a homogenous wafer batter which is free of lumps.
Therefore, mixing time and speed of mixer are important process parameters
for wafer batter. In addition to batter preparation, baking is also important
process to get typical porous, fragile, and crisp structure of the wafer sheet.
Important parameters of baking process are baking time, baking temperature,
adjustment of baking plates, state of the baking plates, state of the closing
system and adjustment of heating system.
1.4.2 Ingredients Used in Wafer Sheet Production
Tiefenbacher (2002) list the ingredients affecting wafer quality (Table 1.1).
The main ingredients in wafer are flour, water, salt, leavening agent, oil and
emulsifier.

14
Table 1.1 Ingredients affecting in wafer sheet quality, derived from
Tiefenbacher, 2002
Ingredient Specification Comments Influence on
wafer
Wheat flour Protein below
10%, moisture
below 14.5%
Low absorption
Use low shear
mixer not to
develop gluten
Provides bulk
and structure
Starch, native Potato, tapioca
preferable to
corn, wheat
Increases dry
matter
Reduces gluten
problems
Increased
stability, more
homogenous
structure
Water Potable,
Preferable below
60°F
Dissolve water
soluble
components,
disperse flour
Weight+stability
decrease; water
hardness
increases wafer
hardness slightly
Baking Soda Food grade
Sodium
bicarbonate
Improves spread
in baking mould
Less weight and
stability
More color
Sugar Sucrose,
Granular
Dissolve sugar
completely
Improves taste,
texture;
Increases wafer
color + residues
on baking moulds
Oil/Fat Coconut, palm
kernel; partially
hardened oils;
No di-,
polyunsaturates
Reduces
viscosity;
Add in liquid
form or powder
Improves release,
texture; if too
high: cloudiness,
incomplete
structure details
Lecithin Lecithin (liquid);
or carrier bound
powder, deoiled
powder
Reduces
viscosity; mix
with oil;
If powder add
before flour
Improves release,
texture; increases
residues on
baking plates,
color

15
1.4.2.1 Flour
Because the strength that gluten provides to flour is essential for producing
high quality wafers, it is important to choose the suitable flour. There should
be an optimum amount of gluten to make the wafer strong: too little will make
it weak and fragile but too much will make it flinty and hard. Producers of
wafer sheets prefer soft wheat flour ground for biscuits. However, a study
performed by Wade (1988) found that 22 different kinds of flour (among
them cake and bread flour) from both hard and soft wheat with protein levels
between 8.1% and 10.9% could be used to make good wafer sheets. Flour
typically used for bread with higher protein levels was reported to be not
useful for making good wafer sheets.
For good-quality wafer sheets, attention must also be given to the degree of
fineness of granulation. Finer flour produces a lighter, friable, soft sheet,
while course flour produces poor quality sheets (Dogan, 2006).
1.4.2.2 Water
Another important ingredient is water, which causes the batter to be pumpable
and aids in mixing of ingredients into the batter. There should be enough
water in the batter for mixing and for lowering the viscosity so that the batter
can spread by itself to cover the plates (Kobs, 2001).
The flour-to-water ratio must be carefully monitored to obtain a good sheet
texture. If there is too little water, the sheet does not turn out well, but rather it
is too heavy and thick and undercooked. Also, because the water evaporates
during the baking process, water also acts like leavening agent (Wade, 1988).
The amount of mineral content in the water affects the hardness and fragility
of the wafer. Hard water makes the wafers harder and more fragile. According
to Tiefenbacher (2002), water between the soft and medium levels is the best
for making wafers.

16
1.4.2.3 Salt
The importance of salt in baked goods is related to its ability to round out the
flavors and make the overall flavor better. Also, it has an effect on how the
dough is formed, particularly when yeast is involved, because it affects
fermentation and lean dough development. Salt is used in wafers for better
taste. Usually the salt concentration is between 0-0.75 parts for every 100
units of flour (Tiefenbacher, 2002).
1.4.2.4 Leavening Agent
The final pH of wafer is influenced by the presence of sodium bicarbonate,
which also affects how well the wafer turns color as it is baked. The best
wafers are produced when the pH level is between 6.8 and 7.4. If the wafers
will be used with chocolate, the pH level should be toward the higher end of
this range to produce the best overall flavor (Manley, 2000). The ideal ratio of
sodium bicarbonate to flour should be between 0.1-0.4 units per 100 units of
flour (Tiefenbacher, 2002).
1.4.2.5 Oil and Emulsifier
To satisfy the need for release agents, oil and an emulsifier (commonly
lecithin) are used. Fats keep wafers sticking on the plates. Some fats mix in
better than other fats, so generally liquid vegetable oils such as coconut oil,
cotton seed oil and sunflower seed oil are used (Manley, 2000). Lecithin,
which is combined with oil in wafer batter, changes the color of the food and
leaves more residues behind on baking plates (Tiefenbacher, 2002).
1.5 Objective of the Study
For celiac disease patients, it is important to consume gluten-free food
products that are suitable for their diet. For this purpose gluten-free foods
have commonly started to find place in the market shelves in recent years.
Although gluten-free foods such as breads, cakes or biscuits are investigated
by many researchers, there is no search about gluten-free wafers in the
literature. Therefore, main aim of this study was to determine a gluten-free

17
wafer sheet formulation by using different gluten-free flours at different ratios
and combination.
It is common to use mainly rice flour in gluten-free products. However, using
only rice flour results poor flavor and low nutritional value in gluten-free
products. Therefore, in order to improve the quality and nutritional values of
gluten-free foods, in this study, in addition to rice flour, corn flour, chestnut
flour, and buckwheat flour were chosen as gluten-free flours. These flours
have many advantages when used in the gluten-free foods since they can meet
nutritional requirements of celiac patients. Corn, buckwheat and chestnut
flours are rich in essential amino acids and minerals. Using different gluten-
free flours will also contribute to variety of celiac patients’ diets. It was aimed
to investigate rheological properties of batter having different formulations
and color, textural and sensory properties of wafer sheet since they are
important in acceptability of product.

18

19
CHAPTER 2
MATERIALS AND METHOD
2.1 Materials
For wafer sheet batter preparation, rice flour (Gamsan Gıda İmalat San. ve
Dış Tic. Ltd. Şti., Istanbul, Turkey) having 14% moisture, 6% protein
(N×5.95), 0.75% ash, wheat flour having 14.5% moisture, 7% protein, 0.55%
ash, water (Kalabak, Eskişehir, Turkey), salt, sodium bicarbonate, coconut oil
and lecithin were obtained from Eti Food Industry and Co. Inc. (Eskişehir,
Turkey). Corn flour (Bağdat Baharat, Ankara, Turkey) and Buckwheat flour
(Ekoloji Market, Istanbul, Turkey) were bought from local markets. Chestnut
flour was supplied by Kafkas Pasta Şekerleme San.&Tic. A.Ş. (Karacabey,
Bursa, Turkey).
2.2 Methods
2.2.1 Batter Preparation
Wafer sheet containing only rice flour was used as a control since it is
commonly used in gluten-free product development. Wheat flour wafer sheet
was also prepared to compare the quality of gluten-free formulations with that
of wheat containing one. In rice flour containing batter, 20,40,60% of rice
flour was replaced by corn, buckwheat or chestnut flours to obtain gluten-free
wafer sheets.
In all the formulations, the batters were composed of 100% flour or flour
blends, 0.5% salt, 0.4% sodium bicarbonate, 1% coconut oil and 0.5% lecithin
(on flour weight basis). The amount of water used in batter formulations were
adjusted depending on the viscosity of the batter since the time of flow of

20
batter is directly proportional to viscosity. In all samples the amount of water
added to provide the time of flow to be 21±1 sec was determined by flow cup
viscometer with 100 ml capacity (TQC, Capelle aan den Ijssel, The
Netherlands).
During preparation of the wafer sheet batter, firstly, water was added into a
laboratory type wafer mixer with a 5 L capacity (Hobart Corporation, Troy,
Ohio, USA). Salt and sodium bicarbonate were fully dispersed in water for
10s. Then, flour or flour blends were added to the mixture. Finally, blend of
coconut oil and lecithin were added and final mixture was mixed for 4 min
with mixer. The batter temperature was kept constant at 22±1°C throughout
the experiments.
2.2.2 Baking
Before baking, the batter was held at room temperature for 10 min to allow air
bubbles to rise to the top. This aeration process is important to prevent change
in batter density during production which affects final weight of the product.
Samples were baked using laboratory type wafer baking machine with
dimensions of 290mm*210mm*5mm (Franz HAAS, Vienna, Austria) (Figure
B.1). According to the study of Dogan (2006), baking temperature above
170°C increases fragility and gives a dark color. Therefore, the temperature of
the upper and lower plates was kept constant at 165°C. A 125±3 g portion of
the batter was poured on the center of the surface of the lower plate. Then, the
upper plate was closed and lid was locked. Depending on the final moisture
content of wafer sheet, which is in the range of 1-2%, baking time was
adjusted to range of 5-6 min for gluten free wafer sheets.
Moisture content of the wafer sheet was measured by moisture analyser
(Sartorius, Goettingen, Germany). In all measurements, 3 g of samples taken
from the center of the wafer sheets were used.

21
2.2.3 Rheological Analyses of Wafer Sheet Batter
The rheological measurements were conducted using Malvern rheometer
(Kinexus, Worcestershire, UK).All measurements were done at 22°C, using
cone and plate geometry (40 mm diameter and 4° cone angle).The batter
samples were placed between the plates and the edges were carefully trimmed
with a spatula. The flow experiments were conducted under steady-shear
conditions with shear rate ranging from 20 to 200 1/s. For the relaxation of the
residual stresses, the batter was rested at room temperature for 10 min before
testing. Throughout the experiments, shear rate versus shear stress and shear
rate versus apparent viscosity data were collected. All the rheological
experiments were performed twice and their average values were reported in
the study.
2.2.4 Analyses of Wafer Sheet
Weight loss, moisture content, color analysis, texture profile analysis and
sensory analysis were performed in wafer sheet.
2.2.4.1 Weight Loss
Weight of batter sample (Wbatter) and its weight after baking (Wsheet) were
measured. Then, the percentage weight loss (WL %) of the wafer sheet during
baking was calculated using Equation (2.1);
[
] (2.1)
where, W denotes weight (g).
2.2.4.2 Color
The color of the wafer sheet was measured by using Hunterlab
Spectrophotometer (Colorflex, Broomfield, Colorado, USA). Three
measurements were taken from different sections of upper and also lower
surface of wafer sheets.
In color measurement, CIE L*, a*, b* color scale was used where the L∗
value indicates lightness/darkness, the a∗ value represents the degree of

22
redness/greenness and the b∗ value represents the degree of
blueness/yellowness. Total color difference (ΔE*) was calculated from the
following equation (2.2);
[ - -
- ]
(2.2)
where, ∗ ,
∗ , ∗ represent the L*, a*, b* values of the wafer sheet
prepared using only rice flour.
(For upper surface, ∗
∗ , ∗ )
(For lower surface, ∗
∗ , ∗ )
2.2.4.3 Texture Profile Analysis
Texture of wafer sheet samples were measured by using a twin column frame
Texture Analyzer (Stable Micro Systems TA HD plus, Surrey, UK). Three
point bend probe was attached to the instrument set to; compression force
mode; trigger force 5.0 g; pre-test speed 1.0 mm/s; test speed 2.0 mm/s; post-
test speed 10.0 mm/s; and rupture distance 10 mm. Load cell of 30 N were
used. Samples having dimensions of 27 mm×36 mm in hardness and 53
mm×94 mm in fracturability were assembled horizontally on the base of the
equipment. Fracturability of the wafer sheets were quantified by measuring
force (g force) required to break them. Measurements were done in duplicate.
2.2.4.4 Sensory Analysis
Sensory analysis of wafer sheet was performed by hedonic ranking test by 10
semi-trained panellists (Resurreccion, 2008). 5-point ranking scale was used
in the tests. Ranking scale was defined from 1 to 5 which were Like extremely
(=5), Like moderately (=4), Neither like or dislike (=3), Dislike moderately
(=2), Dislike extremely (=1).
Sheets containing flour blends were evaluated in terms of acceptability. One
sample prepared with each kind of flour blends (80% rice+20% chestnut, 60%
rice+40% buckwheat, 40% rice+60% corn, 100% rice, 100% wheat) were
23
chosen according to quality parameters of wafer sheets, to compare their
acceptability with that of control sheets in terms of color, texture and taste.
2.2.5 Statistical Analysis
Analysis of variance (ANOVA) was performed to determine the significant
differences between the effects of flour types and percent replacement of rice
flour (p≤0.05). If significant difference was found, means were compared by
Duncan’s multiple comparison test (SAS 9.1 for Windows, NC, USA).

24

25
CHAPTER 3
RESULTS AND DISCUSSION
In this part, effects of different gluten-free wafer sheets formulations
containing only rice flour, rice-corn flour blends, rice-chestnut flour blends
and rice-buckwheat flour blends prepared by replacing 20%, 40% and 60% of
rice flour on rheological properties and quality parameters (weight loss,
hardness, fracturability, color and sensory properties) were investigated. For
comparison, wafer sheets having only rice flour and only wheat flour were
used.
Samples having 60% rice and 40% chestnut flours and 40% rice and 60%
chestnut flours could not be analyzed since they were stuck to the plates
during baking without reaching the desired moisture content. According to
Manley (2000) problem of sticking to one of the plates could be related to
amount of sugar and moisture content of the sheet and the surface condition of
the plates which result in failing to release of wafer sheet when the plates are
opened. High amount of sugar in chestnut flour is the main reason of wafers
sticking to the plates.
3.1 Effects of Different Flour Types on Rheological Properties of Wafer
Batters
The amount of water used in the experiments for obtaining the desired
viscosity can be seen in Table 3.1.
When the amount of water used in the only wheat flour (WF) and only rice
flour (RF) containing batter preparation were compared, it was observed that
sample with wheat flour required more water in order to get the desired
viscosity. It can be explained by the composition of flours. The ability of

26
gluten found in wheat flour to absorb water and hydrophobic characteristics of
protein in rice flour were the main reasons in the difference of the amount of
water (Table 3.1).
Partial replacement of rice flour by buckwheat flour (BF) or chestnut flour
(ChF) increased the required amount of water in preparation of batter due to
higher fiber content of these flours.
Table 3.1 Amount of water used in the preparation of wafer sheets
Flours (100 g) Water amount (g)
100% RF 110.0
100% WF 141.0
80%20% RF:ChF 135.0
80%:20% RF:CF 110.5
60%:40% RF:CF 112.5
40%:60% RF:CF 115.0
80%:20% RF:BF 130.0
60%:40% RF:BF 150.0
40%:60% RF:BF 179.5
Data of shear stress (τ) versus shear rate (γ) data were fitted well to the Power
Law model for all wafer batter formulations at 22ºC (Eq. (3.1)):
(3.1)
where τ is the shear stress (Pa), γ is the shear rate (s-1
), K is the consistency
index (Pa.sn) and n is flow behavior index.
Table 3.2 shows the Power Law parameters of wafer batter samples.
According to Table 3.2, flow behavior indexes ranging from 0.56 to 0.86
showed that all batter formulations showed shear thinning (pseudoplastic)
behavior. For the shear thinning materials, as the shear stress increases the

27
viscosity decreases because of the disturbance of interactions between the
components (Malkin and Isayev, 2006).
Table 3.2 Power law constants of the wafer batter samples at 22°C
Formulation K (Pa.sn) n R
2
80:20 RF:CF 4.11 0.71 0.999
60:40 RF:CF 4.33 0.67 0.996
40:60 RF:CF 8.03 0.50 0.920
80:20 RF:BF 2.03 0.86 0.999
60:40 RF:BF 2.75 0.74 0.999
40:60 RF:BF 2.77 0.56 0.997
80:20 RF:ChF 6.21 0.61 0.999
100 RF 3.21 0.74 0.999
100 WF 2.11 0.75 0.999
The flow curves of wafer batter samples containing different flours and flour
blends are given in Figure 3.1-3.3.
28
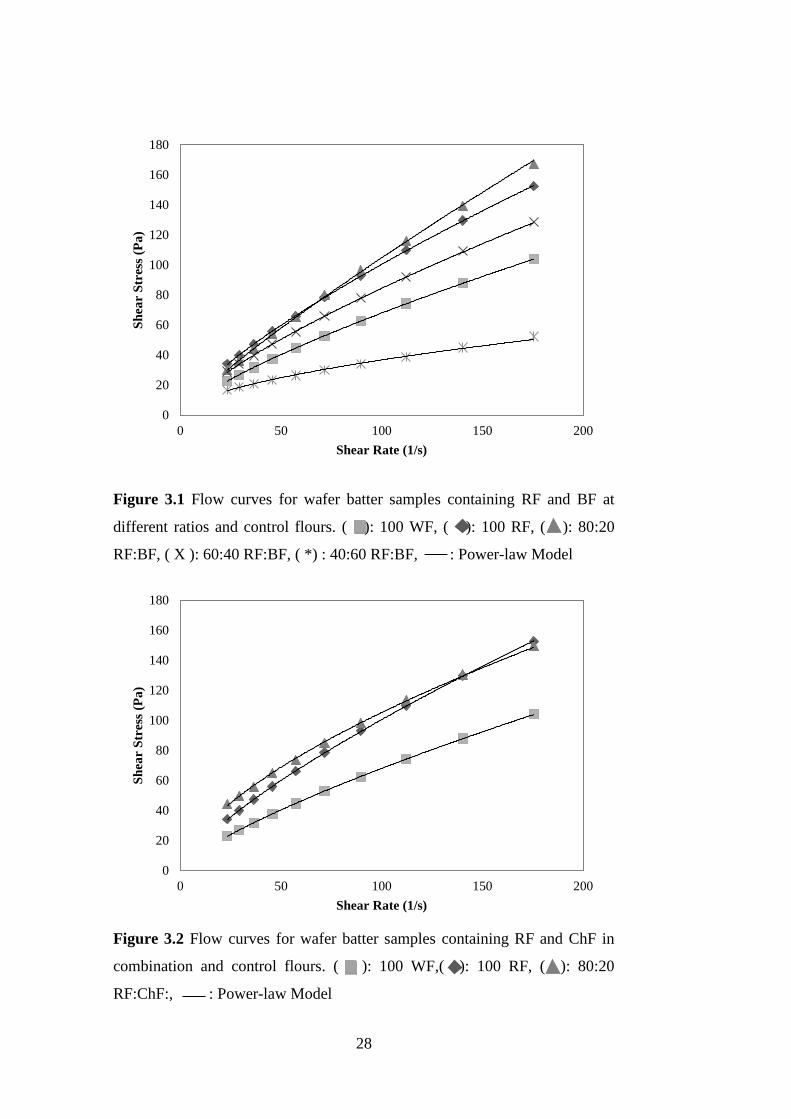
Figure 3.1 Flow curves for wafer batter samples containing RF and BF at
different ratios and control flours. ( ): 100 WF, ( ): 100 RF, ( ): 80:20
RF:BF, ( X ): 60:40 RF:BF, ( *) : 40:60 RF:BF, : Power-law Model
Figure 3.2 Flow curves for wafer batter samples containing RF and ChF in
combination and control flours. ( ): 100 WF,( ): 100 RF, ( ): 80:20
RF:ChF:, : Power-law Model
0
20
40
60
80
100
120
140
160
180
0 50 100 150 200
Sh
ear
Str
ess
(Pa
)
Shear Rate (1/s)
0
20
40
60
80
100
120
140
160
180
0 50 100 150 200
Sh
ear
Str
ess
(Pa
)
Shear Rate (1/s)

29
Figure 3.3 Flow curves for wafer batter samples containing RF and CF at
different ratios and control flours. ( ): 100 WF, ( ): 100 RF, ( ): 80:20
RF:CF, ( X ): 60:40 RF:CF, ( * ): 40:60 RF:CF, : Power-law Model
In general, higher consistency index values were obtained in wafer batter
samples containing corn or chestnut flour. However, batter containing only
wheat flour was the formulation having lower consistency index value.
Among different gluten-free batter formulations, the highest consistency
index and apparent viscosity values were obtained for sample containing
rice:corn blend at ratio of 40:60 (Table 3.2). It was observed that as the ratio
of rice flour increased in the rice-corn flour blends, the viscosity of batter
decreased. Rice flour apparently dilutes the strengthening influence of corn
flour, increasing the available free water in the batter system. This free water
could increase flow, and end up with a lower viscosity value (Mukprasirt et
al., 2000). It was also observed that chestnut containing sample had higher
consistency index compared to samples having buckwheat-rice flour blend,
only rice and only wheat flour (Table 3.2). The consistency index values of
batter containing rice and chestnut flours at a ratio of 80:20 was even higher
than that of rice and corn flour containing sample at a ratio of 80:20. High
fiber content of chestnut flour is one of the main reasons affecting rheological
0
20
40
60
80
100
120
140
160
180
0 50 100 150 200
Sh
ear
Str
ess
(Pa
)
Shear Rate (1/s)

30
parameters. Since the entanglement of fibers causes more resistance to flow, it
results in increase in the apparent viscosity values (Demirkesen et al., 2010b).
In addition, through the hydrogen bonding available hydroxyl groups in fiber
structure can bind more water. With this mechanism, the amount of available
water is reduced for the plasticizing effects (Nelson, 2001). Only rice flour,
buckwheat-rice flour blend and only wheat flour samples followed corn flour
samples, respectively in the decreasing order. The samples containing
buckwheat-rice flour blend and only wheat flour had very similar flow curves
with similar consistency index values. Among these samples buckwheat
sample (60:40 RF:BF) and the control samples (both rice and wheat flour
samples) had the closest values of consistency and flow behavior index.
3.2 Effects of Different Flour Types on Weight Loss of Wafer Sheets
The effects of partial replacement of rice flour by different gluten-free flours
on weight loss of wafer sheets are presented in Figure 3.4. It was found that
wafer formulations containing different flour blends with different ratios
showed different behavior. According to ANOVA results (Table A.1) wafer
sheets containing only rice flour and rice-corn flour blends in which rice flour
was higher in amount (sample numbers 1, 2 and 3) were not significantly
different. This may be due to the hydrophobic characteristics of rice proteins.
Since the final moisture content of wafer sheets were in the range of 1-2%,
weight loss of batters during baking was directly correlated with the amount
of water added in preparation of batter (Table 3.1 and Figure 3.4). The
ANOVA results showing the difference between weight loss of different types
of batters can also be applicable to discuss the difference between amount of
water added for obtaining the desired viscosity. Among different types of
flour blends only weight loss of rice-corn flour blend at a ratio of 40:60 and
rice-buckwheat flour blend at a ratio of 80:20 were not significantly different.
All the other flour blends showed significantly different weight loss behavior.
The weight loss result of wafer sheet sample with rice-buckwheat flour blend
at a ratio of 40:60 was the closest one to the sample with wheat flour.

31
The release of moisture during baking depends on the overall compositions.
Therefore, it was expected to observe different behavior in weight loss during
baking of wafer sheets having different formulations.
Figure 3.4 Weight loss of wafer sheets prepared by replacement of rice flour
by different flour types at different ratios. 1. RF; 2. RF:CF 80:20; 3. RF:CF
60:40; 4. RF:CF 40:60; 5. RF:BF 80:20; 6. RF:BF 60:40; 7. RF:BF 40:60; 8.
RF:ChF 80:20; 9. WF. *Bars with different letters are significantly different.
3.3 Effects of Different Flour Types on Texture Properties of Wafer
Sheets
3.3.1 Hardness
The effect of replacement of rice flour by different flours at different ratios on
hardness of the wafer sheet samples were presented in Figure 3.5. According
to this figure, wafer samples prepared by the combination of corn and rice
flours had the highest hardness value. The hardness of these samples was not
statistically different from each other. Samples containing chestnut,
buckwheat and/or wheat flour had statistically lower hardness values than the
other group (samples containing rice and corn). This might be due to the
0
10
20
30
40
50
60
70
80
1 2 3 4 5 6 7 8 9
Wei
gh
t L
oss
(%
)
Flour Type
b c
a
d e e f f f*

32
higher fiber content of chestnut and buckwheat flours and gluten content of
wheat flour which cause higher water binding capacity.
Besides this, in the study of Yıldız (2010) it was found that the amount of
water in the batter was important in affecting the final hardness of the
product. It was indicated that the less amount of water used in the batter
leading the harder final product. This agreed with the result of the
experiments. The hardness of the samples which had higher amount of water
in the batters such as samples containing chestnut, buckwheat and wheat
flour, were significantly lower than the samples containing rice and corn
(Table 3.1).
Figure 3.5 Hardness of wafer sheets prepared using different flour types at
different ratios and combinations: 1. RF; 2. RF:CF 80:20; 3. RF:CF 60:40; 4.
RF:CF 40:60; 5. RF:BF 80:20; 6. RF:BF 60:40; 7. RF:BF 40:60; 8. RF:ChF
80:20; 9. WF. Bars indicate standard error of the replicates. *Bars with
different letters are significantly different.
When the results of rheological analyses and texture analyses were compared,
it was observed that for samples with low consistency values for instance
0
500
1000
1500
2000
2500
3000
3500
4000
4500
5000
1 2 3 4 5 6 7 8 9
Ha
rdn
ess
(g f
orc
e)
Flour Type
b
b
b
b
a a a
a a*

33
100% wheat flour sample and sample containing rice and buckwheat flour
blend (RF:BF-60:40) had also low hardness values. Samples having higher
hardness values which were prepared using only rice flour or rice and corn
flour combination had also higher consistency index.
3.3.2 Fracturability
The effects of different flours on fracturability of wafer sheets are presented at
Figure 3.6. According to this figure, samples containing corn flour
significantly had higher fracturability values than the other samples. It was
also observed that samples containing buckwheat flour were not significantly
different than the wheat flour containing sample.
High values of fracturability of wafer sheet are not desirable in the
production. The higher values of fracturability values end up with more
problems in the cutting stage of the wafer sheets. According to these, samples
containing corn flour is not suitable for wafer sheet production with its high
fracturability value.

34
Figure 3.6 Fracturability of wafer sheets prepared using different flour types
at different ratios and combinations: 1. RF; 2. RF:CF 80:20; 3. RF:CF 60:40;
4. RF:CF 40:60; 5. RF:BF 80:20; 6. RF:BF 60:40; 7. RF:BF 40:60; 8.
RF:ChF 80:20; 9. WF. *Bars with different letters are significantly different.
3.4 Effects of Different Flour Types on Color of Wafer Sheets
In this study, the color of wafer sheets containing different flour blends were
investigated by using L*, a* and b*. Then, total color of samples was
calculated by using Equation (2.2).
3.4.1 L* Parameter
In determination of color, L* value indicates lightness/darkness of the
samples. According to ANOVA Table A.4, it was found that there was no
significant difference between L* values of upper and lower surface of wafer
sheets (p>0.05). Therefore, average L* values were calculated by considering
the data obtained for both upper and lower surfaces of wafer sheets in
comparison of the effect of different flour types on color of wafer sheets.
According to ANOVA Table A.5, it was found that L* values of wafer sheets
0
200
400
600
800
1000
1200
1400
1 2 3 4 5 6 7 8 9
Fra
ctu
rab
ilit
y (
g f
orc
e)
Flour Type
cd
e
cde
bc
cde
ab ab
a
de*

35
containing only rice flour and only wheat flour were significantly higher than
the others (p≤0.05). This was related to their lighter appearance. As shown in
the Figure 3.7, the values of L* in the case of all ratios of buckwheat flour
blends and nearly all ratios of corn flour blends (expect 80% rice +20% corn)
were not significantly different. Among all type of flour blends, wafer sheet
containing chestnut-rice flour blend had significantly darker appearance,
which may be due to higher sugar content of chestnut flour resulting in
browning.
Figure 3.7 L* values of wafer sheets (at both upper and lower surfaces)
containing different flour types at different ratios and combinations: 1. RF; 2.
RF:CF 80:20; 3. RF:CF 60:40; 4. RF:CF 40:60; 5. RF:BF 80:20; 6. RF:BF
60:40; 7. RF:BF 40:60; 8. RF:ChF 80:20; 9. WF. *Bars with different letters
are significantly different.
3.4.2 a* Parameter
In determination of color, a* value indicates redness/greenness of the
samples. According to ANOVA Table A.6, there was a significant difference
between upper and lower surfaces of the wafer sheet samples (p≤ 0.05). It was
0
10
20
30
40
50
60
70
80
1 2 3 4 5 6 7 8 9
L*
Flour Type
a
d
c c c c c b
a*

36
found that the lower surface of all samples had higher a* values than upper
surface. This may be because of the contact time of batter with the hot
surface. Wafer batter was firstly poured to lower surface of the wafer sheet
machine; the baking process of lower surface of wafer sheet had already
started till lid was closed. Since there was a difference between a* values of
upper and lower surfaces, two separate statistical analysis were made for a*
values. According to ANOVA Table A.7 and A.8, in both lower and upper
surfaces of wafer sheet samples containing rice-chestnut flour blend had
higher values of a*. This may be because of the high sugar content of the
chestnut flour which leads to browning of wafer sheets through Maillard and
caramelization reactions during the baking process (Sacchetti et al., 2004;
Gómez et al., 2008). As shown in Figure 3.8 and 3.9, after rice-chestnut flour
blend, in both upper and lower surfaces of wafer sheets, the highest a* values
were observed in samples containing rice and corn flour blends. Increasing
the amount of corn flour in the formulation increased a* value. This may be
due to the natural color of corn flour affecting the baked products. It was also
found that the control wafer sheets containing only rice flour and wheat flour
had the lowest a* values.

37
Figure 3.8 a* values of upper surface of wafer sheets containing different
flour types at different ratios and combinations: 1. RF; 2. RF:CF 80:20; 3.
RF:CF 60:40; 4. RF:CF 40:60; 5. RF:BF 80:20; 6. RF:BF 60:40; 7. RF:BF
40:60; 8. RF:ChF 80:20; 9. WF. *Bars with different letters are significantly
different.
-2
0
2
4
6
8
10
1 2 3 4 5 6 7 8 9
a*
(u
pp
er s
urf
ace
)
Flour Type
f*
d
c
b
d d
d
a
e

38
Figure 3.9 a* values of lower surface of wafer sheets containing different
flour types at different ratios and combinations: 1. RF; 2. RF:CF 80:20; 3.
RF:CF 60:40; 4. RF:CF 40:60; 5. RF:BF 80:20; 6. RF:BF 60:40; 7. RF:BF
40:60; 8. RF:ChF 80:20; 9. WF. *Bars with different letters are significantly
different.
3.4.3 b* Parameter
In determination of color, b* value indicates blueness/yellowness of the
samples. According to ANOVA Table A.9, it was found that there was no
significant difference between b* values of upper and lower surface of wafer
sheets (p>0.05). Therefore, b* values of both upper and lower surfaces were
used in comparison. As shown in the Figure 3.10 wafer sheets containing rice-
corn sheets had the highest value of b* due to corn flour’s natural color. In
addition, samples containing rice-chestnut flour blends had also high values of
b* due to yellow color of chestnut flour as in the case of corn flour.
According to ANOVA Table A.10, there were significant differences between
the samples containing different flour blends (p≤0.05). As shown in the
Figure 3.10, samples having buckwheat, rice and wheat flours had lower b*
values as compared to the other flour blends.
-2
0
2
4
6
8
10
12
14
16
1 2 3 4 5 6 7 8 9
a*
(lo
wer
su
rfa
ce)
Flour Type
d
a
d d
d
b
c
d
e*
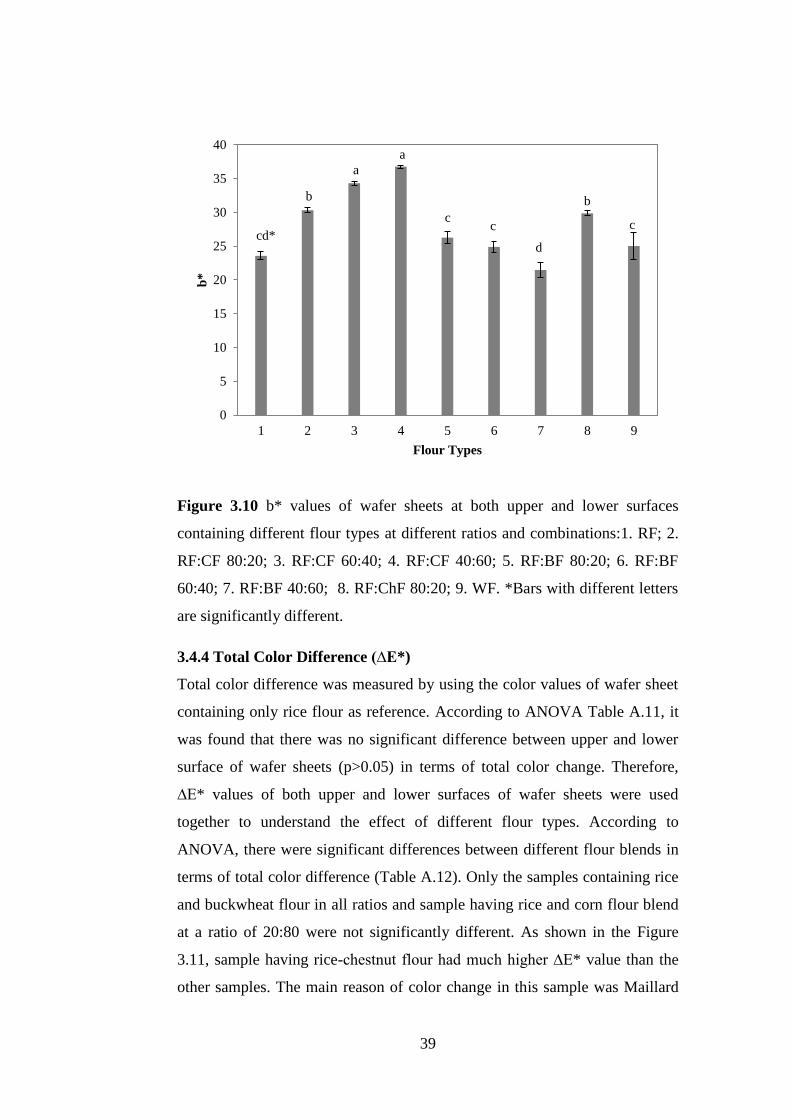
39
Figure 3.10 b* values of wafer sheets at both upper and lower surfaces
containing different flour types at different ratios and combinations:1. RF; 2.
RF:CF 80:20; 3. RF:CF 60:40; 4. RF:CF 40:60; 5. RF:BF 80:20; 6. RF:BF
60:40; 7. RF:BF 40:60; 8. RF:ChF 80:20; 9. WF. *Bars with different letters
are significantly different.
3.4.4 Total Color Difference (∆E*)
Total color difference was measured by using the color values of wafer sheet
containing only rice flour as reference. According to ANOVA Table A.11, it
was found that there was no significant difference between upper and lower
surface of wafer sheets (p>0.05) in terms of total color change. Therefore,
∆E* values of both upper and lower surfaces of wafer sheets were used
together to understand the effect of different flour types. According to
ANOVA, there were significant differences between different flour blends in
terms of total color difference (Table A.12). Only the samples containing rice
and buckwheat flour in all ratios and sample having rice and corn flour blend
at a ratio of 20:80 were not significantly different. As shown in the Figure
3.11, sample having rice-chestnut flour had much higher ∆E* value than the
other samples. The main reason of color change in this sample was Maillard
0
5
10
15
20
25
30
35
40
1 2 3 4 5 6 7 8 9
b*
Flour Types
c
b
d
c c
a
a
b
cd*
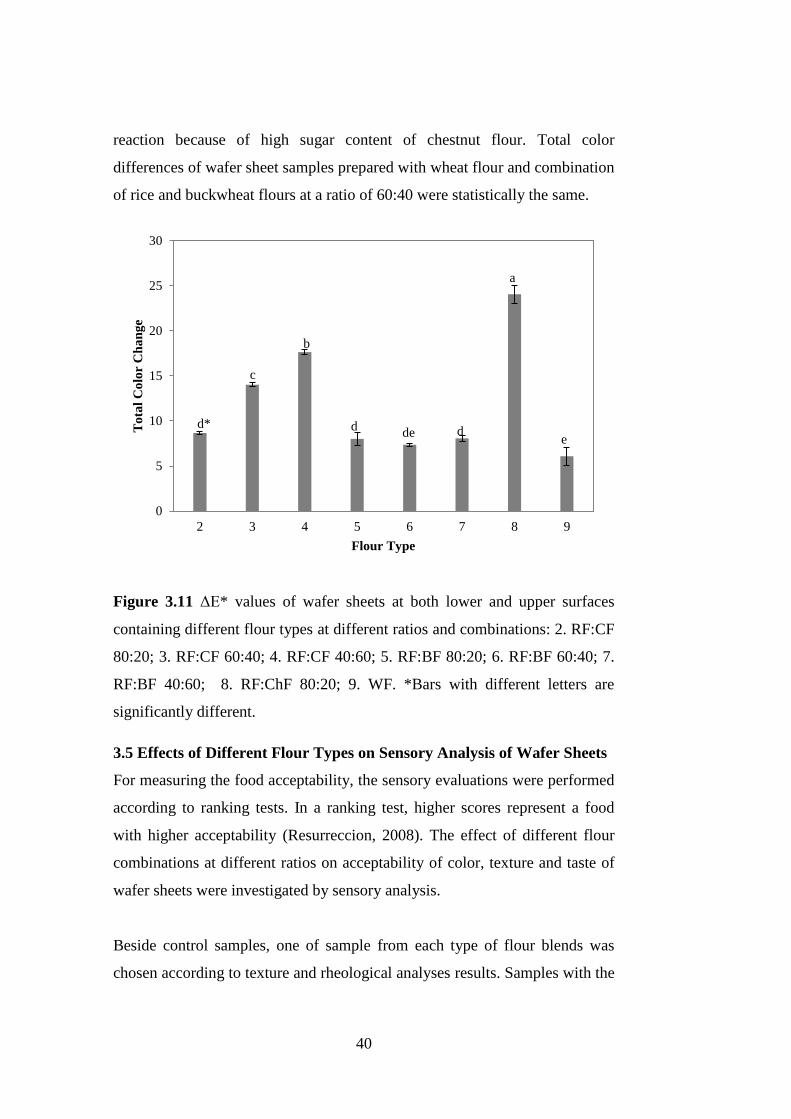
40
reaction because of high sugar content of chestnut flour. Total color
differences of wafer sheet samples prepared with wheat flour and combination
of rice and buckwheat flours at a ratio of 60:40 were statistically the same.
Figure 3.11 ΔE* values of wafer sheets at both lower and upper surfaces
containing different flour types at different ratios and combinations: 2. RF:CF
80:20; 3. RF:CF 60:40; 4. RF:CF 40:60; 5. RF:BF 80:20; 6. RF:BF 60:40; 7.
RF:BF 40:60; 8. RF:ChF 80:20; 9. WF. *Bars with different letters are
significantly different.
3.5 Effects of Different Flour Types on Sensory Analysis of Wafer Sheets
For measuring the food acceptability, the sensory evaluations were performed
according to ranking tests. In a ranking test, higher scores represent a food
with higher acceptability (Resurreccion, 2008). The effect of different flour
combinations at different ratios on acceptability of color, texture and taste of
wafer sheets were investigated by sensory analysis.
Beside control samples, one of sample from each type of flour blends was
chosen according to texture and rheological analyses results. Samples with the
0
5
10
15
20
25
30
2 3 4 5 6 7 8 9
To
tal
Co
lor
Ch
an
ge
Flour Type
e
a
d de d
b
c
d*
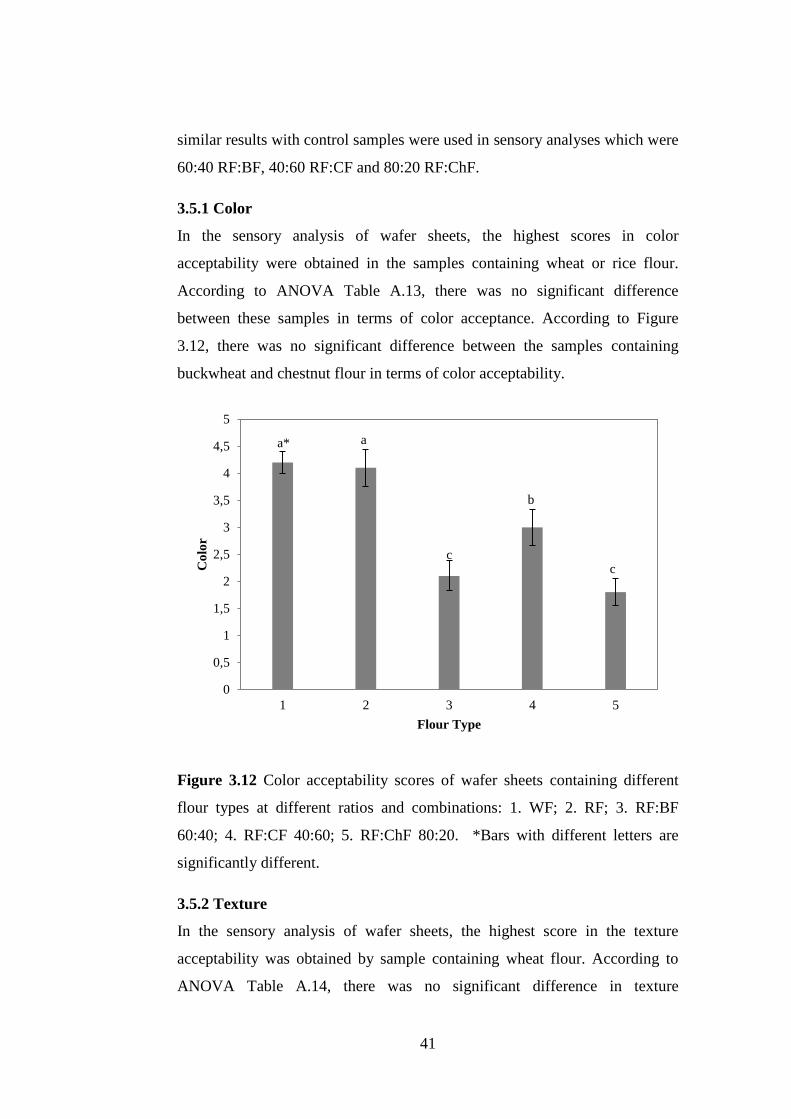
41
similar results with control samples were used in sensory analyses which were
60:40 RF:BF, 40:60 RF:CF and 80:20 RF:ChF.
3.5.1 Color
In the sensory analysis of wafer sheets, the highest scores in color
acceptability were obtained in the samples containing wheat or rice flour.
According to ANOVA Table A.13, there was no significant difference
between these samples in terms of color acceptance. According to Figure
3.12, there was no significant difference between the samples containing
buckwheat and chestnut flour in terms of color acceptability.
Figure 3.12 Color acceptability scores of wafer sheets containing different
flour types at different ratios and combinations: 1. WF; 2. RF; 3. RF:BF
60:40; 4. RF:CF 40:60; 5. RF:ChF 80:20. *Bars with different letters are
significantly different.
3.5.2 Texture
In the sensory analysis of wafer sheets, the highest score in the texture
acceptability was obtained by sample containing wheat flour. According to
ANOVA Table A.14, there was no significant difference in texture
0
0,5
1
1,5
2
2,5
3
3,5
4
4,5
5
1 2 3 4 5
Co
lor
Flour Type
c
b
c
a a*
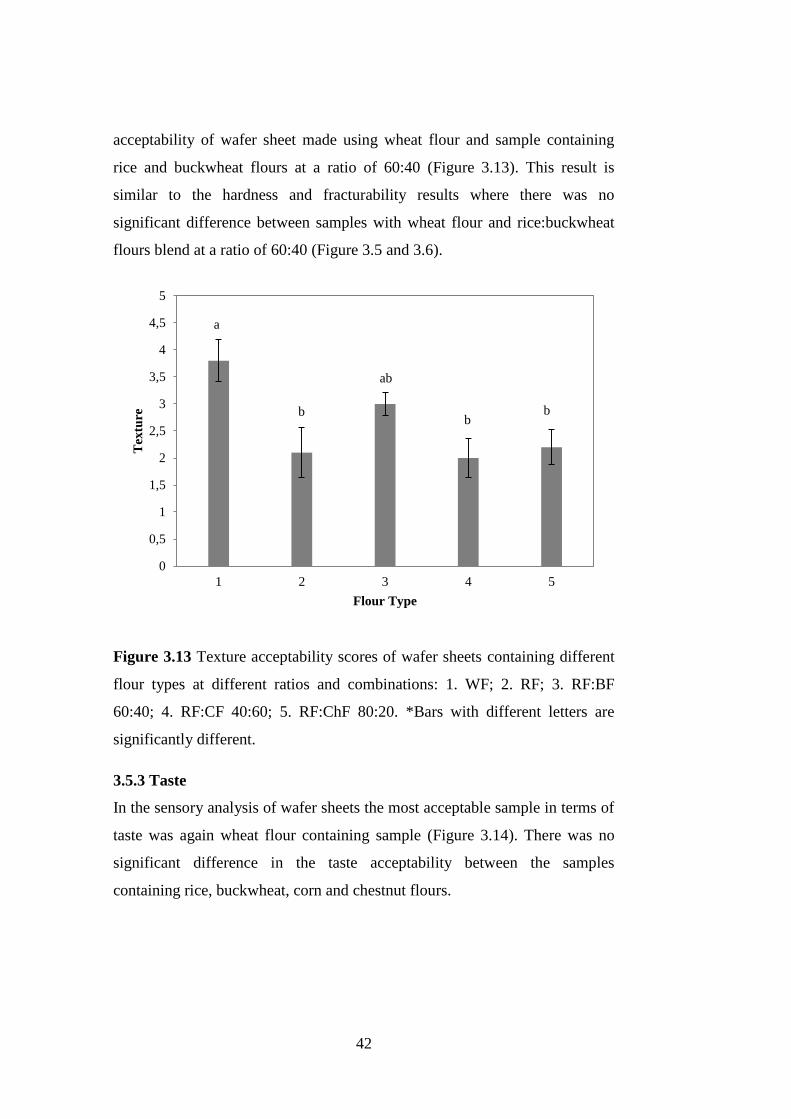
42
acceptability of wafer sheet made using wheat flour and sample containing
rice and buckwheat flours at a ratio of 60:40 (Figure 3.13). This result is
similar to the hardness and fracturability results where there was no
significant difference between samples with wheat flour and rice:buckwheat
flours blend at a ratio of 60:40 (Figure 3.5 and 3.6).
Figure 3.13 Texture acceptability scores of wafer sheets containing different
flour types at different ratios and combinations: 1. WF; 2. RF; 3. RF:BF
60:40; 4. RF:CF 40:60; 5. RF:ChF 80:20. *Bars with different letters are
significantly different.
3.5.3 Taste
In the sensory analysis of wafer sheets the most acceptable sample in terms of
taste was again wheat flour containing sample (Figure 3.14). There was no
significant difference in the taste acceptability between the samples
containing rice, buckwheat, corn and chestnut flours.
0
0,5
1
1,5
2
2,5
3
3,5
4
4,5
5
1 2 3 4 5
Tex
ture
Flour Type
b b
ab
b
a

43
Figure 3.14 Taste acceptability scores of wafer sheets containing different
flour types at different ratios and combinations: 1. WF; 2. RF ;3. RF:BF
60:40; 4. RF:CF 40:60; 5. RF:ChF 80:20. *Bars with different letters are
significantly different.
0
0,5
1
1,5
2
2,5
3
3,5
4
4,5
5
1 2 3 4 5
Ta
ste
Flour Type
b
b b
b
a*

44

45
CHAPTER 4
CONCLUSION AND RECOMMENDATIONS
All flour blends and 100% rice and 100% wheat flour formulations showed
shear thinning behavior and they all obeyed Power law model. Among all
samples, consistency and flow behavior indices of rice and buckwheat flour
containing sample at a ratio of 60:40 were the most similar to those of control
samples (both rice and wheat flour samples).
When the texture profile of wafer sheets were examined in terms of hardness,
it was seen that samples containing only rice flour and all the samples with
corn flours had harder texture as compared to the other samples. Buckwheat-
rice flour samples and chestnut-rice flour sample were similar to the wheat
flour containing sample in terms of hardness. In terms of fracturability, all
samples with corn flour had the highest values, which is not desirable in wafer
sheet production because of problems arising in the cutting stage of the sheets.
For fracturability parameter, the buckwheat-rice flour samples were the
closest one to the wheat flour containing sample. When texture results were
considered, the best alternative flour to wheat flour for gluten-free wafer sheet
production was buckwheat-rice flour blend.
In the color analyses of wafer sheets, the effects of natural color of the flours
were clearly observed in the final product. Samples containing corn flour and
sample having chestnut flour were different than other samples by their
yellowness and redness values, respectively. Other samples had similar color.
When the sensory analyses of wafer sheets were examined, sample prepared
with rice and buckwheat flour at a ratio of 60:40 was similar to the wheat
flour containing sample in terms of texture acceptability. In acceptability of

46
color, samples with wheat flour and rice flour had the highest scores. In the
taste analysis, as in the other cases wheat flour had the highest score.
It can be concluded that for gluten-free wafer sheet production, buckwheat-
rice flour blends could be used as an alternative to wheat flour. Although
color acceptability of wafer sheets containing rice and buckwheat flours at a
ratio of 60:40 was lower, with its texture properties, it was the closest
alternative to wheat flour containing sample.
As future study, different flour blends like chestnut-buckwheat flours or other
gluten-free flour blends could be investigated. Different types of gluten-free
starch like potato starch could be studied to improve structure and texture of
the wafer sheets. Shelf life of the gluten-free wafer sheets could also be
examined.

47
REFERENCES
Adebayo, A.O., and Emmanuel, F. 2001. The protein quality of some corn-
based Nigeria diets. J. Mgt. Technol., 3, 122–127.
Arendt, E.K., Renzetti, S., Dal Bello, F., 2009. Dough microstructure and
textural aspects of gluten-free yeast bread and biscuits. In: Gluten-free Food
Science and Technology, (Eds.) Gallagher, E., Wiley-Blackwell, Oxford, UK,
pp. 107-129.
Bai, J., Zeballos, E., Fried, M., Corazza, G.R., Schuppan, D., Farthing,
M.J.G., Catassi, C., Greco, L., Cohen, H., Krabshuis, J.H., 2007. World
Gastroenterology Organization Practice Guidelines: Celiac Disease.
Bárcenas, M.E., Rosell, C.M., 2006. Different approaches for improving the
quality and extending the shelf life of the partially baked bread: low
temperatures and HPMC addition. Journal of Food Engineering, 72(1), 92–99.
Borges, O.P., Carvalho, J.S., Correia, P.R., Silva, A.P., 2007. Lipid and fatty
acid profiles of Castanea sativa Mill. Chestnuts of 17 native Portuguese
cultivars.Journal of Food Composition and Analysis, 20(2), 80–89.
Carroll, K.K. and Hamilton R. M. G., 1975. Nutritional perspectives and
atherosclerosis. Journal of Food Science, 40:18-22.
Catassi, C., and Fasano, A., 2008. Celiac disease. In: Gluten-free Cereal
Products and Beverages, (Eds.) Arendt, E. K. and Dal Bello F., Academic
Press, Oxford, UK, pp. 1-22.
Centre for Digestive Disease, 2009. Coeliac disease. From
http://www.cdd.com.au/pages/disease_info/coeliac_disease.html last visited:
July, 2014.
Codex standard for foods for special dietary use for persons intolerant to
gluten, 1979. Codex Standard, 118, 1-3.

48
Cureton, P., and Fasano, A., 2009. The increasing incidence of celiac disease
and the range of gluten-free products in the market place. In: Gluten-free
Food Science and Technology, (Eds.) Gallagher, E., Wiley-Blackwell,
Oxford, UK, pp. 1-15.
Demiate, I.M., Oetterer,M., Wosiacki, G., 2001. Characterization of chestnut
(Castanea sativa, Mill) starch for industrial utilization. Braz. Arch. Biol.
Technol., 44, 69–78.
Demirkesen, I., Mert, B., Sumnu G., Sahin, S., 2010a. Rheological properties
of gluten-free bread formulations. Journal of Food Engineering, 96(2), 295–
303.
Demirkesen, I., Mert, B., Sumnu G., Sahin, S., 2010b. Utilization of chestnut
flour in gluten-free bread formulations. Journal of Food Engineering, 101(3),
329-336.
Demirkesen, I., 2013. Development of gluten-free bread formulations for
baking in infrared-microwave combination oven. PhD Thesis, METU,
Ankara.
Demirkesen, I., Sumnu, G., Sahin, S., 2013. Quality of gluten-free bread
formulations baked in different ovens. Food and Bioprocess Technology,
6(3), 746-753.
Dogan, I.S., 2006. Factors affecting wafer sheet quality. International Journal
of Food Science and Technology, 41, 569-576.
Enwere, J. 1998. Foods of Plant Origin. Afro-Orbis Publications Ltd, Nsukka,
Nigeria, pp. 40-48.
Figoni, P.I., 2008. How Baking Works: Exploring the Fundamentals of
Baking Science. Wiley, Oxford, UK, pp. 65-86.
Francischi, M. L. P., Salgado, J. M., Leitão, R. F. F., 1994. Chemical,
nutritional and technological characteristics of buckwheat and non-prolamine
49
buckwheat flours in comparison of wheat flour. Plant Foods for Human
Nutrition, 46(4), 323-329.
Gallagher, E., Gormley, T.R., Arendt, E.K., 2003. Crust and crumb
characteristics of gluten-free breads. Journal of Food Engineering, 56(2-3),
153–161.
Gómez, M., Oliete, B., Caballero, P. A., Ronda, F., Blanco, C. A., 2008.
Effect of nut paste enrichment on wheat dough rheology and bread volume.
Food Science Technology International, 14, 57–65.
He, J., Klag, M.J., Whelton, P.K., Mo, J.P., Chen, J.Y., Quian, M.C., Mo,
P.S., He, G.Q., 1995. Oats and buckwheat intakes and cardiovascular disease
risk factors in an ethnic minority of China. The American Journal of Clinical
Nutrition, 61(2), 366-372.
Hoseney, R.C., Wade, P., and Finley, J.W., 1988. Soft wheat products. In:
Wheat: Chemistry and Technology Volume 2, (Eds.) Pomeranz, Y., American
Association of Cereal Chemists, Inc., Minnesota, USA, pp. 407-456.
Kobs, L., 2001. “B” is for baking cookies. From,
http://www.foodproductdesign.com/articles/2001/10/147b148------is-for-
baking-cookies.aspx last visited: July, 2014.
Kreft, M. & Kreft, S., 2000. Localization and morphology of buckwheat
embryo. Fagopyrum, 17, 15-19.
Lazaridou, A., Duta, D., Papageorgiou, M., Belc, N., Biliaderis, C.G., 2007.
Effects of hydrocolloids on dough rheology and bread quality parameters in
gluten-free formulations. Journal of Food Engineering, 79(3), 1033–1047.
Malkin, A. Y. and Isayev, A. I., 2006. Pressure corrections. In: Rheology:
concepts, methods, and applications (1st ed.). ChemTac Publishing, Toronto,
pp. 253-320.

50
Manley, D., 2000. Technology of biscuits, crackers and cookies (3rd ed.).
Woodhead Publishing Limited, Cambridge, England, pp. 290-306.
Marco, C., and Rosell, C.M., 2008. Breadmaking performance of protein
enriched, gluten-free breads. European Food Research and Technology,
227(4), 1205-1213.
Mendoza, N., 2005. Coeliac disease: an overview of the diagnosis, treatment
and management. Nutrition Bulletin, 30(3), 231–236.
Moreira, R., Chenlo, F., Torres, M.D., and Prieto, D.M., 2010a. Influence of
the particle size on the rheological behaviour of chestnut flour doughs.
Journal of Food Engineering, 100(2), 270-277.
Moreira, R., Chenlo, F., Torres, M.D., Prieto, D.M., 2010b. Water adsorption
and desorption isotherms of chestnut and wheat flours. Industrial Crops and
Products, 32(3), 252-257.
Moreira, R., Chenlo, F., Torres, M.D., 2011. Rheology of commercial
chestnut flour doughs incorporated with gelling agents. Food Hydrocolloids,
25(5), 1361-1371.
Mukprasirt, A., Herald, T. J., & Flores, R. A., 2000. Rheological
characterization of rice flour-based batters. Journal of Food Science, 65,
1194–1197.
National Digestive Diseases Information Clearinghouse, 2008. Celiac disease.
From http://digestive.niddk.nih.gov/ddiseases/pubs/celiac/ last visited: July,
2014.
National Foundation for Celiac Awareness, 2014. What is celiac disease?
From http://www.celiaccentral.org/Celiac-Disease/21/ last visited: July, 2014.
Navarrete, N.M.,Moraga, G., Talens, P.,& Chiralt, A., 2004. Water sorption
and the plasticization effect in wafers. International Journal of Food Science
and Technology, 39, 555–562.
51
Nelson, A. L., 2001. High Fiber Ingredients. (1steds.). Eagen Press Handbook
Series, AACC, Minnesota. pp. 44-61.
Niewinski, M.M., 2008. Advances in celiac disease and gluten-free diet.
Journal of the American Dietetic Association, 108(4), 661-672.
Preichardt, L.D., Vendruscolo, C.T., Gularte, M.A. and Moreira, A.S., 2011.
The role of xanthan gum in the quality of gluten-free cakes: improved bakery
products for coeliac patients. International Journal of Food Science and
Technology, 46(12), 2591–2597.
Resurreccion, A. V. A., 2008. Consumer sensory testing for food product
development. In: Developing New Food Products for a Changing
Marketplace, (Eds.), Brody, Aaron L., Lord, John B. ( 2nd ed.), CRC Press
Taylor and Francis Group, FL, USA, pp. 5–25.
Rosell, C.M., and Collar, C., 2007. Rice-based products. In: Handbook of
Food Products Manufacturing, (Eds.) Hui, Y.H., John Wiley & Sons, Inc.,
Hoboken, New Jersey, pp. 523-534.
Sacchetti, G., Pinnavaia, G.G., Guidolin, E., Dalla Rosa, M., 2004. Effects of
extrusion temperature and feed composition on the functional, physical and
sensory properties of chestnut and rice flour-based snack-like products. Food
Research International, 37(5), 527-534.
Schober, T.J., O'Brien, C.M., McCarthy, D., Darnedde, A., Arendt, E.K.,
2003. Influence of gluten-free flour mixes and fat powders on the quality of
gluten-free biscuits. European Food Research and Technology, 216(5), 369-
376.
Shukla, R., and Cheryan, M., 2001. Zein: the industrial protein from corn.
Industrial Crops and Products, 13(3), 171–192.
Singh, N., Singh, S., and Shevkani, K., 2011. Maize: Composition, bioactive
constituents, and unleavened bread. In: Flour and Breads and Their

52
Fortification in Health and Disease Prevention, (Eds.) Preedy, V.R., Watson,
R.R., Patel, V.B., Elsevier, Oxford, UK, pp. 89-99.
Šramková, Z., Gregová, E., and Šturdík, E., 2009. Chemical composition and
nutritional quality of wheat grain. Acta Chimica Slovaca, 2(1), 115 – 138.
Steadman, K., Burgoon, M., Lewis, B., Edwardson, S., Obendorf, R., 2001.
Minerals, phytic acid, tannin and rutin in buckwheat seed milling fractions.
Journal of the Science of Food and Agriculture, 81(11), 1094-1100.
Takahama, U., Tanaka, M., Hirota, S., 2011. Buckwheat flour and bread. In:
Flour and Breads and Their Fortification in Health and Disease Prevention,
(Eds.) Preedy, V.R., Watson, R.R., Patel, V.B., Elsevier, Oxford, UK, pp.
141-151.
Thompson, T., 2009. The nutritional quality of gluten-free foods. In: Gluten-
free Food Science and Technology, (Eds.) Gallagher, E., Wiley-Blackwell,
Oxford, UK, pp. 42-51.
Tiefenbacher, K. F., 2002. Haas Waffelmaschinen: Handbook of Wafer
Technologie. Franz Haas Waffelmaschinen GmbH, Leobendorf, Austria.
Tomotake, H., Shimaoka, I., Kayashita, J., Yokoyama, F., Nakajoh, M., Kato,
N., 2000. Buckwheat protein product suppresses gallstone formation and
plasma cholesterol more strongly than soy protein isolate in hamsters. Journal
of Nutrition, 130(7), 1670-1674.
Torbica, A., Hadnadev, M., Dapčević, T., 2010. Rheological, textural and
sensory properties of gluten-free bread formulations based on rice and
buckwheat flour. Food Hydrocolloids, 24(6-7), 626–632.
TSE, 1989. Wafer Standards TS 7474. Türk Standartları Enstitüsü, Ankara.
Turabi, E., Sumnu G., & Sahin, S., 2008. Rheological properties and quality
of rice cakes formulated with different gums and an emulsifier blend. Food
Hydrocolloids, 22(2), 305-312.

53
Turabi, E., Sumnu G., Sahin, S., 2010. Quantitative analysis of macro and
micro-structure of gluten-free rice cakes containing different types of gums
baked in different ovens. Food Hydrocolloids, 24(8), 755–762.
Wade, P., 1988. Biscuits, cookies and crackers. Vol. 1. The principles of the
craft. Elsevier, New York, pp. 139-150.
Watanabe, M., 1998. Catechins as antioxidants form buckwheat (fagopyrum
esculentum moench) groats. Journal of Agricultural and Food Chemistry,
46(3), 839-845.
Wei, Y., Zhang, G., Li, Z., 1995. Study on nutritive and physico-chemical
properties of buckwheat flour. Nahrung, 39(1), 48-54.
Yeh, A.,2004. Preparation and applications of rice flour. In: Rice Chemistry
and Technology, (Eds.) Champagne, E., American Association of Cereal
Chemists, Inc., Minnesota, U.S.A., pp. 495-539.
Yıldız, O., 2010. The effects of formulation, baking and storage periods on
the quality of gluten-free cake. PhD Thesis, Yuzuncu Yıl University, Van.

54

55
APPENDIX A
ANOVA & DUNCAN TEST TABLES
Table A.1 ANOVA and Duncan Single Range Test for water loss of wafer
sheets containing different types of flours in different combinations.
Samples: 1. Rice flour; 2. Rice flour: Corn flour 80:20; 3. Rice flour: Corn
flour 60:40; 4. Rice flour: Corn flour 40:60; 5. Rice flour: Buckwheat flour
80:20; 6. Rice flour: Buckwheat flour 60:40; 7. Rice flour: Buckwheat flour
40:60; 8. Rice flour: Chestnut flour 80:20; 9. Wheat Flour
1-Way ANOVA
The SAS System
The GLM Procedure
Class Level Information
Class Levels Values
X 9 1 2 3 4 5 6 7 8 9
Number of Observations Read 18
Number of Observations Used 18
Dependent Variable: Y
Source DF Sum of Squares Mean Square F Value Pr > F
Model 8 426.6762524 53.3345316 293.47 <.0001
Error 9 1.6356160 0.1817351
Corrected Total 17 428.3118684
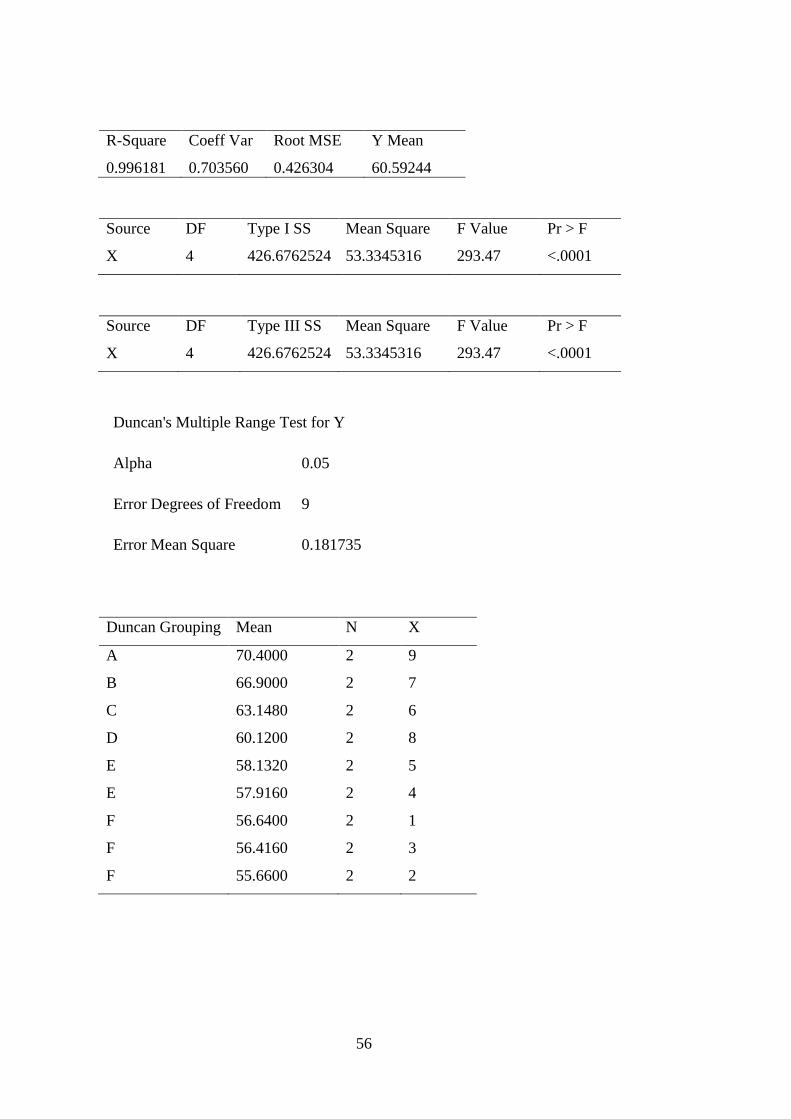
56
R-Square Coeff Var Root MSE Y Mean
0.996181 0.703560 0.426304 60.59244
Source DF Type I SS Mean Square F Value Pr > F
X 4 426.6762524 53.3345316 293.47 <.0001
Source DF Type III SS Mean Square F Value Pr > F
X 4 426.6762524 53.3345316 293.47 <.0001
Duncan's Multiple Range Test for Y
Alpha 0.05
Error Degrees of Freedom 9
Error Mean Square 0.181735
Duncan Grouping Mean N X
A 70.4000 2 9
B 66.9000 2 7
C 63.1480 2 6
D 60.1200 2 8
E 58.1320 2 5
E 57.9160 2 4
F 56.6400 2 1
F 56.4160 2 3
F 55.6600 2 2
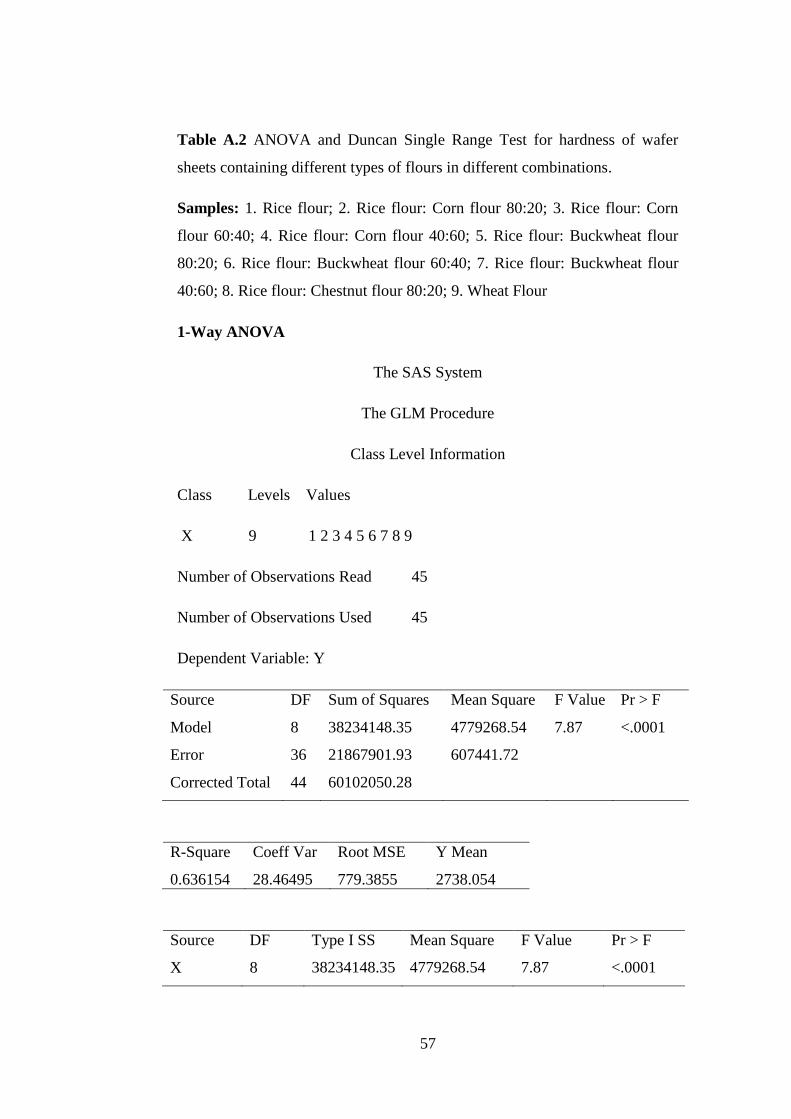
57
Table A.2 ANOVA and Duncan Single Range Test for hardness of wafer
sheets containing different types of flours in different combinations.
Samples: 1. Rice flour; 2. Rice flour: Corn flour 80:20; 3. Rice flour: Corn
flour 60:40; 4. Rice flour: Corn flour 40:60; 5. Rice flour: Buckwheat flour
80:20; 6. Rice flour: Buckwheat flour 60:40; 7. Rice flour: Buckwheat flour
40:60; 8. Rice flour: Chestnut flour 80:20; 9. Wheat Flour
1-Way ANOVA
The SAS System
The GLM Procedure
Class Level Information
Class Levels Values
X 9 1 2 3 4 5 6 7 8 9
Number of Observations Read 45
Number of Observations Used 45
Dependent Variable: Y
Source DF Sum of Squares Mean Square F Value Pr > F
Model 8 38234148.35 4779268.54 7.87 <.0001
Error 36 21867901.93 607441.72
Corrected Total 44 60102050.28
R-Square Coeff Var Root MSE Y Mean
0.636154 28.46495 779.3855 2738.054
Source DF Type I SS Mean Square F Value Pr > F
X 8 38234148.35 4779268.54 7.87 <.0001

58
Source DF Type III SS Mean Square F Value Pr > F
X 8 38234148.35 4779268.54 7.87 <.0001
Duncan's Multiple Range Test for Y
Alpha 0.05
Error Degrees of Freedom 36
Error Mean Square 607441.7
Duncan Grouping Mean N X
A 3901.4 5 2
A 3628.0 5 1
A 3527.2 5 3
A 3526.7 5 5
A 3108.1 5 4
B 1928.4 5 8
B 1886.2 5 6
B 1597.7 5 9
B 1538.7 5 7

59
Table A.3 ANOVA and Duncan Single Range Test for fracturability of wafer
sheets containing different types of flours in different combinations.
Samples: 1. Rice flour; 2. Rice flour: Corn flour 80:20; 3. Rice flour: Corn
flour 60:40; 4. Rice flour: Corn flour 40:60; 5. Rice flour: Buckwheat flour
80:20; 6. Rice flour: Buckwheat flour 60:40; 7. Rice flour: Buckwheat flour
40:60; 8. Rice flour: Chestnut flour 80:20; 9. Wheat Flour
1-Way ANOVA
The SAS System
The GLM Procedure
Class Level Information
Class Levels Values
X 9 1 2 3 4 5 6 7 8 9
Number of Observations Read 18
Number of Observations Used 18
Dependent Variable: Y
Source DF Sum of Squares Mean Square F Value Pr > F
Model 8 951815.446 118976.931 9.37 0.0015
Error 9 114333.705 12703.745
Corrected Total 17 1066149.152
R-Square Coeff Var Root MSE Y Mean
0.892760 16.01560 112.7109 703.7569
Source DF Type I SS Mean Square F Value Pr > F
X 8 951815.4464 118976.9308 9.37 0.0015
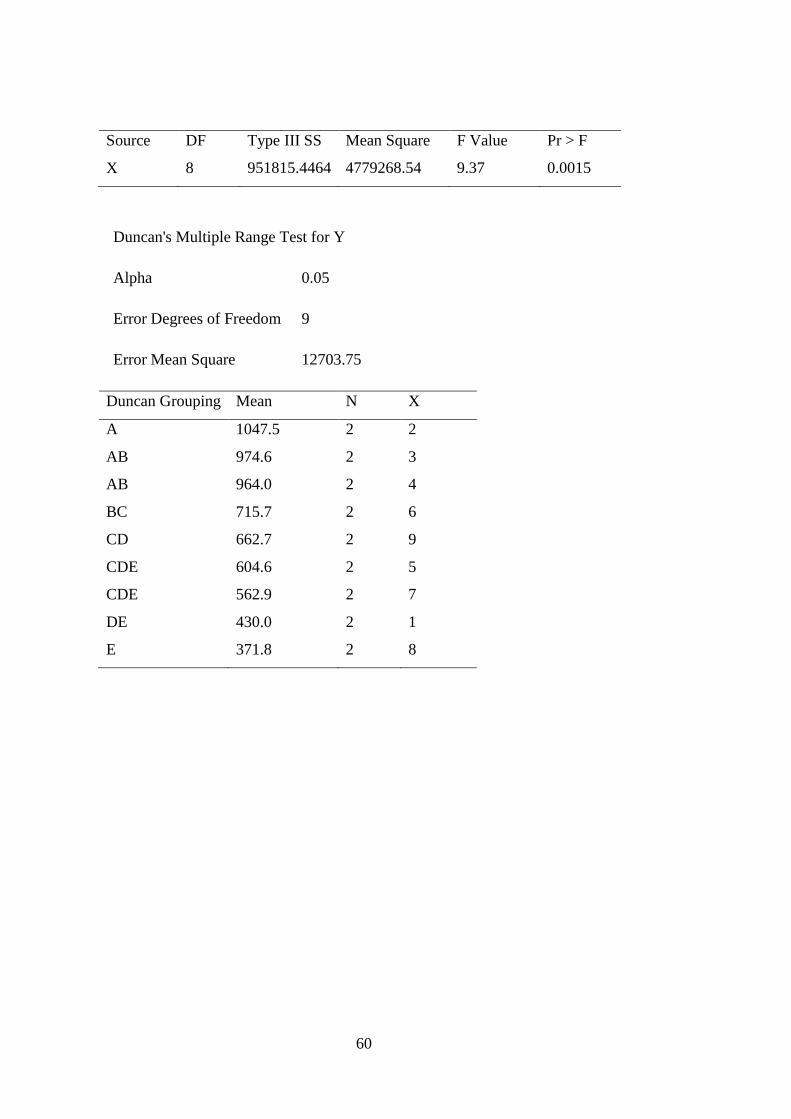
60
Source DF Type III SS Mean Square F Value Pr > F
X 8 951815.4464 4779268.54 9.37 0.0015
Duncan's Multiple Range Test for Y
Alpha 0.05
Error Degrees of Freedom 9
Error Mean Square 12703.75
Duncan Grouping Mean N X
A 1047.5 2 2
AB 974.6 2 3
AB 964.0 2 4
BC 715.7 2 6
CD 662.7 2 9
CDE 604.6 2 5
CDE 562.9 2 7
DE 430.0 2 1
E 371.8 2 8
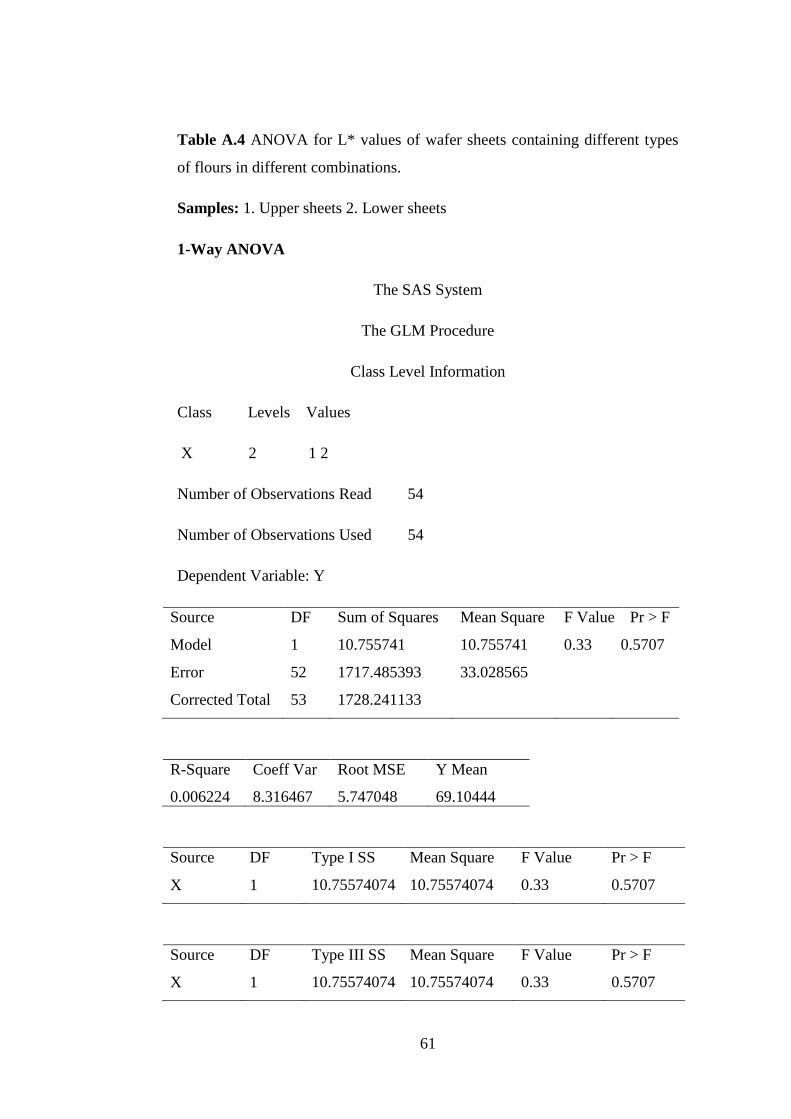
61
Table A.4 ANOVA for L* values of wafer sheets containing different types
of flours in different combinations.
Samples: 1. Upper sheets 2. Lower sheets
1-Way ANOVA
The SAS System
The GLM Procedure
Class Level Information
Class Levels Values
X 2 1 2
Number of Observations Read 54
Number of Observations Used 54
Dependent Variable: Y
Source DF Sum of Squares Mean Square F Value Pr > F
Model 1 10.755741 10.755741 0.33 0.5707
Error 52 1717.485393 33.028565
Corrected Total 53 1728.241133
R-Square Coeff Var Root MSE Y Mean
0.006224 8.316467 5.747048 69.10444
Source DF Type I SS Mean Square F Value Pr > F
X 1 10.75574074 10.75574074 0.33 0.5707
Source DF Type III SS Mean Square F Value Pr > F
X 1 10.75574074 10.75574074 0.33 0.5707

62
Table A.5 ANOVA and Duncan Single Range Test for L* values of wafer
sheets containing different types of flours in different combinations.
Samples: 1. Rice flour; 2. Rice flour: Corn flour 80:20; 3. Rice flour: Corn
flour 60:40; 4. Rice flour: Corn flour 40:60; 5. Rice flour: Buckwheat flour
80:20; 6. Rice flour: Buckwheat flour 60:40; 7. Rice flour: Buckwheat flour
40:60; 8. Rice flour: Chestnut flour 80:20; 9. Wheat Flour *both upper and
lower sheets
1-Way ANOVA
The SAS System
The GLM Procedure
Class Level Information
Class Levels Values
X 9 1 2 3 4 5 6 7 8 9
Number of Observations Read 54
Number of Observations Used 54
Dependent Variable: Y
Source DF Sum of Squares Mean Square F Value Pr > F
Model 8 1604.268867 200.533608 72.79 <.0001
Error 45 123.972267 2.754939
Corrected Total 53 1728.241133
R-Square Coeff Var Root MSE Y Mean
0.928267 2.401873 1.659801 69.10444

63
Source DF Type I SS Mean Square F Value Pr > F
X 8 1604.268867 200.533608 72.79 <.0001
Source DF Type III SS Mean Square F Value Pr > F
X 8 1604.268867 200.533608 72.79 <.0001
Duncan's Multiple Range Test for Y
Alpha 0.05
Error Degrees of Freedom 45
Error Mean Square 2.754939
Duncan Grouping Mean N X
A 75.1450 6 1
A 74.2167 6 9
B 71.9567 6 2
C 69.6150 6 3
C 69.5467 6 6
C 69.3500 6 7
C 69.2750 6 5
C 67.6583 6 4
D 55.1767 6 8

64
Table A.6 ANOVA for a* values of wafer sheets containing different types of
flours in different combinations.
Samples: 1. Upper sheets 2. Lower sheets
1-Way ANOVA
The SAS System
The GLM Procedure
Class Level Information
Class Levels Values
X 2 1 2
Number of Observations Read 54
Number of Observations Used 54
Dependent Variable: Y
Source DF Sum of Squares Mean Square F Value Pr > F
Model 1 63.6352667 63.6352667 6.02 0.0176
Error 52 549.9594667 10.5761436
Corrected Total 53 613.5947333
R-Square Coeff Var Root MSE Y Mean
0.103709 62.03664 3.252098 5.242222
Source DF Type I SS Mean Square F Value Pr > F
X 1 63.63526667 63.63526667 6.02 0.0176
Source DF Type III SS Mean Square F Value Pr > F
X 8 63.63526667 63.63526667 6.02 0.0176

65
Duncan's Multiple Range Test for Y
Alpha 0.05
Error Degrees of Freedom 52
Error Mean Square 10.57614
Duncan Grouping Mean N X
A 6.3278 27 2
B 4.1567 27 1

66
Table A.7 ANOVA and Duncan Single Range Test for a* values of wafer
sheets containing different types of flours in different combinations.
Samples: 1. Rice flour; 2. Rice flour: Corn flour 80:20; 3. Rice flour: Corn
flour 60:40; 4. Rice flour: Corn flour 40:60; 5. Rice flour: Buckwheat flour
80:20; 6. Rice flour: Buckwheat flour 60:40; 7. Rice flour: Buckwheat flour
40:60; 8. Rice flour: Chestnut flour 80:20; 9. Wheat Flour *upper sheets
1-Way ANOVA
The SAS System
The GLM Procedure
Class Level Information
Class Levels Values
X 9 1 2 3 4 5 6 7 8 9
Number of Observations Read 27
Number of Observations Used 27
Dependent Variable: Y
Source DF Sum of Squares Mean Square F Value Pr > F
Model 8 212.3896667 26.5487083 157.22 <.0001
Error 18 3.0396000 0.1688667
Corrected Total 26 215.4292667
R-Square Coeff Var Root MSE Y Mean
0.985890 9.992989 0.410934 4.112222
Source DF Type I SS Mean Square F Value Pr > F
X 8 212.3896667 26.5487083 157.22 <.0001
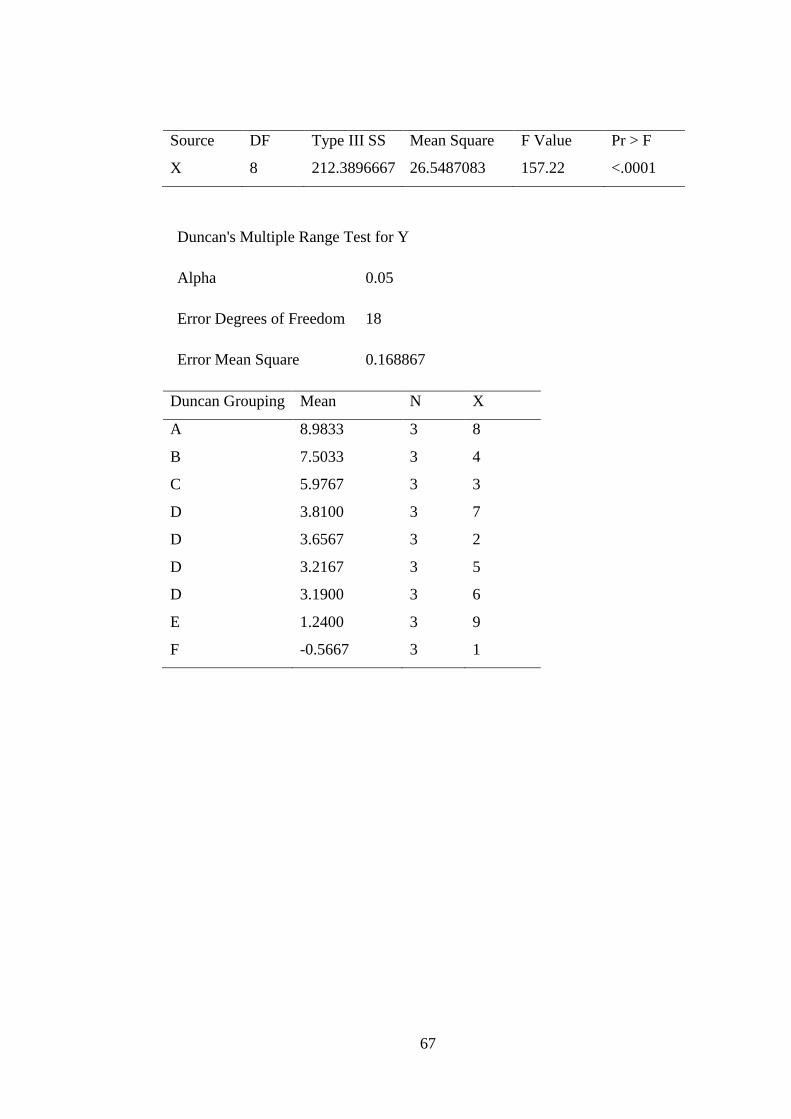
67
Source DF Type III SS Mean Square F Value Pr > F
X 8 212.3896667 26.5487083 157.22 <.0001
Duncan's Multiple Range Test for Y
Alpha 0.05
Error Degrees of Freedom 18
Error Mean Square 0.168867
Duncan Grouping Mean N X
A 8.9833 3 8
B 7.5033 3 4
C 5.9767 3 3
D 3.8100 3 7
D 3.6567 3 2
D 3.2167 3 5
D 3.1900 3 6
E 1.2400 3 9
F -0.5667 3 1
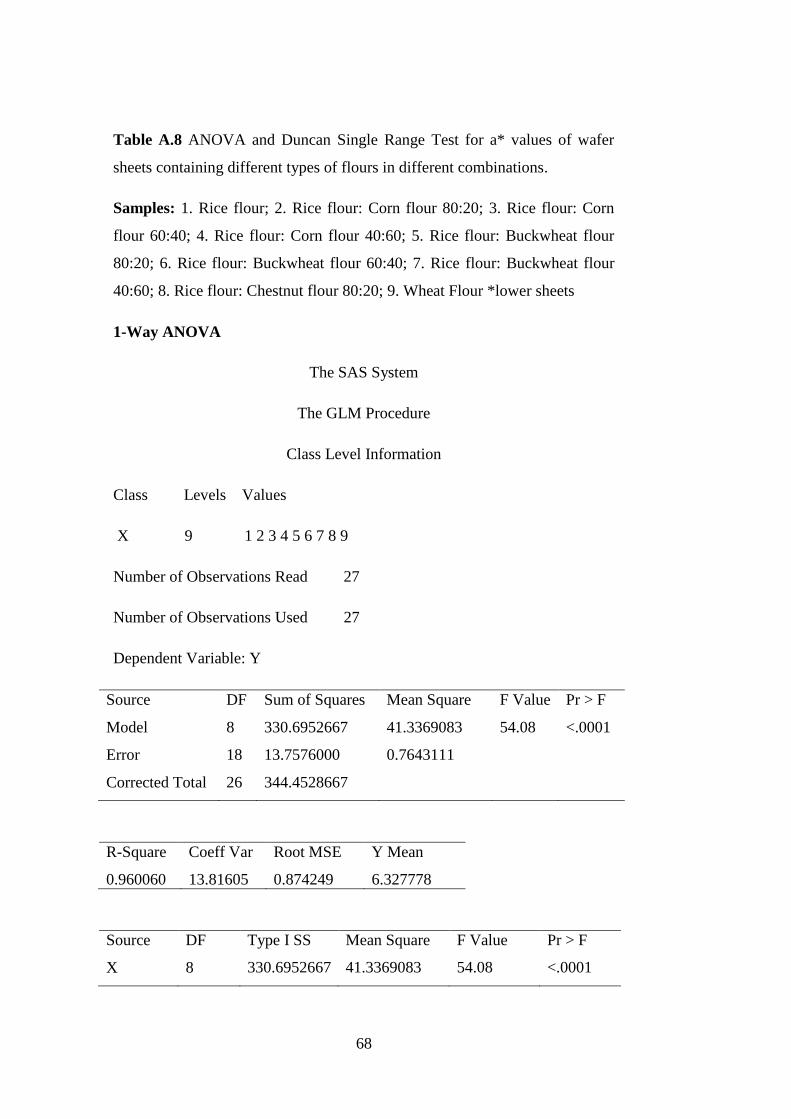
68
Table A.8 ANOVA and Duncan Single Range Test for a* values of wafer
sheets containing different types of flours in different combinations.
Samples: 1. Rice flour; 2. Rice flour: Corn flour 80:20; 3. Rice flour: Corn
flour 60:40; 4. Rice flour: Corn flour 40:60; 5. Rice flour: Buckwheat flour
80:20; 6. Rice flour: Buckwheat flour 60:40; 7. Rice flour: Buckwheat flour
40:60; 8. Rice flour: Chestnut flour 80:20; 9. Wheat Flour *lower sheets
1-Way ANOVA
The SAS System
The GLM Procedure
Class Level Information
Class Levels Values
X 9 1 2 3 4 5 6 7 8 9
Number of Observations Read 27
Number of Observations Used 27
Dependent Variable: Y
Source DF Sum of Squares Mean Square F Value Pr > F
Model 8 330.6952667 41.3369083 54.08 <.0001
Error 18 13.7576000 0.7643111
Corrected Total 26 344.4528667
R-Square Coeff Var Root MSE Y Mean
0.960060 13.81605 0.874249 6.327778
Source DF Type I SS Mean Square F Value Pr > F
X 8 330.6952667 41.3369083 54.08 <.0001

69
Source DF Type III SS Mean Square F Value Pr > F
X 8 330.6952667 41.3369083 54.08 <.0001
Duncan's Multiple Range Test for Y
Alpha 0.05
Error Degrees of Freedom 18
Error Mean Square 0.764311
Duncan Grouping Mean N X
A 13.4433 3 8
B 9.9667 3 4
C 7.7967 3 3
D 5.3467 3 7
D 5.3067 3 5
D 5.1067 3 6
D 4.9233 3 9
D 4.7533 3 2
E 0.3067 3 1

70
Table A.9 ANOVA for b* values of wafer sheets containing different types of
flours in different combinations.
Samples: 1. Upper sheets 2. Lower sheets
1-Way ANOVA
The SAS System
The GLM Procedure
Class Level Information
Class Levels Values
X 2 1 2
Number of Observations Read 54
Number of Observations Used 54
Dependent Variable: Y
Source DF Sum of Squares Mean Square F Value Pr > F
Model 1 9.779267 9.779267 0.34 0.5595
Error 52 1474.124415 28.348546
Corrected Total 53 1483.903681
R-Square Coeff Var Root MSE Y Mean
0.006590 18.97382 5.324335 28.06148
Source DF Type I SS Mean Square F Value Pr > F
X 1 9.77926667 9.77926667 0.34 0.5595
Source DF Type III SS Mean Square F Value Pr > F
X 1 9.77926667 9.77926667 0.34 0.5595
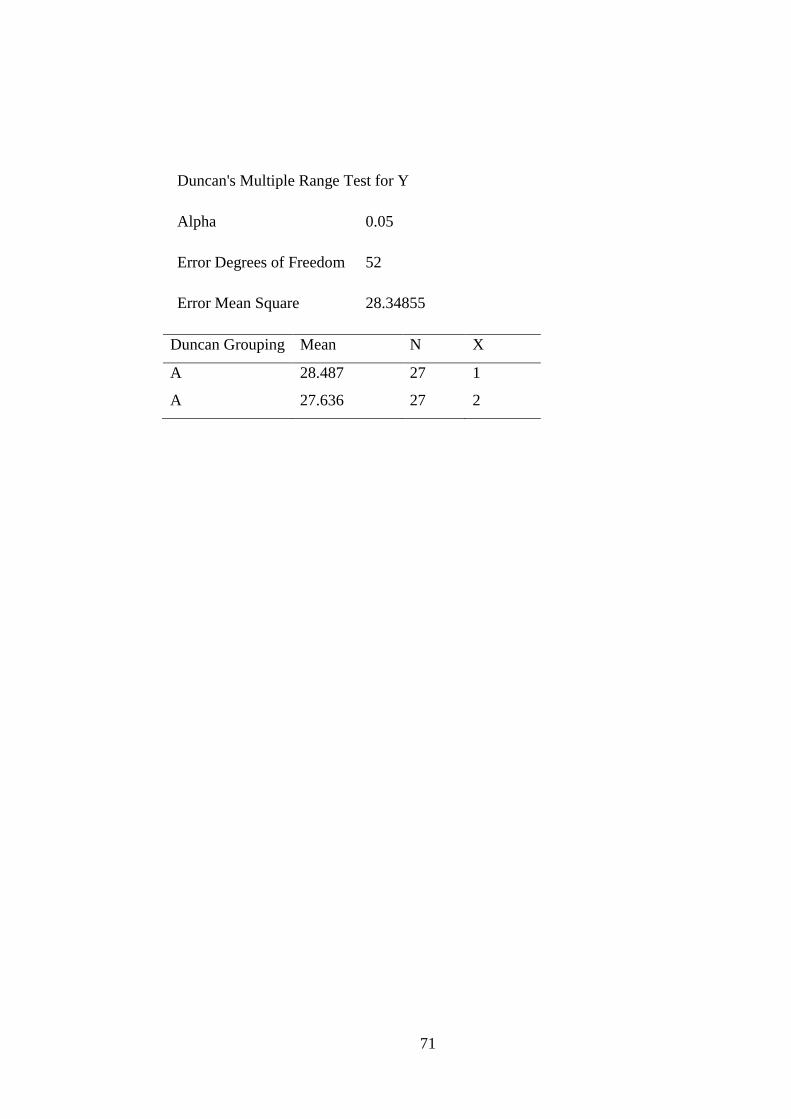
71
Duncan's Multiple Range Test for Y
Alpha 0.05
Error Degrees of Freedom 52
Error Mean Square 28.34855
Duncan Grouping Mean N X
A 28.487 27 1
A 27.636 27 2

72
Table A.10 ANOVA and Duncan Single Range Test for b* values of wafer
sheets containing different types of flours in different combinations.
Samples: 1. Rice flour; 2. Rice flour: Corn flour 80:20; 3. Rice flour: Corn
flour 60:40; 4. Rice flour: Corn flour 40:60; 5. Rice flour: Buckwheat flour
80:20; 6. Rice flour: Buckwheat flour 60:40; 7. Rice flour: Buckwheat flour
40:60; 8. Rice flour: Chestnut flour 80:20; 9. Wheat Flour *both upper and
lower sheets
1-Way ANOVA
The SAS System
The GLM Procedure
Class Level Information
Class Levels Values
X 9 1 2 3 4 5 6 7 8 9
Number of Observations Read 54
Number of Observations Used 54
Dependent Variable: Y
Source DF Sum of Squares Mean Square F Value Pr > F
Model 8 1258.770381 157.346298 31.45 <.0001
Error 45 225.133300 5.002962
Corrected Total 53 1483.903681
R-Square Coeff Var Root MSE Y Mean
0.848283 7.970820 2.236730 28.06148
Source DF Type I SS Mean Square F Value Pr > F
X 8 1258.770381 157.346298 31.45 <.0001
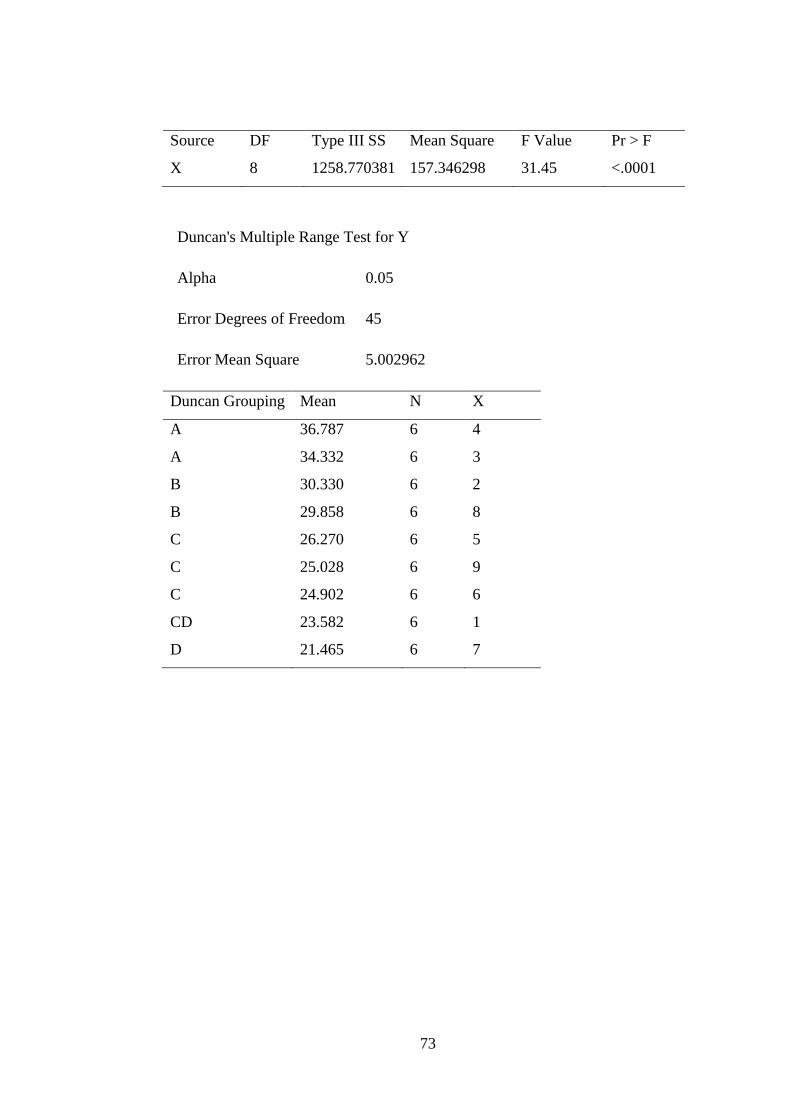
73
Source DF Type III SS Mean Square F Value Pr > F
X 8 1258.770381 157.346298 31.45 <.0001
Duncan's Multiple Range Test for Y
Alpha 0.05
Error Degrees of Freedom 45
Error Mean Square 5.002962
Duncan Grouping Mean N X
A 36.787 6 4
A 34.332 6 3
B 30.330 6 2
B 29.858 6 8
C 26.270 6 5
C 25.028 6 9
C 24.902 6 6
CD 23.582 6 1
D 21.465 6 7

74
Table A.11 ANOVA for total color difference values of wafer sheets
containing different types of flours in different combinations.
Samples: 1. Upper sheets 2. Lower sheets
1-Way ANOVA
The SAS System
The GLM Procedure
Class Level Information
Class Levels Values
X 2 1 2
Number of Observations Read 48
Number of Observations Used 48
Dependent Variable: Y
Source DF Sum of Squares Mean Square F Value Pr > F
Model 1 0.008008 0.008008 0.00 0.9885
Error 46 1764.907117 38.367546
Corrected Total 47 1764.915125
R-Square Coeff Var Root MSE Y Mean
0.000005 52.81172 6.194154 11.72875
Source DF Type I SS Mean Square F Value Pr > F
X 1 0.00800833 0.00800833 0.00 0.9885
Source DF Type III SS Mean Square F Value Pr > F
X 1 0.00800833 0.00800833 0.00 0.9885

75
Duncan's Multiple Range Test for Y
Alpha 0.05
Error Degrees of Freedom 46
Error Mean Square 38.36755
Duncan Grouping Mean N X
A 11.742 27 2
A 11.742 27 1

76
Table A.12 ANOVA and Duncan Single Range Test for total color difference
values of wafer sheets containing different types of flours in different
combinations.
Samples: 2. Rice flour: Corn flour 80:20; 3. Rice flour: Corn flour 60:40; 4.
Rice flour: Corn flour 40:60; 5. Rice flour: Buckwheat flour 80:20; 6. Rice
flour: Buckwheat flour 60:40; 7. Rice flour: Buckwheat flour 40:60; 8. Rice
flour: Chestnut flour 80:20; 9. Wheat Flour *both upper and lower sheets
1-Way ANOVA
The SAS System
The GLM Procedure
Class Level Information
Class Levels Values
X 9 2 3 4 5 6 7 8 9
Number of Observations Read 48
Number of Observations Used 48
Dependent Variable: Y
Source DF Sum of Squares Mean Square F Value Pr > F
Model 7 1679.778733 239.968390 113.11 <.0001
Error 40 84.861033 2.121526
Corrected Total 47 1764.639767
R-Square Coeff Var Root MSE Y Mean
0.951910 12.41639 1.456546 11.73083

77
Source DF Type I SS Mean Square F Value Pr > F
X 7 1679.778733 239.968390 113.11 <.0001
Source DF Type III SS Mean Square F Value Pr > F
X 7 1679.778733 239.968390 113.11 <.0001
Duncan's Multiple Range Test for Y
Alpha 0.05
Error Degrees of Freedom 40
Error Mean Square 2.121526
Duncan Grouping Mean N X
A 24.0517 6 8
B 17.6467 6 4
C 14.0050 6 3
D 8.6550 6 2
D 8.0617 6 7
D 8.0000 6 5
DE 7.3450 6 6
E 6.0817 6 9

78
Table A.13 ANOVA and Duncan Single Range Test for color acceptability
values of wafer sheets containing different types of flours in different
combinations.
Samples: 1. WF; 2.RF; 3. RF:CF 40:60; 4. RF:ChF 80:20; 5. RF:BF 60:40
1-Way ANOVA
The SAS System
The GLM Procedure
Class Level Information
Class Levels Values
X 9 1 2 3 4 5
Number of Observations Read 50
Number of Observations Used 50
Dependent Variable: Y
Source DF Sum of Squares Mean Square F Value Pr > F
Model 4 48.92000000 12.23000000 14.87 <.0001
Error 45 37.00000000 0.82222222
Corrected Total 49 85.92000000
R-Square Coeff Var Root MSE Y Mean
0.569367 29.82779 0.906765 3.040000
Source DF Type I SS Mean Square F Value Pr > F
X 4 48.92000000 12.23000000 14.87 <.0001
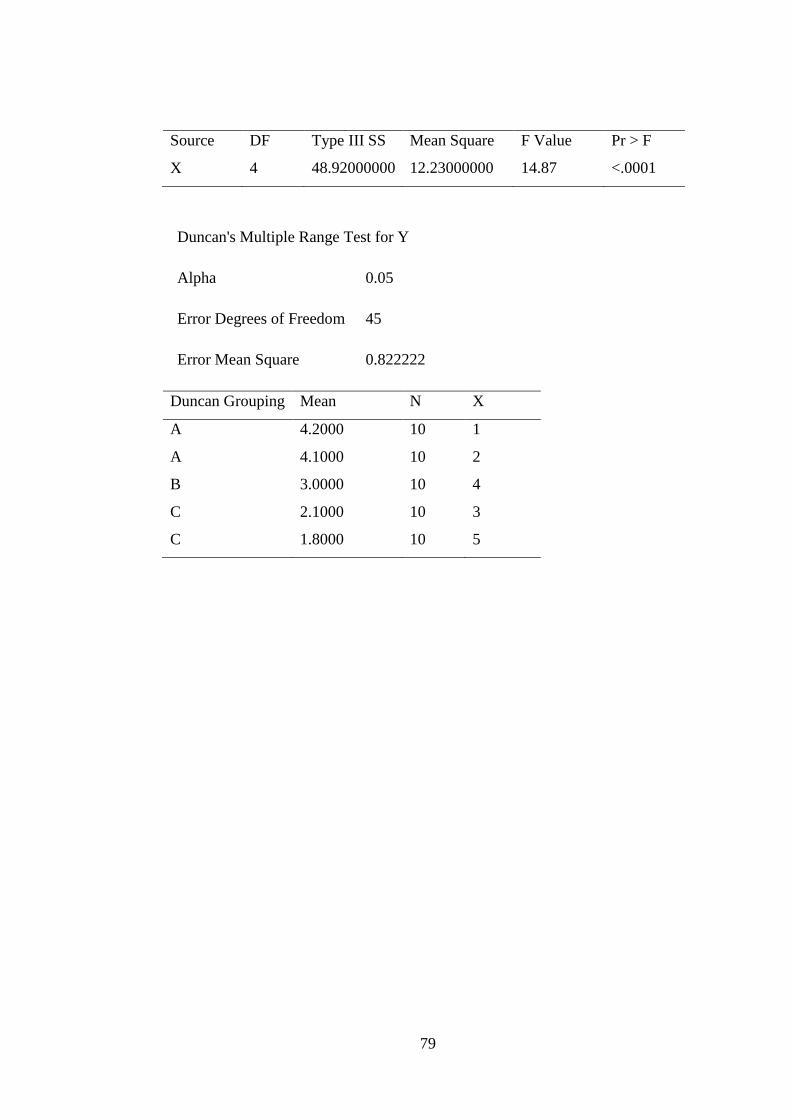
79
Source DF Type III SS Mean Square F Value Pr > F
X 4 48.92000000 12.23000000 14.87 <.0001
Duncan's Multiple Range Test for Y
Alpha 0.05
Error Degrees of Freedom 45
Error Mean Square 0.822222
Duncan Grouping Mean N X
A 4.2000 10 1
A 4.1000 10 2
B 3.0000 10 4
C 2.1000 10 3
C 1.8000 10 5

80
Table A.14 ANOVA and Duncan Single Range Test for texture acceptability
values of wafer sheets containing different types of flours in different
combinations.
Samples: 1. WF; 2.RF; 3. RF:CF 40:60; 4. RF:ChF 80:20; 5. RF:BF 60:40
1-Way ANOVA
The SAS System
The GLM Procedure
Class Level Information
Class Levels Values
X 9 1 2 3 4 5
Number of Observations Read 50
Number of Observations Used 50
Dependent Variable: Y
Source DF Sum of Squares Mean Square F Value Pr > F
Model 4 48.92000000 12.23000000 14.87 <.0001
Error 45 37.00000000 0.82222222
Corrected Total 49 85.92000000
R-Square Coeff Var Root MSE Y Mean
0.569367 29.82779 0.906765 3.040000
Source DF Type I SS Mean Square F Value Pr > F
X 4 48.92000000 12.23000000 14.87 <.0001

81
Source DF Type III SS Mean Square F Value Pr > F
X 4 48.92000000 12.23000000 14.87 <.0001
Duncan's Multiple Range Test for Y
Alpha 0.05
Error Degrees of Freedom 45
Error Mean Square 0.822222
Duncan Grouping Mean N X
A 4.2000 10 1
A 4.1000 10 3
B 3.0000 10 2
C 2.1000 10 5
C 1.8000 10 4

82
Table A.15 ANOVA and Duncan Single Range Test for taste acceptability
values of wafer sheets containing different types of flours in different
combinations.
Samples: 1. WF; 2.RF; 3. RF:CF 40:60; 4. RF:ChF 80:20; 5. RF:BF 60:40
1-Way ANOVA
The SAS System
The GLM Procedure
Class Level Information
Class Levels Values
X 9 1 2 3 4 5
Number of Observations Read 50
Number of Observations Used 50
Dependent Variable: Y
Source DF Sum of Squares Mean Square F Value Pr > F
Model 4 25.60000000 6.40000000 6.41 0.0004
Error 45 44.90000000 0.99777778
Corrected Total 49 70.50000000
R-Square Coeff Var Root MSE Y Mean
0.363121 34.44442 0.998888 2.900000
Source DF Type I SS Mean Square F Value Pr > F
X 4 25.60000000 6.40000000 6.41 0.0004

83
Source DF Type III SS Mean Square F Value Pr > F
X 4 25.60000000 6.40000000 6.41 0.0004
Duncan's Multiple Range Test for Y
Alpha 0.05
Error Degrees of Freedom 45
Error Mean Square 0.997778
Duncan Grouping Mean N X
A 4.2000 10 1
B 3.1000 10 5
B 2.6000 10 2
B 2.4000 10 4
B 2.2000 10 3

84

85
APPENDIX B
PICTURE OF BAKING MACHINE
Figure B.1 Baking machine (Franz HAAS, Vienna, Austria)