Embed Size (px)
Citation preview
Published: September 20, 2011
r 2011 American Chemical Society 13181 dx.doi.org/10.1021/jp205999p | J. Phys. Chem. B 2011, 115, 13181–13190
ARTICLE
pubs.acs.org/JPCB
Effect of Curvature on Nanoparticle Supported Lipid BilayersInvestigated by Raman SpectroscopySelver Ahmed,† Zhorro Nikolov,‡ and Stephanie L. Wunder†
†Department of Chemistry, Temple University, Philadelphia, Pennsylvania 19122, United States‡College of Engineering, Drexel University, Philadelphia, Pennsylvania 19104, United States
’ INTRODUCTION
Raman spectroscopy has frequently been used to investigatethe conformational order, packing and phase transition tem-peratures of lipid multilamellar (MLVs) and small unilamellar(SUVs) vesicles, due to the weak Raman scattering of watercompared with its strong IR absorption.1�4 The backboneskeletal (C�C) vibrations have been used as indicators of trans�gauche isomerization,5 and the CH stretching region at 2800�3100 cm�1 has been shown to be sensitive to both intra- andinterchain effects.6 The recent interest in inorganic nanoparticlesand their interaction with lipids also makes Raman scattering atechnique of choice for monitoring phase transitions, conforma-tional order and packing of lipids on supported lipid bilayers(SLBs), since materials such as silica (SiO2) also have strong IRabsorptions but are weak Raman scatterers. Planar supportedlipid bilayers have been investigated by total internal reflection(TIR) Raman spectroscopy,7 and a micro-Raman/atomic forcemicroscope (AFM) system has been developed that can measurethe Raman spectra ofmultibilayers.8 However, the high surface areaof nanoparticles significantly enhances the ability to measure theRaman spectra of lipids on these surfaces and to investigate theeffects of surface curvature.
The packing of lipids as a function of curvature is important forbiological events such as budding and fusion of cellular mem-branes, for which lipid vesicles are often used as surrogates. There
thus has been interest in the different packing of lipids on highcurvature SUVs compared with low curvature MLVs. Early workcomparing Raman spectra of MLVs and SUVs, where the latterhave smaller radii of curvature, indicated only slightly lower butbroader gel-to-liquid crystal phase transition temperatures (Tm)for the SUVs9 and greater trans�gauche isomerization for theSUVs in the gel phase, as monitored by the C�C skeletalvibrations.10,11 Further, in the 2800�3100 cm�1 spectral region,which is sensitive to both intra- and interchain effects, MLVsexhibited greater lateral packing order.10�12 Phase transitiontemperatures and enthalpies were lower for SUVs compared withtheir fusion products, large unilamellar vesicles (LUVs), both ofwhich were different than MLVs.13,14 However, SUVs fuse withtime,13,15 making it more difficult to maintain their size andmeasure size dependent effects. By contrast, nanoparticles havefixed geometries, so that it is possible to investigate the packingand order of lipids as a function of curvature.
There is some evidence that curvature can induce lipidinterdigitation,16 although interdigitation is typically broughtabout by addition of small molecules that separate the head-groups.17 For lipids on solid nanoparticle (NP) supports, as the
Received: June 26, 2011Revised: August 22, 2011
ABSTRACT:The packing of lipids on silica (SiO2) nanoparticles (NPs) was investigatedby Raman spectroscopy for 1,2-dipalmitoyl-sn-glycero-3-phosphocholine (DPPC) and1,2-distearoyl-sn-glycero-3-phosphocholine (DSPC) as a function of their size, for SiO2
NPs of 5, 15, 25, 45, and 100 nm nominal diameter. Raman spectral indicators in theC�C and C�H stretching regions were used to determine conformational order andalkyl chain packing for these systems. As the ratio of NP to lipid size decreases, packing ina normal bilayer configuration increases free volume and decreases hydrophobicinteraction between the chains. For the 15, 25, 45, and 100 nm SiO2, for which singlesupported lipid bilayers (SLBs) are formed around the NPs, the Raman data indicate thatthere is increased interdigitation and increased lateral packing order between the chainswith decreasing NP size, which improves hydrophobic association and decreases thevoids that would occur for normal bilayers. For the same size NP, there is increasedinterdigitation and lateral packing for the DSPC compared with DPPC lipids, as expectedbased on the greater void volume that would be created for the longer alkyl chain lengths. Another mechanism for filling this voidspace is the formation of gauche kinks for the terminal methyl groups at the center of the bilayer, which can be monitored by aRaman band at 1122 cm�1. These gauche defects are most prevalent for the largest size (100 nm) NPs but are observed for all NPsizes. For the 5 nm SLBs, which form aggregates, we hypothesize that bilayer bridging can occur between the NPs. Compared withthe 15 nmNPs, the order parameter increases but there are fewer trans conformers, possibly due to chains that are loosely packed orisolated in the interstitial regions.
13182 dx.doi.org/10.1021/jp205999p |J. Phys. Chem. B 2011, 115, 13181–13190
The Journal of Physical Chemistry B ARTICLE
underlying curvature increases and the nanoparticle and lipiddimensions become similar, the minimum energy configurationis not one in which the lipids form a traditional bilayer around thenanoparticles. The latter packing arrangement becomes increas-ingly unstable due to the large free volume increase if the lipidspack in a “spokes on a wheel” geometry, exposing the hydro-phobic alkyl tails to the surrounding aqueous media. One way ofmitigating this effect is for lipid interdigitation to occur, as we haveproposed using data from nanodifferential scanning calorimetry(nano-DSC).18 Lipid interdigitation has been investigated byRaman spectroscopy for glycerol induced interdigitation,19
where increased lateral order was observed for the interdigitatedstructures, and for binary mixtures of 1-stearoyl-2-caprylphospha-tidylcholine(DSPC) /dimyristoylphosphatidylcholine (DMPC),where mixed interdigitated phases (3 acyl chains/headgroup)were proposed.20 Another mechanism to fill the free volume voidis for the ends of the chains near the bilayer center to deviate froma trans configuration of the alkyl chains.
In this work, conformational order and packing are investi-gated for 1,2-dipalmitoyl-sn-glycero-3-phosphocholine (DPPC)and 1,2-distearoyl-sn-glycero-3-phosphocholine (DSPC) supportedlipid bilayers (SLBs) on monolithic silica (SiO2) nanoparticleswith nominal diameters of 5, 15, 25, 45, and 100 nm. In particular,the conformationally dependent bands in the optical skeletalregion and the bands in the methylene bending and stretchingregions that are sensitive to lateral packing order are investigated.We have paid particular attention to a vibration at 1122 cm�1,attributed to alkyl chains with a single gauche rotation ofthe terminal methyl group near the bilayer center,21 and to acomparison of lateral packing for alkyl chains both as a functionof nanoparticle size and for different length alkyl chains on thesame size SiO2.
’EXPERIMENTAL SECTION
Materials. 1,2-Dipalmitoyl-sn-glycero-3-phosphocholine(DPPC; 16:0 PC) and 1,2-distearoyl-sn-glycero-3-phosphocho-line (DSPC; 18:0 PC) were obtained from Avanti Polar Lipids(Alabaster, AL) and used without further purification. Snowtexcolloidal silica (SiO2) beads with nominal diameters of (i)4�6 nm (referred to as 5 nm), ST-XS, 20.3 wt % SiO2, lot150509, pH 9.2, specific gravity 1.135; (ii) 10�20 nm (referredto as 15 nm), ST-40, 40.8 wt% SiO2, lot 170916, pH 10.1, specificgravity 1.308; (iii) 20�30 nm (referred to as 25 nm), ST-50,47.9 wt % SiO2, lot 170418, pH 8.9, specific gravity 1.372; (iv)40�50 nm (referred to as 45 nm), ST-20 L, 20 wt % SiO2, lot170211, pH 9.5�11.0, specific gravity 1.12�1.14; and (v)100 nm, MP-1040, 40.7 wt % SiO2, lot 170425, pH 9.3, specificgravity 1.300, were kindly donated by Nissan Chemical Indus-tries, Ltd. (Japan) and used as-received. The SiO2 beads wereprepared by the water glass process and had densities of 2.2�2.6 g/cm3 (reported bymanufacturer). The beads are prepared ata specific size, in the size range given by the manufacturer. DLSand TEM data for these beads have been reported previously.18
All solutions/suspensions were prepared withHPLC grade waterand chloroform, purchased fromFisher Chemicals (Fairlawn, NJ).A 0.1M, pH 8.0 buffer was made from Na2HPO4 3 7H2O andNaH2PO4 3H2O (PBS) and 75 mM NaCl. An Avanti Mini-Extruder from Avanti Polar Lipids was used for extrusion of thelipids.Preparation of Supported Lipid Bilayers (SLBs). Appropri-
ate amounts of lipid were dissolved in chloroform. Dry lipid films
were formed after evaporation of the solutions under a stream ofnitrogen and then in a vacuum oven overnight to remove anyresidual solvent. The lipid film was redispersed in buffer andincubated at a temperature (60 �C for DPPC, 70 �C for DSPC)above the Tm of the lipids for a minimum of 2 h with periodicshaking to form hydrated multilamellar vesicles. SUVs wereobtained from MLVs by subjecting them to 5 freeze/thaw cyclesfollowed by extrusion using a polycarbonate filter with pore sizesof 50 or 100 nm. SUV sizes of∼60 and 100 nmweremeasured bydynamic light scattering (DLS).18 Approximately 1 mL of a5�10 mg/mL lipid solution was passed back and forth for up to50 times. Although a clear solution was obtained after 20 passes,the vesicles became more monodisperse as the number of passesincreased.18 Assuming no loss of lipid during the extrusionprocess, additional buffer was added to the extrusion productto yield vesicle solutions of ∼2 mg/mL lipid.Adsorption of the vesicles onto the beads to form supported
lipid bilayers was accomplished by addition of the SiO2 disper-sions to the vesicle solutions held above Tm, so that there wasapproximately at least a 2-fold, and up to a 5-fold excess of lipidnecessary to form a bilayer on the beads. Typical preparationsinvolved addition of 40�90 μL bead dispersions to 5�25 mLlipid solution. The pH of the mixture remained buffered at pH8.0. These mixtures were incubated for 2 h at 50 �C for DPPC,and 65 �C for DSPC, and then allowed to cool to roomtemperature (RT). The lipid coated beads were centrifuged at3900 rpm using a Fisher ScientificMarathon 3200 centrifuge, andthe supernate decanted. Additional water was added to the pellet,and the centrifuge/washing steps repeated 3 times. After the lastcentrifugation the pellet was redispersed in 300 μL D2O.Raman and Nano-Differential Scanning Calorimetry Data.
Raman spectroscopy analysis was performed using a micro-Raman spectrometer (Renishaw, RM 1000) with a 514.5 nmair-cooled Ar ion laser source and a 1800 lines/mm gratingpolychromator with RenCam CCD detection, providing a re-solution of 1 cm�1. The laser source was focused on the samplenanoparticle suspension through a long working distance50� objective to a spot size of approximately 2 μm diameterand the Raman signal from theMLVs, SUVs and SLBs was collec-ted in a back scattering geometry. A Linkam THMS600 heatingstage was used for temperature control with 0.1 �C accuracy ofthe nanoparticle suspensions during phase transition studies. Inthose cases Raman spectra were recorded after allowing for 10minthermal equilibrium to be achieved at every temperature point.The acquisition time for Raman spectra was between 10 and
20 min depending on the strength of the Raman signals until asatisfactory signal-to-noise ratio was achieved. It was found thatSLBs in smaller particle size suspensions, due to their highersurface areas per unit volume, produce much stronger Ramansignals. Therefore longer accumulation times were needed inthe case of suspensions of bigger diameter nanoparticles andalso when collecting spectra in the fingerprint region 650�1800 cm�1, where the band intensities were much weaker thanin the stretching region (2700�3200 cm�1). Possible laserheating effects during the Raman spectral collection were elimi-nated by limiting the argon laser power density to levels where itwas proven that the spectra are not affected by prolongedirradiation. Data analysis was performed using the RenishawWire 2.0 software.Nanodifferential scanning calorimetry (nano-DSC) measure-
ments were obtained on a TA Instruments (New Castle, DE)Nano DSC-6300. Samples were placed in the nano-DSC at RT,
13183 dx.doi.org/10.1021/jp205999p |J. Phys. Chem. B 2011, 115, 13181–13190
The Journal of Physical Chemistry B ARTICLE
cooled to 5 �C and heated/cooled from 5 to 35 at 1 �C/min. Thesecond heating scans are reported. TEM measurements weremade on a FEI Technai 12T electron microscope with anoperating voltage of 120 KeV. Images were captured using aGatan DualVision 300 (1k), side-entry cooled CCD camera.Image capture, processing and analysis were performed withGatan “Digital Micrograph” software.
’RESULTS AND DISCUSSION
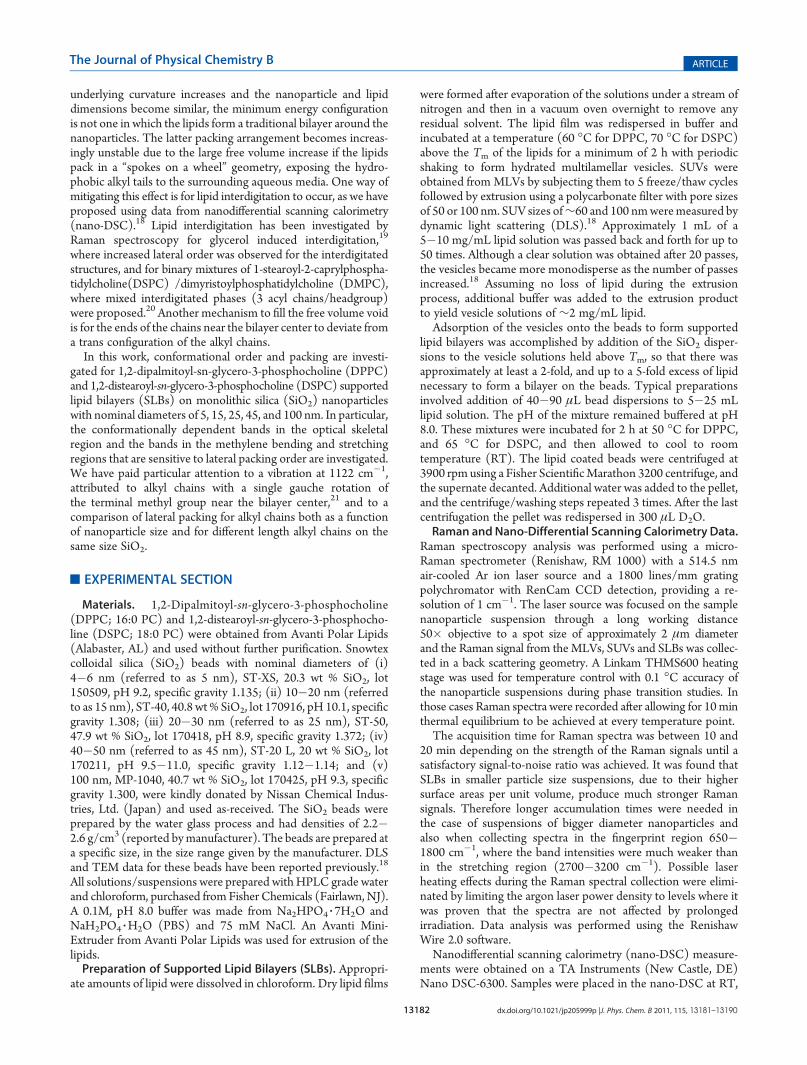
Headgroup and C�C Vibrations. The most intense head-group vibration in phosphatidyl cholines (PC) is a C�Nstretching mode, which appears between ∼714�722 cm�1,and which we observe for DPPC, DSPC MLVs, SUVs, and theirSLBs at 718�722 cm�1 (Figure 1, panels A and B). Thefrequency of this band is insensitive to any conformationalchange of the alky chains associated with melting for the MLVs,SUVs and SLBs. However, choline vibrations are sensitive to theconformation of the O�C�C�N+ backbone. The totally sym-metric stretch of C�N for the quaternary ammonium groupappears at 720 cm�1 for the gauche and at 770 cm�1 for the transconformation.22 Here, the intensity of the 720 cm�1 vibration isgreater than that of a very weak 770 cm�1 vibration in all theRaman spectra, indicating that the orientation is predominantlygauche around the O�C�C�N+ group, consistent with pre-vious observations.22
The hydrocarbon skeletal C�C stretching region, whichextends from 1000�1150 cm�1, provides the most convenientspectral region for observing changes of the acyl chains inphosphatidylcholine bilayers,3�5 although there is also a minorcontribution from the PO2
� symmetric stretch in the 1100 cm�1
region3. The ν(C�C) modes are sensitive to true gauche andtrans conformations of the methylene chain, and are much lessaffected bymethylene rotations or other bond deformations.23 Inthe current work (Figure 1, panels A and B), vibrations at 1061,1100 (DSPC) or 1096 (DPPC), consistent with the chain lengthdependence of the middle peak,24 and 1121/1127 cm�1 are
observed in the gel phase of DPPC andDSPC, and at 1065, 1087,and 1122 cm�1 in the liquid crystalline phase.Band assignments have been made for IR and Raman vibra-
tions of short and long CH3�(CH2�CH2)n�CH3 chains,where n is the number of ethylene units, using normal coordinateanalysis,25�27 and by analogy, with lipid bilayers.3 In the case ofall trans chains, the chain length independent vibrations occur at∼1064 (out-of-phase, asymmetric C�C stretch) and 1130 cm�1
(in-phase, symmetric C�C stretch).27 The 1130 cm�1 bandarises from all-trans segments,27 whereas the 1064 cm�1 band issensitive to the presence of gauche defects.28 There is also a weakmode between 1075 and 1100 cm�1 that increases with n. In thegel phase of hydrated, saturated lipids, three peaks are usuallyobserved, at 1060, 1000, and 1127 cm�1, with the assignments ofthe 1060/1127 cm�1 bands the same as for alkanes, and the1100 cm�1 band attributed to all trans chains with a single gauchedefect.24 The presence of this peak in the gel phase indicates thatDPPC (or DSPC) is never “all-trans” but possesses some gaucheconformers that have been suggested to be located at the end ofthe acyl chains, and thus at the bilayer center.24 IR CD2
substitution data combined with models of disorder in thehexagonal (rotator) phase of alkanes indicate that disorder isthe result of g-t-g0 kinks, in which the probability of occurrence isgreatest at the ends.29
Upon melting of alkane/polyethylene chains, or at the gel-to-liquid crystal transition in lipids, the intensity of the 1064 and1130 cm�1 bands decrease, and the 1100 cm�1 band shifts andmerges with a new broad intense band at 1090 cm�1, as shownhere for DPPC in the high temperature fluid phase. Thesechanges occur due to a decrease in the number of all transsegments and to the appearance of chain segments containinggauche rotations along the chain.30 Ab initio calculations indicatethat eight to ten contiguous CH2 units are required in order that asequence contribute most of its intensity to the 1064/1130 cm�1
vibrations; shorter sequences make intensity contributions tothese vibrations as well as to the 1090 cm�1 mode.31 Further, ithas been shown that intensity reduction is greater for the1130 cm�1 than for the 1060 cm�1 vibration with introductionof gauche defects;32 for example, the intensity of the 1130 cm�1
wavenumber band was reduced for alkyl chains on transitionfrom the orthorhombic to the hexagonal phase, but the decrease
Figure 1. Raman spectra at RT in the headgroup and skeletal optical(C�C stretch) region of (A)DPPCMLVs, SUVs, and SLBs on 5, 15, 25,and 45 nm SiO2, and in the melt of MLVs; and (B) DSPCMLVs, SUVs,and SLBs on 5, 15, 25, 45, and 100 nm SiO2. Dotted lines indicatespectral bands discussed in paper.
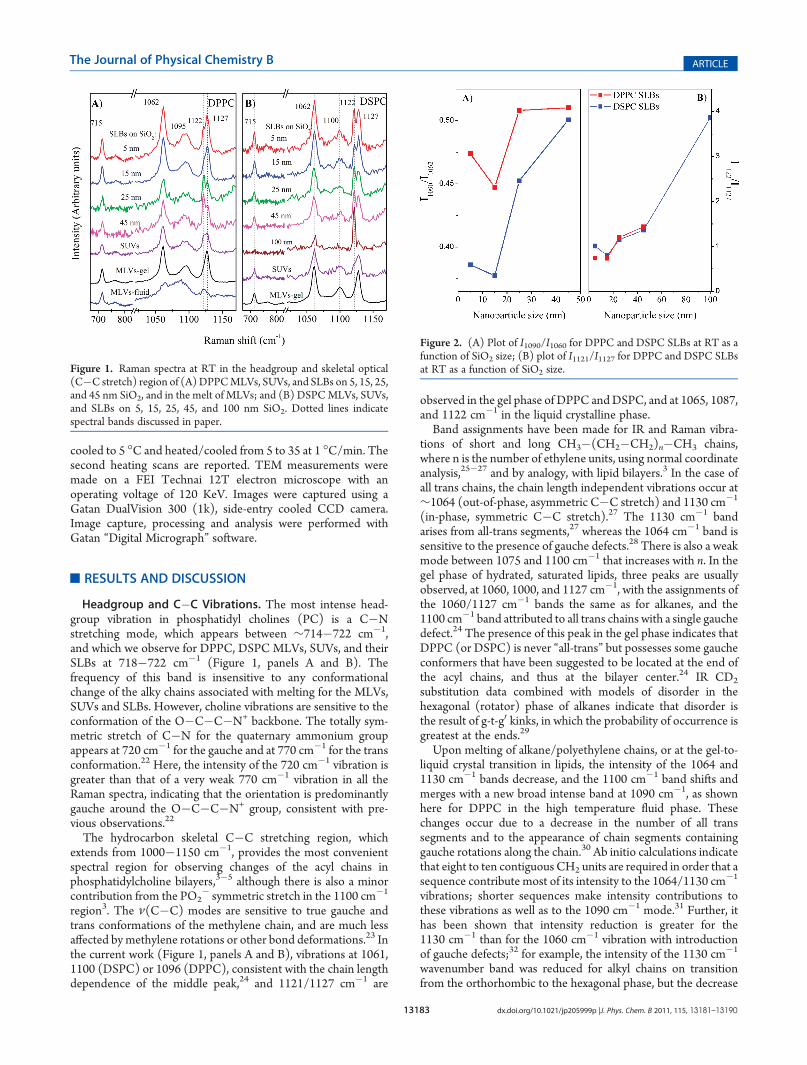
Figure 2. (A) Plot of I1090/I1060 for DPPC and DSPC SLBs at RT as afunction of SiO2 size; (B) plot of I1121/I1127 for DPPC and DSPC SLBsat RT as a function of SiO2 size.
13184 dx.doi.org/10.1021/jp205999p |J. Phys. Chem. B 2011, 115, 13181–13190
The Journal of Physical Chemistry B ARTICLE
was not linearly proportional to the number of gauche bondsintroduced, but instead resulted from a low concentration ofgauche bonds.33 MD simulations and IR data that are based onspatially localized C�C vibrations indicate that Raman spectra inthis region overestimate the number of gauche bonds.34 Further,these calculations indicate that for constrained alkyl chains inlipids compared with unconstrained alkanes, the short conforma-tional sequences are similar, but there are more long all-transsequences for the lipids.34
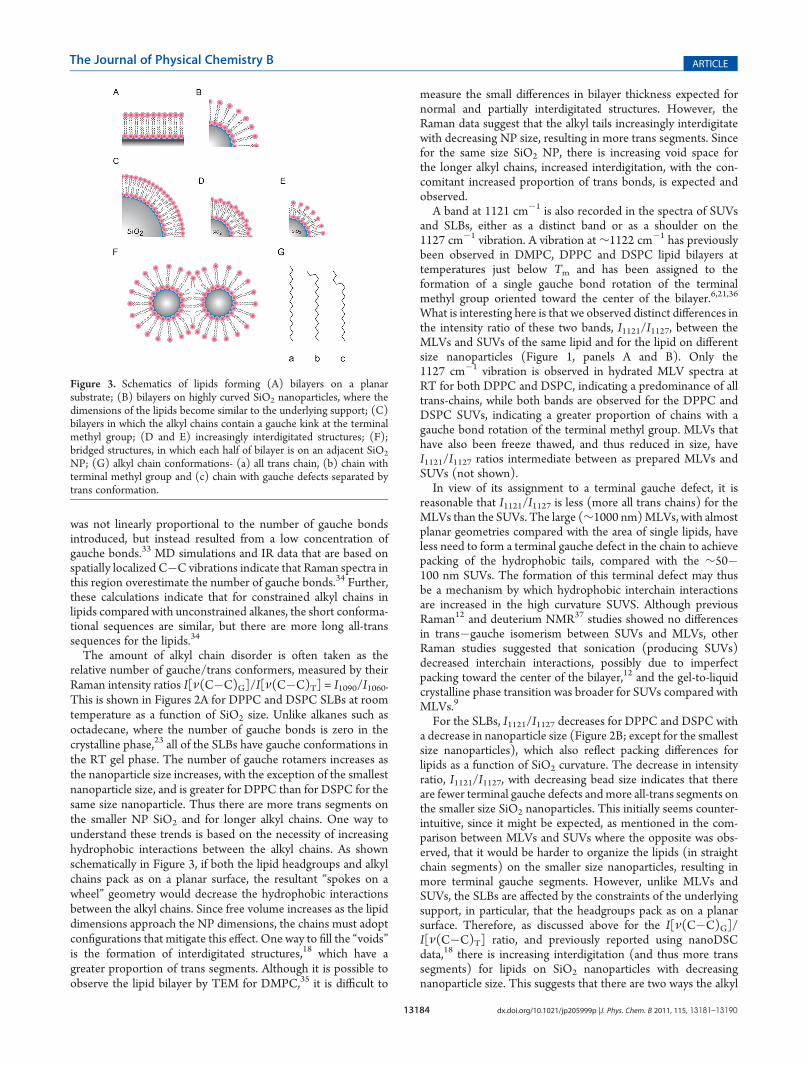
The amount of alkyl chain disorder is often taken as therelative number of gauche/trans conformers, measured by theirRaman intensity ratios I[ν(C�C)G]/I[ν(C�C)T] = I1090/I1060.This is shown in Figures 2A for DPPC and DSPC SLBs at roomtemperature as a function of SiO2 size. Unlike alkanes such asoctadecane, where the number of gauche bonds is zero in thecrystalline phase,23 all of the SLBs have gauche conformations inthe RT gel phase. The number of gauche rotamers increases asthe nanoparticle size increases, with the exception of the smallestnanoparticle size, and is greater for DPPC than for DSPC for thesame size nanoparticle. Thus there are more trans segments onthe smaller NP SiO2 and for longer alkyl chains. One way tounderstand these trends is based on the necessity of increasinghydrophobic interactions between the alkyl chains. As shownschematically in Figure 3, if both the lipid headgroups and alkylchains pack as on a planar surface, the resultant “spokes on awheel” geometry would decrease the hydrophobic interactionsbetween the alkyl chains. Since free volume increases as the lipiddimensions approach the NP dimensions, the chains must adoptconfigurations that mitigate this effect. One way to fill the “voids”is the formation of interdigitated structures,18 which have agreater proportion of trans segments. Although it is possible toobserve the lipid bilayer by TEM for DMPC,35 it is difficult to
measure the small differences in bilayer thickness expected fornormal and partially interdigitated structures. However, theRaman data suggest that the alkyl tails increasingly interdigitatewith decreasing NP size, resulting in more trans segments. Sincefor the same size SiO2 NP, there is increasing void space forthe longer alkyl chains, increased interdigitation, with the con-comitant increased proportion of trans bonds, is expected andobserved.A band at 1121 cm�1 is also recorded in the spectra of SUVs
and SLBs, either as a distinct band or as a shoulder on the1127 cm�1 vibration. A vibration at∼1122 cm�1 has previouslybeen observed in DMPC, DPPC and DSPC lipid bilayers attemperatures just below Tm and has been assigned to theformation of a single gauche bond rotation of the terminalmethyl group oriented toward the center of the bilayer.6,21,36
What is interesting here is that we observed distinct differences inthe intensity ratio of these two bands, I1121/I1127, between theMLVs and SUVs of the same lipid and for the lipid on differentsize nanoparticles (Figure 1, panels A and B). Only the1127 cm�1 vibration is observed in hydrated MLV spectra atRT for both DPPC and DSPC, indicating a predominance of alltrans-chains, while both bands are observed for the DPPC andDSPC SUVs, indicating a greater proportion of chains with agauche bond rotation of the terminal methyl group. MLVs thathave also been freeze thawed, and thus reduced in size, haveI1121/I1127 ratios intermediate between as prepared MLVs andSUVs (not shown).In view of its assignment to a terminal gauche defect, it is
reasonable that I1121/I1127 is less (more all trans chains) for theMLVs than the SUVs. The large (∼1000 nm)MLVs, with almostplanar geometries compared with the area of single lipids, haveless need to form a terminal gauche defect in the chain to achievepacking of the hydrophobic tails, compared with the ∼50�100 nm SUVs. The formation of this terminal defect may thusbe a mechanism by which hydrophobic interchain interactionsare increased in the high curvature SUVS. Although previousRaman12 and deuterium NMR37 studies showed no differencesin trans�gauche isomerism between SUVs and MLVs, otherRaman studies suggested that sonication (producing SUVs)decreased interchain interactions, possibly due to imperfectpacking toward the center of the bilayer,12 and the gel-to-liquidcrystalline phase transition was broader for SUVs compared withMLVs.9
For the SLBs, I1121/I1127 decreases for DPPC and DSPC witha decrease in nanoparticle size (Figure 2B; except for the smallestsize nanoparticles), which also reflect packing differences forlipids as a function of SiO2 curvature. The decrease in intensityratio, I1121/I1127, with decreasing bead size indicates that thereare fewer terminal gauche defects andmore all-trans segments onthe smaller size SiO2 nanoparticles. This initially seems counter-intuitive, since it might be expected, as mentioned in the com-parison between MLVs and SUVs where the opposite was obs-erved, that it would be harder to organize the lipids (in straightchain segments) on the smaller size nanoparticles, resulting inmore terminal gauche segments. However, unlike MLVs andSUVs, the SLBs are affected by the constraints of the underlyingsupport, in particular, that the headgroups pack as on a planarsurface. Therefore, as discussed above for the I[ν(C�C)G]/I[ν(C�C)T] ratio, and previously reported using nanoDSCdata,18 there is increasing interdigitation (and thus more transsegments) for lipids on SiO2 nanoparticles with decreasingnanoparticle size. This suggests that there are two ways the alkyl
Figure 3. Schematics of lipids forming (A) bilayers on a planarsubstrate; (B) bilayers on highly curved SiO2 nanoparticles, where thedimensions of the lipids become similar to the underlying support; (C)bilayers in which the alkyl chains contain a gauche kink at the terminalmethyl group; (D and E) increasingly interdigitated structures; (F);bridged structures, in which each half of bilayer is on an adjacent SiO2
NP; (G) alkyl chain conformations- (a) all trans chain, (b) chain withterminal methyl group and (c) chain with gauche defects separated bytrans conformation.
13185 dx.doi.org/10.1021/jp205999p |J. Phys. Chem. B 2011, 115, 13181–13190
The Journal of Physical Chemistry B ARTICLE
chains can increase their hydrophobic interactions when packedon solid supports, namely interdigitation, and also the formationof gauche conformers at the ends of the chain that serve to fillin the void space. The latter is more prevalent for the large sizeSiO2 NPs, as is apparent for DSPC on the 100 nm SiO2, wherethe 1121 cm�1 vibration is the most intense band in this spectralregion.CH2 Twisting/Wagging/Bending (1200�1600 cm�1) Re-
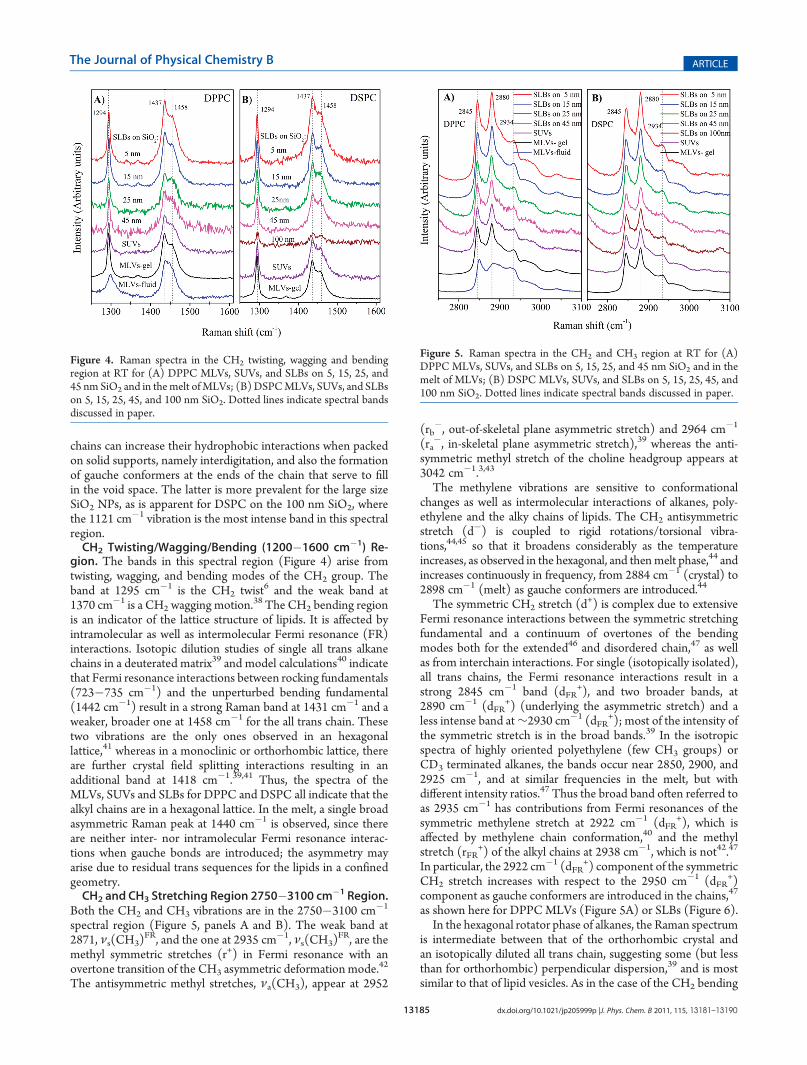
gion. The bands in this spectral region (Figure 4) arise fromtwisting, wagging, and bending modes of the CH2 group. Theband at 1295 cm�1 is the CH2 twist6 and the weak band at1370 cm�1 is a CH2 wagging motion.38 The CH2 bending regionis an indicator of the lattice structure of lipids. It is affected byintramolecular as well as intermolecular Fermi resonance (FR)interactions. Isotopic dilution studies of single all trans alkanechains in a deuterated matrix39 and model calculations40 indicatethat Fermi resonance interactions between rocking fundamentals(723�735 cm�1) and the unperturbed bending fundamental(1442 cm�1) result in a strong Raman band at 1431 cm�1 and aweaker, broader one at 1458 cm�1 for the all trans chain. Thesetwo vibrations are the only ones observed in an hexagonallattice,41 whereas in a monoclinic or orthorhombic lattice, thereare further crystal field splitting interactions resulting in anadditional band at 1418 cm�1.39,41 Thus, the spectra of theMLVs, SUVs and SLBs for DPPC and DSPC all indicate that thealkyl chains are in a hexagonal lattice. In the melt, a single broadasymmetric Raman peak at 1440 cm�1 is observed, since thereare neither inter- nor intramolecular Fermi resonance interac-tions when gauche bonds are introduced; the asymmetry mayarise due to residual trans sequences for the lipids in a confinedgeometry.CH2 and CH3 Stretching Region 2750�3100 cm�1 Region.
Both the CH2 and CH3 vibrations are in the 2750�3100 cm�1
spectral region (Figure 5, panels A and B). The weak band at2871, νs(CH3)
FR, and the one at 2935 cm�1, νs(CH3)FR, are the
methyl symmetric stretches (r+) in Fermi resonance with anovertone transition of the CH3 asymmetric deformation mode.42
The antisymmetric methyl stretches, νa(CH3), appear at 2952
(rb�, out-of-skeletal plane asymmetric stretch) and 2964 cm�1
(ra�, in-skeletal plane asymmetric stretch),39 whereas the anti-
symmetric methyl stretch of the choline headgroup appears at3042 cm�1.3,43
The methylene vibrations are sensitive to conformationalchanges as well as intermolecular interactions of alkanes, poly-ethylene and the alky chains of lipids. The CH2 antisymmetricstretch (d�) is coupled to rigid rotations/torsional vibra-tions,44,45 so that it broadens considerably as the temperatureincreases, as observed in the hexagonal, and thenmelt phase,44 andincreases continuously in frequency, from 2884 cm�1 (crystal) to2898 cm�1 (melt) as gauche conformers are introduced.44
The symmetric CH2 stretch (d+) is complex due to extensive
Fermi resonance interactions between the symmetric stretchingfundamental and a continuum of overtones of the bendingmodes both for the extended46 and disordered chain,47 as wellas from interchain interactions. For single (isotopically isolated),all trans chains, the Fermi resonance interactions result in astrong 2845 cm�1 band (dFR
+), and two broader bands, at2890 cm�1 (dFR
+) (underlying the asymmetric stretch) and aless intense band at∼2930 cm�1 (dFR
+); most of the intensity ofthe symmetric stretch is in the broad bands.39 In the isotropicspectra of highly oriented polyethylene (few CH3 groups) orCD3 terminated alkanes, the bands occur near 2850, 2900, and2925 cm�1, and at similar frequencies in the melt, but withdifferent intensity ratios.47 Thus the broad band often referred toas 2935 cm�1 has contributions from Fermi resonances of thesymmetric methylene stretch at 2922 cm�1 (dFR
+), which isaffected by methylene chain conformation,40 and the methylstretch (rFR
+) of the alkyl chains at 2938 cm�1, which is not42.47
In particular, the 2922 cm�1 (dFR+) component of the symmetric
CH2 stretch increases with respect to the 2950 cm�1 (dFR+)
component as gauche conformers are introduced in the chains,47
as shown here for DPPCMLVs (Figure 5A) or SLBs (Figure 6).In the hexagonal rotator phase of alkanes, the Raman spectrum
is intermediate between that of the orthorhombic crystal andan isotopically diluted all trans chain, suggesting some (but lessthan for orthorhombic) perpendicular dispersion,39 and is mostsimilar to that of lipid vesicles. As in the case of the CH2 bending
Figure 4. Raman spectra in the CH2 twisting, wagging and bendingregion at RT for (A) DPPC MLVs, SUVs, and SLBs on 5, 15, 25, and45 nm SiO2 and in themelt ofMLVs; (B)DSPCMLVs, SUVs, and SLBson 5, 15, 25, 45, and 100 nm SiO2. Dotted lines indicate spectral bandsdiscussed in paper.
Figure 5. Raman spectra in the CH2 and CH3 region at RT for (A)DPPC MLVs, SUVs, and SLBs on 5, 15, 25, and 45 nm SiO2 and in themelt of MLVs; (B) DSPC MLVs, SUVs, and SLBs on 5, 15, 25, 45, and100 nm SiO2. Dotted lines indicate spectral bands discussed in paper.
13186 dx.doi.org/10.1021/jp205999p |J. Phys. Chem. B 2011, 115, 13181–13190
The Journal of Physical Chemistry B ARTICLE
region, the CH stretching region indicates that the alkyl chainsare in a hexagonal packing arrangement in the MLVs, SUVs andSLBs for DPPC and DSPC.Phase Transitions of SLBs. Temperature dependent Raman
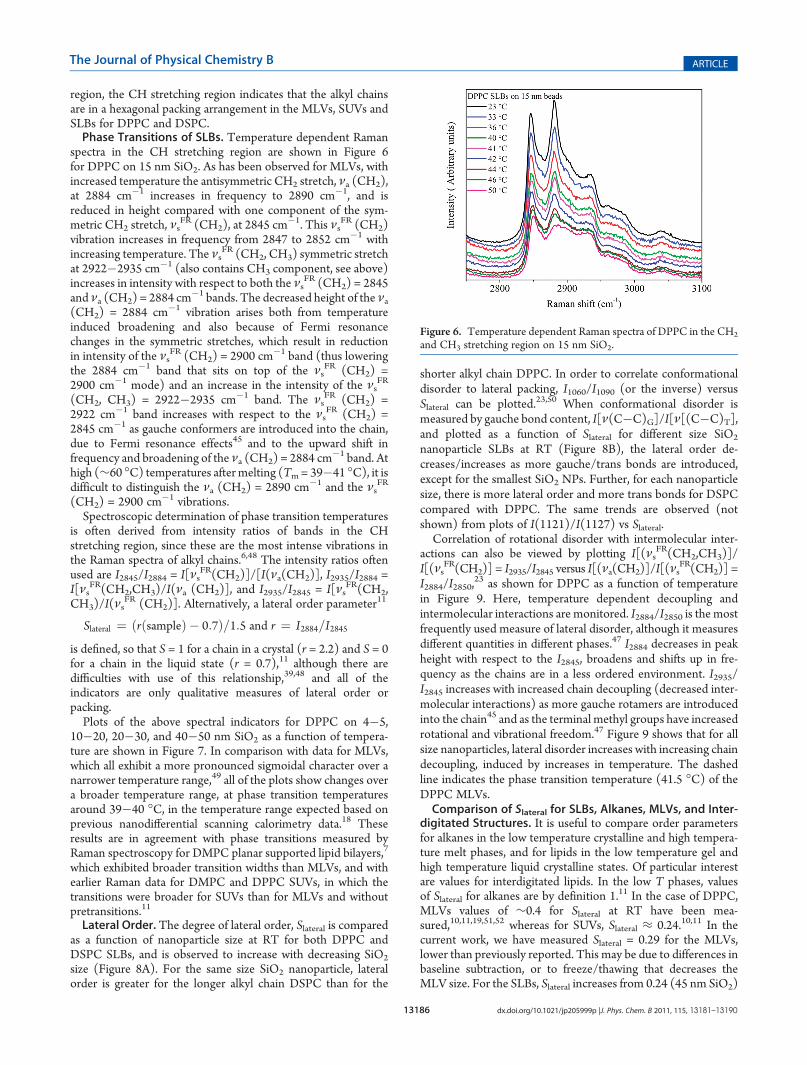
spectra in the CH stretching region are shown in Figure 6for DPPC on 15 nm SiO2. As has been observed for MLVs, withincreased temperature the antisymmetric CH2 stretch, νa (CH2),at 2884 cm�1 increases in frequency to 2890 cm�1, and isreduced in height compared with one component of the sym-metric CH2 stretch, νs
FR (CH2), at 2845 cm�1. This νs
FR (CH2)vibration increases in frequency from 2847 to 2852 cm�1 withincreasing temperature. The νs
FR (CH2, CH3) symmetric stretchat 2922�2935 cm�1 (also contains CH3 component, see above)increases in intensity with respect to both the νs
FR (CH2) = 2845and νa (CH2) = 2884 cm
�1 bands. The decreased height of the νa(CH2) = 2884 cm�1 vibration arises both from temperatureinduced broadening and also because of Fermi resonancechanges in the symmetric stretches, which result in reductionin intensity of the νs
FR (CH2) = 2900 cm�1 band (thus loweringthe 2884 cm�1 band that sits on top of the νs
FR (CH2) =2900 cm�1 mode) and an increase in the intensity of the νs
FR
(CH2, CH3) = 2922�2935 cm�1 band. The νsFR (CH2) =
2922 cm�1 band increases with respect to the νsFR (CH2) =
2845 cm�1 as gauche conformers are introduced into the chain,due to Fermi resonance effects45 and to the upward shift infrequency and broadening of the νa (CH2) = 2884 cm
�1 band. Athigh (∼60 �C) temperatures after melting (Tm= 39�41 �C), it isdifficult to distinguish the νa (CH2) = 2890 cm�1 and the νs
FR
(CH2) = 2900 cm�1 vibrations.Spectroscopic determination of phase transition temperatures
is often derived from intensity ratios of bands in the CHstretching region, since these are the most intense vibrations inthe Raman spectra of alkyl chains.6,48 The intensity ratios oftenused are I2845/I2884 = I[νs
FR(CH2)]/[I(νa(CH2)], I2935/I2884 =I[νs
FR(CH2,CH3)/I(νa (CH2)], and I2935/I2845 = I[νsFR(CH2,
CH3)/I(νsFR (CH2)]. Alternatively, a lateral order parameter11
Slateral ¼ ðrðsampleÞ � 0:7Þ=1:5 and r ¼ I2884=I2845
is defined, so that S = 1 for a chain in a crystal (r = 2.2) and S = 0for a chain in the liquid state (r = 0.7),11 although there aredifficulties with use of this relationship,39,48 and all of theindicators are only qualitative measures of lateral order orpacking.Plots of the above spectral indicators for DPPC on 4�5,
10�20, 20�30, and 40�50 nm SiO2 as a function of tempera-ture are shown in Figure 7. In comparison with data for MLVs,which all exhibit a more pronounced sigmoidal character over anarrower temperature range,49 all of the plots show changes overa broader temperature range, at phase transition temperaturesaround 39�40 �C, in the temperature range expected based onprevious nanodifferential scanning calorimetry data.18 Theseresults are in agreement with phase transitions measured byRaman spectroscopy for DMPC planar supported lipid bilayers,7
which exhibited broader transition widths than MLVs, and withearlier Raman data for DMPC and DPPC SUVs, in which thetransitions were broader for SUVs than for MLVs and withoutpretransitions.11
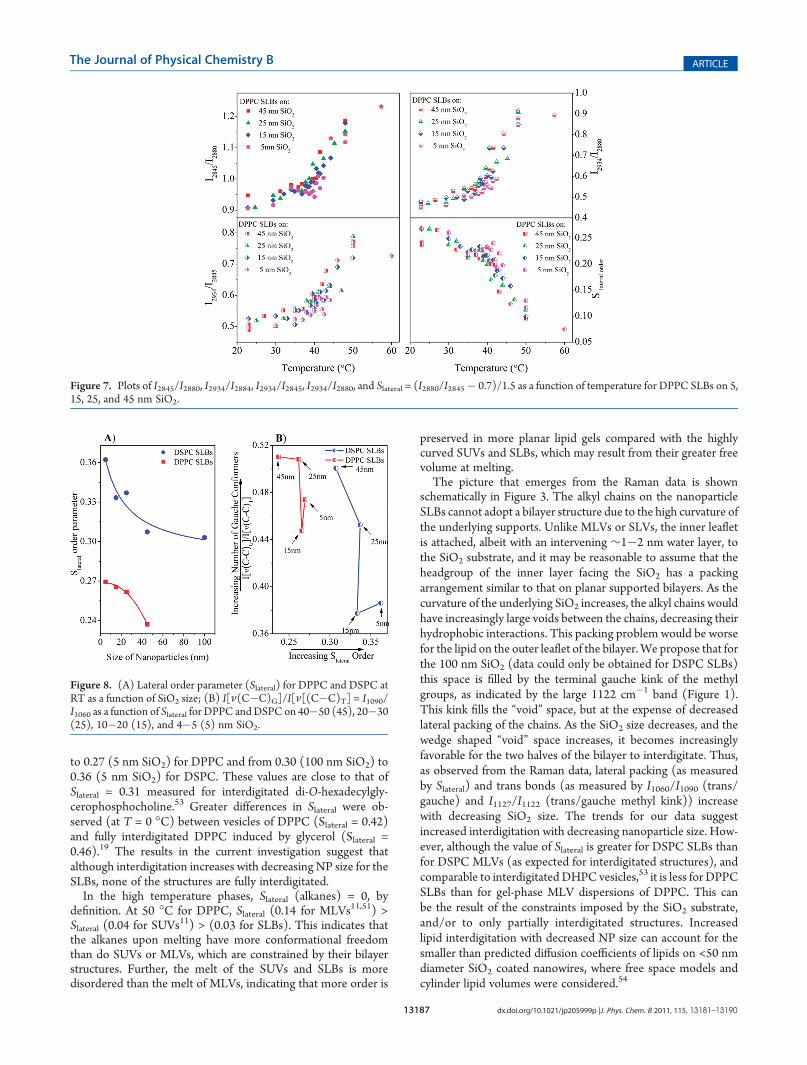
Lateral Order. The degree of lateral order, Slateral is comparedas a function of nanoparticle size at RT for both DPPC andDSPC SLBs, and is observed to increase with decreasing SiO2
size (Figure 8A). For the same size SiO2 nanoparticle, lateralorder is greater for the longer alkyl chain DSPC than for the
shorter alkyl chain DPPC. In order to correlate conformationaldisorder to lateral packing, I1060/I1090 (or the inverse) versusSlateral can be plotted.23,50 When conformational disorder ismeasured by gauche bond content, I[ν(C�C)G]/I[ν[(C�C)T],and plotted as a function of Slateral for different size SiO2
nanoparticle SLBs at RT (Figure 8B), the lateral order de-creases/increases as more gauche/trans bonds are introduced,except for the smallest SiO2 NPs. Further, for each nanoparticlesize, there is more lateral order and more trans bonds for DSPCcompared with DPPC. The same trends are observed (notshown) from plots of I(1121)/I(1127) vs Slateral.Correlation of rotational disorder with intermolecular inter-
actions can also be viewed by plotting I[(νsFR(CH2,CH3)]/
I[(νsFR(CH2)] = I2935/I2845 versus I[(νa(CH2)]/I[(νs
FR(CH2)] =I2884/I2850,
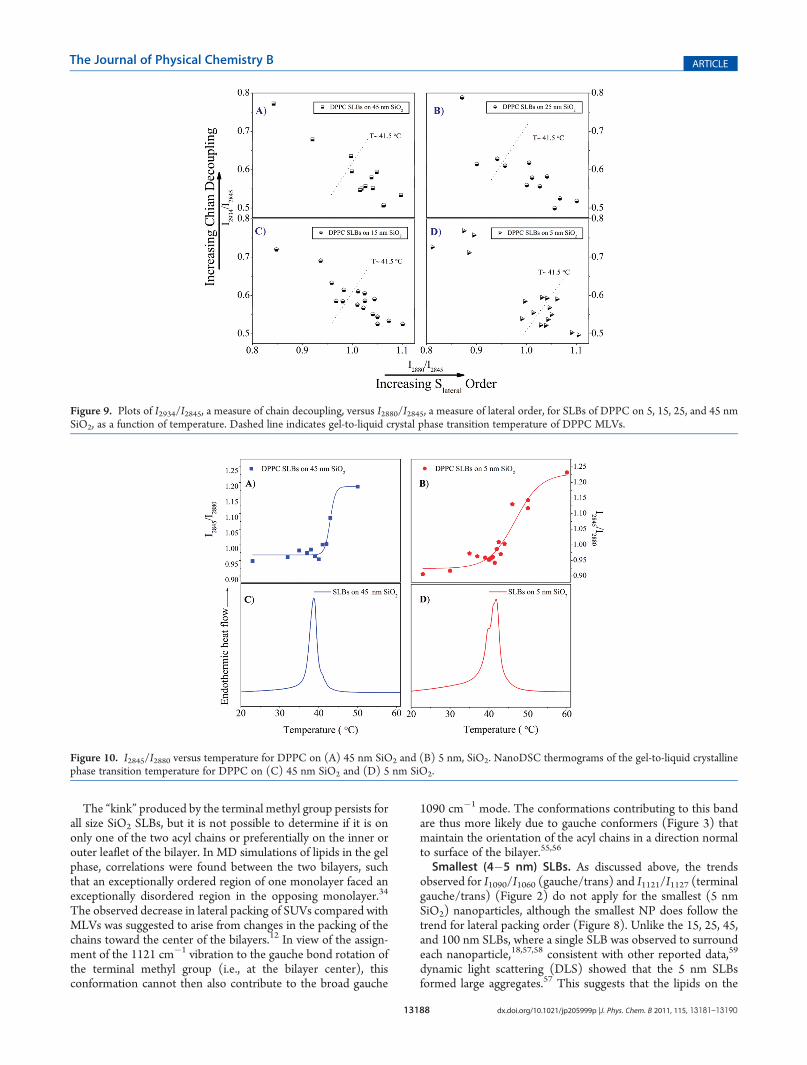
23 as shown for DPPC as a function of temperaturein Figure 9. Here, temperature dependent decoupling andintermolecular interactions are monitored. I2884/I2850 is the mostfrequently used measure of lateral disorder, although it measuresdifferent quantities in different phases.47 I2884 decreases in peakheight with respect to the I2845, broadens and shifts up in fre-quency as the chains are in a less ordered environment. I2935/I2845 increases with increased chain decoupling (decreased inter-molecular interactions) as more gauche rotamers are introducedinto the chain45 and as the terminal methyl groups have increasedrotational and vibrational freedom.47 Figure 9 shows that for allsize nanoparticles, lateral disorder increases with increasing chaindecoupling, induced by increases in temperature. The dashedline indicates the phase transition temperature (41.5 �C) of theDPPC MLVs.Comparison of Slateral for SLBs, Alkanes, MLVs, and Inter-
digitated Structures. It is useful to compare order parametersfor alkanes in the low temperature crystalline and high tempera-ture melt phases, and for lipids in the low temperature gel andhigh temperature liquid crystalline states. Of particular interestare values for interdigitated lipids. In the low T phases, valuesof Slateral for alkanes are by definition 1.11 In the case of DPPC,MLVs values of ∼0.4 for Slateral at RT have been mea-sured,10,11,19,51,52 whereas for SUVs, Slateral ≈ 0.24.10,11 In thecurrent work, we have measured Slateral = 0.29 for the MLVs,lower than previously reported. This may be due to differences inbaseline subtraction, or to freeze/thawing that decreases theMLV size. For the SLBs, Slateral increases from 0.24 (45 nm SiO2)
Figure 6. Temperature dependent Raman spectra of DPPC in the CH2
and CH3 stretching region on 15 nm SiO2.
13187 dx.doi.org/10.1021/jp205999p |J. Phys. Chem. B 2011, 115, 13181–13190
The Journal of Physical Chemistry B ARTICLE
to 0.27 (5 nm SiO2) for DPPC and from 0.30 (100 nm SiO2) to0.36 (5 nm SiO2) for DSPC. These values are close to that ofSlateral = 0.31 measured for interdigitated di-O-hexadecylgly-cerophosphocholine.53 Greater differences in Slateral were ob-served (at T = 0 �C) between vesicles of DPPC (Slateral = 0.42)and fully interdigitated DPPC induced by glycerol (Slateral =0.46).19 The results in the current investigation suggest thatalthough interdigitation increases with decreasing NP size for theSLBs, none of the structures are fully interdigitated.In the high temperature phases, Slateral (alkanes) = 0, by
definition. At 50 �C for DPPC, Slateral (0.14 for MLVs11,51) >Slateral (0.04 for SUVs11) > (0.03 for SLBs). This indicates thatthe alkanes upon melting have more conformational freedomthan do SUVs or MLVs, which are constrained by their bilayerstructures. Further, the melt of the SUVs and SLBs is moredisordered than the melt of MLVs, indicating that more order is
preserved in more planar lipid gels compared with the highlycurved SUVs and SLBs, which may result from their greater freevolume at melting.The picture that emerges from the Raman data is shown
schematically in Figure 3. The alkyl chains on the nanoparticleSLBs cannot adopt a bilayer structure due to the high curvature ofthe underlying supports. Unlike MLVs or SLVs, the inner leafletis attached, albeit with an intervening ∼1�2 nm water layer, tothe SiO2 substrate, and it may be reasonable to assume that theheadgroup of the inner layer facing the SiO2 has a packingarrangement similar to that on planar supported bilayers. As thecurvature of the underlying SiO2 increases, the alkyl chains wouldhave increasingly large voids between the chains, decreasing theirhydrophobic interactions. This packing problem would be worsefor the lipid on the outer leaflet of the bilayer.We propose that forthe 100 nm SiO2 (data could only be obtained for DSPC SLBs)this space is filled by the terminal gauche kink of the methylgroups, as indicated by the large 1122 cm�1 band (Figure 1).This kink fills the “void” space, but at the expense of decreasedlateral packing of the chains. As the SiO2 size decreases, and thewedge shaped “void” space increases, it becomes increasinglyfavorable for the two halves of the bilayer to interdigitate. Thus,as observed from the Raman data, lateral packing (as measuredby Slateral) and trans bonds (as measured by I1060/I1090 (trans/gauche) and I1127/I1122 (trans/gauche methyl kink)) increasewith decreasing SiO2 size. The trends for our data suggestincreased interdigitation with decreasing nanoparticle size. How-ever, although the value of Slateral is greater for DSPC SLBs thanfor DSPC MLVs (as expected for interdigitated structures), andcomparable to interdigitated DHPC vesicles,53 it is less for DPPCSLBs than for gel-phase MLV dispersions of DPPC. This canbe the result of the constraints imposed by the SiO2 substrate,and/or to only partially interdigitated structures. Increasedlipid interdigitation with decreased NP size can account for thesmaller than predicted diffusion coefficients of lipids on <50 nmdiameter SiO2 coated nanowires, where free space models andcylinder lipid volumes were considered.54
Figure 7. Plots of I2845/I2880, I2934/I2884, I2934/I2845, I2934/I2880, and Slateral = (I2880/I2845� 0.7)/1.5 as a function of temperature for DPPC SLBs on 5,15, 25, and 45 nm SiO2.
Figure 8. (A) Lateral order parameter (Slateral) for DPPC and DSPC atRT as a function of SiO2 size; (B) I[ν(C�C)G]/I[ν[(C�C)T] = I1090/I1060 as a function of Slateral for DPPC andDSPC on 40�50 (45), 20�30(25), 10�20 (15), and 4�5 (5) nm SiO2.
13188 dx.doi.org/10.1021/jp205999p |J. Phys. Chem. B 2011, 115, 13181–13190
The Journal of Physical Chemistry B ARTICLE
The “kink” produced by the terminal methyl group persists forall size SiO2 SLBs, but it is not possible to determine if it is ononly one of the two acyl chains or preferentially on the inner orouter leaflet of the bilayer. In MD simulations of lipids in the gelphase, correlations were found between the two bilayers, suchthat an exceptionally ordered region of one monolayer faced anexceptionally disordered region in the opposing monolayer.34
The observed decrease in lateral packing of SUVs compared withMLVs was suggested to arise from changes in the packing of thechains toward the center of the bilayers.12 In view of the assign-ment of the 1121 cm�1 vibration to the gauche bond rotation ofthe terminal methyl group (i.e., at the bilayer center), thisconformation cannot then also contribute to the broad gauche
1090 cm�1 mode. The conformations contributing to this bandare thus more likely due to gauche conformers (Figure 3) thatmaintain the orientation of the acyl chains in a direction normalto surface of the bilayer.55,56
Smallest (4�5 nm) SLBs. As discussed above, the trendsobserved for I1090/I1060 (gauche/trans) and I1121/I1127 (terminalgauche/trans) (Figure 2) do not apply for the smallest (5 nmSiO2) nanoparticles, although the smallest NP does follow thetrend for lateral packing order (Figure 8). Unlike the 15, 25, 45,and 100 nm SLBs, where a single SLB was observed to surroundeach nanoparticle,18,57,58 consistent with other reported data,59
dynamic light scattering (DLS) showed that the 5 nm SLBsformed large aggregates.57 This suggests that the lipids on the
Figure 9. Plots of I2934/I2845, a measure of chain decoupling, versus I2880/I2845, a measure of lateral order, for SLBs of DPPC on 5, 15, 25, and 45 nmSiO2, as a function of temperature. Dashed line indicates gel-to-liquid crystal phase transition temperature of DPPC MLVs.
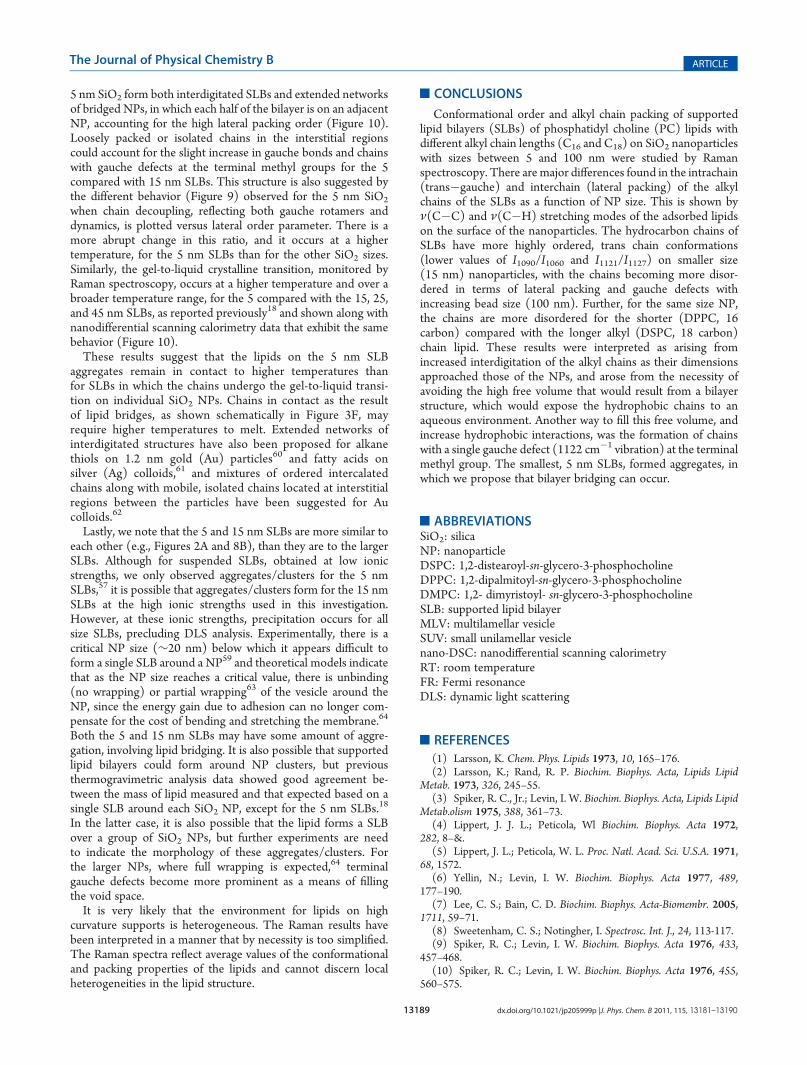
Figure 10. I2845/I2880 versus temperature for DPPC on (A) 45 nm SiO2 and (B) 5 nm, SiO2. NanoDSC thermograms of the gel-to-liquid crystallinephase transition temperature for DPPC on (C) 45 nm SiO2 and (D) 5 nm SiO2.
13189 dx.doi.org/10.1021/jp205999p |J. Phys. Chem. B 2011, 115, 13181–13190
The Journal of Physical Chemistry B ARTICLE
5 nm SiO2 form both interdigitated SLBs and extended networksof bridged NPs, in which each half of the bilayer is on an adjacentNP, accounting for the high lateral packing order (Figure 10).Loosely packed or isolated chains in the interstitial regionscould account for the slight increase in gauche bonds and chainswith gauche defects at the terminal methyl groups for the 5compared with 15 nm SLBs. This structure is also suggested bythe different behavior (Figure 9) observed for the 5 nm SiO2
when chain decoupling, reflecting both gauche rotamers anddynamics, is plotted versus lateral order parameter. There is amore abrupt change in this ratio, and it occurs at a highertemperature, for the 5 nm SLBs than for the other SiO2 sizes.Similarly, the gel-to-liquid crystalline transition, monitored byRaman spectroscopy, occurs at a higher temperature and over abroader temperature range, for the 5 compared with the 15, 25,and 45 nm SLBs, as reported previously18 and shown along withnanodifferential scanning calorimetry data that exhibit the samebehavior (Figure 10).These results suggest that the lipids on the 5 nm SLB
aggregates remain in contact to higher temperatures thanfor SLBs in which the chains undergo the gel-to-liquid transi-tion on individual SiO2 NPs. Chains in contact as the resultof lipid bridges, as shown schematically in Figure 3F, mayrequire higher temperatures to melt. Extended networks ofinterdigitated structures have also been proposed for alkanethiols on 1.2 nm gold (Au) particles60 and fatty acids onsilver (Ag) colloids,61 and mixtures of ordered intercalatedchains along with mobile, isolated chains located at interstitialregions between the particles have been suggested for Aucolloids.62
Lastly, we note that the 5 and 15 nm SLBs are more similar toeach other (e.g., Figures 2A and 8B), than they are to the largerSLBs. Although for suspended SLBs, obtained at low ionicstrengths, we only observed aggregates/clusters for the 5 nmSLBs,57 it is possible that aggregates/clusters form for the 15 nmSLBs at the high ionic strengths used in this investigation.However, at these ionic strengths, precipitation occurs for allsize SLBs, precluding DLS analysis. Experimentally, there is acritical NP size (∼20 nm) below which it appears difficult toform a single SLB around a NP59 and theoretical models indicatethat as the NP size reaches a critical value, there is unbinding(no wrapping) or partial wrapping63 of the vesicle around theNP, since the energy gain due to adhesion can no longer com-pensate for the cost of bending and stretching the membrane.64
Both the 5 and 15 nm SLBs may have some amount of aggre-gation, involving lipid bridging. It is also possible that supportedlipid bilayers could form around NP clusters, but previousthermogravimetric analysis data showed good agreement be-tween the mass of lipid measured and that expected based on asingle SLB around each SiO2 NP, except for the 5 nm SLBs.18
In the latter case, it is also possible that the lipid forms a SLBover a group of SiO2 NPs, but further experiments are needto indicate the morphology of these aggregates/clusters. Forthe larger NPs, where full wrapping is expected,64 terminalgauche defects become more prominent as a means of fillingthe void space.It is very likely that the environment for lipids on high
curvature supports is heterogeneous. The Raman results havebeen interpreted in a manner that by necessity is too simplified.The Raman spectra reflect average values of the conformationaland packing properties of the lipids and cannot discern localheterogeneities in the lipid structure.
’CONCLUSIONS
Conformational order and alkyl chain packing of supportedlipid bilayers (SLBs) of phosphatidyl choline (PC) lipids withdifferent alkyl chain lengths (C16 and C18) on SiO2 nanoparticleswith sizes between 5 and 100 nm were studied by Ramanspectroscopy. There are major differences found in the intrachain(trans�gauche) and interchain (lateral packing) of the alkylchains of the SLBs as a function of NP size. This is shown byν(C�C) and ν(C�H) stretching modes of the adsorbed lipidson the surface of the nanoparticles. The hydrocarbon chains ofSLBs have more highly ordered, trans chain conformations(lower values of I1090/I1060 and I1121/I1127) on smaller size(15 nm) nanoparticles, with the chains becoming more disor-dered in terms of lateral packing and gauche defects withincreasing bead size (100 nm). Further, for the same size NP,the chains are more disordered for the shorter (DPPC, 16carbon) compared with the longer alkyl (DSPC, 18 carbon)chain lipid. These results were interpreted as arising fromincreased interdigitation of the alkyl chains as their dimensionsapproached those of the NPs, and arose from the necessity ofavoiding the high free volume that would result from a bilayerstructure, which would expose the hydrophobic chains to anaqueous environment. Another way to fill this free volume, andincrease hydrophobic interactions, was the formation of chainswith a single gauche defect (1122 cm�1 vibration) at the terminalmethyl group. The smallest, 5 nm SLBs, formed aggregates, inwhich we propose that bilayer bridging can occur.
’ABBREVIATIONSSiO2: silicaNP: nanoparticleDSPC: 1,2-distearoyl-sn-glycero-3-phosphocholineDPPC: 1,2-dipalmitoyl-sn-glycero-3-phosphocholineDMPC: 1,2- dimyristoyl- sn-glycero-3-phosphocholineSLB: supported lipid bilayerMLV: multilamellar vesicleSUV: small unilamellar vesiclenano-DSC: nanodifferential scanning calorimetryRT: room temperatureFR: Fermi resonanceDLS: dynamic light scattering
’REFERENCES
(1) Larsson, K. Chem. Phys. Lipids 1973, 10, 165–176.(2) Larsson, K.; Rand, R. P. Biochim. Biophys. Acta, Lipids Lipid
Metab. 1973, 326, 245–55.(3) Spiker, R. C., Jr.; Levin, I. W. Biochim. Biophys. Acta, Lipids Lipid
Metab.olism 1975, 388, 361–73.(4) Lippert, J. J. L.; Peticola, Wl Biochim. Biophys. Acta 1972,
282, 8–&.(5) Lippert, J. L.; Peticola, W. L. Proc. Natl. Acad. Sci. U.S.A. 1971,
68, 1572.(6) Yellin, N.; Levin, I. W. Biochim. Biophys. Acta 1977, 489,
177–190.(7) Lee, C. S.; Bain, C. D. Biochim. Biophys. Acta-Biomembr. 2005,
1711, 59–71.(8) Sweetenham, C. S.; Notingher, I. Spectrosc. Int. J., 24, 113-117.(9) Spiker, R. C.; Levin, I. W. Biochim. Biophys. Acta 1976, 433,
457–468.(10) Spiker, R. C.; Levin, I. W. Biochim. Biophys. Acta 1976, 455,
560–575.
13190 dx.doi.org/10.1021/jp205999p |J. Phys. Chem. B 2011, 115, 13181–13190
The Journal of Physical Chemistry B ARTICLE
(11) Gaber, B. P.; Peticolas, W. L. Biochim. Biophys. Acta, Biomembr.1977, 465, 260–74.(12) Mendelsohn, R.; Sunder, S.; Bernstein, H. J. Biochim. Biophys.
Acta, Biomembr. 1976, 419, 563–9.(13) Gaber, B. P.; Sheridan, J. P. Biochim. Biophys. Acta 1982, 685,
87–93.(14) Chang, E. L.; Gaber, B. P.; Sheridan, J. P. Biophys. J. 1982, 39,
197–201.(15) Suurkuusk, J.; Lentz, B. R.; Barenholz, Y.; Biltonen, R. L.;
Thompson, T. E. Biochemistry 1976, 15, 1393–1401.(16) Boni, L. T.; Minchey, S. R.; Perkins, W. R.; Ahl, P. L.; Slater,
J. L.; Tate,M.W.; Gruner, S.M.; Janoff, A. S.Biochim. Biophys. Acta 1993,1146, 247-57.(17) Slater, J. L.; Huang, C. H. Prog. Lipid Res. 1988, 27, 325–59.(18) Ahmed, S.; Wunder, S. L. Langmuir 2009, 25, 3682–3691.(19) Oleary, T. J.; Levin, I. W. Biochim. Biophys. Acta 1984, 776,
185–189.(20) Slater, J. L.; Huang, C. H.; Levin, I. W. Biochim. Biophys. Acta
1992, 1106, 242–250.(21) Yellin, N.; Levin, I. W. Biochemistry 1977, 16, 642–647.(22) Akutsu, H. Biochemistry 1981, 20, 7359–7366.(23) Orendorff, C. J.; Ducey, M. W.; Pemberton, J. E. J. Phys. Chem.
A 2002, 106, 6991–6998.(24) Meier, R. J.; Csiszar, A.; Klumpp, E. J. Phys. Chem. B 2006, 110,
5842–5844.(25) Tasumi, M.; Shimanouchi, T. J. Mol. Spectrosc. 1962, 9,
261–&.(26) Schachtschneider, J. H.; Snyder, R. G. Spectrochim. Acta 1963,
19, 117–168.(27) Snyder, R. G.; Schachtschneider, J. H. Spectrochim. Acta 1963,
19, 85–116.(28) Levin, I. W. In Advances in Infrared and Raman Spectroscopy;
Clark, R. J. H., Hester, R. E., Eds.; Wiley Heyden: New York, 1984;Vol. 11, pp 1�48.(29) Maroncelli, M.; Strauss, H. L.; Snyder, R. G. J. Chem. Phys.
1985, 82, 2811–2824.(30) Snyder, R. G. J. Chem. Phys. 1967, 47, 1316–&.(31) Meier, R. J. Polymer 2002, 43, 517–522.(32) Koglin, E.; Meier, R. J.Comput. Theor. Polym. Sci. 1999, 9, 327–333.(33) Snyder, R. G.; Cameron, D. G.; Casal, H. L.; Compton,
D. A. C.; Mantsch, H. H. Biochim. Biophys. Acta 1982, 684, 111–116.(34) Snyder, R. G.; Tu, K. C.; Klein, M. L.; Mendelssohn, R.; Strauss,
H. L.; Sun, W. J. J. Phys. Chem. B 2002, 106, 6273–6288.(35) Savarala, S.; Monson, F.; Ilies, M. A.; Wunder, S. L. Langmuir
2011, 27, 5850–5861.(36) Lavialle, F.; Levin, I.W.;Mollay, C. Biochim. Biophys. Acta 1980,
600, 62–71.(37) Stockton, G. W.; Polnaszek, C. F.; Tulloch, A. P.; Hasan, F.;
Smith, I. C. P. Biochemistry 1976, 15, 954–966.(38) Zerbi, G.; Magni, R.; Gussoni, M.; Moritz, K. H.; Bigotto, A.;
Dirlikov, S. J. Chem. Phys. 1981, 75, 3175–3194.(39) Snyder, R. G.; Hsu, S. L.; Krimm, S. Spectrochim. Acta Part
a-Mol. Biomol. Spectrosc. 1978, 34, 395–406.(40) Abbate, S.; Zerbi, G.; Wunder, S. L. J. Phys. Chem. 1982, 86,
3140–3149.(41) Boerio, F. J.; Koenig, J. L. J. Chem. Phys. 1970, 52, 3425–&.(42) Hill, I. R.; Levin, I. W. J. Chem. Phys. 1979, 70, 842–851.(43) Macphail, R. A.; Strauss, H. L.; Snyder, R. G.; Elliger, C. A.
J. Phys. Chem. 1984, 88, 334–341.(44) Cho, Y.; Kobayashi, M.; Tadokoro, H. J. Chem. Phys. 1986,
84, 4636–4642.(45) Wunder, S. L.; Bell, M. I.; Zerbi, G. J. Chem. Phys. 1986,
85, 3827–3839.(46) Snyder, R. G.; Scherer, J. R. J. Chem. Phys. 1979, 71, 3221–3228.(47) Snyder, R. G.; Strauss, H. L.; Elliger, C. A. J. Phys. Chem. 1982,
86, 5145–5150.(48) Snyder, R. G.; Scherer, J. R.; Gaber, B. P. Biochim. Biophys. Acta
1980, 601, 47–53.
(49) Huang, C. H.; Lapides, J. R.; Levin, I.W. J. Am. Chem. Soc. 1982,104, 5926–5930.
(50) Fox, C. B.; Uibel, R. H.; Harris, J. M. J. Phys. Chem. B 2007,111, 11428–11436.
(51) Bunow, M. R.; Levin, I. W. Biochim. Biophys. Acta 1977,487, 388–394.
(52) Karvaly, B.; Loshchilova, E. Biochim. Biophys. Acta, Biomembr.1977, 470, 492–6.
(53) Lewis, E. N.; Bittman, R.; Levin, I. W. Biochim. Biophys. Acta1986, 861, 44–52.
(54) Huang, S. C. J.; Artyukhin, A. B.; Martinez, J. A.; Sirbuly, D. J.;Wang, Y.; Ju, J. W.; Stroeve, P.; Noy, A. Nano Lett. 2007, 7, 3355–3359.
(55) Liu, J.; Conboy, J. C. J. Phys. Chem. C 2007, 111, 8988–8999.(56) Seelig, A.; Seelig, J. Biochemistry 1974, 13, 4839–4845.(57) Savarala, S.; Ahmed, S.; Ilies, M. A.; Wunder, S. L. Langmuir
2010, 26, 12081–12088.(58) Savarala, S.; Ahmed, S.; Ilies, M. A.; Wunder, S. L. ACS Nano
2011, 5, 2619–2628.(59) Roiter, Y.; Ornatska, M.; Rammohan, A. R.; Balakrishnan, J.;
Heine, D. R.; Minko, S. Langmuir 2009, 25, 6287–6299.(60) Terrill, R. H.; Postlethwaite, T. A.; Chen, C. H.; Poon, C. D.;
Terzis, A.; Chen, A. D.; Hutchison, J. E.; Clark, M. R.; Wignall, G.;Londono, J. D.; Superfine, R.; Falvo, M.; Johnson, C. S.; Samulski, E. T.;Murray, R. W. J. Am. Chem. Soc. 1995, 117, 12537–12548.
(61) Patil, V.; Mayya, K. S.; Pradhan, S. D.; Sastry, M. J. Am. Chem.Soc. 1997, 119, 9281–9282.
(62) Badia, A.; Gao, W.; Singh, S.; Demers, L.; Cuccia, L.; Reven, L.Langmuir 1996, 12, 1262–1269.
(63) Fleck, C. C.; Netz, R. R. Europhys. Lett. 2004, 67, 314–320.(64) Deserno, M.; Gelbart, W. M. J. Phys. Chem. B 2002, 106,
5543–5552.