Embed Size (px)
Citation preview
ORIGINAL PAPER
Effect of Cultivar on Sensory Characteristics, ChemicalComposition, and Nutritional Value of Stoned GreenTable Olives
Ricardo Malheiro & Susana Casal & Anabela Sousa & Paula Guedes de Pinho &
António Manuel Peres & Luís Guimarães Dias & Albino Bento & José Alberto Pereira
Received: 16 July 2010 /Accepted: 18 March 2011 /Published online: 19 April 2011# Springer Science+Business Media, LLC 2011
Abstract The effect of olive cultivar on sensory characteristics,chemical composition, and nutritional value of traditionalstoned green table olives “alcaparras” was studied. Themost representative cultivars from Trás-os-Montes region,Portugal (Cv. Cobrançosa, Madural, Negrinha de Freixo,Santulhana, and Verdeal Transmontana) were studied. Theresults showed that, regardless the cultivar, water was themain constituent with values greater than 70%, followedby fat that varied between 12.5% and 20.1%. Carbohydratesamount was greater in Cv. Madural (9.2%) and thoseproduced from Cv. Cobrançosa had higher level of nitroge-nous compounds, with 1.4%. Ashes contents of table olivesvaried from 1.6% to 1.9%, without significant differencesamong cultivars. Moreover, 100 g of “alcaparras” provided
an energetic value between 154 and 212 kcal for Cv.Madural and Verdeal Transmontana, respectively. Oleic acidwas the main fatty acid detected (higher than 66.9%),followed by palmitic acid (10.8–13.3%) and linoleic acid(2.7–10.3%). A linear discriminant model was establishedbased on the “alcaparras” table olives fatty acids profile.Three fatty acids (C16:0, C18:0, and C18:3) and total saturatedfatty acids, monounsaturated fatty acids, and polyunsaturatedfatty acids contents allowed distinguishing between the fiveolive cultivars studied, with overall sensitivity and specificityof 100%. The total content of vitamin E of the table olivesvaried from 3.5 and 6.0 mg/kg (for Cv. Santulhana andNegrinha de Freixo, respectively), being α-tocopherol themost abundant. The consumer’s panel showed higherpreference for the table olives of Cv. Verdeal Transmontanaand Negrinha de Freixo, while Cv. Madural was negativelycharacterized in all the descriptors evaluated.
Keywords Olea europaea L. . Stoned table olives . Olivecultivar . Nutritional value . Fatty acids . Tocopherols
Introduction
Olive tree (Olea europaea L.) is one of the most importantfruit trees in the Mediterranean Basin and is widespreadthrough the entire region. Table olives world production isgreatly agglomerated in this same region, being nearly halfproduced in the European Union countries, mainly inSpain, Greece, Italy, and Portugal. Well-known sources ofhealthy compounds, table olives, and olive oil are importantcomponents of the Mediterranean diet, being olive oil itsmain source of external fat (Schröder 2007).
Table olives are the most popular agro-fermented foodproduct and are consumed and enjoyed throughout the
R. Malheiro :A. Sousa :A. M. Peres : L. G. Dias :A. Bento :J. A. Pereira (*)CIMO/School of Agriculture, Polytechnic Institute of Bragança,Campus de Sta Apolónia, Apartado 1171,5301-854 Bragança, Portugale-mail: [email protected]
S. CasalREQUIMTE/Departamento de Bromatologia,da Faculdade de Farmácia da Universidade do Porto,Rua Aníbal Cunha 164,4050-047 Porto, Portugal
P. G. de PinhoREQUIMTE/Departamento de Toxicologia,da Faculdade de Farmácia da Universidade do Porto,Rua Aníbal Cunha 164,4050-047 Porto, Portugal
A. M. PeresLSRE—Laboratory of Separation and Reaction Engineering,Instituto Politécnico de Bragança,Campus Sta Apolónia, Apartado 1172,5301-855 Bragança, Portugal
Food Bioprocess Technol (2012) 5:1733–1742DOI 10.1007/s11947-011-0567-x
entire world. Consumers perception of quality is improvingand nowadays an increased seek for healthier products can beobserved worldwide. Mainly composed by monounsaturatedfatty acids, table olives consumption can prevent and reducethe risk of cardiovascular diseases (Kastorini et al. 2010). Inaddition, other minor constituents like tocopherols andphenolic compounds are responsible for antioxidant andantimicrobial properties (Sousa et al. 2006), protecting theorganism from diseases in which free radicals and patho-genic microorganisms are involved, preventing also the bodyfrom certain kinds of cancer (Owen et al. 2004) andarthrosclerosis (Armstrong et al. 1997).
To achieve an edible grade, table olives are mainlyprocessed by three methods: Spanish-style green olives inbrine, Greek-style naturally black olives in brine, andCalifornian black ripe olives (Sabatini et al. 2009). Otherregional methods applied in the production of table olivesare of smaller representativeness. In Trás-os-Montes, theNortheastern region of Portugal, a regional sort of greenstoned table olives known as “alcaparras”is produced.These kind of green table olives differ from the main threekinds of preparations by the technological process. While theSpanish, Greek, and Californian styles need to be subjected tolye treatments and/or fermentations in brine, “alcaparras”table olives are only subjected to aqueous treatments. Thedifferences observed in the processes influence the chemicalcomposition of the table olives by increasing the watercontent and salt levels due to NaCl penetration in the fruit(Gómez et al., 2006), reduction of carbohydrates in the fruitdue to consumption by the microorganisms in order to obtainenergy (Kailis and Harris 2007), and the loss of minorcompounds like phenolic compounds (Brenes et al. 1995;Marsilio et al. 2001; Romero et al. 2004). Table olives“alcaparras” are being studied by our research group in thelast few years. Previous results obtained revealed that thiskind of olives contains appreciable amounts of totalphenolics, 5.58–29.88 mg GAE/g (Sousa et al. 2008), beingthe three flavonoidic compounds luteolin 7-O-glucoside,apigenin 7-O-glucoside, and luteolin identified in aqueousextracts (Sousa et al. 2006). “Alcaparras” aqueous extractsrevealed inhibition of several microorganisms that may becausal agents of human intestinal and respiratory tractinfections (Sousa et al. 2006) and appreciable antioxidantcapacity against free radicals (Sousa et al. 2008). Theseworks were carried out with commercial “alcaparras” whichare a blend of several cultivars of the Trás-os-Montes region,since producers do not take in consideration the possiblecultivar effect.
In this work, “alcaparras” were produced in laboratory,following the same traditional method used by localproducers, safeguarding the independence of five of themost representative olive cultivars of the region. To the bestof the author’s knowledge, this is the first time that the
effect of cultivar in “alcaparras” table olives chemicalcomposition, fatty acids, and tocopherols profiles as well asin the sensorial characterization is studied.
Material and Methods
Stoned Table Olives “Alcaparras” Samplingand Preparation
In this study, five of the most representative olive cultivarsfrom Trás-os-Montes region were collected during Septemberand October of 2006 from different olives groves subjected tosimilar agro-climatic conditions and agronomic practices.From each cultivar, five independent lots of olives, approxi-mately of 5 kg each, were collected and immediately trans-ported to the laboratory. At the laboratory, from each lot,approximately 2 kg of stoned table olives were prepared. Forthis, green or yellow-green healthy olive fruits were used,which were broken to separate the pulp from the stone. Thepulp was placed into water during a week, daily changed, toremove olives bitterness. After the treatment, “alcaparras”table olives were frozen at −20 °C until analysis. In the first15 days after processing, the sensorial analysis wereperformed being the table olives stored in the dark in 1.5 Lvolume glass containers and emerged in water. Each cultivarwas processed in quintuplicate.
Sensorial Evaluation
The sensorial evaluation was performed in individual cabinsilluminated with a set of fluorescent lamps. Samples werecodified with a three-digit combination and evaluated by aconsumer’s panel of 33 untrained volunteers. “Alcaparras”from each olive cultivar were evaluated using a preferencetest based on a nine-point hedonic scale (9=like extremelyand 1=dislike extremely). Aroma, flavor, consistency, andglobal appreciation were evaluated.
Chemical Analysis
Pulp Analysis
Moisture, total fat, ash, and protein contents were analyzedin triplicate, at least. Moisture analysis was determinedusing approximately 5 g per test sample at 100±2 °Cfollowing AOAC 925.40 method (1995). Total fat contentwas determined in a Soxhlet apparatus according to AOAC948.22 method, using petroleum ether as solvent with aminimum extraction time of 24 h (AOAC 2000). Theextracted fat was frozen at −20 °C for the fatty acids profiledetermination. Crude protein content was estimated by theKjeldahl method (AOAC 2000) and ash content was
1734 Food Bioprocess Technol (2012) 5:1733–1742
determined by incineration at 550±15 °C until constantweight was obtained (AOAC 2000). Carbohydrate and fibercontent was estimated by difference of the other componentsusing the following formula: carbohydrateþ fiber content ¼100%� %moistureþ%proteinþ%fatþ%ashð Þ. Energywas expressed as kilocalories, using the Atwater classicalfactors. Energy kcalð Þ ¼ 4� ðg proteinþ gcarbohydrateÞþ9� glipidð Þ.
Oil Analysis
Fatty Acid Composition For fatty acid composition, the oilextracted from total fat determination was used. Fatty acidswere evaluated as their methyl esters after alkaline trans-esterification with methanolic potassium hydroxide solution(ISO 2000) and extraction with n-heptane. The fatty acidprofile was determined with a Chrompack CP 9001 GasChromatograph equipped with a split–splitless injector, anFID detector, an autosampler Chrompack CP-9050, and a50 m×0.25 mm i.d. fused silica capillary column coatedwith a 0.19 μ film of CP-Sil 88 (Chrompack). Helium wasused as carrier gas at an internal pressure of 120 kPa. Thetemperatures of the detector and injector were 250 and230 °C, respectively. The split ratio was 1:50 and theinjected volume was of 1 μL. The results are expressed inrelative percentage of each fatty acid, calculated by internalnormalization of the chromatographic peak area (ISO 1990)eluting between myristic and lignoceric methyl esters. Acontrol sample (olive oil 47118, Supelco) and a fatty acidsmethyl esters standard mixture (Supelco 37 FAME Mix)was used for identification and calibration purposes (Sigma,Spain).
Tocopherol Composition Tocopherols were evaluated followingthe international standard ISO 9936 (2006), with somemodifications as implemented by Amaral et al. (2005).Tocopherols and tocotrienols standards (α, β, γ, and δ)were purchase from Calbiochem (La Jolla, San Diego, CA,USA) and 2-methyl-2-(4,8,12-trimethyltridecyl)chroman-6-ol(tocol) was from Matreya Inc. (Pleasant Gap, PA, USA). A50 mg amount of extracted fat was blended with anappropriate amount of internal standard (tocol) in a 1.5 mLof n-hexane and homogenized by stirring. Sample preparationwas conducted in dark and tubes containing the samples werealways wrapped in aluminum foil. The mixture was centri-fuged for 5 min at 13,000×g and the supernatant analyzed byHPLC. The liquid chromatograph consisted of a Jascointegrated system (Jasco Global, Japan) equipped with anAS-950 automated injector, a PU-980 pump, an MD-910multiwavelength diode array detector and an FP-920fluorescence detector (lexc=290 nm and lem=330 nm),connected in series. The chromatographic separation wasachieved on a Supelcosil™ LC-SI column (3 μm) 75×
3.0 mm (Supelco, Bellefonte, PA, USA), operating atconstant room temperature (21 °C). A mixture of n-hexaneand 1,4-dioxane (98:2) was used as eluent at a flow rate of0.7 mL/min. Data were analyzed with the Borwin PDAController Software (JMBS, France). Tocopherols (α, β, γ,and δ) were identified by chromatographic comparisons withauthentic standards, by co-elution, and by their UV spectra.Quantification was based on the internal standard method,using the fluorescence signal response.
Statistical Analysis
Principal Components Analysis Principal components analy-sis (PCA) was performed using the SPSS software, version17.0 (SPSS, Inc.). It was applied as an unsupervised techniquefor reducing the number of variables (21 variablescorresponding to 15 individual fatty acids and their differentfractions—saturated fatty acids (SFA), monounsaturated fattyacids (MUFA), polyunsaturated fatty acids (PUFA), and transfatty acids) to a smaller number of new derived variables(principal component or factors) that adequately summarize theoriginal information, i.e., the five olive cultivars, Cobrançosa,Madural, Negrinha de Freixo, Santulhana, and Verdeal Trans-montana. Moreover, it allowed recognizing patterns in the databy plotting them in a multidimensional space, using the newderived variables as dimensions (factor scores).
The aim of the PCA is to produce components suitableto be used as predictors or response variables in subsequentanalysis. The number of factors to keep in data treatmentwas evaluated by the Scree plot, taking into account theeigenvalues and the internal consistency by means of αCronbach’s value (Rencher 1995).
Linear Discriminant Analysis A linear discriminant analy-sis (LDA) was performed using the SPSS software, version17.0 (SPSS, Inc.). It was used as a supervised learningtechnique to classify the five olive cultivars according totheir fatty acids profile. A stepwise technique, using theWilk’s lambda method with the usual probabilities of F(3.84 to enter and 2.71 to remove), was applied for variableselection (Rencher 1995; López et al. 2008). To verifywhich canonical discriminant functions were significant,the Wilks’ lambda test was applied. To avoid overoptimisticdata modulation, a leaving-one-out cross-validation proce-dure was carried out to assess the model performance.Moreover, the sensitivity and specificity of the discriminantmodel were computed from the number of individualscorrectly predicted as belonging to an assigned group(Rencher 1995; López et al. 2008).
Analysis of Variance An analysis of variance (ANOVA)with type III sums of squares was performed using the
Food Bioprocess Technol (2012) 5:1733–1742 1735
general linear model procedure of the SPSS software,version 17.0 (SPSS, Inc.). The fulfilment of the ANOVArequirements, namely the normal distribution of theresiduals and the homogeneity of variance, were evaluatedby means of the Kolmogorov–Smirnov with Lillieforscorrection (if n>50) or the Shapiro–Wilk’s test (if n<50),and the Levene’s tests, respectively. All dependent variableswere analyzed using a one-way ANOVA with or withoutWelch correction, depending if the requirement of thehomogeneity of variances was fulfilled or not. The mainfactor studied was the effect of olive cultivar on the fattyacids profile, tocopherols content, and sensorial evaluation.If a statistical significant effect was found, means werecompared using Tukey’s honestly significant differencemultiple comparison test or Dunnett T3 test also dependingif equal variances could be assumed or not. All statisticaltests were performed at a 5% significance level.
Results and Discussions
Pulp Analysis
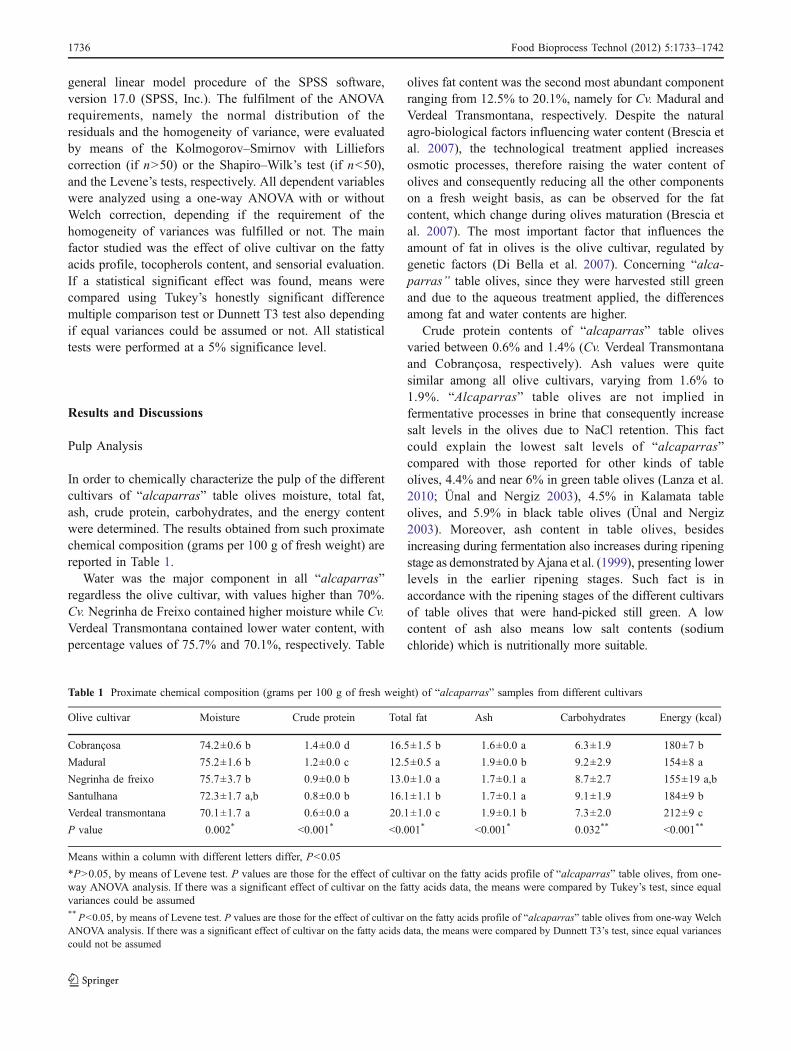
In order to chemically characterize the pulp of the differentcultivars of “alcaparras” table olives moisture, total fat,ash, crude protein, carbohydrates, and the energy contentwere determined. The results obtained from such proximatechemical composition (grams per 100 g of fresh weight) arereported in Table 1.
Water was the major component in all “alcaparras”regardless the olive cultivar, with values higher than 70%.Cv. Negrinha de Freixo contained higher moisture while Cv.Verdeal Transmontana contained lower water content, withpercentage values of 75.7% and 70.1%, respectively. Table
olives fat content was the second most abundant componentranging from 12.5% to 20.1%, namely for Cv. Madural andVerdeal Transmontana, respectively. Despite the naturalagro-biological factors influencing water content (Brescia etal. 2007), the technological treatment applied increasesosmotic processes, therefore raising the water content ofolives and consequently reducing all the other componentson a fresh weight basis, as can be observed for the fatcontent, which change during olives maturation (Brescia etal. 2007). The most important factor that influences theamount of fat in olives is the olive cultivar, regulated bygenetic factors (Di Bella et al. 2007). Concerning “alca-parras” table olives, since they were harvested still greenand due to the aqueous treatment applied, the differencesamong fat and water contents are higher.
Crude protein contents of “alcaparras” table olivesvaried between 0.6% and 1.4% (Cv. Verdeal Transmontanaand Cobrançosa, respectively). Ash values were quitesimilar among all olive cultivars, varying from 1.6% to1.9%. “Alcaparras” table olives are not implied infermentative processes in brine that consequently increasesalt levels in the olives due to NaCl retention. This factcould explain the lowest salt levels of “alcaparras”compared with those reported for other kinds of tableolives, 4.4% and near 6% in green table olives (Lanza et al.2010; Ünal and Nergiz 2003), 4.5% in Kalamata tableolives, and 5.9% in black table olives (Ünal and Nergiz2003). Moreover, ash content in table olives, besidesincreasing during fermentation also increases during ripeningstage as demonstrated byAjana et al. (1999), presenting lowerlevels in the earlier ripening stages. Such fact is inaccordance with the ripening stages of the different cultivarsof table olives that were hand-picked still green. A lowcontent of ash also means low salt contents (sodiumchloride) which is nutritionally more suitable.
Table 1 Proximate chemical composition (grams per 100 g of fresh weight) of “alcaparras” samples from different cultivars
Olive cultivar Moisture Crude protein Total fat Ash Carbohydrates Energy (kcal)
Cobrançosa 74.2±0.6 b 1.4±0.0 d 16.5±1.5 b 1.6±0.0 a 6.3±1.9 180±7 b
Madural 75.2±1.6 b 1.2±0.0 c 12.5±0.5 a 1.9±0.0 b 9.2±2.9 154±8 a
Negrinha de freixo 75.7±3.7 b 0.9±0.0 b 13.0±1.0 a 1.7±0.1 a 8.7±2.7 155±19 a,b
Santulhana 72.3±1.7 a,b 0.8±0.0 b 16.1±1.1 b 1.7±0.1 a 9.1±1.9 184±9 b
Verdeal transmontana 70.1±1.7 a 0.6±0.0 a 20.1±1.0 c 1.9±0.1 b 7.3±2.0 212±9 c
P value 0.002* <0.001* <0.001* <0.001* 0.032** <0.001**
Means within a column with different letters differ, P<0.05
*P>0.05, by means of Levene test. P values are those for the effect of cultivar on the fatty acids profile of “alcaparras” table olives, from one-way ANOVA analysis. If there was a significant effect of cultivar on the fatty acids data, the means were compared by Tukey’s test, since equalvariances could be assumed** P<0.05, by means of Levene test. P values are those for the effect of cultivar on the fatty acids profile of “alcaparras” table olives from one-way WelchANOVA analysis. If there was a significant effect of cultivar on the fatty acids data, the means were compared by Dunnett T3’s test, since equal variancescould not be assumed
1736 Food Bioprocess Technol (2012) 5:1733–1742
In this study, carbohydrate contents include fiber contentand being therefore higher than those reported for othertable olives. Kailis and Harris (2007) reported carbohy-drates contents between 8% and 12% for different rawolives, which are similar to those obtained in the presentwork for “alcaparras” table olives produced from differentcultivars. Carbohydrates content in “alcaparras” tableolives varied from 6.3% to 9.2%, respectively, for Cv.Cobrançosa and Madural.
However, these levels are higher compared with thosereported for other kinds of processed olives (5.4% in greentable olives—Lanza et al. 2010), being the total sugars andthe reducing sugars absent in the final of three distinctprocesses studied by Ünal and Nergiz (2003). Thisdifference could be explained by the technological factor.In fact, table olives that suffer fermentative processes arepractically sugar free, since the microorganisms in themedium use the reducing sugars as an energy source (Kailisand Harris 2007).
The energetic value per 100 g of “alcaparras” tableolives was accounted based on fat, protein, and estimatedcarbohydrates amounts. Cv. Madural had the lowestenergetic value (154 kcal) and Cv. Verdeal Transmontanashowed the highest one (212 kcal). The differences in the
energetic values of the “alcaparras” of the differentcultivars are related with fat content which is geneticallyregulated (Di Bella et al. 2007). This kind of table olives,compared to other potential fat sources provides lowercaloric value, which turns them nutritionally advisable.
In a general way, the results obtained for the proximatechemical composition and energetic value of the differentPortuguese cultivars of “alcaparras” table olives are inaccordance with those reported in several works carried outwith olives (Lanza et al. 2010; Ünal and Nergiz 2003)
Fatty Acids Composition
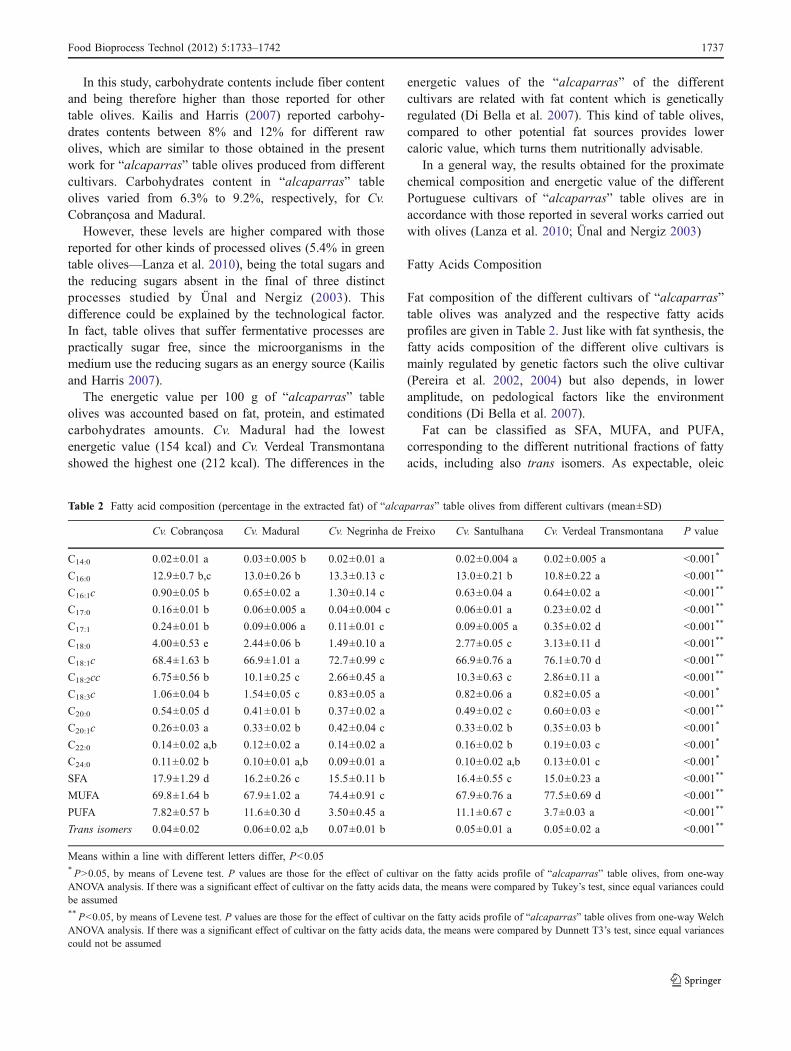
Fat composition of the different cultivars of “alcaparras”table olives was analyzed and the respective fatty acidsprofiles are given in Table 2. Just like with fat synthesis, thefatty acids composition of the different olive cultivars ismainly regulated by genetic factors such the olive cultivar(Pereira et al. 2002, 2004) but also depends, in loweramplitude, on pedological factors like the environmentconditions (Di Bella et al. 2007).
Fat can be classified as SFA, MUFA, and PUFA,corresponding to the different nutritional fractions of fattyacids, including also trans isomers. As expectable, oleic
Table 2 Fatty acid composition (percentage in the extracted fat) of “alcaparras” table olives from different cultivars (mean±SD)
Cv. Cobrançosa Cv. Madural Cv. Negrinha de Freixo Cv. Santulhana Cv. Verdeal Transmontana P value
C14:0 0.02±0.01 a 0.03±0.005 b 0.02±0.01 a 0.02±0.004 a 0.02±0.005 a <0.001*
C16:0 12.9±0.7 b,c 13.0±0.26 b 13.3±0.13 c 13.0±0.21 b 10.8±0.22 a <0.001**
C16:1c 0.90±0.05 b 0.65±0.02 a 1.30±0.14 c 0.63±0.04 a 0.64±0.02 a <0.001**
C17:0 0.16±0.01 b 0.06±0.005 a 0.04±0.004 c 0.06±0.01 a 0.23±0.02 d <0.001**
C17:1 0.24±0.01 b 0.09±0.006 a 0.11±0.01 c 0.09±0.005 a 0.35±0.02 d <0.001**
C18:0 4.00±0.53 e 2.44±0.06 b 1.49±0.10 a 2.77±0.05 c 3.13±0.11 d <0.001**
C18:1c 68.4±1.63 b 66.9±1.01 a 72.7±0.99 c 66.9±0.76 a 76.1±0.70 d <0.001**
C18:2cc 6.75±0.56 b 10.1±0.25 c 2.66±0.45 a 10.3±0.63 c 2.86±0.11 a <0.001**
C18:3c 1.06±0.04 b 1.54±0.05 c 0.83±0.05 a 0.82±0.06 a 0.82±0.05 a <0.001*
C20:0 0.54±0.05 d 0.41±0.01 b 0.37±0.02 a 0.49±0.02 c 0.60±0.03 e <0.001**
C20:1c 0.26±0.03 a 0.33±0.02 b 0.42±0.04 c 0.33±0.02 b 0.35±0.03 b <0.001*
C22:0 0.14±0.02 a,b 0.12±0.02 a 0.14±0.02 a 0.16±0.02 b 0.19±0.03 c <0.001*
C24:0 0.11±0.02 b 0.10±0.01 a,b 0.09±0.01 a 0.10±0.02 a,b 0.13±0.01 c <0.001*
SFA 17.9±1.29 d 16.2±0.26 c 15.5±0.11 b 16.4±0.55 c 15.0±0.23 a <0.001**
MUFA 69.8±1.64 b 67.9±1.02 a 74.4±0.91 c 67.9±0.76 a 77.5±0.69 d <0.001**
PUFA 7.82±0.57 b 11.6±0.30 d 3.50±0.45 a 11.1±0.67 c 3.7±0.03 a <0.001**
Trans isomers 0.04±0.02 0.06±0.02 a,b 0.07±0.01 b 0.05±0.01 a 0.05±0.02 a <0.001**
Means within a line with different letters differ, P<0.05* P>0.05, by means of Levene test. P values are those for the effect of cultivar on the fatty acids profile of “alcaparras” table olives, from one-wayANOVA analysis. If there was a significant effect of cultivar on the fatty acids data, the means were compared by Tukey’s test, since equal variances couldbe assumed** P<0.05, by means of Levene test. P values are those for the effect of cultivar on the fatty acids profile of “alcaparras” table olives from one-way WelchANOVA analysis. If there was a significant effect of cultivar on the fatty acids data, the means were compared by Dunnett T3’s test, since equal variancescould not be assumed
Food Bioprocess Technol (2012) 5:1733–1742 1737
acid (C18:1c) was the most abundant fatty acid in all“alcaparras” table olives, independently of the olivecultivar, ranging from 66.9% (Cv. Madural and Santulhana)to 76.1% (Cv. Verdeal Transmontana). This same fatty acidwas also the major one found in olive oils (around 60–80%;Maggio et al. 2009). Nutritionally, MUFA are very importantfatty acids since they can contribute to decrease theconcentration of low density lipoprotein (LDL) cholesterolin the blood and at the same time possess the capacity tomaintain or raise the concentration of high-density lipoprotein(HDL) cholesterol (Lanza et al. 2010).
Palmitic acid (C16:0) was the main SFA determined,varying from 10.8% to 13.3%, corresponding respectivelyto Cv. Verdeal Transmontana and Negrinha de Freixo.Some studies indicate that diets rich in SFA fats couldinduce cardiovascular diseases, like cardiac arrhythmia(McLennan 1993), due to the increase in the LDLcholesterol concentration in the blood. “Alcaparras” tableolives had a total SFA content lower than 17.9% (Cv.Cobrançosa).
PUFA contents varied from 3.5% (Cv. Negrinha deFreixo) to 11.6% (Cv. Madural). PUFA consumption helpsto decrease LDL cholesterol and HDL cholesterol levels inthe blood, contributing to reduce the incidence of cardiacarrhythmia (McLennan 1993). Linoleic acid, the third mostabundant fatty acid found, reported a higher varianceamong the olive cultivars varying from 2.7% to 10.3%(Cv. Negrinha de Freixo and Santulhana, respectively).
“Alcaparras” table olives have a high oleic acid content,high oleic/palmitic acid (5.1–7.1 for Cv. Madural andVerdeal Transmontana), and MUFA/SFA (3.9–5.2 Cv.Cobrançosa and Verdeal Transmontana) ratios, altogetherimportant factors indicating that moderate consumption ofthis kind of table olives associated to the Mediterranean dietcan prevent the appearance of cardiovascular diseases(Hooper et al. 2002). Moreover, the results obtained are inaccordance with those regulated for olive oil (EEC 1991).Furthermore, the fatty acids profiles in the analyzed olivecultivars are similar to those obtained in olive oils producedin the region (Pereira et al. 2002, 2004).
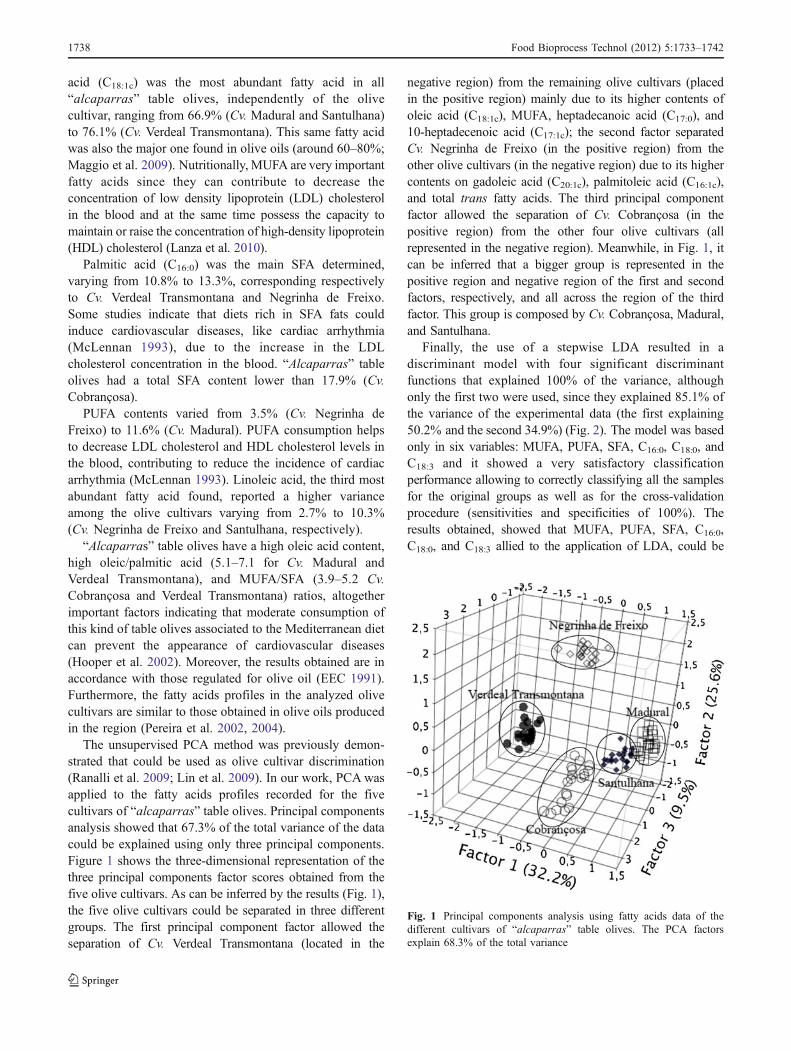
The unsupervised PCA method was previously demon-strated that could be used as olive cultivar discrimination(Ranalli et al. 2009; Lin et al. 2009). In our work, PCAwasapplied to the fatty acids profiles recorded for the fivecultivars of “alcaparras” table olives. Principal componentsanalysis showed that 67.3% of the total variance of the datacould be explained using only three principal components.Figure 1 shows the three-dimensional representation of thethree principal components factor scores obtained from thefive olive cultivars. As can be inferred by the results (Fig. 1),the five olive cultivars could be separated in three differentgroups. The first principal component factor allowed theseparation of Cv. Verdeal Transmontana (located in the
negative region) from the remaining olive cultivars (placedin the positive region) mainly due to its higher contents ofoleic acid (C18:1c), MUFA, heptadecanoic acid (C17:0), and10-heptadecenoic acid (C17:1c); the second factor separatedCv. Negrinha de Freixo (in the positive region) from theother olive cultivars (in the negative region) due to its highercontents on gadoleic acid (C20:1c), palmitoleic acid (C16:1c),and total trans fatty acids. The third principal componentfactor allowed the separation of Cv. Cobrançosa (in thepositive region) from the other four olive cultivars (allrepresented in the negative region). Meanwhile, in Fig. 1, itcan be inferred that a bigger group is represented in thepositive region and negative region of the first and secondfactors, respectively, and all across the region of the thirdfactor. This group is composed by Cv. Cobrançosa, Madural,and Santulhana.
Finally, the use of a stepwise LDA resulted in adiscriminant model with four significant discriminantfunctions that explained 100% of the variance, althoughonly the first two were used, since they explained 85.1% ofthe variance of the experimental data (the first explaining50.2% and the second 34.9%) (Fig. 2). The model was basedonly in six variables: MUFA, PUFA, SFA, C16:0, C18:0, andC18:3 and it showed a very satisfactory classificationperformance allowing to correctly classifying all the samplesfor the original groups as well as for the cross-validationprocedure (sensitivities and specificities of 100%). Theresults obtained, showed that MUFA, PUFA, SFA, C16:0,C18:0, and C18:3 allied to the application of LDA, could be
Fig. 1 Principal components analysis using fatty acids data of thedifferent cultivars of “alcaparras” table olives. The PCA factorsexplain 68.3% of the total variance
1738 Food Bioprocess Technol (2012) 5:1733–1742
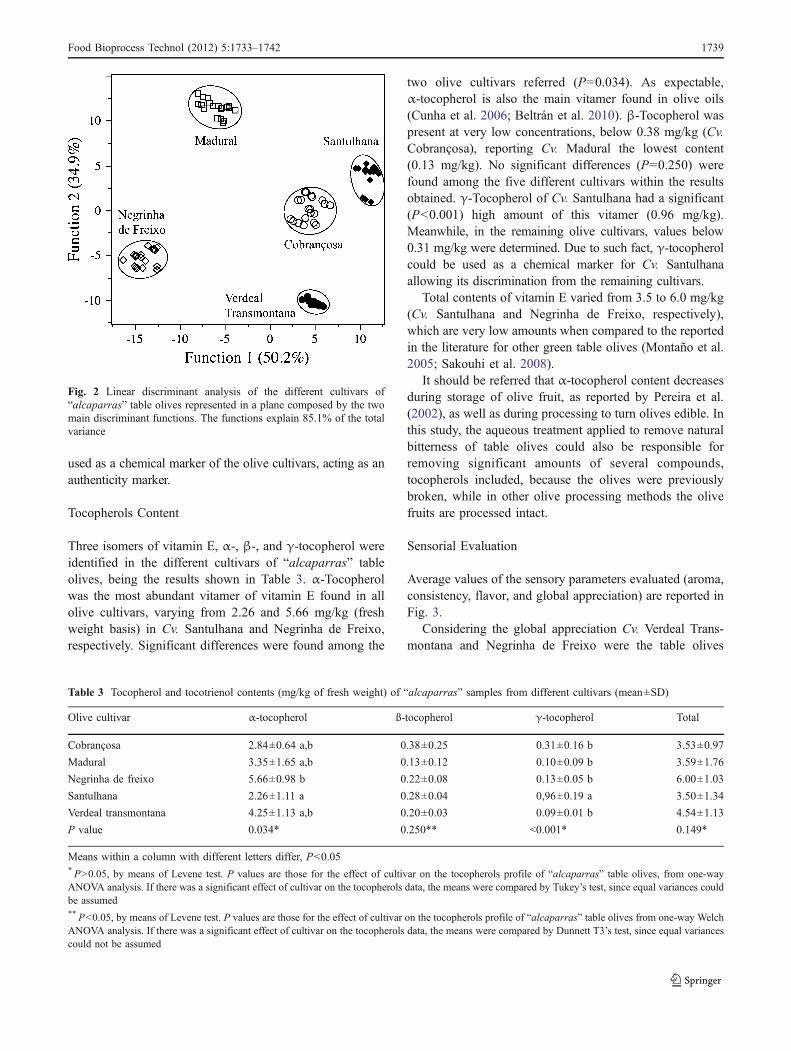
used as a chemical marker of the olive cultivars, acting as anauthenticity marker.
Tocopherols Content
Three isomers of vitamin E, α-, β-, and γ-tocopherol wereidentified in the different cultivars of “alcaparras” tableolives, being the results shown in Table 3. α-Tocopherolwas the most abundant vitamer of vitamin E found in allolive cultivars, varying from 2.26 and 5.66 mg/kg (freshweight basis) in Cv. Santulhana and Negrinha de Freixo,respectively. Significant differences were found among the
two olive cultivars referred (P=0.034). As expectable,α-tocopherol is also the main vitamer found in olive oils(Cunha et al. 2006; Beltrán et al. 2010). β-Tocopherol waspresent at very low concentrations, below 0.38 mg/kg (Cv.Cobrançosa), reporting Cv. Madural the lowest content(0.13 mg/kg). No significant differences (P=0.250) werefound among the five different cultivars within the resultsobtained. γ-Tocopherol of Cv. Santulhana had a significant(P<0.001) high amount of this vitamer (0.96 mg/kg).Meanwhile, in the remaining olive cultivars, values below0.31 mg/kg were determined. Due to such fact, γ-tocopherolcould be used as a chemical marker for Cv. Santulhanaallowing its discrimination from the remaining cultivars.
Total contents of vitamin E varied from 3.5 to 6.0 mg/kg(Cv. Santulhana and Negrinha de Freixo, respectively),which are very low amounts when compared to the reportedin the literature for other green table olives (Montaño et al.2005; Sakouhi et al. 2008).
It should be referred that α-tocopherol content decreasesduring storage of olive fruit, as reported by Pereira et al.(2002), as well as during processing to turn olives edible. Inthis study, the aqueous treatment applied to remove naturalbitterness of table olives could also be responsible forremoving significant amounts of several compounds,tocopherols included, because the olives were previouslybroken, while in other olive processing methods the olivefruits are processed intact.
Sensorial Evaluation
Average values of the sensory parameters evaluated (aroma,consistency, flavor, and global appreciation) are reported inFig. 3.
Considering the global appreciation Cv. Verdeal Trans-montana and Negrinha de Freixo were the table olives
Table 3 Tocopherol and tocotrienol contents (mg/kg of fresh weight) of “alcaparras” samples from different cultivars (mean±SD)
Olive cultivar α-tocopherol ß-tocopherol γ-tocopherol Total
Cobrançosa 2.84±0.64 a,b 0.38±0.25 0.31±0.16 b 3.53±0.97
Madural 3.35±1.65 a,b 0.13±0.12 0.10±0.09 b 3.59±1.76
Negrinha de freixo 5.66±0.98 b 0.22±0.08 0.13±0.05 b 6.00±1.03
Santulhana 2.26±1.11 a 0.28±0.04 0,96±0.19 a 3.50±1.34
Verdeal transmontana 4.25±1.13 a,b 0.20±0.03 0.09±0.01 b 4.54±1.13
P value 0.034* 0.250** <0.001* 0.149*
Means within a column with different letters differ, P<0.05* P>0.05, by means of Levene test. P values are those for the effect of cultivar on the tocopherols profile of “alcaparras” table olives, from one-wayANOVA analysis. If there was a significant effect of cultivar on the tocopherols data, the means were compared by Tukey’s test, since equal variances couldbe assumed** P<0.05, by means of Levene test. P values are those for the effect of cultivar on the tocopherols profile of “alcaparras” table olives from one-way WelchANOVA analysis. If there was a significant effect of cultivar on the tocopherols data, the means were compared by Dunnett T3’s test, since equal variancescould not be assumed
Fig. 2 Linear discriminant analysis of the different cultivars of“alcaparras” table olives represented in a plane composed by the twomain discriminant functions. The functions explain 85.1% of the totalvariance
Food Bioprocess Technol (2012) 5:1733–1742 1739
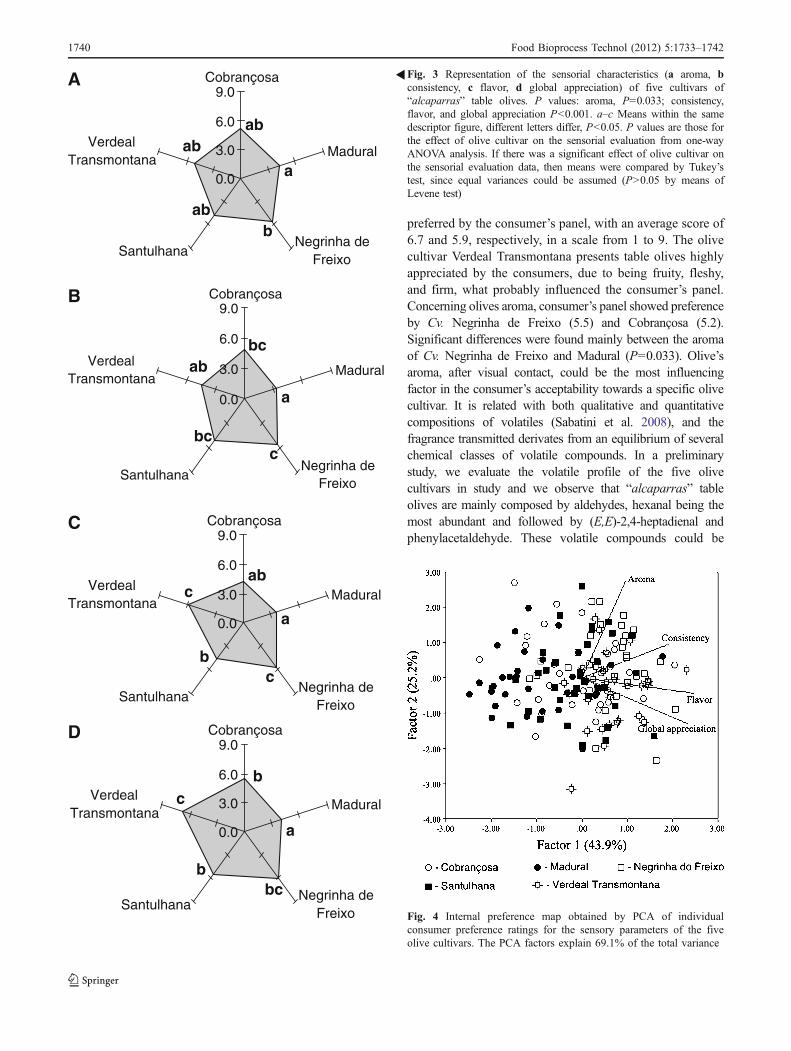
preferred by the consumer’s panel, with an average score of6.7 and 5.9, respectively, in a scale from 1 to 9. The olivecultivar Verdeal Transmontana presents table olives highlyappreciated by the consumers, due to being fruity, fleshy,and firm, what probably influenced the consumer’s panel.Concerning olives aroma, consumer’s panel showed preferenceby Cv. Negrinha de Freixo (5.5) and Cobrançosa (5.2).Significant differences were found mainly between the aromaof Cv. Negrinha de Freixo and Madural (P=0.033). Olive’saroma, after visual contact, could be the most influencingfactor in the consumer’s acceptability towards a specific olivecultivar. It is related with both qualitative and quantitativecompositions of volatiles (Sabatini et al. 2008), and thefragrance transmitted derivates from an equilibrium of severalchemical classes of volatile compounds. In a preliminarystudy, we evaluate the volatile profile of the five olivecultivars in study and we observe that “alcaparras” tableolives are mainly composed by aldehydes, hexanal being themost abundant and followed by (E,E)-2,4-heptadienal andphenylacetaldehyde. These volatile compounds could be
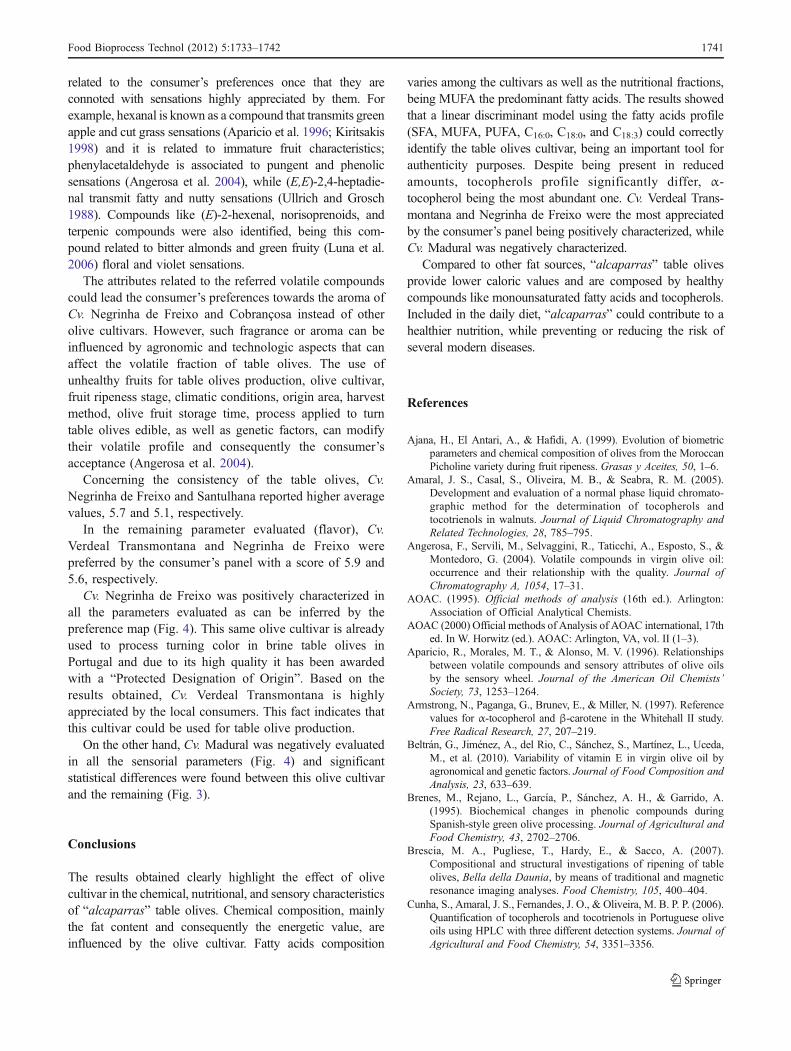
Fig. 4 Internal preference map obtained by PCA of individualconsumer preference ratings for the sensory parameters of the fiveolive cultivars. The PCA factors explain 69.1% of the total variance
Fig. 3 Representation of the sensorial characteristics (a aroma, bconsistency, c flavor, d global appreciation) of five cultivars of“alcaparras” table olives. P values: aroma, P=0.033; consistency,flavor, and global appreciation P<0.001. a–c Means within the samedescriptor figure, different letters differ, P<0.05. P values are those forthe effect of olive cultivar on the sensorial evaluation from one-wayANOVA analysis. If there was a significant effect of olive cultivar onthe sensorial evaluation data, then means were compared by Tukey’stest, since equal variances could be assumed (P>0.05 by means ofLevene test)
A
0.0
3.0
6.0
9.0Cobrançosa
Madural
Negrinha deFreixo
Santulhana
VerdealTransmontana
ab
a
ab
ab
b
B
0.0
3.0
6.0
9.0Cobrançosa
Madural
Negrinha deFreixo
Santulhana
VerdealTransmontana
c
a
bc
bc ab
D
0.0
3.0
6.0
9.0Cobrançosa
Madural
Negrinha deFreixo
Santulhana
VerdealTransmontana
bc
c
b
b
a
C
0.0
3.0
6.0
9.0Cobrançosa
Madural
Negrinha deFreixo
Santulhana
VerdealTransmontana
c
c
a
ab
b
�
1740 Food Bioprocess Technol (2012) 5:1733–1742
related to the consumer’s preferences once that they areconnoted with sensations highly appreciated by them. Forexample, hexanal is known as a compound that transmits greenapple and cut grass sensations (Aparicio et al. 1996; Kiritsakis1998) and it is related to immature fruit characteristics;phenylacetaldehyde is associated to pungent and phenolicsensations (Angerosa et al. 2004), while (E,E)-2,4-heptadie-nal transmit fatty and nutty sensations (Ullrich and Grosch1988). Compounds like (E)-2-hexenal, norisoprenoids, andterpenic compounds were also identified, being this com-pound related to bitter almonds and green fruity (Luna et al.2006) floral and violet sensations.
The attributes related to the referred volatile compoundscould lead the consumer’s preferences towards the aroma ofCv. Negrinha de Freixo and Cobrançosa instead of otherolive cultivars. However, such fragrance or aroma can beinfluenced by agronomic and technologic aspects that canaffect the volatile fraction of table olives. The use ofunhealthy fruits for table olives production, olive cultivar,fruit ripeness stage, climatic conditions, origin area, harvestmethod, olive fruit storage time, process applied to turntable olives edible, as well as genetic factors, can modifytheir volatile profile and consequently the consumer’sacceptance (Angerosa et al. 2004).
Concerning the consistency of the table olives, Cv.Negrinha de Freixo and Santulhana reported higher averagevalues, 5.7 and 5.1, respectively.
In the remaining parameter evaluated (flavor), Cv.Verdeal Transmontana and Negrinha de Freixo werepreferred by the consumer’s panel with a score of 5.9 and5.6, respectively.
Cv. Negrinha de Freixo was positively characterized inall the parameters evaluated as can be inferred by thepreference map (Fig. 4). This same olive cultivar is alreadyused to process turning color in brine table olives inPortugal and due to its high quality it has been awardedwith a “Protected Designation of Origin”. Based on theresults obtained, Cv. Verdeal Transmontana is highlyappreciated by the local consumers. This fact indicates thatthis cultivar could be used for table olive production.
On the other hand, Cv. Madural was negatively evaluatedin all the sensorial parameters (Fig. 4) and significantstatistical differences were found between this olive cultivarand the remaining (Fig. 3).
Conclusions
The results obtained clearly highlight the effect of olivecultivar in the chemical, nutritional, and sensory characteristicsof “alcaparras” table olives. Chemical composition, mainlythe fat content and consequently the energetic value, areinfluenced by the olive cultivar. Fatty acids composition
varies among the cultivars as well as the nutritional fractions,being MUFA the predominant fatty acids. The results showedthat a linear discriminant model using the fatty acids profile(SFA, MUFA, PUFA, C16:0, C18:0, and C18:3) could correctlyidentify the table olives cultivar, being an important tool forauthenticity purposes. Despite being present in reducedamounts, tocopherols profile significantly differ, α-tocopherol being the most abundant one. Cv. Verdeal Trans-montana and Negrinha de Freixo were the most appreciatedby the consumer’s panel being positively characterized, whileCv. Madural was negatively characterized.
Compared to other fat sources, “alcaparras” table olivesprovide lower caloric values and are composed by healthycompounds like monounsaturated fatty acids and tocopherols.Included in the daily diet, “alcaparras” could contribute to ahealthier nutrition, while preventing or reducing the risk ofseveral modern diseases.
References
Ajana, H., El Antari, A., & Hafidi, A. (1999). Evolution of biometricparameters and chemical composition of olives from the MoroccanPicholine variety during fruit ripeness. Grasas y Aceites, 50, 1–6.
Amaral, J. S., Casal, S., Oliveira, M. B., & Seabra, R. M. (2005).Development and evaluation of a normal phase liquid chromato-graphic method for the determination of tocopherols andtocotrienols in walnuts. Journal of Liquid Chromatography andRelated Technologies, 28, 785–795.
Angerosa, F., Servili, M., Selvaggini, R., Taticchi, A., Esposto, S., &Montedoro, G. (2004). Volatile compounds in virgin olive oil:occurrence and their relationship with the quality. Journal ofChromatography A, 1054, 17–31.
AOAC. (1995). Official methods of analysis (16th ed.). Arlington:Association of Official Analytical Chemists.
AOAC (2000) Official methods of Analysis of AOAC international, 17thed. In W. Horwitz (ed.). AOAC: Arlington, VA, vol. II (1–3).
Aparicio, R., Morales, M. T., & Alonso, M. V. (1996). Relationshipsbetween volatile compounds and sensory attributes of olive oilsby the sensory wheel. Journal of the American Oil Chemists’Society, 73, 1253–1264.
Armstrong, N., Paganga, G., Brunev, E., & Miller, N. (1997). Referencevalues for α-tocopherol and β-carotene in the Whitehall II study.Free Radical Research, 27, 207–219.
Beltrán, G., Jiménez, A., del Rio, C., Sánchez, S., Martínez, L., Uceda,M., et al. (2010). Variability of vitamin E in virgin olive oil byagronomical and genetic factors. Journal of Food Composition andAnalysis, 23, 633–639.
Brenes, M., Rejano, L., García, P., Sánchez, A. H., & Garrido, A.(1995). Biochemical changes in phenolic compounds duringSpanish-style green olive processing. Journal of Agricultural andFood Chemistry, 43, 2702–2706.
Brescia, M. A., Pugliese, T., Hardy, E., & Sacco, A. (2007).Compositional and structural investigations of ripening of tableolives, Bella della Daunia, by means of traditional and magneticresonance imaging analyses. Food Chemistry, 105, 400–404.
Cunha, S., Amaral, J. S., Fernandes, J. O., & Oliveira, M. B. P. P. (2006).Quantification of tocopherols and tocotrienols in Portuguese oliveoils using HPLC with three different detection systems. Journal ofAgricultural and Food Chemistry, 54, 3351–3356.
Food Bioprocess Technol (2012) 5:1733–1742 1741
Di Bella, G., Maisano, R., La Pera, L., Lo Turco, V., Salvo, F., & Dugo,G. (2007). Statistical characterization of Sicilian olive oils from thePelotirana and Maghrebian zones according to the fatty acid profile.Journal of Agricultural and Food Chemistry, 55, 6568–6574.
Gómez, A. H. S., García, P. G., & Navarro, L. R. (2006). Trends intable olives production. Elaboration of table olives. Grasas yAceites, 57, 86–94.
Hooper, L., Bartlett, C., Smith, G. D., & Ebrahim, S. (2002).Systematic review of long term effects of advice to reducedietary salt in adults. British Medical Journal, 325, 628–632.
ISO 5508 (1990). Animal and vegetable fats and oils. Analysis by gaschromatography of methyl esters of fatty acids.
ISO 5509 (2000) Animal and vegetable fats and oils—preparation ofmethyl esters of fatty acids.
ISO 9936 (2006) Animal and vegetable fats and oils—determinationof tocopherol and tocotrienol contents by high-performanceliquid chromatography.
Kailis, S., & Harris, D. (2007). Producing table olives. Collingwood:Landlinks Press.
Kastorini, C. M., Milionis, H. J., Goudevenos, J. A., & Panagiotakos,D. B. (2010). Mediterranean diet and coronary heart disease: isobesity a link?—a systematic review. Nutrition, Metabolism, andCardiovascular Diseases, 20, 536–551.
Kiritsakis, A. K. (1998). Flavor components of olive oil—a review.Journal of the American Oil Chemists’ Society, 75, 673–681.
Lanza, B., Di Serio, M. G., Iannucci, E., Russi, F., & Marfisi, P.(2010). Nutritional, textural and sensorial characterisation ofItalian table olives (Olea europaea L. cv. ‘Intosso d’Abruzzo’).International Journal of Food Science & Technology, 45, 67–74.
Lin, P., Chen, Y., & He, Y. (2009). Identification of geographicalorigin of olive oil using visible and near-infrared spectroscopytechnique combined with chemometrics. Food Bioprocess andTechnology. doi:10.1007/s11947-009-0302-z.
López, A., García, P., & Garrido, A. (2008). Multivariate characterizationof table olives according to their mineral nutrient composition. FoodChemistry, 106, 369–378.
Luna, G., Morales, M. T., & Aparicio, R. (2006). Characterisation of39 varietal virgin olive oils by their volatile compositions. FoodChemistry, 98, 243–252.
Maggio, R. M., Kaufman, T. S., Del Carlo, M., Cerretani, L., Bendini,A., Cichelli, A., et al. (2009). Monitoring of fatty acidcomposition in virgin olive oil by Fourier transformed infraredspectroscopy coupled with partial least squares. Food Chemistry,114, 1549–1554.
Marsilio, V., Campestre, C., & Lanza, B. (2001). Phenolic compoundschange during California-style ripe olives processing. FoodChemistry, 74, 55–60.
McLennan, P. L. (1993). Relative effects of dietary saturated,monounsaturated, and polyunsaturated fatty acids on cardiacarrhythmias in rats. The American Journal of Clinical Nutrition,57, 207–212.
Montaño, A., Casado, F. J., Castro, A., Sánchez, A. H., & Rejano, L.(2005). Influence of processing, storage time, and pasteurizationupon the tocopherol and amino acid contents of treated green
table olives. European Food Research and Technology, 220,255–260.
Owen, R. W., Haubner, R., Würtele, G., Hull, W. E., Spiegelhalder, B., &Bartsch, H. (2004). Olives and olive oil in cancer prevention.European Journal of Cancer Prevention, 13, 319–326.
Pereira, J. A., Casal, S., Bento, A., & Oliveira, M. B. P. P. (2002).Influence of olive storage period on oil quality of threePortuguese cultivars of Olea europea, Cobrançosa, Madural andVerdeal Transmontana. Journal of Agricultural and FoodChemistry, 50, 6335–6340.
Pereira, J. A., Alves, R., Casal, S., & Oliveira, M. B. P. P. (2004).Effect of olive fruit fly infestation on the quality of olive oil fromcultivars Cobrançosa, Madural and Verdeal Transmontana.Italian Journal of Food Science, 16, 355–365.
Ranalli, A., Marchegiani, D., Pardi, D., Contento, S., Pardi, D., Girardi,F., et al. (2009). Evaluation of functional phytochemicals in destinedvirgin olive oil. Food and Bioprocess Technology, 2, 322–327.
Regulation (EEC) (1991) No 2568/91 on the characteristics of oliveoil and olive-pomace oil and on the relevant methods of analysis,from the Commission, from 11 July of the year 1991.
Rencher, A. C. (1995). Methods of multivariate analysis. New York:Willey.
Romero, C., Brenes, M., García, P., García, A., & Garrido, A. (2004).Polyphenol changes during fermentation of naturally black olives.Journal of Agricultural and Food Chemistry, 52, 1973–1979.
Sabatini, N., Mucciarella, M. R., & Marsilio, V. (2008). Volatilecompounds in uninoculated and inoculated table olives withLactobacillus plantarum (Olea europaea, L., cv. Moresca andKalamata). LWT–Food Science and Technology, 41, 2017–2022.
Sabatini, N., Perri, E., & Marsilio, V. (2009). An investigation onmolecular partition of aroma compounds in fruit matrix and brinemedium of fermented table olives. Innovative Food Scence andEmerging Technologies, 10, 621–626.
Sakouhi, F., Harrabi, S., Absalon, C., Sbei, K., Boukhchina, S., &Kallel, H. (2008). α-Tocopherol and fatty acids contents of someTunisian table olives (Olea europea L.): changes in their composi-tion during ripening and processing. Food Chemistry, 108, 833–839.
Schröder, H. (2007). Protective mechanisms of the Mediterranean dietin obesity and type 2 diabetes. The Journal of NutritionalBiochemistry, 18, 149–160.
Sousa, A., Ferreira, I. C. F. R., Calhelha, R. C., Andrade, P. B.,Valentão, P., Seabra, R., et al. (2006). Phenolics and antimicro-bial activity of traditional stoned table olives “Alcaparras”.Bioorganic & Medicinal Chemistry, 14, 8533–8538.
Sousa, A., Ferreira, I. C. F. R., Barros, L., Bento, A., & Pereira, J. A.(2008). Effect of solvent and extraction temperatures on theantioxidant potential of traditional stoned table olives “Alcaparras”.LWT Food Science and Technology, 41, 739–745.
Ullrich, F., & Grosch, W. (1988). Identification of the most intenseodor compounds formed during autoxidation of methyl linolenateat room temperature. Journal of the American Oil Chemists’Society, 65(8), 1313–1317.
Ünal, K., & Nergiz, C. (2003). The effect of table olives preparingmethods and storage on the composition and nutritive value ofolives. Grasas y Aceites, 54, 71–76.
1742 Food Bioprocess Technol (2012) 5:1733–1742


![Booklet: [SCL163] Helicalin — Everyting So Stoned, Everything Is Bad](https://img.pdfslide.us/doc/110x75/568cadc91a28ab186dad2ae8/booklet-scl163-helicalin-everyting-so-stoned-everything-is-bad.jpg)