Embed Size (px)
Citation preview

Effect of correlated free fibre lengths on poresize distribution in fibrous mats
C.T.J. Dodson and W.W. Sampson
School of Mathematics and School of MaterialsUniversity of Manchester

Introduction
Free-fibre-lengths in random isotropic fibrous networks followexponential distributions. Corte and Lloyd used products ofexponential distributions to model pore statistics.
Dodson and Sampson used products of gamma distributions tomodel flocculation effects on pore statistics.
Here: model local density variations and anisotropy:Local correlation of free-fibre-lengths.

Isotropic and anisotropic random networks
Networks of 1500 1 mm fibres with centres randomly positionedin a square of side 1 cm.Left: uniform orientation. Right: preferential vertical orientation.

Approach
Bivariate distributions generate correlated free-fibre-lengths.Product variable yields simulated pore area distributions.
Bivariate lognormal distributions: arbitrary correlation.Bivariate gamma distributions: positive correlation.
Simulations using both types for: isotropic, anisotropic, random,flocculated. Obtain pore size and eccentricity statistics.
Isotropic correlated networks
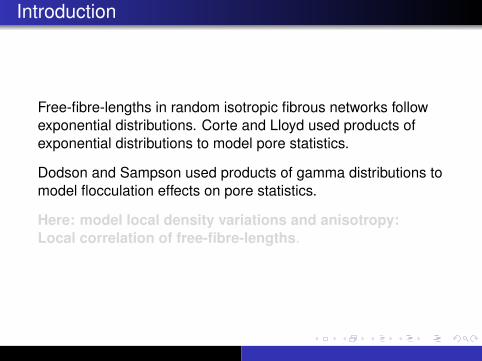
Lognormal free-fibre-length probability density
f (x) =1√
2 π σx xe− (µ−log(x))2
2 σ2x
mean x = eµ+σ2x /2 and CV (r) =
√eσ2
x − 1.So, log(r) ∼ Gaussian, mean log(r) = µ andCV (log(r)) = σ/µ.
Bivariate lognormal minor, major pore axes x , y yielddistribution of pore areas A = xy , with eccentricities:
ε =
√1−
(xy
)2

Isotropic correlated networks
Lognormal free-fibre-length probability density
f (x) =1√
2 π σx xe− (µ−log(x))2
2 σ2x
mean x = eµ+σ2x /2 and CV (r) =
√eσ2
x − 1.So, log(r) ∼ Gaussian, mean log(r) = µ andCV (log(r)) = σ/µ.
Bivariate lognormal minor, major pore axes x , y yielddistribution of pore areas A = xy , with eccentricities:
ε =
√1−
(xy
)2

Isotropic correlated networks—lognormal pairs
Lognormally distributed pairs x , y via (X , Y ) = (log(x), log(y))from bivariate Gaussian:
g(X , Y ;σ(X ), ρ) =e
2 (X2+Y2−2 X Y ρ)+2 (X+Y ) (1−ρ) σ(X)2+(1−ρ) σ(X)4
4 (ρ2−1) σ(X)2
2 π√
(1− ρ2) σ(X )
Set x = y = 1, so
σ(X ) = σ(Y ) =
√log
(1 + CV (x)2
)log(x) = log(y) = X = Y = −σ(X )2
2,

Isotropic networks with correlated free-fibre-lengths
Bivariate lognormal with positive and negative correlation.Each family of pairs of x , y has CV (x) = CV (y) = 1.
ρ = -0.25
00
x
y
1 2 3 4 5 6 7 8
12345678ρ = -0.45
1 2 3 4 5 6 7 8
12345678
x
y
00
ρ = 0.25
00
xy
1 2 3 4 5 6 7 8
12345678 ρ = 0.9
00
x
y
1 2 3 4 5 6 7 8
12345678

Isotropic networks with correlated free-fibre-lengths
Correlation effects on mean pore eccentricity ε.‘Roundish’ pores have ε < 0.6.
ρP
ores
`rou
ndis
h'
Mea
n ec
cent
ricity
, ε
ε = 0.2
ε = 0.4
ε = 0.6
ε = 0.8
ε = 0.9
0.2
0.4
0.6
0.8
1.0
-1.0 -0.9 -0.8 -0.7 -0.6 -0.5 -0.4 -0.3 -0.2 -0.1 0 0.1 0.2 0.3 0.4 0.5 0.6 0.7 0.8 0.9 1.0�
CV(x) = 0.5
CV(x) = 0.7
CV(x) = 0.9
CV(x) = 1
CV(x) = 1.1
CV(x) = 1.3

Isotropic networks with correlated free-fibre-lengths
Standard deviation of pore eccentricity vs mean eccentricity
Mean eccentricity, ε
Sta
ndar
d de
viat
ion
of e
ccen
trici
ty, σ
(ε)
Increasing ρ
CV(x) = 0.5CV(x) = 0.7CV(x) = 0.9CV(x) = 1CV(x) = 1.1CV(x) = 1.3
0.00
0.05
0.10
0.15
0.20
0.25
0.0 0.1 0.2 0.3 0.4 0.5 0.6 0.7 0.8 0.9 1.0

Isotropic networks with correlated free-fibre-lengths
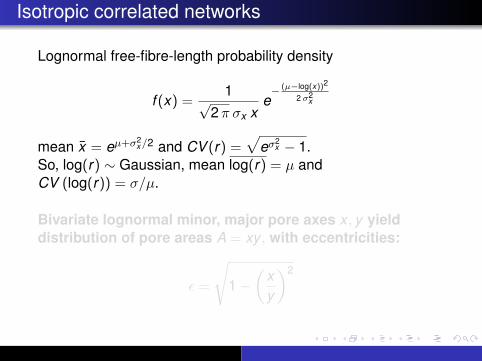
Mean pore radius and roundish fraction increase withcorrelation.
For high positive correlation, little influence of CV (x) :formation effect on mean pore size is weak.
Points on axis ρ = 0 represent existing models and they havegreater sensitivity to CV (x).
CV (x) = 1 approximates random network.

Isotropic networks with correlated free-fibre-lengths
Mean pore radius and roundish fraction increase withcorrelation.
For high positive correlation, little influence of CV (x) :formation effect on mean pore size is weak.
Points on axis ρ = 0 represent existing models and they havegreater sensitivity to CV (x).
CV (x) = 1 approximates random network.

Isotropic networks with correlated free-fibre-lengths
Correlation and formation effects on mean pore radius.CV (x) = 1 approximates random network.
0
0.1
0.2
0.3
0.4
0.5
0.6
0.7
0.8
0.9
1.0
-1.0 -0.9 -0.8 -0.7 -0.6 -0.5 -0.4 -0.3 -0.2 -0.1 0 0.1 0.2 0.3 0.4 0.5 0.6 0.7 0.8 0.9 1.0
Mean pore radius
CV(x) = 0.5CV(x) = 0.7CV(x) = 0.9CV(x) = 1CV(x) = 1.1CV(x) = 1.3
Correlation, ρ
Dependent correlation and anisotropy
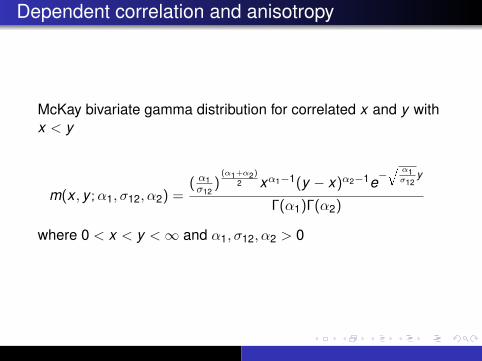
McKay bivariate gamma distribution for correlated x and y withx < y
m(x , y ;α1, σ12, α2) =( α1
σ12)
(α1+α2)
2 xα1−1(y − x)α2−1e−q
α1σ12
y
Γ(α1)Γ(α2)
where 0 < x < y <∞ and α1, σ12, α2 > 0
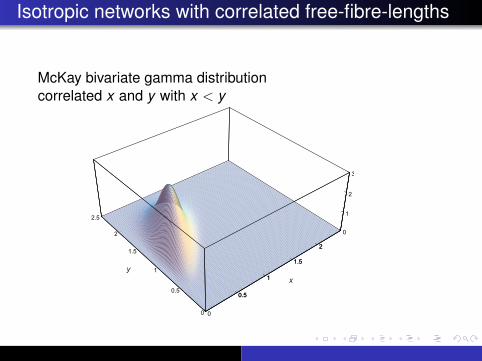
Isotropic networks with correlated free-fibre-lengths
McKay bivariate gamma distributioncorrelated x and y with x < y
0
0.5
1
1.5
2
0
0.5
1
1.5
2
2.5
0
1
2
3
0
0.5
1
1.5
2
yx
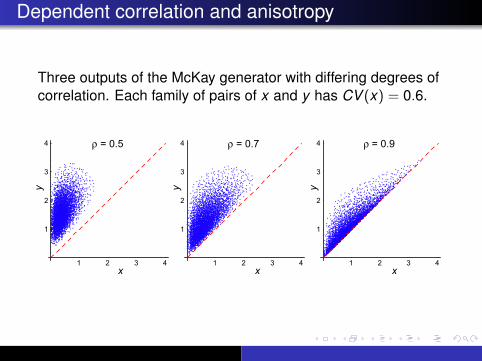
Dependent correlation and anisotropy
Three outputs of the McKay generator with differing degrees ofcorrelation. Each family of pairs of x and y has CV (x) = 0.6.
1 2 3 4
1
2
3
4
1 2 3 4
1
2
3
4
1 2 3 4
1
2
3
4
x x x
y y y
ρ = 0.5 ρ = 0.7 ρ = 0.9
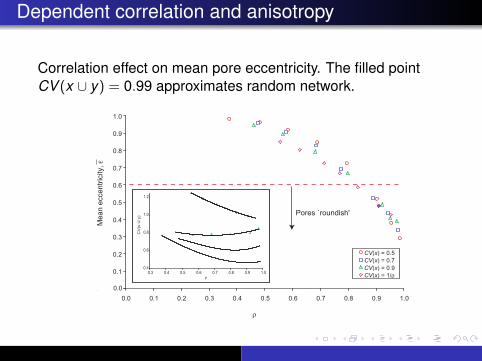
Dependent correlation and anisotropy
Correlation effect on mean pore eccentricity. The filled pointCV (x ∪ y) = 0.99 approximates random network.
0.1
0.2
0.3
0.4
0.5
0.6
0.7
0.8
0.9
1.0
0.0 0.1 0.2 0.3 0.4 0.5 0.6 0.7 0.8 0.9 1.0
CV(x) = 0.5CV(x) = 0.7CV(x) = 0.9CV(x) = 1/ρ
0.0
ρ
Pores `roundish'
Mea
n ec
cent
ricity
, ε
0.4
0.6
0.8
1.0
1.2
0.3 0.4 0.5 0.6 0.7 0.8 0.9 1.0
CV
(x U
y)
ρ

Dependent correlation and anisotropy
Standard deviation vs mean pore eccentricity. The filled pointCV (x ∪ y) = 0.99 approximates random network.
Mean eccentricity, ε
Sta
ndar
d de
viat
ion
of e
ccen
trici
ty, σ
(ε)
Increasing ρ
0.0
0.1
0.2
0.3
0.4
0.0 0.1 0.2 0.3 0.4 0.5 0.6 0.7 0.8 0.9 1.0
CV(x) = 0.5CV(x) = 0.7CV(x) = 0.9CV(x) = 1/ρ

Dependent correlation and anisotropy
Mean pore radius vs correlation. The filled pointCV (x ∪ y) = 0.99 approximates random network.
ρ
Mea
n po
re ra
dius
0.0
0.1
0.2
0.3
0.4
0.5
0.6
0.7
0.8
0.9
1.0
0.0 0.1 0.2 0.3 0.4 0.5 0.6 0.7 0.8 0.9 1.0
CV(x) = 0.5CV(x) = 0.7CV(x) = 0.9CV(x) = 1/ρ
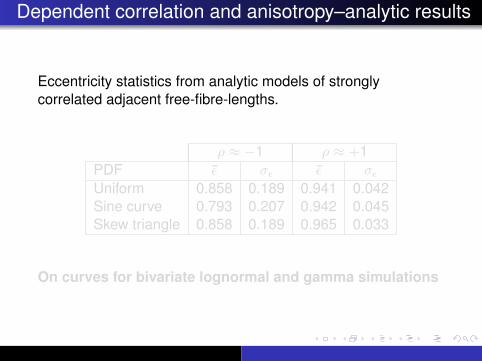
Dependent correlation and anisotropy–analytic results
Eccentricity statistics from analytic models of stronglycorrelated adjacent free-fibre-lengths.
ρ ≈ −1 ρ ≈ +1PDF ε σε ε σε
Uniform 0.858 0.189 0.941 0.042Sine curve 0.793 0.207 0.942 0.045Skew triangle 0.858 0.189 0.965 0.033
On curves for bivariate lognormal and gamma simulations

Conclusions
Pores seem ‘roundish’ because random isotropy has aninherent ‘ground-state’ positive local correlation offree-fibre-lengths.
Mean pore radius in random network may be reduced by20% with increased flocculation.
Mean pore eccentricity gives measure of the variability infree-fibre-length distributions not due to local correlation.